Article

A Multi-Product and Multi-Period Inventory Planning Model to Optimize the Supply of Medicines in a Pharmacy in Barranquilla, Colombia

by
Katherinne Salas-Navarro
1,*,
Jousua Pardo-Meza
1,
Juan Torres-Prentt
1 and
Juan Rivera-Alvarado
2,*
1
Department of Productivity and Innovation, Universidad de la Costa, Street 58 55-66, Barranquilla 080002, Colombia
2
Facultad de Administración y Negocios, Universisdad Simón Bolivar, Avenue 59 59-65, Barranquilla 080002, Colombia
*
Authors to whom correspondence should be addressed.
Logistics 2025, 9(4), 151; https://doi.org/10.3390/logistics9040151
Submission received: 17 July 2025 / Revised: 8 September 2025 / Accepted: 19 September 2025 / Published: 21 October 2025
(This article belongs to the Section Humanitarian and Healthcare Logistics)

Abstract

Background: Supply chains in pharmaceutical industry encounter constant challenges in balancing the availability of medicine with cost efficiency, particularly in developing regions with limited storage capacity, as regulatory constraints increase operational complexity. Methods: This research focuses on developing a multi-product, multi-period inventory planning model designed to optimize the supply process for a pharmacy located in Barranquilla, Colombia. The methodology involves conducting field studies within the pharmaceutical sector, which includes regular visits to pharmacies, interaction with employees, and analysis of historical data collected over a 16-month period. Results: The primary goal is to minimize costs while ensuring that products remain available to customers, considering various internal and external factors. Several scenarios will be examined to evaluate different alternatives for enhancing the supply process. Initial findings suggest that the proposed model could reduce inventory planning costs by approximately 15.78% by classifying antibiotics, which in turn leads to better resource utilization and improved order management. Conclusions: The proposed model minimizes the inventory planning costs associated with antibiotic management, ultimately leading to improved resource utilization and more accurate order management.

1. Introduction

Efficient inventory management is a critical challenge for companies in various sectors, especially for the pharmaceutical sector, where it is essential to maintain a constant flow of medicines available to meet customer demand [1]. Excessive inventory can lead to high storage costs, while insufficient inventory can lead to stockouts and lost sales, affecting both the company and its customers [2,3]. This problem is exacerbated under uncertain demand conditions, where product demand variability can make planning and controlling inventory levels challenging [4].
In this context, the central problem this research addresses is the difficulty of efficiently managing inventories under uncertain demand, which can lead to high costs, stockouts, and loss of profitability.
A case study in a pharmaceutical company aims to evaluate the effectiveness of the proposed model and determine whether it enables improved inventory management under conditions of uncertain demand. The basis of the problem is that in healthcare and pharmaceutical contexts, uncertainty in demand, supply delays, and product perishability can generate severe consequences, from high costs and waste to shortages that compromise patient safety [1,4]. This complexity increases when inventory is managed as a multi-period problem, since decisions in one period directly affect future stock levels, holding costs, and service performance, making dynamic and adaptive models necessary [5,6]. Additionally, the impact of time variations—such as seasonal fluctuations in demand, uncertain lead times, and time-dependent costs caused by inflation, obsolescence, or perishability—further complicates inventory planning [3,7]. These limitations highlight a research gap, underscoring the need for models that extend the inventory planning model into multi-period, time-sensitive, and uncertainty-aware approaches to balance cost efficiency with service reliability [8,9].
The main objective of this research is to develop a multi-product, multi-period inventory planning model that optimizes inventory management in a pharmacy. To achieve this objective, it is necessary to study and analyze each stage of the drug supply process to build a mathematical model. The analysis of this model enables the creation of strategies that offer various benefits, such as reducing storage costs, avoiding stockouts, and improving product availability, thereby contributing to more efficient and profitable inventory management. The study contributes to existing literature by validating a real-world case study using field data. It incorporates scenario-based analysis to account for various operational conditions, highlighting the significance of integrating operational efficiency with service reliability in pharmacy supply chains.
This article is structured as follows: Section 2 incorporates a literature review, which reports on the role played by the pharmaceutical industry. It also presents various models used to optimize its processes and different statistical tools that can be complemented with the models to develop a better study. Section 3 presents the detailed mathematical model for optimizing the pharmacy’s medicine supply. Section 4 presents the corresponding materials and methods for collecting relevant data that may be useful in developing the mathematical model. Section 5 presents the results yielded by the IBM ILOG CPLEX Optimization Studio, Version 22.1.1.0, including the suggested budget capacity, improved planning for orders placed by periods, and the quantity of products needed to order. Section 6 presents the discussion where the results will be analyzed and compared with the decisions made before the study. Finally, Section 7 contains the conclusion of the study.

2. Literature Review

The pharmaceutical industry plays a crucial role in the economic development and social well-being of any community. Healthcare systems aim to provide patients with appropriate care and treatment [1]. To achieve this, the pharmaceutical supply chain within the healthcare system must be effective and efficient.
The medication supply process in healthcare institutions is crucial as it directly impacts service quality, operating costs, and the availability of supplies for patient care. Research shows that many issues in this area stem from supply chain deficiencies [10,11]. The pharmaceutical supply chain has grown increasingly complex, involving multiple stakeholders, including manufacturers, wholesalers, distributors, customers, information service providers, and regulatory agencies [5]. Consequently, any disruption in this supply chain can lead to significant crises [3].
One of the primary challenges in pharmacy services is stock management, which complicates the supply chain [5,7,12,13]. This issue arises from various factors, including demand uncertainty and delivery delays [2]. A major contributing factor is the tendency to maintain high inventory levels, creating a false sense of security regarding the ability to meet customer demand, prevent stockouts, and secure bulk purchase discounts. However, this approach can be problematic as it leads to elevated costs and, if not managed properly, may adversely impact patient health.
Improving the performance of the pharmaceutical industry supply chain is becoming increasingly essential as organizations strive to achieve customer satisfaction at a lower cost. Logistics enables hospitals to maintain a good circulation of pharmaceutical products, reduce stock, minimize waste, and provide more accurate inventory tracking [14]. Given the performance improvements in the supply chain, numerous studies offer relevant recommendations to address the root causes of supply chain issues and pharmaceutical inventory management problems in the healthcare industry [1]. Pharmaceutical supply chain management requires effective inventory control plans and stakeholder alignment.
In this context, the pharmaceutical industry has also sparked the interest of scholars from various disciplines, including chemistry, engineering, and environmental sciences [15], as well as researchers in developing and implementing methodologies to address pharmaceutical supply chain problems. Most researchers focus on optimization model methodologies [16]. Mathematical models are essential for evaluating and identifying key metrics that measure potential outcomes in target transformation situations. They can also be modified to generate effective solutions. A mathematical model of the supply chain should enable an analytical assessment of both its current state and alternative scenarios. It includes examining its structural and behavioral characteristics in response to changes in patient needs, market demands, and resource availability. From a practical perspective, future pharmaceutical supply chain models should be designed to predict and meet patient demand accurately.
A study developed two mathematical models that were considered using real data and simulated scenarios within a pharmacy-hospital context, specifically addressing demand uncertainties [9]. The first model focuses on determining replenishment dates over a specified planning horizon, resulting in cost reductions. In contrast, the second model identifies acceptable expiration dates, which helps the hospital minimize the number of expired medications and optimize inventory levels. Additionally, a simulation model was developed to assess supply chain costs in Colombian hospitals [17]. This model was adapted and validated using real data from the clinic to represent the final cost behavior of medications accurately. The research determined that the final cost of medications varies and is influenced by several factors.
Some models include multimodal transportation to optimize various aspects of pharmaceutical production and distribution, including allocation, ordering, stock management, and transportation [10]. This approach enhances supply chain management, leading to increased patient satisfaction. Additionally, a study has introduced a model and a heuristic method for addressing supply chain issues, which can reduce both the total costs and delivery times of pharmaceutical supplies to hospitals and pharmacies while improving the reliability of the transportation system [18]. Furthermore, due to the rising demand for medications during the pandemic, accurately forecasting drug demand is crucial for minimizing costs, ensuring timely patient service, and preventing drug shortages.
Other studies address the location-inventory problem, with a specific focus on pharmacies. Both studies aim to develop a mathematical model that simultaneously addresses both problems, thereby increasing patient accessibility and improving operational efficiency and patient care [18,19,20,21]. Another research study develops a mathematical optimization model to design a pharmaceutical supply chain that considers drug corruption, considering three key objectives: economic, social, and environmental. A fuzzy programming approach is used to solve the developed model. Numerical evidence from a case study shows that the suggested model is effective and valid.
A period-based dynamic programming model considers stochastic demand [22]. The model is first solved as a mixed-integer linear programming model in Lingo, and then a genetic algorithm (GA) approach is proposed for large-scale problems. This critical study enables managers to make informed decisions about maintaining the optimal quantity of items in their warehouses, thereby utilizing their budgets more efficiently.
A bi-objective mixed integer linear programming model was developed to design a perishable pharmaceutical supply chain network under demand uncertainty, simultaneously minimizing the total network cost and the amount of lost demand [7]. Similarly, a bi-objective mixed-integer linear programming model was constructed to manage a hospital’s pharmaceutical supply chain, aiming to reduce the total cost of obtaining drugs from multiple suppliers and selecting the most appropriate source [23]. Using real-world data, the results obtained from model implementations and sensitivity analysis confirm the efficiency and validity of the suggested mathematical model and solution strategy.
A two-level stochastic mathematical model is proposed for optimizing inventory and allocation over multiple periods in a multi-tier supply chain network [24]. This model addresses uncertainties in demand and incorporates multiple sourcing characteristics, aiming to maximize the total expected profit of the supply chain network. Consequently, this approach enhances the efficiency of the linear approximation of the reorder point policy at the strategic level, leading to robust design solutions in the face of uncertainty.
A proposed multi-layer collaborative pharmaceutical supply chain comprises a central pharmacy and multiple regional pharmacies and hospitals [25]. This system is modeled using a multi-period, multi-product stochastic mathematical approach to minimize drug inventory management costs, including shortages and holding costs. Similarly, a study on a multi-stage Tunisian pharmaceutical supply chain, including a central pharmacy, regional pharmacies, and several hospitals, presents two mathematical models to reduce costs [26]. In the first model, the optimization focuses solely on information sharing between the central and regional pharmacies. The second model expands this information sharing to include all supply chain members. Numerical results from the study demonstrate how information sharing can lead to significant cost savings.
A multi-objective model that simultaneously considers cost minimization, environmental impact minimization, and service level equity maximization was used [27]. The study offers practical insights for optimizing pharmaceutical supply chains by balancing economic efficiency with social responsibility to navigate disruptions and challenges successfully. Additionally, a study developed an innovative simulation and optimization system for pharmacy inventory management, using an empirical allocation approach to model demand [28]. The system was implemented in October 2011 across all Kroger pharmacies in the United States, resulting in increased revenue, reduced inventory, and reduced labor costs for the organization.
One of the most widely used methodologies is the ABC system, which categorizes products based on their economic value or cost impact. Additionally, it is complemented by various approaches, such as lean manufacturing and Kanban, which classify products according to their medical significance or relevance in patient treatment, leading to improved outcomes. The ABC classification method was utilized to assess medication usage within a specific year, while mixed integer linear programming was employed to minimize the cost of managing medication inventory [29]. The study identified 50 types of medications categorized as group A out of 526 medicines in the hospital. Additionally, the study compares the outcomes of two mathematical models: one that takes medication expiration into account and another that does not.
A systematic categorization using ABC and VED analysis was developed for the medications available at a Dermatology Hospital from 2016 to 2020 [30]. The results indicated that Category I medications, the most costly and essential for annual revenue, accounted for only 88% of the total expenses. In contrast, Category II and III medications comprised 5% to 10% and less than 5% of the overall costs, respectively. It is essential to utilize these medications effectively. This analytical method has proven to be a valuable tool for decision-making regarding importing and stockpiling. ABC and VED analyses were conducted in an Indian pharmacy to identify items that required strict management control [31]. The consumption and annual expenditure for each item in the pharmacy during the years 2007 and 2008 were examined. Inventory control techniques were applied, resulting in the following categories: I, II, and III, which showed 4.21%, 22.23%, and 3.56% of the total annual expenditure on medicines, respectively.
Several researchers have implemented the Kanban system, a workflow management method that assists organizations in managing and enhancing work processes, ensuring efficient inventory transportation between cells or facilities, and optimizing inventory management to improve overall workflow efficiency. Some research implemented a Kanban system within a multi-layer pharmaceutical supply chain, presenting how a Kanban system could manage pharmaceutical inventory and enhance information sharing across a multi-tier supply chain [2,3]. Similarly, a study implemented the Kanban system based on ABC analysis to improve inventory management in a supply chain suffering from inadequate inventory practices [32]. The study utilized monthly data collected over a year to conduct the ABC analysis, enabling a thoughtful consideration of the elements to be included in the Kanban system. The results of this analysis indicated an impressive reduction in inventory-related costs of approximately 75%. However, applying this approach in practice is crucial to validate its effectiveness.
The literature review reveals that pharmaceutical supply chains face several challenges, including demand uncertainty, delivery delays, high holding costs, and perishability of products. Many mathematical models have considered cost reductions, reduced waste, and improved service levels. Some studies incorporate ABC and VED classification, lean practices, and Kanban systems to improve inventory control. Then the integration of optimization models with practical tools enhances inventory management, ensuring the availability of medicine, patient satisfaction, and operational efficiency.

3. Problem Definition

A mixed integer programming mathematical model is developed to represent the drug inventory planning problem. The model defines the decision variables, the operating cost minimization objective function, and capacity, budget, and demand constraints.

3.1. Assumptions

The following assumptions are considered in the multi-product and multi-period inventory planning model:
i.
A mixed-integer linear model is formulated to minimize the total costs associated with inventory planning.
ii.
The inventory planning model considers ordering costs and holding costs for each period.
iii.
The demand for each product is deterministic and known.
iv.
The facility has a limited maximum storage capacity, and inventory holding costs are incurred per unit for each period.
v.
The facility must maintain a minimum quantity of products in stock, including both inventory and outstanding orders.
vi.
The facility has a total budget assigned for purchasing products.
vii.
The proposed model contains decision variables, including the order quantity of products for each specified period, a binary variable that indicates whether the facility will place orders during a given period, and the inventory levels of products for each respective period. This framework aims to facilitate more informed decision-making and enhance operational efficiency.

3.2. Notation

3.2.1. Sets

i  products, i     1,2 , 3 I
j  periods, j     1,2 , 3 J

3.2.2. Parameters

C i j    Purchasing cost per unit for the product i during period j
S j     Ordering cost during period j
v i j    Inventory holding cost per unit for the product i during period j
D i j    Demand for product i during period j
C    Total budget available for product purchases
V i j    Maximum storage capacity for the product i during period j
l m i Minimum quantity of the product i  at the end of period j

3.2.3. Decision Variables

X i j    Order Quantity of the product i during period j
Y j     Binary decision variable that is 1 if orders are placed in period j
I i j    Inventory level of the product i at the end of period j

3.3. Mathematical Model

The objective function defined in Equation (1) aims to minimize the total costs associated with inventory planning. These costs include the purchase cost of product i , ordering costs, and holding costs for each period j . Equation (2) presents the inventory balance constraint at the end of each period, considering the initial inventory, the quantities ordered and the demand. Equation (3) specifies that the total purchasing cost must not exceed the available budget C . Equations (4) and (5) detail the constraints imposed by the maximum storage capacity that must be considered when placing orders in period j . Equation (6) includes the minimum quantity of products i that must be maintained in stock during each period j . Equation (7) contains the non-negative constraint for the variables X i j and I i j and Equation (8) presents the constraint of binary variable for Y j .
Z m i n = i = 1 m j = 1 n C i j X i j + i = 1 m j = 1 n S j Y j + i = 1 m j = 1 n v i j I i j
Subject to
I i , j 1 + X i j D i j = I i j     i = 1 , m ,   j = 1 , , n , j > 1  
i = 1 m j = 1 n C i j X i j C  
i = 1 m j = 1 n X i j V i j Y j      i = 1 , m ,   j = 1 , , n
I i j + X i j   V i j     i = 1 , m ,   j = 1 , , n  
I i j + X i j   l m i   i = 1 , m ,   j = 1 , , n
X i j , I i j   0  
Y j   0,1     j = 1 , n

4. Case Study

The mathematical inventory planning model was validated in a pharmacy in Barranquilla, Colombia, using a dataset collected over 16 months. This data was used to enhance medication inventory planning in healthcare institutions, specifically within the pharmacy department.

Inventory Planning Diagnosis in a Pharmacy in Barranquilla, Colombia

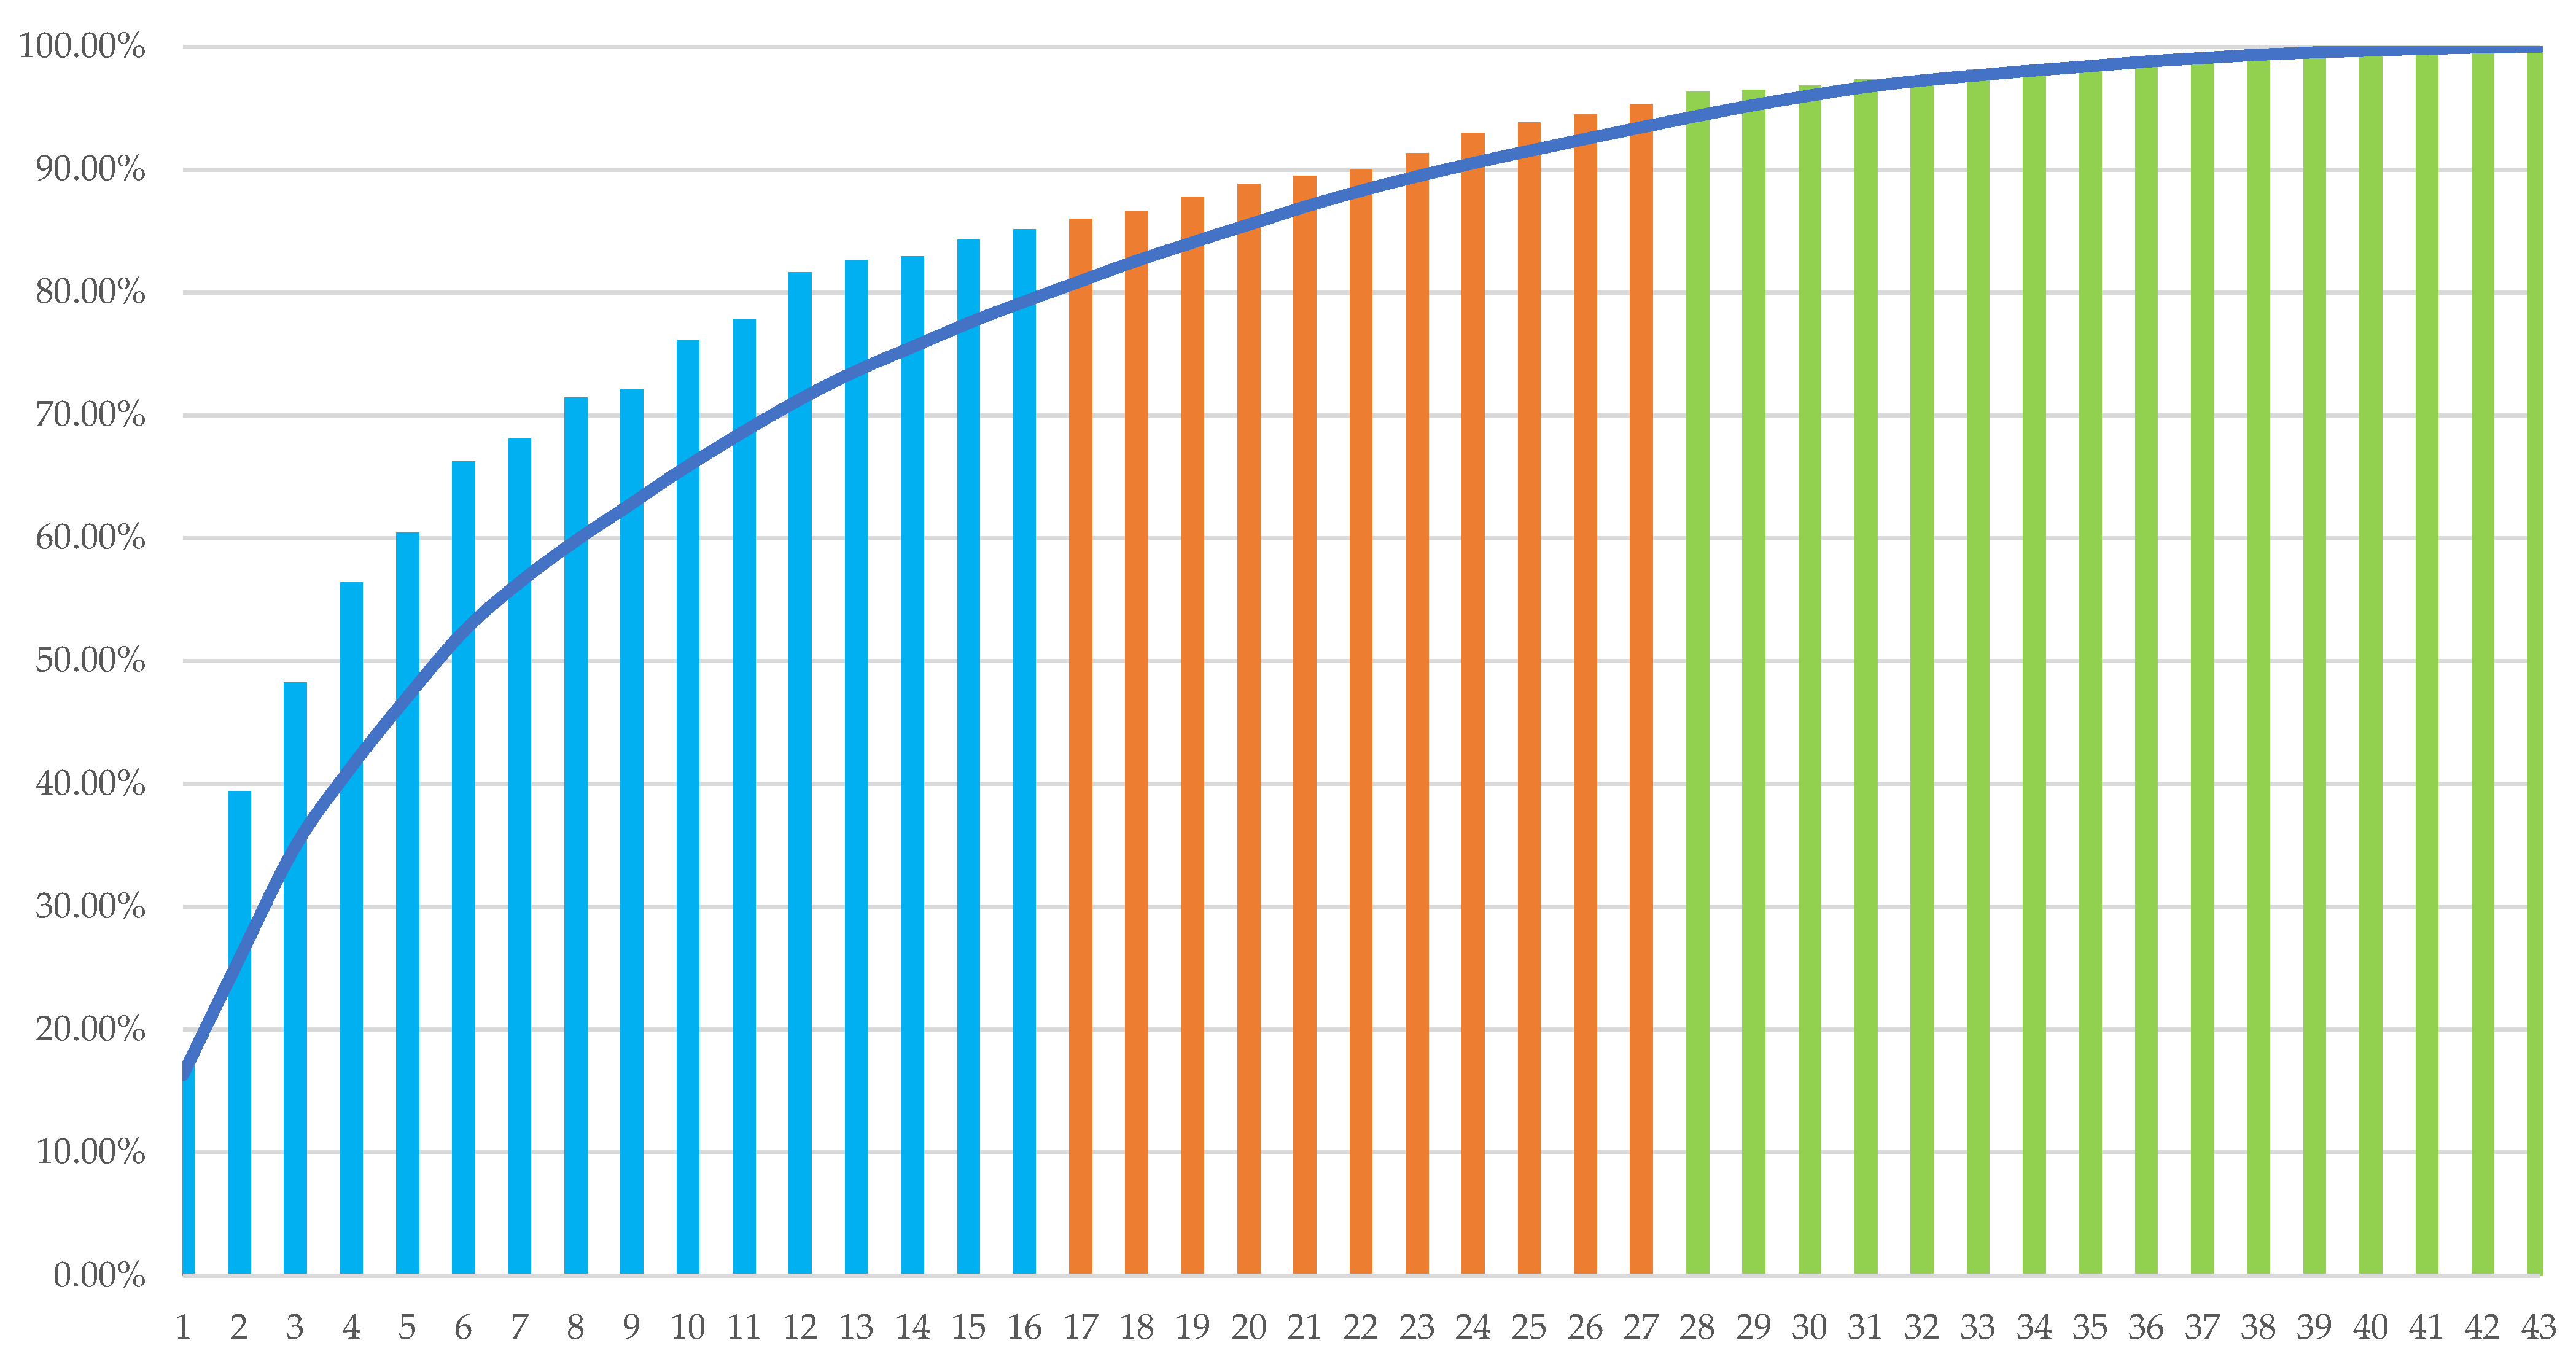
A diagnosis of the current supply and inventory planning conditions at a pharmacy in Barranquilla was conducted. Relevant data, including inventory history, demand, and costs, were collected, and interviews were held with the staff involved. Data analysis tools, specifically Excel, were used to examine the collected information, identify patterns and trends, and pinpoint areas for improvement. One of the statistical methods employed for data analysis was ABC analysis, which categorizes medications based on their importance in terms of value and consumption, enabling prioritized inventory management efforts. Table 1 presents the inventory classification for the antibiotics category using the ABC methodology. A total of 43 types of antibiotics sold at the pharmacy were considered, followed by an analysis of the quantity of products sold. Finally, the ABC inventory classification will be developed using this data to identify the products with the highest sales value over a selected 16-month period.
Figure 1 shows a Pareto chart illustrating the distribution of 43 medicines in the antibiotic category, categorized by their impact on demand and total cumulative cost. The horizontal axis lists the medications, while the vertical axis shows the cumulative percentage, ranging from 0% to 100%. The blue bars represent the first 16 medications, which account for approximately 80% of the total cost and are the most significant economically. The orange bars indicate the following 11 medications, which are highly in demand, although not the most expensive. Finally, the green bars correspond to the last 15 medications, which have a low impact on costs and demand. The curved black line illustrates the cumulative percentage of the total cost, demonstrating the Pareto principle (80/20). This visual representation helps identify key products for strategic decision-making in inventory management and cost control.
The ABC classification is used to select the products categorized in Zone A for further study, as these products are considered more relevant. The unit costs are presented in Table 2, while storage costs are shown in Table 3. Table 4 contains data on the number of units sold in the antibiotics category by the pharmacy over 16 months. Maximum and minimum capacities for each product can be found in Table 5 and Table 6, respectively. These tables provide the necessary data to develop the mathematical model.

5. Results

The proposed mixed integer linear programming model was solved using IBM ILOG CPLEX Optimization Studio V20.1 and executed on an Acer PC with an 11th-generation Intel® Core™ i5-11400H processor with 2.70 GHz and 24.0 GB of RAM, with a solution time of 0.25 s. An analysis of the results obtained from the software confirms that the strategy is effective in achieving the desired outcome of minimizing the monthly budget capacity. Before implementing the software, the pharmacy’s budget was set at COP 5,000,000. After execution, the software indicates a reduction in monthly budget capacity by approximately 39.58%, bringing the new cost to COP 3,020,533. The budget capacity provided by the software can be attained by following specific strategies, such as determining which months are optimal for placing orders and which months are not advisable. This information is summarized in Table 7. Additionally, Table 8 displays the number of recommended products that can be ordered, while Table 9 provides the inventory levels of products at the end of each period.
The results of the model indicate that the pharmacy should place orders during periods 9, 12, 15, and 16 (see Table 7). The pharmacy does not place orders in periods 1–8, 10–11, and 13–14. Figure 2 illustrates the quantity of products that the pharmacy should order in these specific periods: 9, 12, 15, and 16.

6. Discussion

This section presents and analyzes the results obtained from the study, comparing the proposed approach with the one using the developed mathematical model. It focuses on the model’s computational behavior across three different scenarios, where specific parameters were modified to obtain the varying outcomes. Table 10 presents the budgetary capacities for each scenario being compared, along with the objective function for each one.
Scenario 1 examines a 15% increase in ordering costs resulting from longer drug delivery times, which are caused by inventory availability issues at pharmaceutical companies and drug distribution centers. The findings indicate that this increase in ordering costs does not affect the decision variables but results in total inventory management costs of COP 3,062,518, representing a 1.4% rise in inventory costs. Table 11 and Table 12 present the optimal results for the order quantity of products over the period and the inventory level of products by period for Scenario 1.
Scenario 2 considers a 10% reduction in storage costs resulting from the implementation of the best practices in organization and disposal, as well as a decrease in energy rates in the region, combined with government incentives. The total cost obtained for this scenario is COP 2,834,295, representing a 6.57% reduction from the initial costs. Table 13 and Table 14 present the optimal results for the order quantity of products over the period and the inventory level of products by period for Scenario 1.
In Scenario 3, a proposal is made to reduce the minimum batch sizes of medicines by 30% to lower the quantity of products held in inventory. Implementing this scenario results in a total cost of COP 2,608,870, which accounts for 15.78% of the initial total costs. Table 15 and Table 16 present the optimal results for the order quantity of products over the period and the inventory level of products by period for Scenario 1.

6.1. Comparison of Total Inventory Planning Cost

A comparative analysis is conducted to evaluate the decision made by the proposed model against the original results and the outcomes of three alternative scenarios. The aim is to identify which result leads to the most significant cost minimization. It is essential to note that the same model is applied across all scenarios. This model is designed to provide flexibility in estimating demand while preventing unnecessary orders. Table 10 presents the budgetary capacities for each scenario being compared, along with the objective function for each one. Additionally, Figure 3 displays a bar chart that illustrates the position of the objective function for each scenario. Among the scenarios, Scenario 3 achieves the most significant cost minimization, with a budgetary capacity result of COP 2,608,870, leading to a variance of −13.6%.
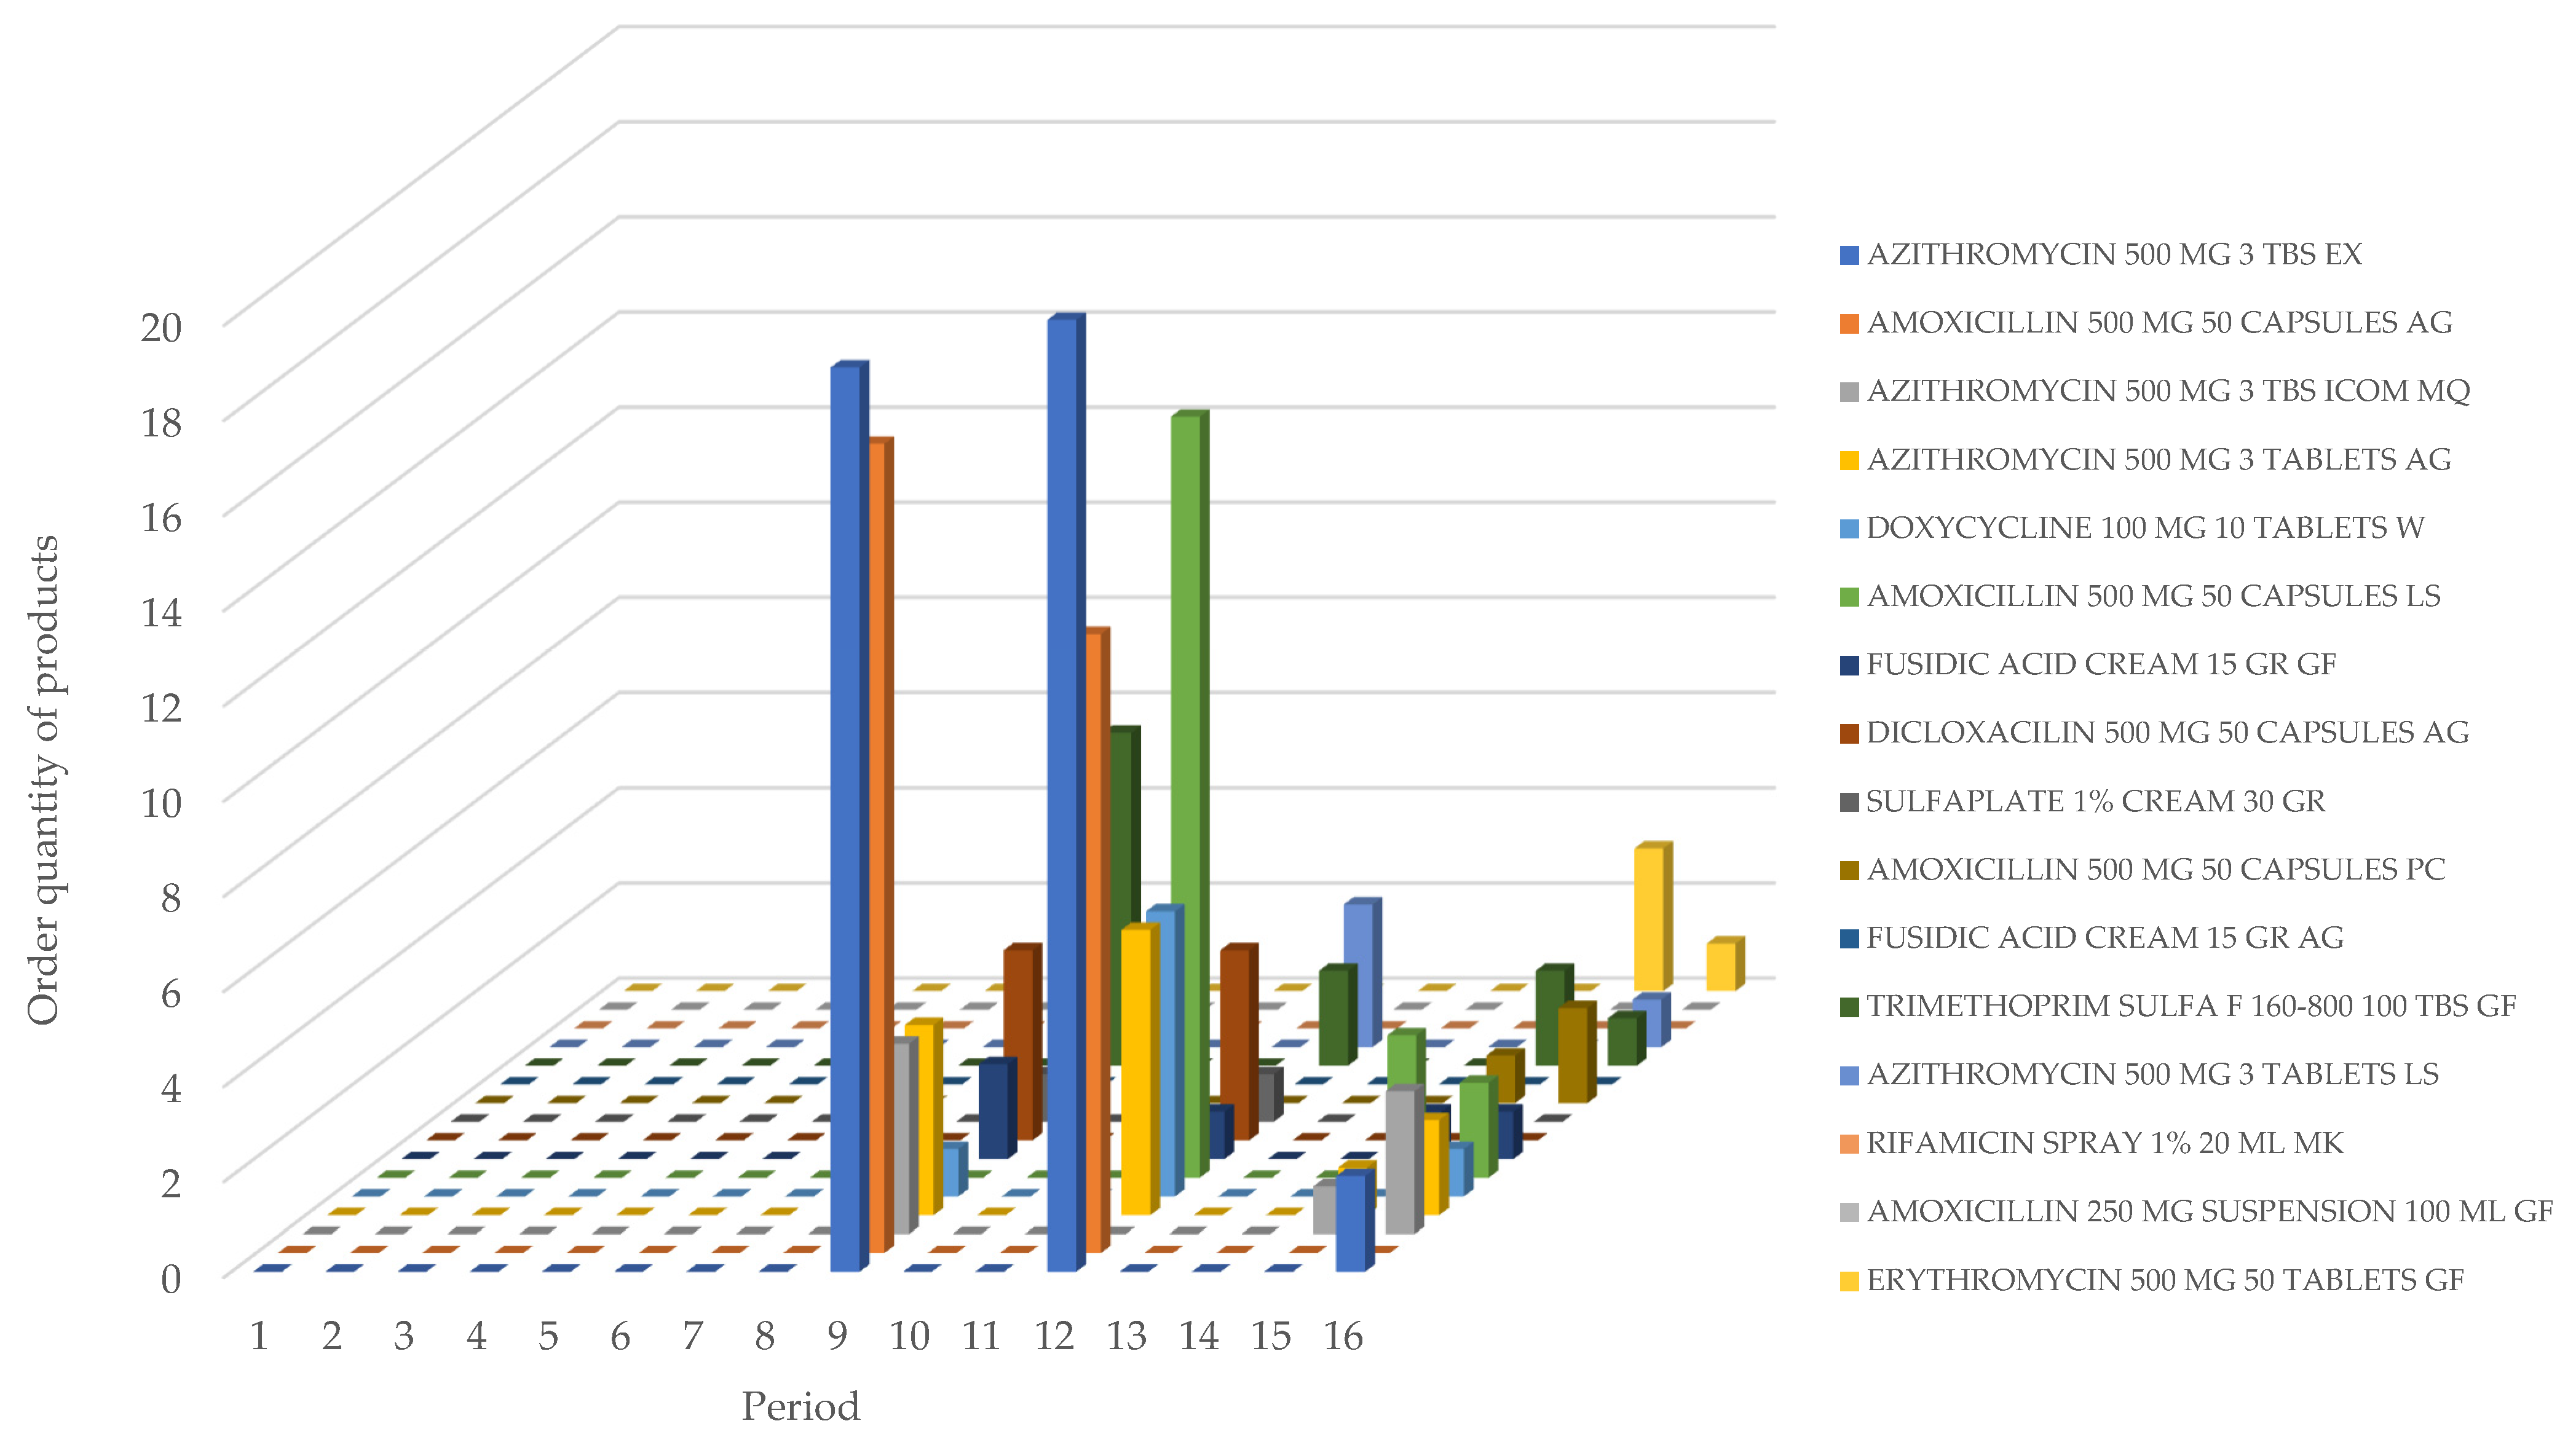
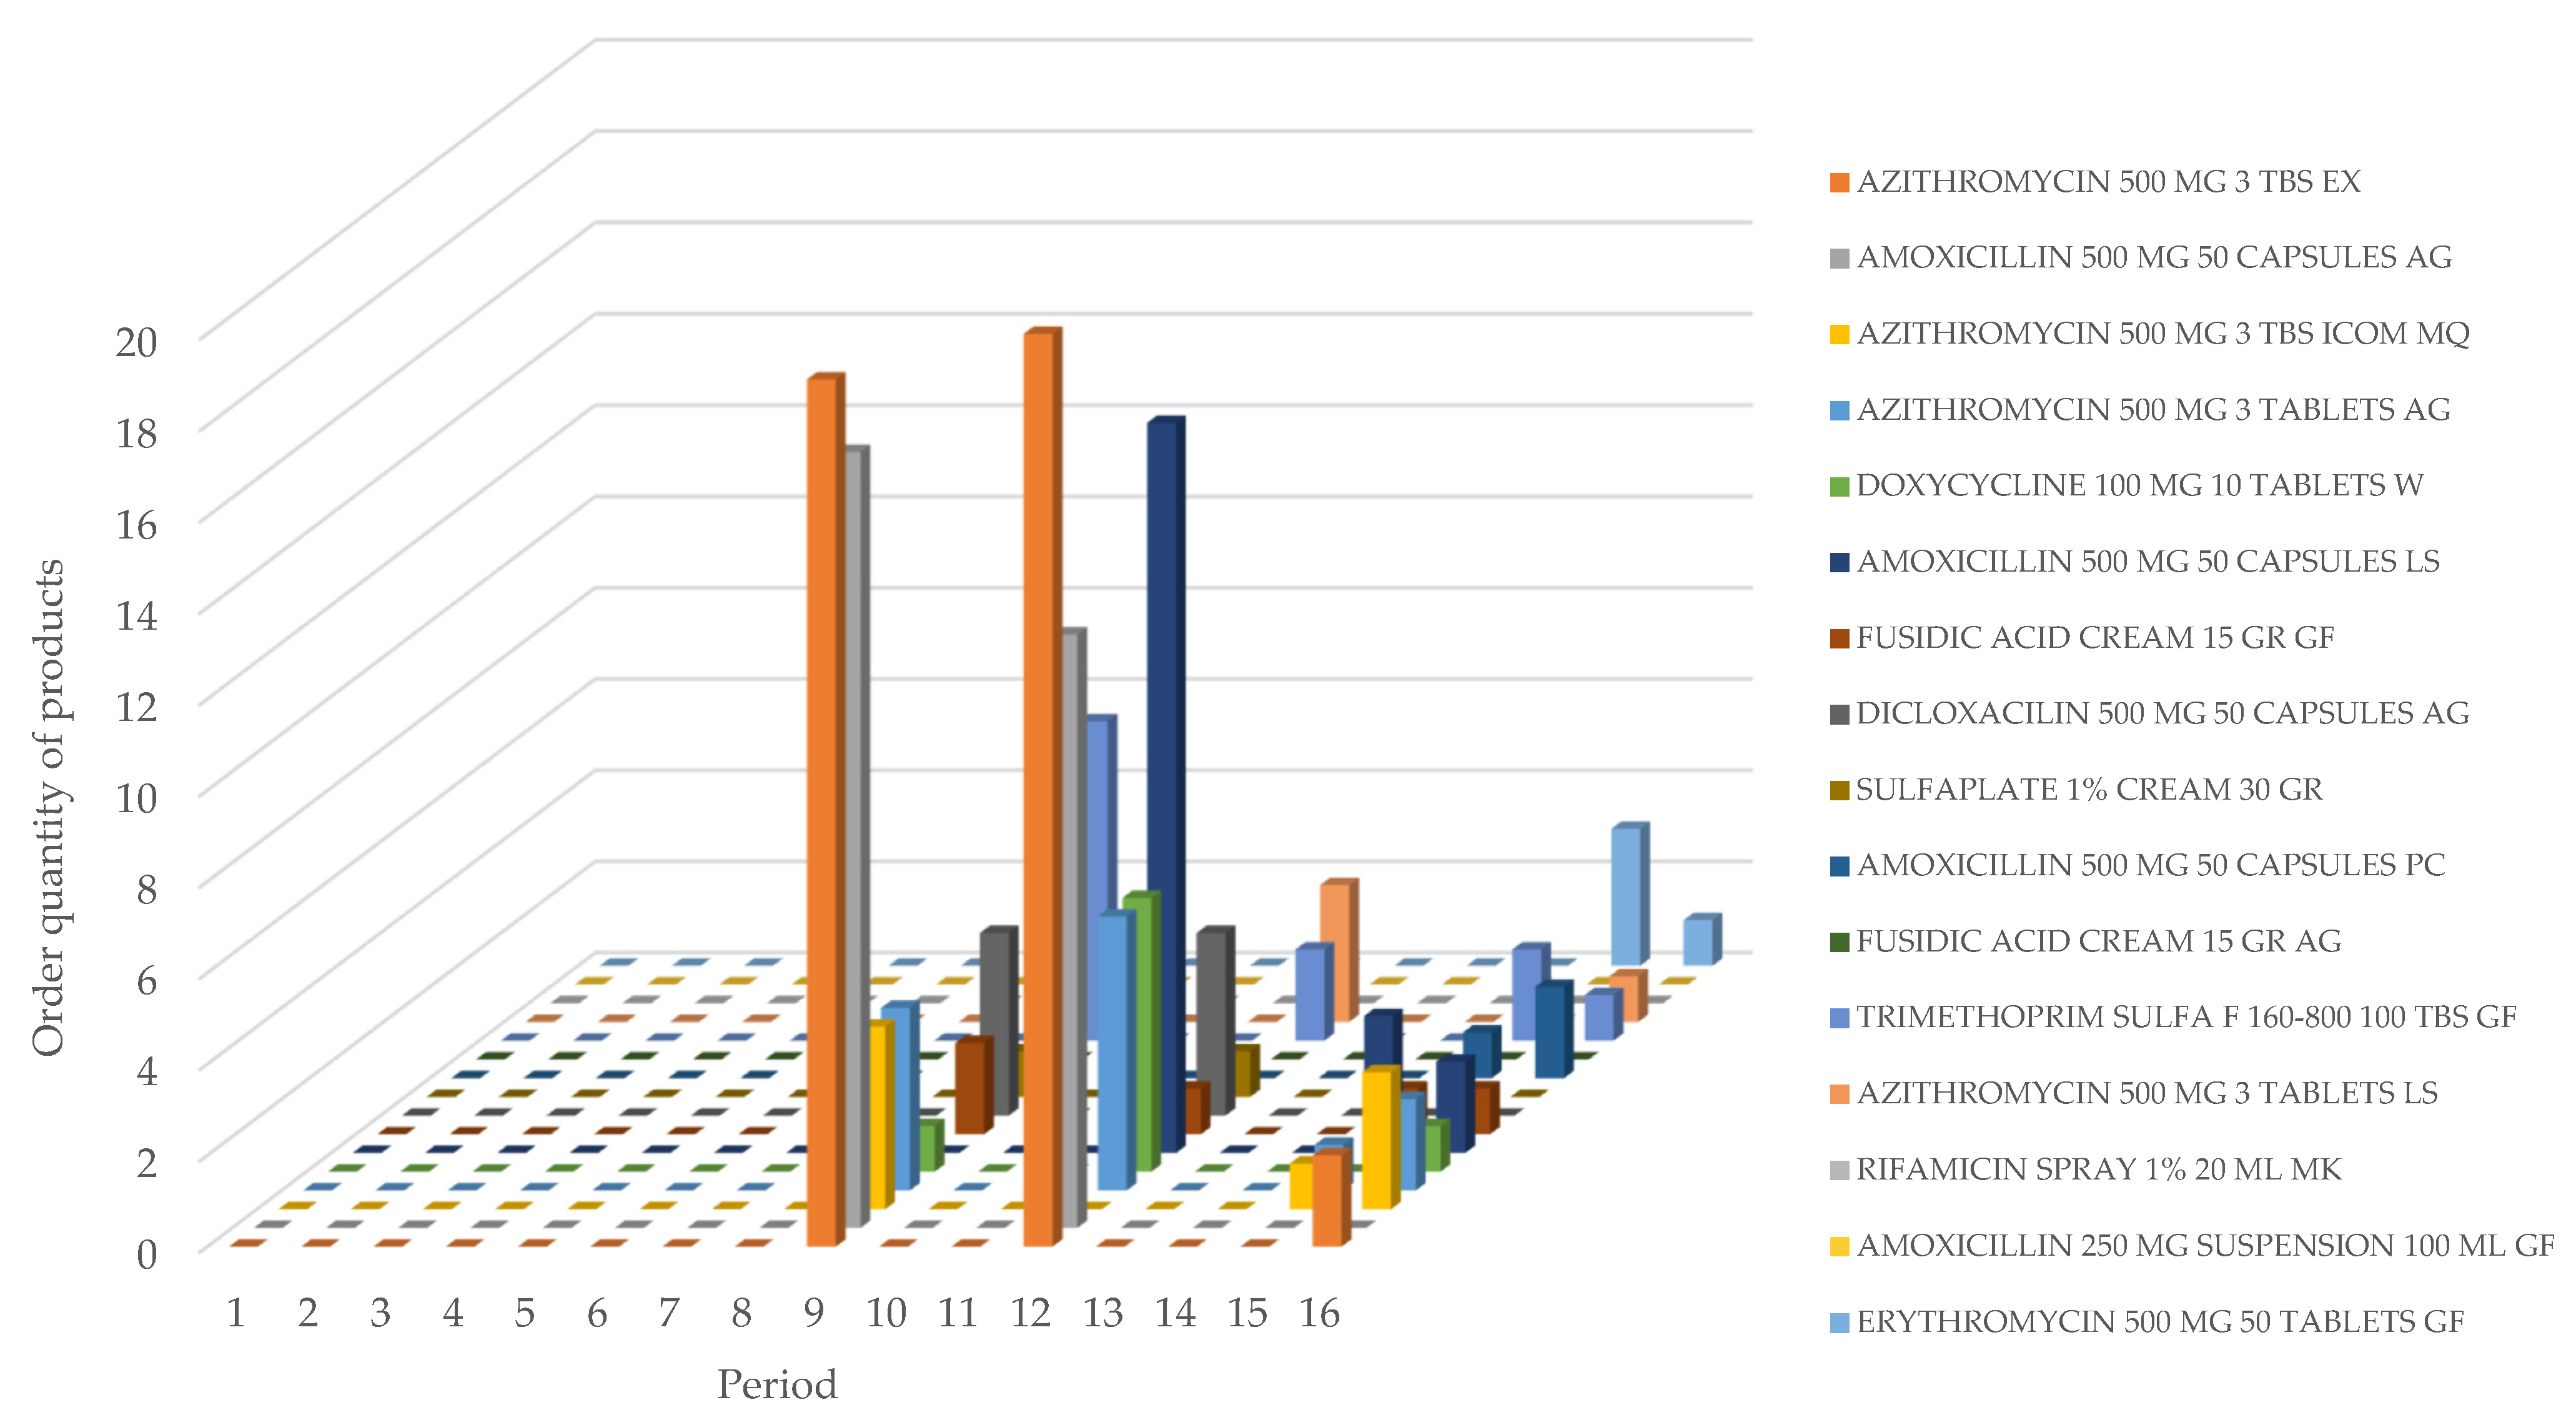
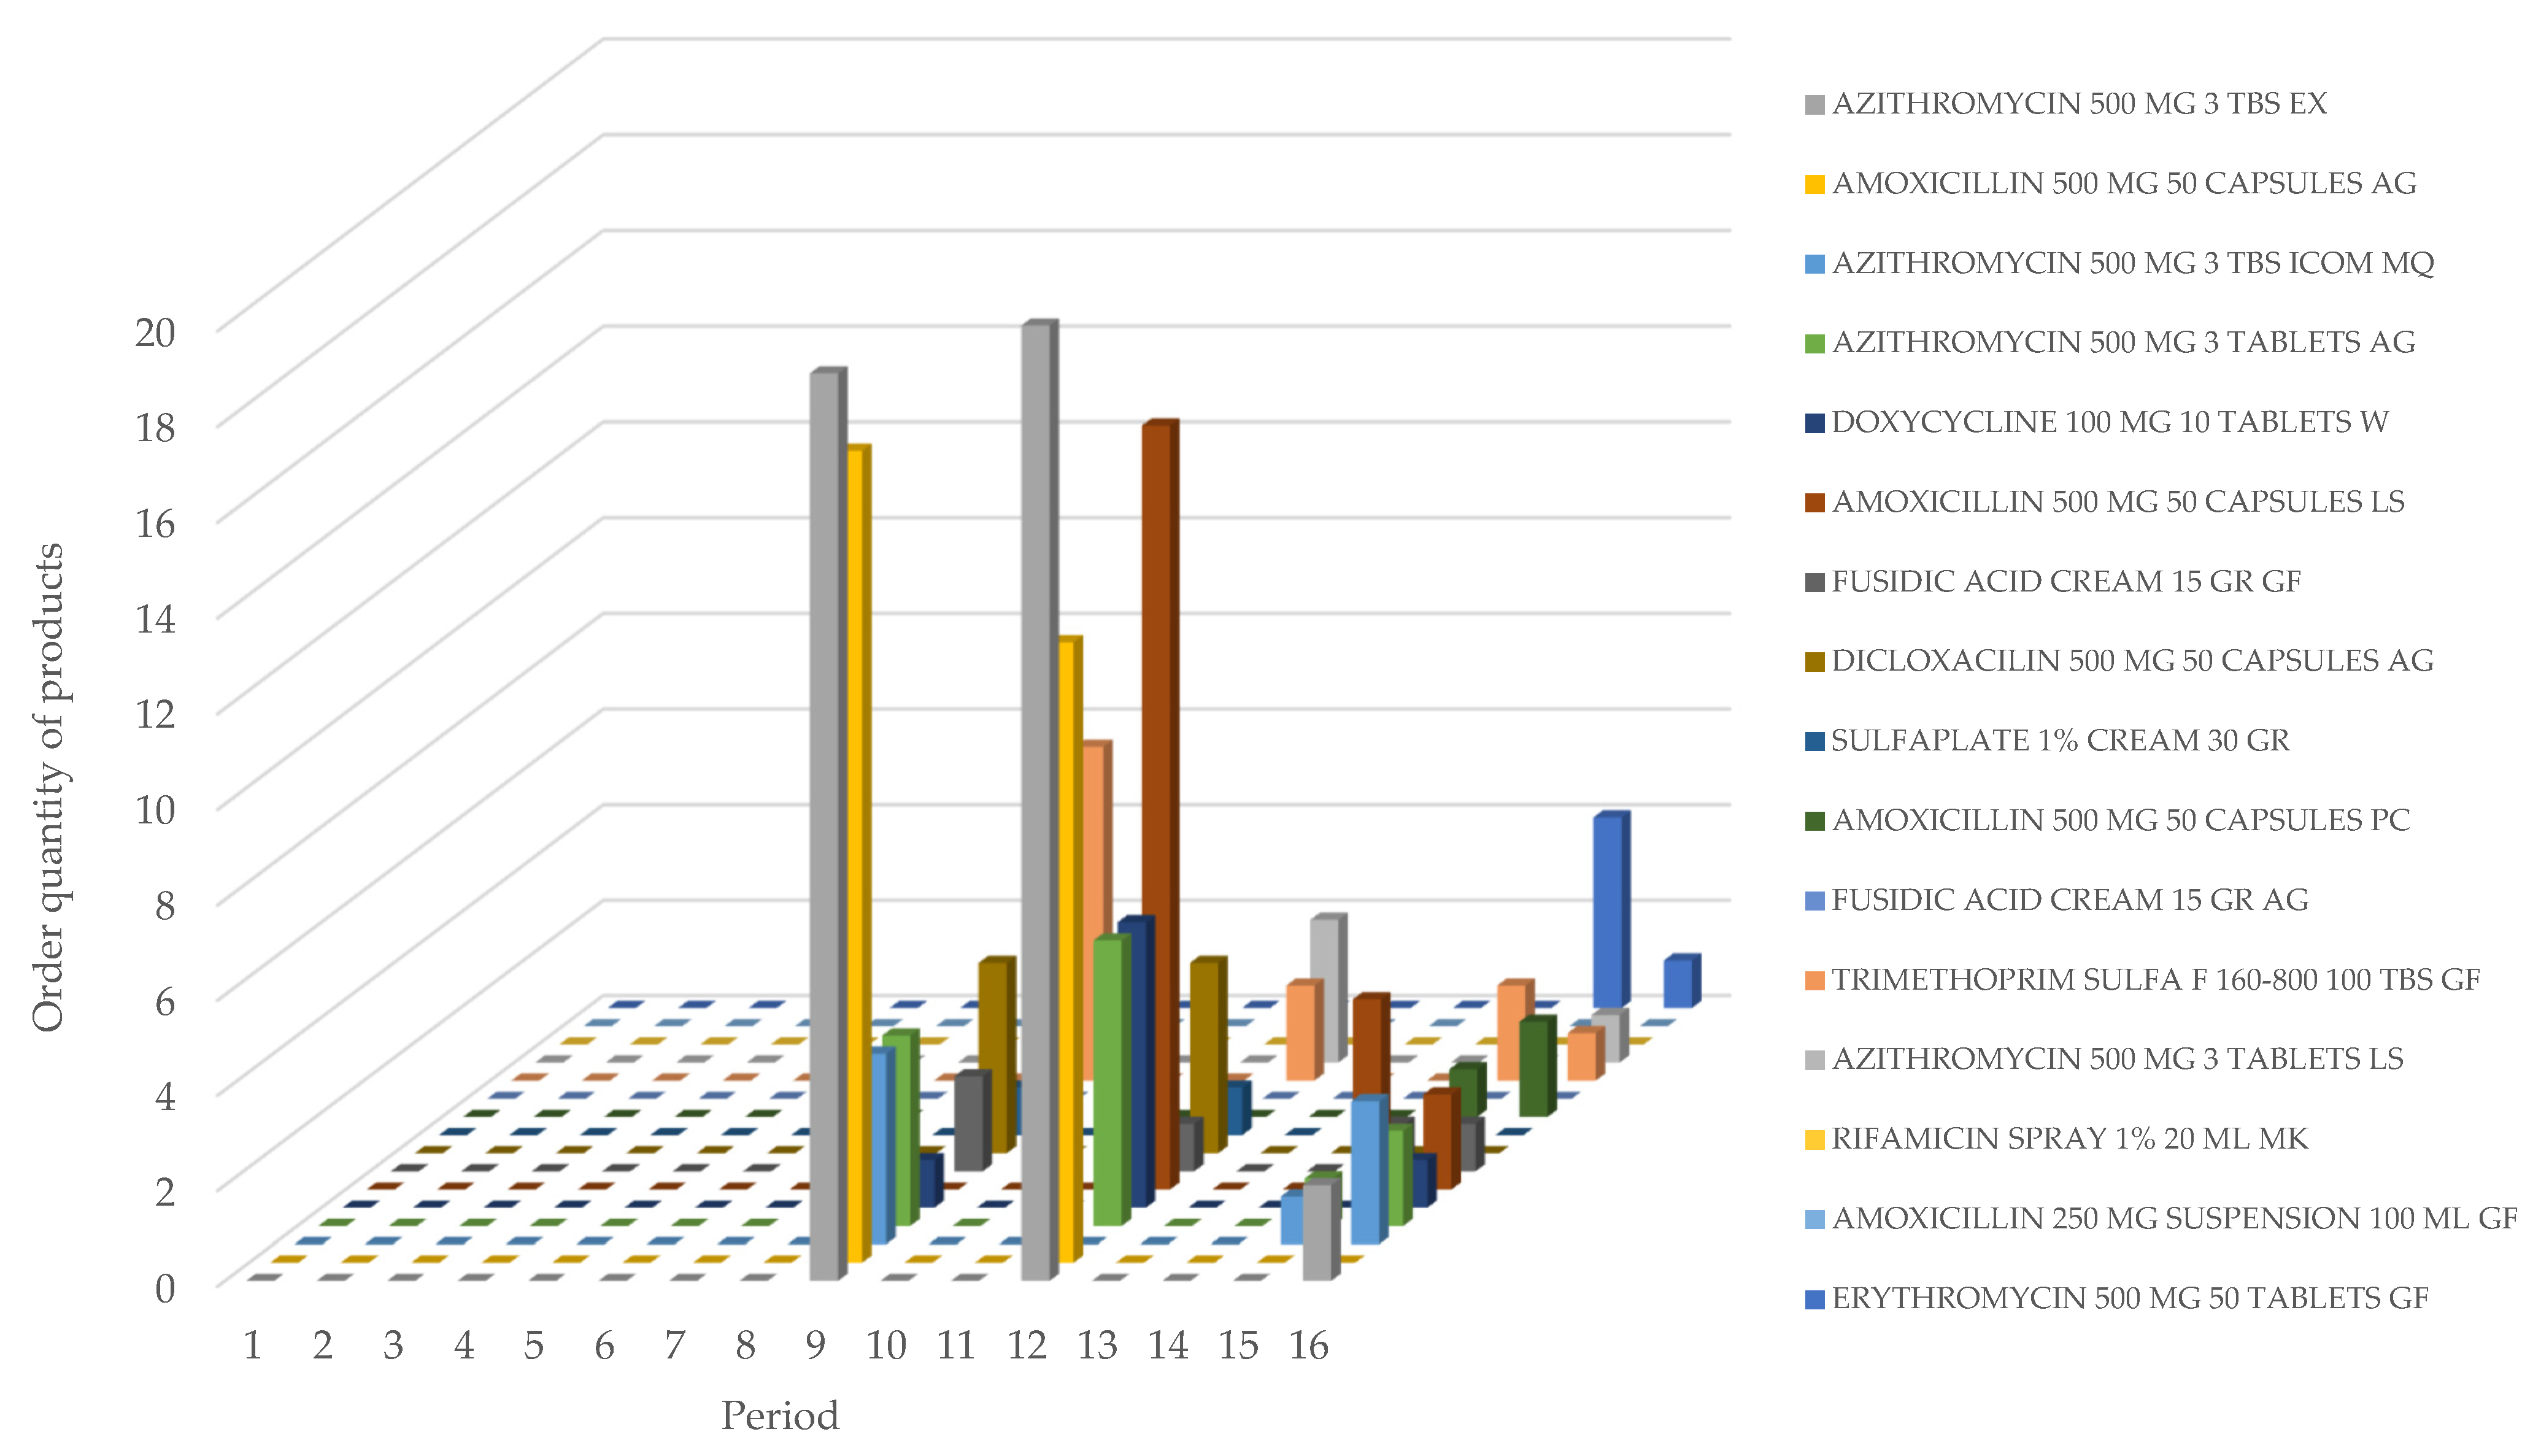
Figure 4 illustrates the recommended number of units to order for each medication type during specific periods, based on the current pharmacy situation. It suggests placing orders only in months 9, 12, 14, and 16 to minimize inventory planning costs while maintaining sufficient stock levels, thus avoiding medication shortages. Figure 5, Figure 6 and Figure 7 illustrate the optimal order quantities from the supplier for each medication type across different scenarios. Among the scenarios analyzed, scenario three emerges as the most favorable option based on the values of the objective function. An examination of inventory patterns in previous periods reveals an excess of unsold products. Consequently, reducing the minimum inventory level by 30% could lead to a 15.78% decrease in overall inventory planning costs compared to the initial status of the pharmacy.

6.2. Managerial Implications

This study develops and evaluates a multi-product, multi-period inventory planning model for optimizing medicine supply in a pharmacy. The analysis examines three scenarios to assess the impact of changes to operational and cost parameters. In Scenario 1, a 15% increase in ordering costs resulted in a modest 1.4% rise in total inventory costs (COP 3,062,518) without affecting the decision variables. Scenario 2 demonstrated a 10% reduction in storage costs, enabled by best practices and government incentives, yielding a 6.57% cost decrease (COP 2,834,295). Scenario 3 introduced a 30% reduction in minimum batch sizes, resulting in the most significant improvement, with a 15.78% reduction in costs (COP 2,608,870). Comparative analysis with prior studies suggests that storage optimization and reduced lot sizes consistently generate savings across pharmacy contexts [33,34]. In contrast, ordering-cost variations have limited effects unless coupled with demand and lead-time uncertainty [9]. These findings underscore the importance of integrating batch-sizing policies, FEFO-based controls, and uncertainty modeling to strike a balance between cost efficiency and service reliability in pharmaceutical supply chains.
This research highlights the managerial importance of optimizing inventory management, reducing unnecessary costs, and enhancing product availability. The proposed model presents practical insights into how implementing operational policies can lead to cost savings while ensuring a continuous supply of medicine. Managers can use the results to design more efficient procurement strategies, reduce stockouts, and prevent excessive inventory levels that lead to increased waste and costs. The study allows pharmacy managers to anticipate the impact of changes in supply chain parameters and implement policies that balance financial efficiency with service quality, improving profitability and patient satisfaction.

6.3. Limitations of the Study

This study considered the case study of a pharmacy in Barranquilla, Colombia, which may limit the generalizability of the findings to other contexts with different operational, regulatory, or infrastructural conditions. Future research could include some factors such as perishability, expiration dates, or FEFO policies. Additionally, sustainability, collaboration among multiple echelons, or patient service levels should be essential to include in the pharmacy sector.

7. Conclusions

This research developed a mathematical inventory planning model to optimize the supply process of a pharmacy in Barranquilla. The methodology involved studying the pharmaceutical field, observing the supply process, interacting with employees, and using 16 months of historical data to develop the model. The primary objective was to find an optimal method for managing drug inventory, thereby minimizing costs and ensuring product availability to customers. The proposed model aims to minimize inventory planning costs for antibiotic management, resulting in improved resource utilization and more accurate order management.
The model offers strategic insights into the factors that most significantly affect operational efficiency. Scenario analysis revealed that variability in delivery times and supplier reliability are critical variables. Minor improvements in these areas can drive additional profits, whereas significant deterioration could offset some of these benefits.
From a managerial perspective, the research confirms that data-driven decision-making and mathematical models enhance business resilience in the face of market changes, regulatory shifts, or health-related events. Transitioning from empirical methods to an optimized approach not only boosts profitability but also frees up working capital, allowing for investments in value-added initiatives such as loyalty programs and complementary clinical services.
Additionally, the experience gained by staff during the adoption of the model fosters a culture of continuous improvement and encourages the use of analytical tools. However, the study has limitations that deserve consideration in future research. The model assumed a stationary demand and utilized a fixed time horizon. Nevertheless, seasonality and public health events can drastically change consumption patterns. Incorporating advanced forecasting techniques and modules for dynamic replenishment policy review would strengthen the proposal. It would also be beneficial to evaluate integration with multi-echelon inventory systems, as many pharmacies in Barranquilla are part of networks or chains with their distribution centers. Lastly, exploring sustainability indicators, such as minimizing losses due to expiration, would enhance the project’s social and environmental impact.
The developed optimization model provides a robust tool for efficient pharmaceutical inventory management in Barranquilla. The economic benefits achieved, increased operational visibility, and the capability to adapt to various scenarios present compelling reasons for its adoption and expansion. With adjustments aimed at managing uncertainty and multiple supply levels, this solution has the potential to become a reference standard for inventory planning in the local and regional healthcare sector.
Future research should focus on improving pharmaceutical inventory models by considering changing consumer demand, unpredictable lead times, and the perishability of products. Utilizing digital twin simulations and IoT-based monitoring can facilitate real-time decision-making and minimize waste. We should also consider energy efficiency and carbon footprint to make pharmacy operations more environmentally friendly. Expanding the model to include networks that work together and utilizing strategies such as Vendor-Managed Inventory can enhance coordination. Ultimately, converting this model into practical tools will enable healthcare managers and policymakers to make more informed decisions.
Author Contributions

Conceptualization, K.S.-N., J.P.-M., and J.T.-P.; methodology, K.S.-N., J.P.-M., and J.T.-P.; software, K.S.-N., J.P.-M., and J.T.-P.; validation, K.S.-N., J.P.-M., and J.T.-P.; formal analysis, K.S.-N., J.P.-M., and J.T.-P.; investigation, K.S.-N., J.P.-M., and J.T.-P.; resources, J.R.-A.; data curation, J.P.-M., and J.T.-P.; writing—original draft preparation, K.S.-N., J.P.-M., J.T.-P., and J.R.-A.; writing—review and editing, K.S.-N., and J.R.-A.; visualization, K.S.-N., J.P.-M., and J.T.-P.; supervision, K.S.-N., and J.R.-A.; project administration, K.S.-N., and J.R.-A.; funding acquisition, K.S.-N., and J.R.-A. All authors have read and agreed to the published version of the manuscript.

Funding

This research received no external funding.

Institutional Review Board Statement

Not Applicable.

Informed Consent Statement

Not Applicable.

Data Availability Statement

The original contributions presented in this study are included in the article. Further inquiries can be directed to the corresponding authors.

Conflicts of Interest

The authors declare no conflicts of interest.

References

  1. George, S.; Elrashid, S. Inventory Management and Pharmaceutical Supply Chain Performance of Hospital Pharmacies in Bahrain: A Structural Equation Modeling Approach. SAGE Open 2023, 13, 1–13. [Google Scholar] [CrossRef]
  2. Mouaky, M.; Berrado, A.; Benabbou, L. A Kanban based system for multi-echelon inventory management. In Proceedings of the 2016 3rd International Conference on Logistics Operations Management (GOL), Fez, Morocco, 23–25 May 2016; pp. 1–6. [Google Scholar] [CrossRef]
  3. Larni-Fooeik, A.; Paeizi, A.; Taheri, M.; Mohammadi, E.; Sadjadi, S.J. Multistage scenario-based planning for locating of pharmaceutic distribution centers for emergency patients by considering practical constraints under budget uncertainty conditions (case study: Kerman city in Iran). Results Eng. 2024, 22, 102153. [Google Scholar] [CrossRef]
  4. Salas-Navarro, K.; Florez, W.F.; Cárdenas-Barrón, L.E. A vendor-managed inventory model for a three-layer supply chain considering exponential demand, imperfect system, and remanufacturing. Ann. Oper. Res. 2024, 332, 329–371. [Google Scholar] [CrossRef]
  5. Singh, R.K.S.; Kumar, R.; Kumar, P. Strategic issues in pharmaceutical supply chains: A review. Int. J. Pharm. Healthc. Mark. 2016, 10, 234–257. [Google Scholar] [CrossRef]
  6. Sbai, N.; Berrado, A. A literature review on multi-echelon inventory management: The case of pharmaceutical supply chain. MATEC Web Conf. 2018, 200, 00013. [Google Scholar] [CrossRef]
  7. Zandkarimkhani, S.; Mina, H.; Biuki, M.; Govindan, K. A chance constrained fuzzy goal programming approach for perishable pharmaceutical supply chain network design. Ann. Oper. Res. 2020, 295, 425–452. [Google Scholar] [CrossRef]
  8. Jurado, I.; Maestre, J.M.; Velarde, P.; Ocampo-Martinez, C.; Fernández, I.; Tejera, B.I.; del Prado, J.R. Stock management in hospital pharmacy using chance-constrained model predictive control. Comput. Biol. Med. 2016, 72, 248–255. [Google Scholar] [CrossRef]
  9. Franco, C.; Alfonso-Lizarazo, E. Optimization under uncertainty of the pharmaceutical supply chain in hospitals. Comput. Chem. Eng. 2020, 135, 106689. [Google Scholar] [CrossRef]
  10. Goodarzian, F.; Hosseini-Nasab, H.; Muñuzuri, J.; Fakhrzad, M.B. A multi-objective pharmaceutical supply chain network based on a robust fuzzy model: A comparison of meta-heuristics. Appl. Soft Comput. J. 2020, 92, 106331. [Google Scholar] [CrossRef]
  11. Privett, N.; Gonsalvez, D. The top ten global health supply chain issues: Perspectives from the field. Oper. Res. Health Care 2014, 3, 226–230. [Google Scholar] [CrossRef]
  12. Tripathi, S.; Talukder, B.; Rangarajan, K. Do Supply Chain Performance Influence Firm Profitability? A Predictive Approach in the Context of the Indian Pharmaceutical Industry. IIM Kozhikode Soc. Manag. Rev. 2024, 13, 166–183. [Google Scholar] [CrossRef]
  13. Labuhn, J.; Almeter, P.; McLaughlin, C.; Fields, P.; Turner, B. Supply chain optimization at an academic medical center. Am. J. Health Pharm. 2017, 74, 1184–1190. [Google Scholar] [CrossRef] [PubMed]
  14. Mallek, M.; Elleuch, M.A.; Akouri, Y. Evaluation of supplier performance for sustainability in the pharmaceutical supply chain: A case study of hedi jaballah hospital in Tunisia. In Intelligent Methods and Alternative Economic Models for Sustainability; IGI Global Scientific Publishing: Hershey, PA, USA, 2024; pp. 1–20. ISBN 9798369314197. [Google Scholar]
  15. Milanesi, M.; Runfola, A.; Guercini, S. Pharmaceutical industry riding the wave of sustainability: Review and opportunities for future research. J. Clean. Prod. 2020, 261, 121204. [Google Scholar] [CrossRef]
  16. Lazim, N.A.M. Chaos, Complexity, and Sustainability in Pharmaceutical Supply Chain Management. In Chaos, Complexity, and Sustainability in Management; IGI Global Scientific Publishing: Hershey, PA, USA, 2024; pp. 211–232. [Google Scholar]
  17. Franco, C. A simulation model to evaluate pharmaceutical supply chain costs in hospitals: The case of a Colombian hospital. DARU J. Pharm. Sci. 2020, 28, 1–12. [Google Scholar] [CrossRef] [PubMed]
  18. Goodarzian, F.; Kumar, V.; Ghasemi, P. A set of efficient heuristics and meta-heuristics to solve a multi-objective pharmaceutical supply chain network. Comput. Ind. Eng. 2021, 158, 107389. [Google Scholar] [CrossRef]
  19. Poomisirisawat, H.; Suwatcharachaitiwong, S.; Sirivongpaisal, N. An Integrated Approach for Designing Healthcare Facilities with a Location-Inventory Model. Sci. Technol. Asia 2024, 29, 53–62. [Google Scholar]
  20. Farahani, R.Z.; Rashidi Bajgan, H.; Fahimnia, B.; Kaviani, M. Location-inventory problem in supply chains: A modelling review. Int. J. Prod. Res. 2015, 53, 3769–3788. [Google Scholar] [CrossRef]
  21. Shekoohi Tolgari, F.; Zarrinpoor, N. A robust reverse pharmaceutical supply chain design considering perishability and sustainable development objectives. Ann. Oper. Res. 2024, 340, 981–1033. [Google Scholar] [CrossRef]
  22. Saracoglu, I. Inventory Optimization with Chance-Constrained Programming Under Demand Uncertainty. Int. J. Supply Oper. Manag. 2024, 11, 300–315. [Google Scholar] [CrossRef]
  23. Birong, Z. Planning for pharma supply chain under uncertainty considering inventory optimization. J. Intell. Fuzzy Syst. 2023, 45, 6561–6574. [Google Scholar] [CrossRef]
  24. Amiri-Aref, M.; Klibi, W.; Babai, M.Z. The multi-sourcing location inventory problem with stochastic demand. Eur. J. Oper. Res. 2018, 266, 72–87. [Google Scholar] [CrossRef]
  25. Elarbi, M.; Ayadi, O.; Masmoudi, M.; Masmoudi, F. Drug-inventory-management-model for a multi-echelon pharmaceutical supply-chain: Case study of the Tunisian pharmaceutical supply-chain. Supply Chain Forum 2021, 22, 44–56. [Google Scholar] [CrossRef]
  26. Elarbi, M.; Masmoudi, M.; Ayadi, O.; Masmoudi, F. Optimisation models and information sharing in a multi-echelon pharmaceutical supply chain. Int. J. Shipp. Transp. Logist. 2022, 14, 56–77. [Google Scholar] [CrossRef]
  27. Badejo, O.; Ierapetritou, M. Enhancing pharmaceutical supply chain resilience: A multi-objective study with disruption management. Comput. Chem. Eng. 2024, 188, 108769. [Google Scholar] [CrossRef]
  28. Zhang, X.; Meiser, D.; Liu, Y.; Bonner, B.; Lin, L. Kroger uses simulation-optimization to improve pharmacy inventory management. Interfaces 2014, 44, 70–84. [Google Scholar] [CrossRef]
  29. Hakim, I.M.; Ulfah, W.M. Model development to determine optimal drugs inventory in Indonesia public health services. In Proceedings of the 5th International Conference on Industrial and Business Engineering, Hong Kong, China, 27–29 September 2019; pp. 28–32. [Google Scholar]
  30. Nguyen, P.H.; Dang, T.V.K.; Nguyen, P.T.; Vo, T.M.H.; Nguyen, T.T.M. 5-year inventory management of drug products using ABC-VEN analysis in the pharmacy store of a specialized public hospital in Vietnam. Pharmacia 2022, 69, 517–525. [Google Scholar] [CrossRef]
  31. Devnani, M.; Gupta, A.K.; Nigah, R. ABC and VED analysis of the pharmacy store of a tertiary care teaching, research and referral healthcare institute of India. J. Young Pharm. 2010, 2, 201–205. [Google Scholar] [CrossRef]
  32. Gobachew, A.M.; Kitaw, D.; Berhan, E.; Haasis, H.D. ABC/XYZ analysis for kanban system implementation in phar-maceutical supply chain: A case of ethiopian pharmaceutical supply agency. Int. J. Inf. Syst. Supply Chain Manag. 2021, 14, 63–78. [Google Scholar] [CrossRef]
  33. Silva-Aravena, F.; Ceballos-Fuentealba, I.; Álvarez-Miranda, E. Inventory management at a chilean hospital pharmacy: Case study of a dynamic decision-aid tool. Mathematics 2020, 8, 1962. [Google Scholar] [CrossRef]
  34. Sugapriya, C.; Nagarajan, D.; Gobinath, V.M.; Kuppulakshmi, V. A multi-period optimization model for medicine supply chains using modified interactive multi-objective fuzzy programming. Supply Chain Anal. 2023, 4, 100048. [Google Scholar] [CrossRef]
Figure 1. Pareto chart.
Logistics 09 00151 g001
Figure 2. Order quantity of products by period.
Logistics 09 00151 g002
Figure 3. Optimal Solution of the model by scenarios.
Logistics 09 00151 g003
Figure 4. Optimal initial solution of the order quantity of products.
Logistics 09 00151 g004
Figure 5. Optimal solution of the order quantity of products by scenario 1.
Logistics 09 00151 g005
Figure 6. Optimal solution of the order quantity of products by scenario 2.
Logistics 09 00151 g006
Figure 7. Optimal solution of the order quantity of products by scenario 3.
Logistics 09 00151 g007
Table 1. ABC inventory classification.
ProductsDemandPurchasing Cost Per Unit (COP)Total Cost (COP)% of Total Cost% Accumulative Total Cost% of Product Demand% Accumulative Product DemandType of Product
Azithromycin tablets 500mg, 3 tablets 1034705484,60016.33%16.33%17.20%17.20%A
Amoxicillin 500 mg, 50 capsules 1332103279,6729.42%25.75%22.20%39.40%A
Azithromycin 500 mg, 3 tablets 535128271,7849.16%34.91%8.85%48.25%A
Azithromycin 500 mg, 3 tablets 493909191,5256.45%41.37%8.18%56.43%A
Doxycycline 100 mg, 10 tablets 247075169,7945.72%47.09%4.01%60.43%A
Amoxicillin 500 mg, 50 capsules354512157,9325.32%52.41%5.84%66.28%A
Fusidic acid cream 15 g1110,804118,8404.00%56.41%1.84%68.11%A
Dicloxacillin 500 mg 50 capsules205007100,1413.37%59.79%3.34%71.45%A
Sulfaplate 1% cream 30 gr422,68690,7443.06%62.85%0.67%72.12%A
Amoxicillin 500 mg 50 capsules24378090,7223.06%65.90%4.01%76.13%A
Fusidic acid cream 15 g 10824882,4802.78%68.68%1.67%77.80%A
Trimethoprim sulfa f 160–800 100 tablets23340278,2482.64%71.32%3.84%81.64%A
Azithromycin 500 mg 3 tablets611,40068,4002.30%73.62%1.00%82.64%A
Rifamicin spray 1% 20 mL mk228,86757,7341.95%75.57%0.33%82.97%A
Amoxicillin 250 mg suspension 100 mL 8720657,6451.94%77.51%1.34%84.31%A
Erythromycin 500 mg 50 tablets 510,46252,3121.76%79.27%0.83%85.14%A
Zidoxtifene 500 mg 3 tablets5984949,2451.66%80.93%0.83%85.98%B
Azithromycin 200 mg suspension 15 mL412,29949,1961.66%82.59%0.67%86.64%B
Ampicillin 1 g 100 tablets7634344,4011.50%84.09%1.17%87.81%B
Plant sulfadiazine 15 gr6718743,1221.45%85.54%1.00%88.81%B
Plant sulfadiazine 30 gr410,65542,6201.44%86.98%0.67%89.48%B
Doxiclor 40 mg 10 tablets313,00039,0001.31%88.29%0.50%89.98%B
Dicloxacillin 500 mg 50 capsules8430234,4121.16%89.45%1.34%91.32%B
Ciprofloxacin 500 mg 300 tablets 10323532,3521.09%90.54%1.67%92.99%B
Cefalexin 500 mg 10 capsules5588829,4420.99%91.53%0.83%93.82%B
Amoxicillin 250 mg suspension 100 ml4729629,1820.98%92.52%0.67%94.49%B
Ampicillin 500 mg 100 capsules 5554127,7060.93%93.45%0.83%95.33%B
Ciprofloxacin 500 mg 10 tablets 6458927,5340.93%94.38%1.00%96.33%B
Sulfaplate 1% cream 60 gr126,28226,2820.89%95.26%0.17%96.49%C
Norfloxacin 400 mg 14 tablets 211,45522,9090.77%96.04%0.33%96.83%C
Cefalexin 250 mg suspension 60 mL3695520,8660.70%96.74%0.50%97.33%C
Amoxicillin 250 mg suspension 100 mL2774015,4800.52%97.26%0.33%97.66%C
Azithromycin 500 mg 3 tablets3425312,7600.43%97.69%0.50%98.16%C
Fusidic acid 2% cream 15 gr111,59111,5910.39%98.08%0.17%98.33%C
Cinepride 500 mg 10 tablets 2533910,6780.36%98.44%0.33%98.66%C
Levofloxacin 500 mg 7 tablets110,63410,6340.36%98.80%0.17%98.83%C
Cefalexin 250 mg suspension 60 mL 1874187410.29%99.09%0.17%99.00%C
Amoxicillin 250 mg suspension 100 mL1800080000.27%99.36%0.17%99.17%C
Trimethoprim sulfa 40–200 susp.12 1553755370.19%99.55%0.17%99.33%C
Azithromycin 200 mg suspension 15 mL 1500050000.17%99.72%0.17%99.50%C
Cefalexin 500 mg 20 capsules 1371237120.13%99.84%0.17%99.67%C
Trimethoprim sulfa f 160–800 100 tablets1314131410.11%99.95%0.17%99.83%C
Trimethoprim sulfa 40–200 susp.60 mL 1150515050.05%100.00%0.17%100.00%C
Table 2. Purchasing cost per unit for the product i during period j.
Product12345678910111213141516
Azithromycin 500 mg 3 tablets 4705470547054705470547054940494049404940494049405187544657196005
Amoxicillin 500 mg 50 capsules 2103210321032103210321032208220822082208220822082318231823182318
Azithromycin 500 mg 3 tablets5128512851285128512851285384538453845384538453845654565456545654
Azithromycin 500 mg 3 tablets3909390939093909390939094104410441044104410441044309430943094309
Doxycycline 100 mg 10 tablets 7075707570757075707570757428742874287428742874287800780078007800
Amoxicillin 500 mg 50 capsules 4512451245124512451245124738473847384738473847384975497549754975
Fusidic acid cream 15 gr gf10,80410,80410,80410,80410,80410,80411,34411,34411,34411,34411,34411,34411,91111,91111,91111,911
Dicloxacilin 500 mg 50 capsules5007500750075007500750075257525752575257525752575520552055205520
Sulfaplate 1% cream 30 gr22,68622,68622,68622,68622,68622,68623,82023,82023,82023,82023,82023,82025,01125,01125,01125,011
Amoxicillin 500 mg 50 capsules pc3780378037803780378037803969396939693969396939694168416841684168
Fusidic acid cream 15 gr8248824882488248824882488660866086608660866086609093909390939093
Trimethoprim sulfa f 160–800 100 tablets gf3402340234023402340234023572357235723572357235723751375137513751
Azithromycin 500 mg 3 tablets 11,40011,40011,40011,40011,40011,40011,97011,97011,97011,97011,97011,97012,56912,56912,56912,569
Rifamicin spray 1% 20 mL mk28,86728,86728,86728,86728,86728,86730,31030,31030,31030,31030,31030,31031,82631,82631,82631,826
Amoxicillin 250 mg suspension 100 mL gf7206720672067206720672067566756675667566756675667944794479447944
Erythromycin 500 mg 50 tablets gf10,46210,46210,46210,46210,46210,46210,98610,98610,98610,98610,98610,98611,53511,53511,53511,535
Table 3. Inventory holding cost per unit for the product i during period j.
Product12345678910111213141516
Azithromycin 500 mg 3 tablets 9419419419419419419889889889889889881037108911441201
Amoxicillin 500 mg 50 capsules421421421421421421442442442442442442464464464464
Azithromycin 500 mg 3 tablets1026102610261026102610261077107710771077107710771131113111311131
Azithromycin 500 mg 3 tablets 782782782782782782821821821821821821862862862862
Doxycycline 100 mg 10 tablets 1415141514151415141514151486148614861486148614861560156015601560
Amoxicillin 500 mg 50 capsules 902902902902902902948948948948948948995995995995
Fusidic acid cream 15 gr 2161216121612161216121612269226922692269226922692382238223822382
Dicloxacillin 500 mg 50 capsules 1001100110011001100110011051105110511051105110511104110411041104
Sulfaplate 1% cream 30 gr4537453745374537453745374764476447644764476447645002500250025002
Amoxicillin 500 mg 50 capsules 756756756756756756794794794794794794834834834834
Fusidic acid cream 15 gr 1650165016501650165016501732173217321732173217321819181918191819
Trimethoprim sulfa f 160–800 100 tablets 680680680680680680714714714714714714750750750750
Azithromycin 500 mg 3 tablets 2280228022802280228022802394239423942394239423942514251425142514
Rifamicin spray 1% 20 mL 5773577357735773577357736062606260626062606260626365636563656365
Amoxicillin 250 mg suspension 100 mL 1441144114411441144114411513151315131513151315131589158915891589
Erythromycin 500 mg 50 tablets 2092209220922092209220922197219721972197219721972307230723072307
Table 4. Demand for product i during period j.
Product12345678910111213141516
Azithromycin 500 mg 3 tablets 0407715061405513203
Amoxicillin 500 mg 50 capsules6007101471566549000
Azithromycin 500 mg 3 tablets31304600022000024
Azithromycin 500 mg 3 tablets 0061900004014123
Doxycycline 100 mg 10 tablets 0034021000113202
Amoxicillin 500 mg 50 capsules 41320000000061061
Fusidic acid cream 15 gr 0001001002010021
Dicloxacillin 500 mg 50 capsules 2013211011231000
Sulfaplate 1% cream 30 gr0011000001000100
Amoxicillin 500 mg 50 capsules 05104000000000022
Fusidic acid cream 15 gr 2010311000000000
Trimethoprim sulfa f 160–800 100 tablets 2010300121401130
Azithromycin 500 mg 3 tablets 2122100000230001
Rifamicin spray 1% 20 mL 0110000000000000
Amoxicillin 250 mg suspension 100 mL 1110041000000000
Erythromycin 500 mg 50 tablets 0000000000000050
Table 5. Maximum storage capacity for the product i during period j.
Product12345678910111213141516
Azithromycin 500 mg 3 tablets 33333333333333333333333333333333
Amoxicillin 500 mg 50 capsules37373737373737373737373737373737
Azithromycin 500 mg 3 tablets26262626262626262626262626262626
Azithromycin 500 mg 3 tablets 16161616161616161616161616161616
Doxycycline 100 mg 10 tablets 9999999999999999
Amoxicillin 500 mg 50 capsules 30303030303030303030303030303030
Fusidic acid cream 15 gr 4444444444444444
Dicloxacillin 500 mg 50 capsules 15151515151515151515151515151515
Sulfaplate 1% cream 30 gr4444444444444444
Amoxicillin 500 mg 50 capsules 19191919191919191919191919191919
Fusidic acid cream 15 gr 7777777777777777
Trimethoprim sulfa f 160–800 100 tablets 7777777777777777
Azithromycin 500 mg 3 tablets 6666666666666666
Rifamicin spray 1% 20 mL 3333333333333333
Amoxicillin 250 mg suspension 100 mL 7777777777777777
Erythromycin 500 mg 50 tablets 5555555555555555
Table 6. Minimum quantity of the product i at the end of period j.
Product12345678910111213141516
Azithromycin 500 mg 3 tablets 3333333333333333
Amoxicillin 500 mg 50 capsules5555555555555555
Azithromycin 500 mg 3 tablets3333333333333333
Azithromycin 500 mg 3 tablets 4444444444444444
Doxycycline 100 mg 10 tablets 3333333333333333
Amoxicillin 500 mg 50 capsules 3333333333333333
Fusidic acid cream 15 gr 2222222222222222
Dicloxacillin 500 mg 50 capsules 3333333333333333
Sulfaplate 1% cream 30 gr2222222222222222
Amoxicillin 500 mg 50 capsules 4444444444444444
Fusidic acid cream 15 gr 3333333333333333
Trimethoprim sulfa f 160–800 100 tablets 2222222222222222
Azithromycin 500 mg 3 tablets 1111111111111111
Rifamicin spray 1% 20 mL 2222222222222222
Amoxicillin 250 mg suspension 100 mL 2222222222222222
Erythromycin 500 mg 50 tablets 2222222222222222
Table 7. Orders by periods.
PeriodPlace OrdersDo Not Place Orders
1 X
2 X
3 X
4 X
5 X
6 X
7 X
8 X
9X
10 X
11 X
12X
13 X
14 X
15X
16X
Table 8. Order Quantity of products by period.
Product12345678910111213141516
Azithromycin 500 mg 3 tablets 000000001900200002
Amoxicillin 500 mg 50 capsules000000001700130000
Azithromycin 500 mg 3 tablets0000000040000013
Azithromycin 500 mg 3 tablets 0000000040060012
Doxycycline 100 mg 10 tablets 0000000010060001
Amoxicillin 500 mg 50 capsules 00000000000160032
Fusidic acid cream 15 gr 0000000020010011
Dicloxacillin 500 mg 50 capsules 0000000040040000
Sulfaplate 1% cream 30 gr0000000010010000
Amoxicillin 500 mg 50 capsules 0000000000000012
Fusidic acid cream 15 gr 0000000000000000
Trimethoprim sulfa f 160–800 100 tablets 0000000070020021
Azithromycin 500 mg 3 tablets 0000000020030001
Rifamicin spray 1% 20 mL 0000000000000000
Amoxicillin 250 mg suspension 100 mL 0000000000000000
Erythromycin 500 mg 50 tablets 0000000000000021
Table 9. Inventory level of products by periods.
Products012345678910111213141516
Azithromycin 500 mg 3 tablets 04238383124993883185332
Amoxicillin 500 mg 50 capsules058585851412720516105145555
Azithromycin 500 mg 3 tablets02613139333353333321
Azithromycin 500 mg 3 tablets 020201413444484495432
Doxycycline 100 mg 10 tablets 01313106643344385332
Amoxicillin 500 mg 50 capsules 0985333333331913301
Fusidic acid cream 15 gr 04443332242222211
Dicloxacillin 500 mg 50 capsules 01111107543365433333
Sulfaplate 1% cream 30 gr04432222232233222
Amoxicillin 500 mg 50 capsules 0231884444444444433
Fusidic acid cream 15 gr 09988543333333333
Trimethoprim sulfa f 160–800 100 tablets 07766333276243212
Azithromycin 500 mg 3 tablets 07642111133111111
Rifamicin spray 1% 20 mL 04322222222222222
Amoxicillin 250 mg suspension 100 mL 09877732222222222
Erythromycin 500 mg 50 tablets 02222222222222201
Table 10. Objective function solutions.
Objective FunctionTotal Inventory Planning CostVariation
Initial solutionCOP 3,020,533.000%
Scenario 1COP 3,062,518.001.4%
Scenario 2COP 2,834,295.00−6.57%
Scenario 3COP 2,608,870.00−15.78%
Table 11. Order Quantity of products by period—Scenario 1.
Product12345678910111213141516
Azithromycin 500 mg 3 tablets 000000001900200002
Amoxicillin 500 mg 50 capsules000000001700130000
Azithromycin 500 mg 3 tablets0000000040000013
Azithromycin 500 mg 3 tablets 0000000040060012
Doxycycline 100 mg 10 tablets 0000000010060001
Amoxicillin 500 mg 50 capsules 00000000000160032
Fusidic acid cream 15 gr 0000000020010011
Dicloxacillin 500 mg 50 capsules 0000000040040000
Sulfaplate 1% cream 30 gr0000000010010000
Amoxicillin 500 mg 50 capsules 0000000000000012
Fusidic acid cream 15 gr 0000000000000000
Trimethoprim sulfa f 160–800 100 tablets 0000000070020021
Azithromycin 500 mg 3 tablets 0000000020030001
Rifamicin spray 1% 20 mL 0000000000000000
Amoxicillin 250 mg suspension 100 mL 0000000000000000
Erythromycin 500 mg 50 tablets 0000000000000031
Table 12. Inventory level of products by periods—Scenario 1.
Products012345678910111213141516
Azithromycin 500 mg 3 tablets 04238383124993883185332
Amoxicillin 500 mg 50 capsules058585851412720516105145555
Azithromycin 500 mg 3 tablets02613139333353333321
Azithromycin 500 mg 3 tablets 020201413444484495432
Doxycycline 100 mg 10 tablets 01313106643344385332
Amoxicillin 500 mg 50 capsules 0985333333331913301
Fusidic acid cream 15 gr 04443332242222211
Dicloxacillin 500 mg 50 capsules 01111107543365343333
Sulfaplate 1% cream 30 gr04432222232233222
Amoxicillin 500 mg 50 capsules 0231884444444444433
Fusidic acid cream 15 gr 09988543333333333
Trimethoprim sulfa f 160–800 100 tablets 07766333276243212
Azithromycin 500 mg 3 tablets 07642111133111111
Rifamicin spray 1% 20 mL 04322222222222222
Amoxicillin 250 mg suspension 100 mL 09877732222222222
Erythromycin 500 mg 50 tablets 02222222222222201
Table 13. Order Quantity of products by period—Scenario 2.
Product12345678910111213141516
Azithromycin 500 mg 3 tablets 000000001900200002
Amoxicillin 500 mg 50 capsules000000001700130000
Azithromycin 500 mg 3 tablets0000000040000013
Azithromycin 500 mg 3 tablets 0000000040060012
Doxycycline 100 mg 10 tablets 0000000010060001
Amoxicillin 500 mg 50 capsules 00000000000160032
Fusidic acid cream 15 gr 0000000020010011
Dicloxacillin 500 mg 50 capsules 0000000040040000
Sulfaplate 1% cream 30 gr0000000010010000
Amoxicillin 500 mg 50 capsules 0000000000000012
Fusidic acid cream 15 gr 0000000000000000
Trimethoprim sulfa f 160–800 100 tablets 0000000070020021
Azithromycin 500 mg 3 tablets 0000000020030001
Rifamicin spray 1% 20 mL 0000000000000000
Amoxicillin 250 mg suspension 100 mL 0000000000000000
Erythromycin 500 mg 50 tablets 0000000000000031
Table 14. Inventory level of products by periods—Scenario 2.
Products012345678910111213141516
Azithromycin 500 mg 3 tablets 04238383124993883185332
Amoxicillin 500 mg 50 capsules058585851412720516105145555
Azithromycin 500 mg 3 tablets02613139333353333321
Azithromycin 500 mg 3 tablets 020201413444484495432
Doxycycline 100 mg 10 tablets 01313106643344385332
Amoxicillin 500 mg 50 capsules 0985333333331913301
Fusidic acid cream 15 gr 04443332242222211
Dicloxacillin 500 mg 50 capsules 01111107543365343333
Sulfaplate 1% cream 30 gr04432222232233222
Amoxicillin 500 mg 50 capsules 0231884444444444433
Fusidic acid cream 15 gr 09988543333333333
Trimethoprim sulfa f 160–800 100 tablets 07766333276243212
Azithromycin 500 mg 3 tablets 07642111133111111
Rifamicin spray 1% 20 mL 04322222222222222
Amoxicillin 250 mg suspension 100 mL 09877732222222222
Erythromycin 500 mg 50 tablets 02222222222222201
Table 15. Order Quantity of products by period—Scenario 3.
Product12345678910111213141516
Azithromycin 500 mg 3 tablets 000000001900200002
Amoxicillin 500 mg 50 capsules000000001700130000
Azithromycin 500 mg 3 tablets0000000040000013
Azithromycin 500 mg 3 tablets 0000000040060012
Doxycycline 100 mg 10 tablets 0000000010060001
Amoxicillin 500 mg 50 capsules 00000000000160042
Fusidic acid cream 15 gr 0000000020010011
Dicloxacillin 500 mg 50 capsules 0000000040040000
Sulfaplate 1% cream 30 gr0000000010010000
Amoxicillin 500 mg 50 capsules 0000000000000012
Fusidic acid cream 15 gr 0000000000000000
Trimethoprim sulfa f 160–800 100 tablets 0000000070020021
Azithromycin 500 mg 3 tablets 0000000020030001
Rifamicin spray 1% 20 mL 0000000000000000
Amoxicillin 250 mg suspension 100 mL 0000000000000000
Erythromycin 500 mg 50 tablets 0000000000000041
Table 16. Inventory level of products by periods—Scenario 3.
Products012345678910111213141516
Azithromycin 500 mg 3 tablets 04137373023882772174221
Amoxicillin 500 mg 50 capsules05656564939251831483123333
Azithromycin 500 mg 3 tablets02512128222242222210
Azithromycin 500 mg 3 tablets 019191312333373384321
Doxycycline 100 mg 10 tablets 0121295532233274221
Amoxicillin 500 mg 50 capsules 0874222222221812201
Fusidic acid cream 15 gr 03332221131111100
Dicloxacillin 500 mg 50 capsules 0101096432254232222
Sulfaplate 1% cream 30 gr03321111121122111
Amoxicillin 500 mg 50 capsules 0221773333333333322
Fusidic acid cream 15 gr 08877432222222222
Trimethoprim sulfa f 160–800 100 tablets 06655222165132101
Azithromycin 500 mg 3 tablets 07642111133111111
Rifamicin spray 1% 20 mL 03211111111111111
Amoxicillin 250 mg suspension 100 mL 08766621111111111
Erythromycin 500 mg 50 tablets 01111111111111101
Disclaimer/Publisher’s Note: The statements, opinions and data contained in all publications are solely those of the individual author(s) and contributor(s) and not of MDPI and/or the editor(s). MDPI and/or the editor(s) disclaim responsibility for any injury to people or property resulting from any ideas, methods, instructions or products referred to in the content.