Abstract
Background: The resilience of shipping alliances within the global maritime container network (GMCN) has critical implications for global trade. This study examines the topological robustness of strategic alliances (SAs) in liner shipping, focusing on their structural properties and responses to disruptions. Methods: Using pre-2019 container vessel schedule data, we constructed a weighted node-edge network model of the GMCN. Centrality metrics were computed to identify critical nodes, and simulations were conducted to evaluate network robustness under random failures (RFs) and targeted attacks (TAs). Results: The results highlight the GMCN’s scale-free topology, which fosters resilience against RFs but exposes vulnerabilities to TAs on high-centrality nodes like Singapore and Shanghai. Among alliances, 2M and Ocean demonstrated superior resilience, attributed to strategic port selection and extensive coverage, yet their reliance on central hubs presents significant risks. Conclusions: This study underscores the importance of alliance-specific strategies, such as infrastructure investments and redundancy planning, to mitigate vulnerabilities. By bridging gaps in existing literature, the research provides insights for policymakers and industry stakeholders to enhance the robustness and adaptability of maritime logistics networks. These findings contribute to ensuring stable global supply chains within an evolving trade environment.
1. Introduction
The liner shipping industry, primarily driven by container shipping operators, provides services along fixed routes and schedules. Since the onset of containerization in the 1950s, the industry has grown substantially, with global container throughput rising from 30 million TEUs in 1990 to 143 million TEUs by 2020 [1,2]. To manage this expansion, carriers have formed various cooperative agreements, including strategic alliances (SAs) and consortia, which foster both horizontal and vertical collaboration within the supply chain (SC) [3,4,5].
SAs, unlike consortia, span wider routes and services and are regulated in most jurisdictions, such as under the European Consortia Block Exemption Regulation and by the U.S. Federal Maritime Commission [6,7]. These alliances enable carriers to share operational data, optimize vessel utilization, and enhance service levels. However, concerns about price manipulation have prompted increased government regulation. For example, the alliance between Maersk, MSC, and CMA CGM was prohibited in China due to concerns about market concentration [8,9].
Research by Quartieri (2017) and Hirata (2020) indicates that vessel-sharing agreements within SAs may reduce costs and promote market competition [10,11]. Nevertheless, the price impacts of these alliances remain ambiguous, necessitating further investigation [12]. Carriers join SAs to achieve economies of scale and expand global service coverage, although managing these alliances is complex, requiring a stable environment to sustain effective cooperation [1,3,7]. The collaborative nature and competitive dynamics of SAs continue to attract academic interest, with a number of quantitative studies focusing on enhancing the stability of SA collaborations. These studies often formulate a collaborative framework aimed at ensuring that all SA participants receive equitable payoffs proportional to their contributions to the alliance [7]. While prior studies have analyzed network robustness, most have focused on general SC networks rather than the specific structural dynamics and resilience of strategic shipping alliances [13,14]. The impact of targeted disruptions on high-centrality nodes (key ports) in the GMCN, specifically within different alliance configurations, remains underexplored.
Understanding network robustness within the global maritime container network (GMCN) is crucial for the stability of global trade and the efficiency of SCs. Maritime transportation, which accounts for approximately 90% of global trade, depends on reliable networks to ensure the smooth movement of goods. The GMCN’s complexity and interconnectedness can result in significant vulnerabilities, where disruptions at key nodes may have far-reaching effects. Recent incidents, including the COVID-19 pandemic, cyber-attacks, and major physical blockages, have underscored these vulnerabilities, highlighting the need for a comprehensive understanding of network structure and its resilience to both random failures (RFs) and targeted attacks (TAs). Therefore, enhancing network robustness is essential for maintaining economic stability and growth.
Advancements in data analytics and computational modeling now allow for detailed analyses of complex networks, revealing patterns and vulnerabilities previously challenging to identify. Additionally, factors such as climate change, extreme weather, geopolitical tensions, and trade policies emphasize the need for resilient maritime networks.
By focusing on network robustness, stakeholders can make informed decisions regarding route optimization, infrastructure investment, and emergency preparedness. This focus not only improves the operational efficiency of shipping alliances but also strengthens the resilience and stability of the GMCN, ensuring it can adapt and function under diverse and adverse conditions.
This study aims to investigate network topology regarding the robustness of alliances in the liner shipping industry. Using container vessel schedule data from MDS Transmodal Ltd., we construct a GMCN structure to analyze its features. To assess the robustness of alliances within the GMCN, we employ a network methodology involving simulations of both random and targeted disruptions. The former entails the random removal of ports from the network, while the latter focuses on removing high-importance nodes based on centrality metrics. By subjecting the GMCN to these disruptions and evaluating its response, we gain insights into the network’s resilience and the effectiveness of various alliances in maintaining operational continuity.
Given the complexity of SAs and their role in the global shipping landscape, it is critical to understand the structural properties of these alliances and their resilience to disruptions. Leveraging MDS data, this paper aims to elucidate the interconnectedness and resilience of SA networks, identifying pivotal nodes and evaluating their impact on alliance stability. Specifically, we will examine variations in network topology, including density, centrality metrics, and connectivity patterns, to assess the robustness of SAs against disturbances. Additionally, to evaluate alliance resilience, we conduct simulations of random and targeted disruptions to test the networks’ ability to withstand challenges and maintain operational continuity. Through this analysis, this paper fills a research gap by focusing on the resilience of specific SAs within the GMCN. It uniquely examines how alliance configurations influence robustness against disruptions, contributing a methodological framework for evaluating the vulnerability and adaptability of maritime logistics networks.
While previous studies have explored the general robustness and network dynamics of GMCN, they often overlook the alliance-specific characteristics that influence resilience, particularly under targeted disruptions. This research uniquely contributes to the field by examining how strategic alliance configurations, such as 2M and Ocean Alliance, impact the resilience and adaptability of the GMCN. By analyzing network topology, centrality metrics, and robustness simulations, our findings reveal distinct strengths and vulnerabilities of specific alliances, providing insights into enhancing global supply chain stability. This targeted focus bridges the existing research gap and informs both academic and practical approaches to maritime logistics resilience.
Understanding the resilience of each shipping alliance is essential for decision-makers to identify strengths and weaknesses within their network structures, which is crucial for strategic planning and risk management. Moreover, it highlights potential vulnerabilities that could be exploited by disruptions, guiding investment in infrastructure and technology to enhance resilience. This analysis offers actionable insights for shipping companies to optimize routes, improve operational efficiency, and ensure continuity in the face of adverse events.
It is important to highlight that to ensure the robustness and reliability of the analysis, this study focuses on data up to 2019, intentionally excluding subsequent years impacted by the COVID-19 pandemic. The rationale behind this decision is to examine logistics and SA dynamics under normal, stable conditions, free from the unprecedented disruptions and anomalies introduced by the pandemic. By using pre-pandemic data, the study avoids potential distortions in trends and patterns that could arise from the volatility of crisis-induced changes, thereby providing insights that are generalizable to typical operational contexts. Future research could extend this work by incorporating post-2019 data to explore how the pandemic has reshaped the sector and affected long-term trends.
2. Literature Review
SAs in the liner shipping industry represent a form of horizontal operational cooperation where carriers share operational data but refrain from exchanging sensitive information, such as pricing or customer lists, in compliance with antitrust regulations [15]. SAs play a crucial role in network-oriented industries like shipping and logistics, allowing members to share resources, reduce operational costs, and achieve economies of scale [16,17]. Despite these advantages, SAs have raised concerns about potential reductions in market competition and possible increases in consumer prices [18,19,20].
Before establishing an SA, carriers typically define their expectations and anticipated benefits [19]. These benefits often include the ability to consolidate cargo, thereby lowering per-unit operating costs through the use of larger vessels and achieving economic goals [21]. However, SAs are subject to antitrust scrutiny due to their potential impact on consumer pricing [15,22]. Since their formalization in 1994 and the subsequent restructuring following Hanjin Shipping’s bankruptcy in 2016, the industry has been dominated by three major alliances: 2M, Ocean Alliance, and The Alliance [4].
Saito et al. (2022) provided an empirical analysis of the GMCN evolution, particularly from 1969 to 1981, a transformative period marked by the emergence of containerization and the reopening of the Suez Canal. Applying graph theory, the authors identified a shift from a single-polar network centered on North American ports to a multipolar structure with distinct regional hubs. Key events like the 1973 oil crisis and the 1975 reopening of the Suez Canal were shown to have catalyzed changes in network density and port centrality. These findings contribute to understanding the adaptive mechanisms of these networks in response to geopolitical and economic disruptions [23].
On the other hand, Shibuya and Shibasaki (2023) analyzed the structural changes in intra-Asian maritime container shipping networks, focusing on the rapid growth in East Asia where large hub ports have emerged. Using graph theory, a developed link prediction model incorporating port performance and geographical constraints like shipping distance was used to evaluate the network. Additionally, the findings demonstrated that the intra-Asian network expanded significantly from 2011 to 2021, driven by increased trade volume and new trading partnerships. However, the study also revealed limitations in predicting the disappearance of links in the network, suggesting the need for further model refinement [24].
Research on SAs frequently focuses on optimizing network design, capacity planning, vessel scheduling, and partner selection through various quantitative methods [25]. While SAs can enhance market competitiveness by promoting resource sharing and cost efficiencies, they also introduce risks related to dependency among carriers and potential conflicts of interest [6]. Additionally, some studies address the tactical and operational challenges within SAs, such as handling heterogeneous ship fleets and managing physical port limitations [26,27].
SAs facilitate economies of scope by expanding service networks and improving service quality [28]. Evaluating the robustness of an SA involves assessing factors like network coverage, service reliability, capacity utilization, and risk management practices [29]. Robustness studies using complex network analysis underscore the importance of connectivity and resilience against potential disruptions [13,14,30,31,32]. Although SAs offer significant operational benefits in the liner shipping industry, they require careful management to mitigate risks and adhere to regulatory standards. More research is necessary to fully understand their impact on market dynamics and pricing [7,22].
Recent studies on maritime network resilience have addressed various dimensions, from cascading failures to cooperative strategies and their impact on network robustness [33]. Focusing on the dynamic resilience of liner shipping networks, highlighting cascading failure models and cooperative mechanisms for load redistribution. This work introduces metrics such as congestion rate, failure rate, and shipper loss to quantify network resilience under disruption scenarios. By demonstrating that cooperative load redistribution can reduce shipper losses by up to 50% in low-resistance scenarios, Additionally, it underscores the value of coordination among ports. However, this study evaluates resilience at a port-to-port level, managing congestion and shipper losses. Nevertheless, their focus on regional resilience lacks an exploration of alliance-specific dynamics.
Other studies analyzed the influence of port cooperation on hierarchical network positions using complex network analysis. Their analysis of the Hanshin port’s cooperative efforts highlights the benefits of achieving economies of scale and improving competitive positioning within maritime networks. Despite these advantages, the study identifies significant challenges, including governance limitations and partial realization of cooperative synergies. Also emphasizing port hierarchy and regional competitiveness, their findings provide a foundation for understanding how cooperation within shipping alliances could enhance resilience and adaptability related to Hanshin port’s [34]. Through complex network analysis, they illustrate the challenges and benefits of port synergies, such as economies of scale, but emphasize that cooperation alone cannot fully mitigate disruptions or ensure resilience regarding SAs.
A different approach is to employ stochastic, game-theoretic models to explore port network resilience and reliability. A co-opetition framework captures the dual pressures of competition and cooperation, proposing robust investment strategies that might shield against multiple disruption scenarios. By integrating expected resiliency and max-min reliability metrics, this paper offers a decision-making tool for optimizing pre-disaster investments in maritime networks. However, the proposed model primarily targets individual ports and their interactions within a competitive market, leaving room for exploring how similar frameworks could be applied at the level of SAs [35].
In another spectrum, resilience analysis can also be found on balancing fairness and cost in humanitarian logistics, employing a three-echelon network structure that includes relief ports, warehouses, and demand areas. By integrating evolutionary metaheuristics with mathematical programming, the HNSGA-II algorithm achieves an efficient trade-off between the two objectives, generating Pareto-optimal solutions. This work highlights the importance of scalable optimization techniques for disaster response and recovery, emphasizing real-world applications of fairness in resource allocation and restoration strategies. Moreover, geographic information systems (GISs) in their research have proven to be helpful tools for analyzing and visualizing network resilience results. GISs can enable the spatial mapping of critical nodes, broken routes, and cascading impacts, offering a clear visual representation of vulnerabilities within the network [36].
In comparison, the present study investigates the resilience of shipping alliances within the GMCN, focusing on topological robustness and alliance-specific vulnerabilities under targeted and random disruptions. Both studies aim to enhance network resilience, yet the domains and approaches diverge: Ransikarbum and Mason [36] emphasize post-disaster humanitarian logistics with a computational focus on relief efficiency and fairness, while this paper examines alliance-level resilience strategies to mitigate cascading failures in maritime networks.
Studies using graph-theoretical approaches to analyze the structural evolution of container networks, highlighting the importance of centrality, connectivity, and the dynamic response to external factors, have been widely used in the GMCN context [3,22,24,37]. However, while Shibuya and Shibasaki (2023) emphasized predictive modeling tailored to contemporary intra-Asian trade, Saito et al. (2022) focused on historical patterns, offering a foundational understanding of network resilience and adaptation [23,24]. Nevertheless, this paper offers granular insights into alliance-specific dynamics, filling a gap in understanding how SAs contribute to and depend on the GMCN’s stability. These perspectives collectively inform strategies for enhancing the resilience of global maritime logistics systems, emphasizing the importance of infrastructure investment, strategic planning, and adaptive policy frameworks of each SA.
This study built on these foundational works by shifting the focus to strategic shipping alliances within the GMCN. While Lu et al. and Tagawa et al. [33,34] analyze resilience and cooperation at the port level, and Asadabadi and Miller-Hooks [35] address network reliability through game-theoretic optimization, this paper uniquely examines alliance-specific robustness. By leveraging insights from these studies, we integrate port and alliance-level perspectives to evaluate how SAs’ dynamics influence resilience planning across the GMCN. This integrated approach provides insights for policymakers and industry leaders, enabling them to understand SA network disruptions and possibly mitigate the cascading impacts of disruptions in each SA, and consequently the global trade. Ultimately, our paper addresses a critical literature gap by directly comparing alliance structures within the GMCN to evaluate their resilience in light of cascading failures, extending the resilience conversation beyond the scope of individual ports or global networks [33,34,35,36].
Furthermore, strategic alliances (SAs) in the shipping industry enable carriers to share operational data while adhering to competition laws, thereby ensuring compliance with antitrust requirements. These alliances, essential to the shipping and logistics sectors, provide members with access to shared resources and operational efficiencies; however, they also raise concerns about market power concentration. The successful formation of SAs depends on setting clear expectations and mutually beneficial outcomes. Since 1994, SAs have evolved to control a significant share of global shipping capacity, addressing strategic, tactical, and operational challenges to optimize profitability, enhance service quality, and maintain stability. While SAs yield cost savings through economies of scale, they also introduce risks, such as dependency on partners and vulnerability to network disruptions. Additionally, SAs improve market coverage and service quality, with robustness often assessed through complex network analysis, focusing on factors like node removal rates and the availability of alternative routes. Overall, SAs enhance collaboration and efficiency in the maritime industry, although they continue to pose challenges that demand ongoing research and careful management.
3. Methodology
3.1. Data Analysis Flow
Figure 1 illustrates the methodology for analyzing the GMCN applied in this paper and explains this section. The flowchart encapsulates the steps, providing a structured overview of the methodology while contextualizing its constraints and theoretical foundations. The methodology and its context are as follows:
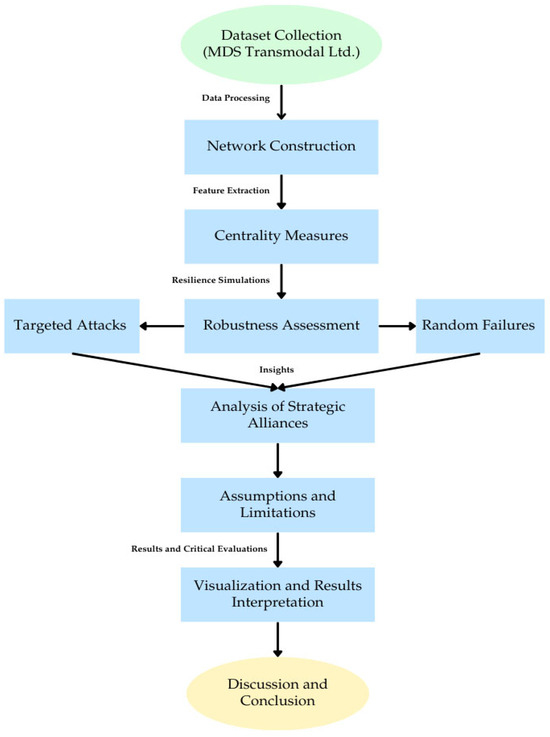
Figure 1.
High-level methodology flow chart.
- Dataset Collection: The study begins with collecting detailed container vessel schedule data from MDS Transmodal Ltd. These data encompass global shipping routes, vessel capacities, and service frequencies, forming the basis for the network model.
- Network Construction: Using a node–edge structure, the network is constructed where nodes represent ports, and edges represent vessel movements. Weights are assigned based on vessel capacity and service frequency.
- Centrality Measures: Centrality metrics, including degree, betweenness, closeness, and eigenvector centrality, are calculated to identify the importance of individual nodes within the network.
- Robustness Assessment: The network undergoes simulations to evaluate resilience under two scenarios: RFs (removal of random nodes) and TAs (removal of high-centrality nodes, sorted from highest to lowest degree centrality).
- Analysis of SAs: The study analyzes the performance and resilience of specific alliances, such as 2M and Ocean Alliance, within the GMCN framework.
- Visualization and Results Interpretation: Key findings are visualized through network maps, highlighting the connectivity and vulnerability of the GMCN.
- Assumptions and Limitations: The study concludes with a critical evaluation, noting the following:
- ⚬
- Assumptions: The network is assumed to exhibit scale-free properties, data from pre-2019 are treated as representative of stable conditions, and uniformity is presumed in vessel scheduling.
- ⚬
- Limitations: The analysis is static, omitting real-time dynamics and temporal changes. Additionally, data quality and completeness may constrain the findings.
Initially, this research examined data across five time periods, spanning from 1998 to 2019, to illustrate the evolution of the global maritime container network (GMCN) and capture gradual changes within the network over time. Analyzing vessel data from these intervals allows researchers to identify long-term trends, fluctuations, and patterns in the global container shipping landscape. This comprehensive temporal scope provides insights into how the GMCN has evolved, adapted, and expanded, shedding light on its structural dynamics and operational resilience.
Despite this examination across five distinct periods, the decision to focus solely on the most recent data from 2019 for alliance analysis was made for practical reasons, given the evolving nature of the container shipping industry. Notably, substantial market changes since 2017, as discussed in Section 1 and Section 2 of this study, have redefined SAs and operational dynamics within the industry. Additionally, the limited presence of robust alliances before 2019 suggests that earlier data may not adequately represent current alliance structures and operational strategies.
To ensure that the findings are relevant and applicable to the current industry context, this study focuses its SA analysis exclusively on the 2019 dataset. This approach allows for an in-depth examination of the latest alliance configurations and operational paradigms within the container shipping sector, thereby enhancing the accuracy and relevance of the study’s conclusions and recommendations. Also, this methodology can be easily applied for different years, when the data are available.
The MDS database provides comprehensive information for each global maritime liner service, including operator identity, service name, alliance details, route specifics, vessel classifications, TEU vessel capacity, service frequency, and port lists. The structured network incorporates all container service routes worldwide, encompassing both international and domestic services. Services with missing or disconnected data were excluded from the network analysis. Consequently, the GMCN is represented by a node–edge structure, where nodes signify ports and edges represent vessel movements between them.
Each service comprises multiple ports, with nodes connected by edges representing each port’s connections within the service. For GMCN analysis, network weights correspond to vessel capacity. The annual vessel capacity is calculated by combining weekly frequency with vessel capacity. Weighted degree centrality is a key measure in this context, as it reflects the relationships between a port and its neighboring ports based on the variability in vessel capacity and service frequency. A higher weighted degree centrality suggests stronger direct connections with other ports.
It is acknowledged that some data points may be missing from the database. In these cases, the corresponding services are systematically excluded from network analysis. The network’s structural framework adheres to a node–edge model, with nodes denoting ports and edges signifying vessel movements between them [28,38,39].
Within the database, service frequency denotes the frequency of ports of call by all vessels engaged in a specific service. Given that multiple vessels may be deployed within each service, Equation (1) is introduced to adjust and ascertain the actual service frequency per vessel deployed in a service ().
where represents the frequency of ports of call by all vessels deployed and denotes the total number of vessels deployed in service s.
The database contains records of the capacity of a single vessel in service s (). Considering that the network incorporates edges between all possible port combinations, the service capacity of a port is initially overestimated as () × . Here, represents the total number of ports within service s. To obtain the actual capacity within service s, a corrective operation is performed. Initially, is multiplied by 2 to account for both import and export activities at a single port. Subsequently, this value is divided by to accurately reflect the vessel capacity attributed to one port. Notably, the deduction of 1 from in Equation (2) serves to exclude the focal port from the calculation. As a result, the weight of the edge between port i and j () is computed in Equation (3). S represents all services that include port i and j.
3.2. Centrality Measures
Centrality metrics in network analysis work to discriminate the nodes that hold significant importance or influence within a given network. These metrics encompass various types, each delineating distinct facet of a node’s significance or prominence within the network structure. Among the relevant types of centralities are:
3.2.1. Degree Centrality
Degree centrality is based on the number of connections a node has. Nodes with a high degree centrality are highly connected to other nodes in the network. In a directed network, there are two variants: in-degree centrality (number of incoming edges) and out-degree centrality (number of outgoing edges). However, if the database does not differentiate each flow, then it is only considered a single flow. The degree of a port can be described in Equation (4). Considering k is the degree of a port i:
In Equation (4), represents the total number of ports in the network and indicates the existence of a direct edge between port i and all other ports j. is set to 1 if ports i and j are directly linked by an edge without intermediary ports, and 0 otherwise. Higher centrality for a port indicates stronger immediate connections with other ports. It is crucial to acknowledge that this computation disregards variations in vessel attributes or distances between nodes. The scale-free nature of a network is a key feature determined by analyzing the probability distribution of node degrees, denoted as P = (degree). A network exhibits a scale-free property when it displays a power-law distribution of degrees, represented by the equation [39,40]. As the power-law exponent γ increases, the prevalence of highly connected nodes, or hubs, decreases, while the occurrence of nodes with fewer connections increases, and both and the exponent gamma in the equation specify how each parameter influences the network scale properties and robustness, and detail the context for using gamma to reflect the power-law distribution, which captures the network’s scale-free characteristics.
Additionally, the weighted degree centrality of a port i resembles degree centrality but considers the diversity of edges, as depicted in Equation (5), considering is the degree centrality of the port I, and is the weight of each node i and j.
In scenarios where all links possess equal weights, the weights transform into the ratio of strength to degree (), resulting in a disparity value of . However, if certain links dominate a node, then the disparity value tends to increase and converge towards 1 [39,40].
3.2.2. Closeness Centrality
The closeness centrality measures how quickly a node can reach all other nodes in the network. It is based on the average shortest path length from a node to all other nodes in the network (Equation (6)), with representing the shortest path distance between node i and node j. is the number of nodes in the network, and is the number of nodes reachable from j. Nodes with high closeness centrality are centrally located and can efficiently disseminate information or influence throughout the network [41,42].
3.2.3. Betweenness Centrality
Betweenness centrality quantifies the extent to which a node lies on the shortest paths between other nodes in the network (Equation (7)) [39,43]. Considering is the total number of shortest paths from node x to node y, and is the number of those paths that pass through node i. Nodes with high betweenness centrality act as bridges or intermediaries between different parts of the network. They play a crucial role in maintaining the flow of information or resources between disparate nodes.
3.2.4. Eigenvector Centrality
Eigenvector centrality evaluates the importance of a node in a network by considering not only its direct connections but also the centrality of its neighboring nodes. It assigns higher centrality scores to nodes connected to other highly central nodes. Eigenvector centrality is particularly useful for identifying influential nodes that are indirectly connected to many other important nodes (Equation (8)) [39].
where represents the adjacency matrix element between node i and node j. is the eigenvector corresponding to the largest eigenvalue λ of the adjacency matrix A.
3.3. Average Shortest Path Length
The average shortest path length (here forth called efficiency) in network theory can be likened to the average distance that information (or goods) needs to travel. The path indicates the number of nodes one must traverse to reach a destination, rather than actual physical distance. A shorter average path length implies a more efficient flow of information or goods within the network. The average path length is calculated by summing the lengths of the shortest paths between all pairs of nodes and then dividing by the total number of pairs, as defined in Equation (9) [37,44,45]. Let represent the shortest path length between vertices i and j, and n denote the number of nodes in the network. The efficiency of the graph is defined as the mean efficiency across all pairs of nodes. This is determined by computing the efficiency for each pair of nodes in the graph, which is the reciprocal of the shortest path distance between the nodes.
3.4. Robustness
In network science, the concept of robustness relates to a network’s capacity to endure perturbations or failures while retaining its structural integrity and operational functionality [45]. Robustness assessment involves evaluating the network’s resilience to various forms of attacks or disruptions, providing insights into its vulnerability and capacity to withstand adverse conditions.
This study investigates two types of network robustness, error and attack robustness. Error robustness concerns the network’s ability to maintain its functionality in the face of random errors or failures. This type of risk is difficult to predict since it might be caused by natural disasters and wars, infectious, etc. [37]. An experiment was conducted by removing random nodes in the network in steps of 10% of the total number of nodes. Note that to find a statistically significant result and to reduce a randomness bias, the average of each parameter for 100 trials was computed. Typically, this number balances computational feasibility and result reliability by minimizing random error effects [46]. It is assumed that the simulations will be done following the characteristics of the weighted network built using Equation (3). The GMCNs are expected to be robust to error risk due to their scale-free network characteristics. The “Error” method considers RFs, in the context of maritime network, such as those seen during the COVID-19 pandemic, where sudden and widespread operational shutdowns occurred. It also relates to incidents like the 2017 cyber-attack on Maersk, which caused global stagnation of APM Terminals Port Elizabeth.
Then, attack robustness is defined as the risk that a high-connected or most important node is attacked by terrorism, sanctions, malfunctioning, etc. Attack risk specifically assesses its resilience against TAs on nodes. This involves the systematic removal of specific nodes based on the degree of centrality criteria. The attack robustness calculation involves quantifying the impact of node or edge removals on the network’s connectivity and overall structure. By systematically testing the network’s response to different attack strategies, we can gain insights into its resilience and identify critical nodes whose removal could significantly disrupt network functionality. This method, as mentioned, focuses on targeted disruptions, like the 2023 accident at the Port of Baltimore where a container ship collapsed a crossing bridge, severely impacting port operations. It also corresponds to major incidents like the explosions at the Port of Tianjin in 2015 and the Port of Beirut in 2020, which had significant localized impacts on port infrastructure and operations. By analyzing robustness through these lenses, we can better prepare for both random and targeted disruptions.
The robustness of the GMCN is calculated for two types of risks, error (or random) and attack risks, as previously mentioned. The average size of non-LCC (largest connected component) ⟨s⟩ in Equation (10) and the ratio of the LCC average size (LCC rate) in Equation (11) were used as indicators of the network partition. Let represent the total number of nodes in the entire network, with n denoting the count of nodes outside of the LCC, indicating the number of such nodes, and representing the number of nodes within the LCC. The network partition signifies a critical point akin to a percolation transition (a critical point where the network splits into smaller isolated components), akin to the division of a large two-dimensional lattice. We define the robustness metric for each global maritime container network as the rate of node removal at which the average size of non-LCC nodes (⟨s⟩) reaches its peak value and the relative size of the diminishes to zero upon the removal of the last node. Thus, the robustness metric spans from 0 to 1, indicating the network’s resilience. Nevertheless, since it is improbable for numerous nodes to be eliminated simultaneously in practical scenarios, robustness is set to 1 if the ratio of removed nodes surpasses one-third of the total nodes [37]. Robustness was tested using simulations of random and targeted node removals, detailed results in Section 4.
4. Preliminary Results
The evolution of the number of ports in relation to the number of service routes and the average vessel size per service route, taken from MDS data and measured in TEUs, is shown in Figure 2. Initially, in 1998, the number of service routes exhibited a comparable magnitude to vessel size, with the growth rate of service routes surpassing that of vessels until 2012. By 2012, the number of service routes had reached 4082, although it had not yet peaked. Conversely, the rate of vessel size continued to escalate, surpassing that of service routes by 2016. Between 2016 and 2019, the average vessel size increased by 502 TEUs, approximately three times more than the growth in service routes. However, the increment in the number of port terminals was modest, with an average annual increase of only 14 terminals from 2016 to 2019. Appendix A, Table A1 shows the top 40 container ports of each year sorted by their weighted centrality degree, and Table A2 shows the metrics for the 2019 top 40 ports in MDS consolidated data.
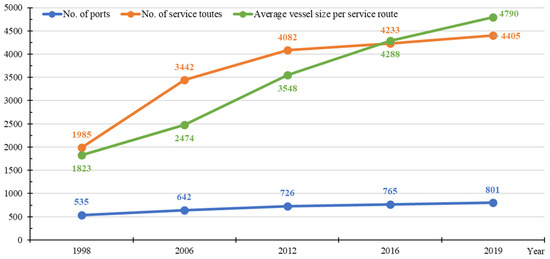
Figure 2.
Panorama of the MDS data container port infrastructure.
Utilizing the MDS dataset, our analysis focuses on delineating the GMCN with respect to various alliances found in the database, which are 2M, Mini Alliance, Ocean Alliance, and The Alliance combined, Ocean Alliance, and The Alliance. Furthermore, we incorporate part of the dataset that excludes any alliance affiliation, as well as the entirety of the data encompassing all alliances. Each service within the dataset comprises essential parameters such as container port routes, frequency of service, and TEUs, among others. By merging the container ports associated with each service across all data pertaining to the studied alliances, we examine the structural dimensions of the network. Table 1 summarizes the network’s configuration in 2019, showing the interconnectedness and spatial distribution of container ports within and across alliances.

Table 1.
Structure of GMCN in 2019.
SAs play a structural role in the global maritime industry, and understanding their constituent companies is key to grasping their operational dynamics. The 2M Alliance comprises Maersk and MSC, two of the largest players in the shipping industry. The Ocean Alliance includes CMA CGM, COSCO Shipping, Evergreen, and OOCL, forming a robust network with extensive global reach. THE Alliance consists of Hapag-Lloyd, ONE, Yang Ming, and HMM, combining their resources to enhance service efficiency and coverage.
In addition to these formal alliances, there exists the “Mini Alliance”. This term refers to collaborative arrangements that merge the strengths of the Ocean Alliance and The Alliance. Although not a formal alliance, these cooperative strategies aim to enhance service offerings and operational flexibility by leveraging the combined capabilities of the member companies. The “Mini Alliance” represents an informal strategic partnership designed to exploit the operational synergies between the Ocean Alliance and The Alliance without establishing a new formal alliance structure.
Using the connections of each SA showed in the Table 1, Figure 3 offers a structural representation of each alliance, showing the interconnectedness of ports based on their participation in SAs. Visually represents the alliance structure within the network, where nodes denote ports, and edges represent the routes that link these ports across various alliances. These subfigures collectively provide a graphically view demonstrating how each alliance contributes to overall network structure and highlighting strategic overlaps, competitive regions, and critical connectivity hubs.
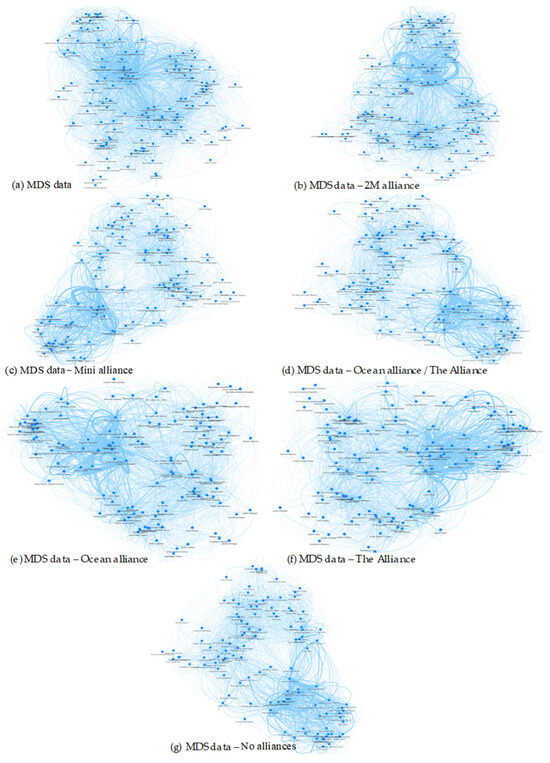
Figure 3.
Network visualization of the MDS data container port infrastructure within SAs.
Figure 3a shows the overall structure of the GMCN with all ports and routes represented, serving as a baseline for comparison with the other subfigures. It provides a view of global connectivity, emphasizing the complexity and density of the network. Figure 3b illustrates the 2M Alliance network; this subfigure highlights ports and routes specific to 2M, such as those of Maersk and MSC. The connectivity pattern suggests a concentrated presence in major trade lanes (e.g., Asia–Europe), with notable high-degree hubs central to the alliance’s strategy. Figure 3c: The Mini Alliance, representing a less formal cooperation between members of the Ocean Alliance and The Alliance is mapped. This subfigure shows selective routes where these members share infrastructure to extend network reach or enhance route flexibility, indicating cooperative hubs that bolster resilience through shared resources. Figure 3d: This visualization shows the overlapping connectivity that reflects high-traffic corridors where the two alliances jointly bolster network density, possibly enhancing the capacity in competitive regions. Figure 3e: Displays the Ocean Alliance and highlights routes served exclusively by its members. It emphasizes the strategic positioning of the alliance, often concentrated in the Asia-Pacific region and major European connections, with key hubs that are vital to the alliance’s independent operational strength. Figure 3f: focuses on THE Alliance’s exclusive routes, illustrating the network maintained solely by Hapag-Lloyd, ONE, Yang Ming, and HMM. It shows primary connections and key hubs that serve The Alliance independently, highlighting its strategic operational areas and major transshipment points. Figure 3g: shows routes and ports without the presence of the major alliances, isolating the “no alliance” routes to examine the independent operators and non-allied segments of the network. This view can reveal niche markets, flexible connections outside of alliance constraints, and how the GMCN would function if these alliances were excluded from the network.
The size of each edge corresponds to its weight within the network. Following the understanding shown in [40], these networks exhibit characteristics of scale-free networks. Certain ports, also known as hubs, serve as major nodes that are highly connected to other ports within the network. These hubs play a critical role in facilitating the flow of goods and act as central points for transshipment and redistribution of cargo. As new shipping routes or services are established, they are more likely to connect to these existing hubs due to their high level of connectivity, a phenomenon known as preferential attachment. This results in a scale-free distribution of connections among ports, where a few hubs have a disproportionately large number of connections compared to most ports, which have fewer connections. Also, it is possible to visually check how the density of each alliance changes in the GMCN. Appendix B shows the top 10 list of centralities, explained in Section 3.1, calculated for each SA in 2019.
To enhance visualization of the network between ports, Figure 4 illustrates global port locations and their interconnections on a world map. Each port’s geographical location (latitude and longitude) was mapped using public data information, then the connections between each port found in the MDS data were plotted with their calculated weights (see Section 3). Each node represents a port, with edges indicating the routes between these ports. The weight or significance of each connection is illustrated using varying line thicknesses and color intensities, with darker and thicker lines representing stronger or more frequently used connections. The network’s scale-free topology is visually apparent, with a few major ports dominating connectivity and numerous smaller ports connected through these hubs. This centralization, while efficient for managing global trade flow, also indicates potential vulnerabilities. High-dependency routes, if disrupted, could create bottlenecks, slowing down international trade.
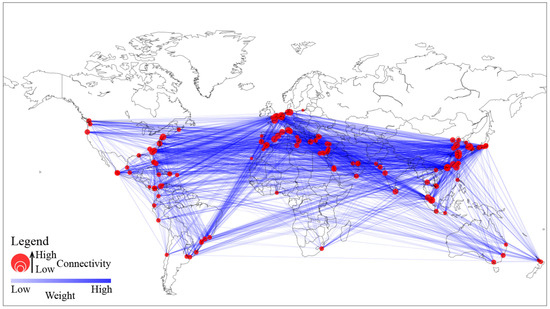
Figure 4.
Geographical connectivity in the network.
It is noteworthy that larger nodes represent ports with a higher number of connections. Additionally, the strength (weights) of the connections is depicted by varying shades of color, with darker shades indicating stronger connections. This map offers insight into the concentration of the GMCN and highlights the main transportation corridors within it. These corridors represent key routes along which significant volumes of containerized cargo flow between major port hubs. Identifying these main transportation corridors is crucial for understanding the dynamics of global trade and optimizing logistical operations within the network.
The visualization underscores the GMCN’s reliance on specific corridors, like those in the South China Sea, the Suez Canal, and the Strait of Malacca. Ports in these areas are not only highly connected but are also critical for route flexibility and operational efficiency. However, this concentration increases the risk for strategic disruptions, as bottlenecks in these areas could impact global trade significantly.
Figure 5 illustrates the resilience of the GMCN when subjected to RFs. In this context, RFs refer to the random removal of ports from the network, simulating scenarios such as unexpected port closures or disruptions. Each subfigure depicts the network’s connectivity and functionality as random nodes (representing ports) are incrementally removed, simulating unexpected closures or minor disruptions. The experiment assesses how the overall connectivity and functionality of the network are affected as a random subset of ports is incrementally removed. The robustness to random port removal underscores the reliability of the network under routine, non-strategic disruptions, a crucial characteristic for operational stability in maritime logistics. Despite multiple removed nodes, the figure underscores the network resilience—likely due to the inherent redundancy provided by its scale-free topology. This structure suggests that random node removals affect primarily lower-degree nodes, maintaining the overall network integrity until the critical point. Figure 5a shows the network’s initial configuration, with nodes connected by edges denoting vessel routes between ports. This starting point illustrates the robustness typically expected in a scale-free network like GMCN, which is composed of a few highly connected hubs and numerous lower-degree nodes. Figure 5b,c demonstrate connectivity as random nodes are progressively removed. The network’s high resilience here is expected, as the chance of removing one of the few essential hubs is low in random failure scenarios. Thus, most connections remain intact even as several ports are removed. Figure 5d highlights network connectivity after significant port removal, potentially up to a critical point.
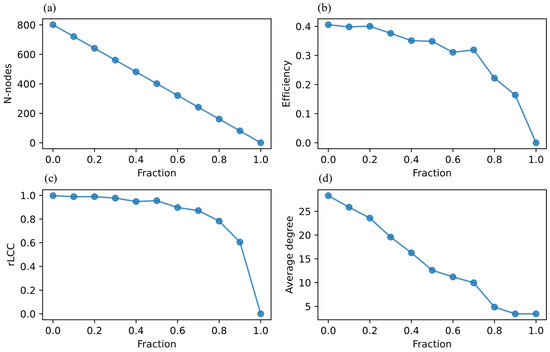
Figure 5.
Random robustness experiment: (a) number of nodes removed per trial (b) calculation of efficiency (c) calculation of connectivity (d) average degree centrality calculations.
Given the scale-free nature of the GMCN, it is expected that the network demonstrates high resilience to RFs. Scale-free networks typically have a few highly connected hubs and many nodes with fewer connections. The random removal of nodes is less likely to target these critical hubs, thus maintaining the network’s integrity. Also, the network maintains a significant portion of its connectivity even as a substantial number of ports are removed, indicating robustness against random disruptions.
Figure 6 examines the vulnerability of the GMCN under targeted attacks, where the most connected and critical nodes (hubs) are systematically removed. This scenario simulates deliberate attacks or strategic failures aimed at the most important ports within the network. The nodes with the highest degree of connectivity are identified and removed sequentially. The impact on network structure shows a decline in network connectivity. In contrast to RFs, TAs on the most connected hubs result in significant fragmentation of the network. The removal of these critical nodes disrupts major pathways and can cause a breakdown in the overall network structure. The figure highlights a contrast to the random robustness experiment, demonstrating that the GMCN is vulnerable to targeted attacks. The decrease in network connectivity with the removal of key hubs underscores the importance of these nodes in maintaining global maritime logistics. Figure 6a presents the network’s structure, similar to Figure 5a, but as a baseline for assessing the impact of targeted removals rather than RFs. Figure 6b shows a significant disruption in connectivity as the most connected nodes are sequentially removed. This phase highlights how the network begins to fragment as essential hubs are removed, making it harder for peripheral nodes to stay connected. Figure 6c demonstrates near-complete fragmentation of the network following the removal of additional critical nodes. At this point, the loss of major hubs has a cascading effect, severely disrupting the flow of goods and the network’s efficiency. Figure 6d–f are the zoom of the first 5 nodes.
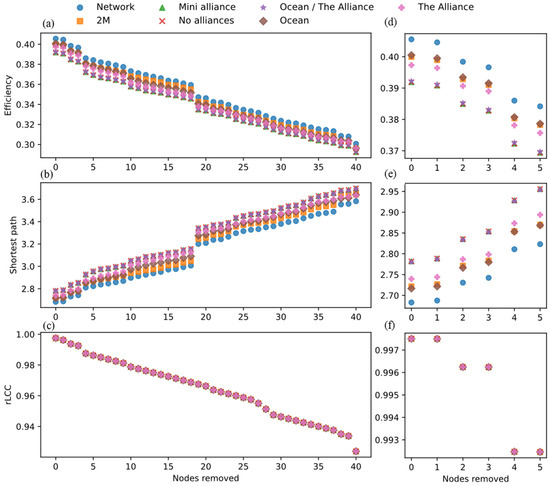
Figure 6.
TAs and vulnerability of each SA, showing vulnerability when critical, highly connected nodes are systematically removed, simulating targeted disruptions like strategic port blockades or attacks. (a) Efficiency calculations (b) shortest path calculations (c) connectivity calculations (d) efficiency for the top 5 ports (e) shortest path for the top 5 ports (f) connectivity for the top 5 ports.
Figure 5 and Figure 6 reveal insights into the structural properties and resilience of the GMCN. While the network exhibits robustness against RFs due to its scale-free topology, it remains susceptible to TAs on its key hubs. These findings underscore the need for strategic planning and enhanced protection measures for critical ports to ensure the stability and continuity of global maritime operations. Understanding these dynamics helps in developing effective risk management strategies to safeguard the network against various types of disruptions. Figure 6 contrasts sharply with Figure 5, where RFs allowed the network to retain connectivity due to the redundancy in peripheral nodes.
To understand which port has higher effect in the network, Figure 7 shows the absolute difference of rLCC for each port in the top 40 ports of the GMCN when TAs are simulated. Certain ports, such as Singapore, Ningbo, Hong Kong, etc., exhibit significant spikes in the difference of rLCC. This indicates that the removal of these ports leads to a substantial decrease in the size of the largest connected component, signifying their critical role in maintaining network connectivity. The high impact of these ports underscores their importance as key hubs within the GMCN, where their disruption could lead to significant fragmentation of the network.
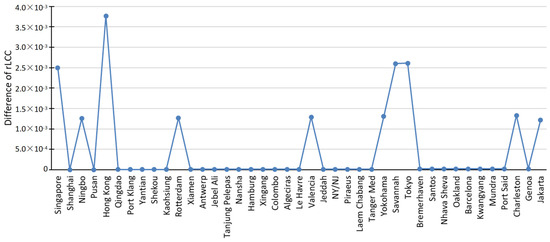
Figure 7.
Absolute difference of each port rLCC.
In contrast, many ports, such as Tanjung Pelepas and Yokohama, show little to no change in rLCC upon their removal. This suggests that their removal does not significantly affect the overall network structure. These ports suggest that there are redundant paths that mitigate the impact of their removal. The minimal impact on rLCC for these ports highlights the network’s resilience to their failure, indicating a robust structure with multiple alternative routes. Also, the magnitude of his variability highlights that some ports are more essential to the network’s integrity than others. Ports with high differences in rLCC are critical hubs, and their removal results in significant network fragmentation. On the other hand, ports with low differences in rLCC contribute to the network’s resilience, ensuring that the removal of these ports does not lead to major disruptions.
The observed divergence between the growth of service routes and vessel capacities aligns with the literature emphasizing economies of scale in liner shipping. Notteboom and Rodrigue (2021) highlight that the drive for cost efficiency has led carriers to adopt larger vessels while reducing service redundancy [47]. This aligns with the results showing that average vessel size increased significantly between 2016 and 2019, whereas service route expansion decelerated. These trends reflect strategic adaptations by SAs to reduce costs per TEU through larger vessels, while simultaneously consolidating routes to maintain high utilization rates. However, such centralization may also introduce vulnerabilities by over-relying on high-density corridors, increasing susceptibility to disruptions [12,33].
The analysis of alliance-specific contributions to the GMCN reveals distinct strategic approaches [23,24]. Formal alliances such as 2M and Ocean Alliance demonstrate hierarchical network designs, leveraging major hubs like Singapore and Shanghai to dominate global trade flows. This structure, while efficient, centralizes risks at high-degree nodes, as evidenced in disruption by Ransikarbum and Mason (2022) [36]. Informal collaborations, such as the Mini Alliance, prioritize operational flexibility and regional adaptability, diversifying connectivity patterns and mitigating single-point failures. These findings are consistent with Tagawa et al. (2022), who argue that diversified connectivity enhances regional resilience but may lack the robustness needed to withstand global-scale disruptions [34].
The visualizations in Figure 3 and Figure 4 underscore the scale-free nature of the GMCN, where a small number of ports act as critical hubs with disproportionately high connectivity. This phenomenon, known as preferential attachment, is widely discussed in network science [30,44,47], emphasizing the efficiency of such structures in facilitating global trade. However, the vulnerability of these hubs to targeted disruptions, as highlighted in Figure 6, raises critical concerns. Asadabadi and Miller-Hooks (2020) suggest that scale-free networks require strategic redundancy planning at critical nodes to balance efficiency with resilience [35]. Integrating these insights into the analysis strengthens the theoretical grounding of the findings and contextualizes them within broader discussions on network science and maritime logistics.
The integration of these findings with existing literature reinforces the significance of alliance configurations and port centrality in shaping the GMCN’s operational stability and resilience. The observed trends not only highlight the dynamic interplay between network evolution and strategic alliance decisions but also underscore the necessity for targeted infrastructural investments at key hubs. As Ransikarbum and Mason (2022) suggest, leveraging real-time data analytics and GIS tools can further enhance our understanding of network vulnerabilities and inform proactive resilience planning [36]. By bridging empirical results with theoretical frameworks, this section lays a solid foundation for transitioning to policy discussions and broader implications, positioning the study as a critical contribution to the discourse on maritime network resilience.
5. Policy Recommendations and Discussion
Implementing resilience strategies across various industries has proven effective in enhancing network robustness and operational continuity. Drawing parallels from these sectors can offer valuable insights for strengthening the GMCN.
In manufacturing, resilience is reinforced through redundancy, robustness, resourcefulness, and rapidity. Redundancy involves incorporating backup systems to ensure continuous operations during failures. Robustness focuses on designing networks capable of withstanding harsh conditions, such as high temperatures and electrical interference. Resourcefulness and rapidity pertain to the ability to respond swiftly and effectively to disruptions, minimizing downtime and maintaining productivity [48].
Resilience in community networks can be achieved by promoting strong relationships and effective communication channels among stakeholders. Implementing systems theory principles, such as decentralization and adaptability, allows these networks to respond to challenges dynamically. For instance, building resilient community networks involves creating a culture that prioritizes resilience, developing actionable plans, and regularly reviewing and adjusting strategies to adapt to changing circumstances [49].
Another example is the Indian Railways Network, that has applied network science-based quantitative methods to measure and enhance resilience. Using network centrality measures, they developed recovery strategies that enable faster and more resource-effective restoration following disruptions. This approach showed that critical nodes are prioritized during recovery, maintaining the overall functionality of the network [50].
The present study evaluates the resilience of shipping alliances by analyzing network topology within the GMCN. Findings indicate that resilience varies across alliances, with Ocean and 2M alliances demonstrating slightly higher resilience due to network coverage, strategic port selection, and robust operational practices. However, this increased resilience also centralizes vulnerability around specific high-traffic hubs, potentially exposing the network to targeted disruptions. Based on these insights, several policy recommendations are proposed to enhance resilience across the GMCN.
The documented resilience of alliances like Ocean and 2M, attributed to high-centrality ports (e.g., Singapore, Shanghai, Ningbo), highlights the Importance of strategic infrastructure enhancement at critical nodes. Rather than a generalized regulatory approach, a more tailored policy for maritime regulatory bodies could include targeted incentives for technology adoption in high-impact hubs. New policies could support alliances in securing critical hubs through advanced monitoring and coordination systems, with incentives or subsidies for real-time analytics platforms that improve network visibility and response capabilities, aiding rapid decision-making during disruptions. For alliances with lower resilience scores, guidelines could emphasize creating infrastructure redundancies such as alternative port linkages or backup transshipment facilities to mitigate single-point vulnerabilities noted in targeted attack simulations.
Mandated resilience audits at high-centrality ports could further enhance that critical infrastructure maintains operational robustness. Audits should assess readiness against diverse disruptions, including cyber-attacks, natural disasters, and operational failures, thus supporting continuity in the global trade network.
For alliances with less extensive networks, targeted infrastructure upgrades are recommended to enhance resilience. This includes investing in port facilities, expanding storage capacities, and improving intermodal connectivity. Standardized emergency response protocols developed collaboratively with industry stakeholders could ensure an efficient and coordinated response to disasters, minimizing both economic impact and downtime.
Encouraging collaboration between alliances to share best practices in resilience planning may yield substantial improvements in overall network robustness. Platforms for knowledge exchange, joint exercises, and collaborative R&D projects focused on network resilience could foster innovation and resilience across the GMCN.
This study’s focus on port-centric resilience highlights structural robustness, yet the multifaceted nature of resilience in shipping alliances necessitates considering alliance-level characteristics. Factors such as service reliability, shipping capacity, and carrier collaboration quality significantly impact overall resilience and should be fundamental to future analyses. Including these dimensions would provide a more holistic view of alliance resilience, capturing the operational and strategic strengths that reinforce stability across the network.
A structured framework for assessing shipping alliance resilience could further clarify the theoretical basis for resilience analysis, detailing the relationships between resilience indicators, network criteria, and key metrics like centrality, redundancy, and robustness. This framework would offer a standardized approach for stakeholders and policymakers to assess and improve resilience, ensuring consistency and scalability in future resilience studies.
The proposed policies in this section are supported by recent advancements in maritime logistics research. For instance, Li et al. (2024) demonstrate that cooperative mechanisms between ports significantly mitigate cascading failures, reducing congestion and economic losses [12]. This finding aligns with the recommendation for targeted infrastructure upgrades and improved collaboration between SAs, emphasizing shared resource utilization to build redundancy in critical hubs. Similarly, Asadabadi and Miller-Hooks (2020) highlight the efficacy of co-opetition strategies in optimizing pre-disruption investments and improving network reliability under various disruption scenarios [35]. This insight justifies the proposed resilience audits and incentivization of advanced monitoring technologies at high-centrality ports, which would proactively address vulnerabilities in alliances like Ocean and 2M. By integrating these policies, stakeholders can improve network robustness while maintaining cost efficiency, leveraging lessons from both port-level and network-wide resilience analyses.
A critical implication is the dependence of alliances like 2M and Ocean on high-centrality hubs such as Singapore and Shanghai. This reliance underscores the importance of strategic infrastructure investments to mitigate single-point vulnerabilities. Policymakers can encourage the development of secondary hubs or transshipment points to diversify traffic flows and reduce the impact of disruptions at primary hubs. Public-private partnerships can play a key role in funding infrastructure development at strategic locations, ensuring robust and resilient supply chains.
The scale-free nature of the GMCN highlights the critical role of high-degree nodes, making advanced monitoring and predictive tools essential. Deploying IoT-enabled sensors and AI-driven analytics can enable real-time monitoring and disruption forecasting at major ports. Alliances should also adopt scenario-based resilience testing to simulate disruptions and refine their contingency plans, ensuring preparedness for both random failures and targeted attacks.
Moreover, the integration of GISs highlights the value of spatial visualization in identifying critical nodes and mapping disruption impacts [14,36]. Policies promoting real-time GIS-based monitoring and scenario-based resilience testing are well-founded, offering a visual and data-driven basis for operational decision-making during disruptions. Tagawa et al. (2022) further reinforce the need for tailored regulatory strategies, showing that hierarchical network dynamics are heavily influenced by cooperative synergies, governance structures, and infrastructural investments [34]. This justifies the policy recommendation for custom-made incentives in high-impact regions, ensuring a balance between SAs competitiveness and network stability. Together, these studies validate the proposed measures, highlighting their ability to boost resilience across the GMCN while promote sustainable growth in global maritime logistics.
Furthermore, the identification of vulnerabilities in specific alliance configurations, particularly their dependence on high-centrality hubs, highlights the potential for cascading disruptions in global trade. Ports such as Singapore and Shanghai, which act as critical nodes within the GMCN, are essential for maintaining trade flows. However, their centrality also makes them points of concentrated risk. Disruptions at these hubs, whether due to natural disasters, cyberattacks, or geopolitical tensions, could severely impact not only regional logistics but also the entire global supply chain.
6. Conclusions
In conclusion, this study provides a comprehensive analysis of SAs within the liner shipping industry, focusing on the network topology and resilience of the GMCN. The findings reveal a complex network structure shaped by distinct alliance configurations, highlighting critical insights into their interconnectedness, resilience, and vulnerabilities. While the GMCN’s scale-free topology imparts robustness against random failures, the study also uncovers significant risks posed by targeted disruptions to high-centrality nodes. This dual characteristic emphasizes the importance of balancing efficiency and redundancy in network design.
Beyond these structural insights, the study offers deeper management implications for improving alliance resilience and operational sustainability. Alliances like Ocean and 2M, which demonstrate higher resilience due to their extensive network coverage and strategic port selection, serve as benchmarks for best practices. However, their dependence on key hubs such as Singapore and Ningbo underscore the importance of investing in infrastructure redundancies and alternative routing strategies to mitigate risks associated with single-point vulnerabilities, highlighting the need for diversified trade routes and enhance critical hubs security. This approach could involve building auxiliary transshipment hubs or diversifying trade lanes to enhance adaptability and reduce bottlenecks in the event of disruptions. Conversely, alliances with lower resilience scores should focus on decentralizing their network structures to distribute traffic more evenly across ports, reducing their exposure to disruptions and increasing operational flexibility.
Moreover, this research emphasizes the transformative role of advanced data analytics and GISs in resilience planning. By providing spatial and network-based visualizations, these tools enable stakeholders to identify critical nodes, simulate disruption scenarios, and prioritize strategic investments. For instance, GISs can be used to map cascading impacts of port closures or disruptions, offering actionable insights for policymakers. Standardized resilience audits at high-centrality ports, supported by these technologies, can ensure that key nodes maintain operational integrity during crises. Further, leveraging real-time analytics and predictive modeling could enhance the responsiveness of alliances to emerging risks such as cyberattacks or extreme weather events.
Collaboration among alliances emerges as another critical factor in enhancing the GMCN’s resilience. Joint R&D initiatives and platforms for sharing best practices can foster innovation in resilience strategies. Collaborative efforts to develop standardized emergency response protocols and conduct joint simulations can prepare alliances to respond more cohesively to large-scale disruptions. These efforts not only strengthen individual alliances but also contribute to the stability of the broader GMCN, ensuring that global trade continues uninterrupted even in challenging circumstances.
By framing resilience as a multi-dimensional challenge that integrates operational, strategic, and technological considerations, this study contributes to a more nuanced understanding of shipping alliances. The findings highlight the necessity of embedding resilience as a core principle in alliance management, moving beyond reactive measures to proactive and adaptive strategies. As previously stated, proactively addressing network vulnerabilities through targeted infrastructure investments and enhanced resilience strategies can mitigate risks and maintain network continuity. For example, investing in secondary hubs, as seen in other industries, can help diversify traffic flows, and distribute risks more evenly. Also, adopting real-time monitoring systems and advanced predictive analytics enables early detection of potential disruptions, allowing alliances to take preemptive actions.
Future research should expand on these insights by integrating real-time data from IoT-enabled monitoring systems for real-time data collection, machine learning algorithms for predictive analytics, and scenario-based simulations to explore how network dynamics adapt during crises, exploring intermodal transport connectivity, and examining the impacts of geopolitical risks on alliance performance. Additionally, the same methodology could be applied to evaluate the GMCN during the COVID-19 pandemic, the post-pandemic recovery phase, and the current stabilized environment. This would provide valuable insights into how the network adapted under extreme stress conditions and identify lessons for enhancing resilience against future global disruptions. Such advancements will ensure that the GMCN remains robust, adaptive, and capable of supporting global trade in an increasingly dynamic and uncertain environment.
Author Contributions
Conceptualization, T.N.M.; methodology, T.N.M.; software, T.N.M.; validation, T.N.M.; formal analysis, T.N.M.; investigation, T.N.M.; resources, Y.S.; data curation, T.N.M., T.K. and Y.A.; writing—original draft preparation, T.N.M.; writing—review and editing, T.N.M.; visualization, T.N.M.; supervision, T.N.M.; project administration, T.N.M.; funding acquisition, T.N.M. All authors have read and agreed to the published version of the manuscript.
Funding
This research received no external funding.
Data Availability Statement
Data are contained within the article.
Conflicts of Interest
The authors declare no conflicts of interest.
Appendix A
Top 40 container ports using the degree of centrality. The weighted degree of centrality, calculated according to the methodology shown in Section 3, of ports throughout all years. Top ports exhibit a high weighted degree centrality. Thus, a high weighted degree centrality port indicates that it is extensively connected to other ports within the network. In other words, top port serves as a pivotal hub, linking numerous other ports.
Table A1.
Top 40 container ports of each MDS year data.
Table A1.
Top 40 container ports of each MDS year data.
| 1998 | 2006 | 2012 | 2016 | 2019 | |
|---|---|---|---|---|---|
| 1 | Hong Kong (Hong Kong) | Hong Kong (Hong Kong) | Singapore (Singapore) | Singapore (Singapore) | Singapore (Singapore) |
| 2 | Singapore (Singapore) | Singapore (Singapore) | Hong Kong (Hong Kong) | Shanghai (China) | Shanghai (China) |
| 3 | Kaohsiung (China) | Shanghai (China) | Shanghai (China) | Ningbo (China) | Ningbo (China) |
| 4 | Rotterdam (Netherlands) | Pusan (Korea) | Ningbo (China) | Hong Kong (Hong Kong) | Pusan (Korea) |
| 5 | Pusan (Korea) | Yantian (China) | Yantian (China) | Pusan (Korea) | Hong Kong (Hong Kong) |
| 6 | Kobe (Japan) | Kaohsiung (China) | Pusan (Korea) | Port Klang (Malaysia) | Qingdao (China) |
| 7 | Yokohama (Japan) | Ningbo (China) | Port Klang (Malaysia) | Yantian (China) | Port Klang (Malaysia) |
| 8 | Nagoya (Japan) | Rotterdam (Netherlands) | Rotterdam (Netherlands) | Rotterdam (Netherlands) | Yantian (China) |
| 9 | Tokyo (Japan) | Port Klang (Malaysia) | Kaohsiung (China) | Qingdao (China) | Shekou (China) |
| 10 | Le Havre (France) | Hamburg (Germany) | Qingdao (China) | Kaohsiung (China) | Rotterdam (Netherlands) |
| 11 | Felixstowe (UK) | Antwerp (Belgium) | Shekou (China) | Jebel Ali (UAE) | Kaohsiung (China) |
| 12 | Keelung (China) | Yokohama (Japan) | Xiamen (China) | Antwerp (Belgium) | Xiamen (China) |
| 13 | Hamburg (Germany) | Chiwan/Shekou (China) | Tanjung Pelepas (Malaysia) | Xiamen (China) | Antwerp (Belgium) |
| 14 | Port Klang (Malaysia) | Xiamen (China) | Hamburg (Germany) | Tanjung Pelepas (Malaysia) | Jebel Ali (UAE) |
| 15 | NY/NJ (USA) | Tokyo (Japan) | Jebel Ali (UAE) | Shekou (China) | Tanjung Pelepas (Malaysia) |
| 16 | Colombo (Sri Lanka) | Qingdao (China) | Antwerp (Belgium) | Hamburg (Germany) | Nansha (China) |
| 17 | Oakland (USA) | Bremerhaven (Germany) | Jeddah (Saudi Arabia) | Chiwan/Shekou (China) | Hamburg (Germany) |
| 18 | Antwerp (Belgium) | Felixstowe (UK) | Bremerhaven (Germany) | Colombo (Sri Lanka) | Xingang (China) |
| 19 | Osaka (Japan) | Port Said (Egypt) | Xingang (China) | Xingang (China) | Colombo (Sri Lanka) |
| 20 | Long Beach (USA) | Le Havre (France) | Chiwan/Shekou (China) | Nansha (China) | Algeciras (Spain) |
| 21 | Charleston (USA) | NY/NJ (USA) | Nansha (China) | Algeciras (Spain) | Le Havre (France) |
| 22 | Bremerhaven (GER) | Nagoya (Japan) | Felixstowe (UK) | Bremerhaven (Germany) | Valencia (Spain) |
| 23 | Shanghai (China) | Tanjung Pelepas (Malaysia) | Tokyo (Japan) | Jeddah (Saudi Arabia) | Jeddah (Saudi Arabia) |
| 24 | Norfolk (USA) | Oakland (USA) | Yokohama (Japan) | Valencia (Spain) | NY/NJ (USA) |
| 25 | Los Angeles (USA) | Kobe (Japan) | Colombo (Sri Lanka) | Le Havre (France) | Piraeus (Greece) |
| 26 | Santos (Brazil) | Jeddah (Saudi Arabia) | Le Havre (France) | Kwangyang (Korea) | Laem Chabang (Thailand) |
| 27 | Gioia Tauro (Italy) | Shekou (China) | Valencia (Spain) | Felixstowe (UK) | Tanger Med (Morocco) |
| 28 | Jeddah (Saudi Arabia) | Los Angeles (USA) | Port Said (Egypt) | Port Said (Egypt) | Yokohama (Japan) |
| 29 | Valencia (Spain) | Norfolk (USA) | New York/New Jersey (US) | New York/New Jersey (US) | Savannah (USA) |
| 30 | Yantian (China) | Colombo (Sri Lanka) | Kwangyang (Korea) | Tokyo (Japan) | Tokyo (Japan) |
| 31 | Seattle (USA) | Santos (Brazil) | Santos (Brazil) | Laem Chabang (Thailand) | Bremerhaven (Germany) |
| 32 | Algeciras (Spain) | Jebel Ali (UAE) | Algeciras (Spain) | Yokohama (Japan) | Santos (Brazil) |
| 33 | Miami (USA) | Savannah (USA) | Oakland (USA) | Savannah (USA) | Nhava Sheva (India) |
| 34 | Barcelona (Spain) | Kwangyang (Korea) | Savannah (USA) | Oakland (USA) | Oakland (USA) |
| 35 | Manzanillo (Panama) | Long Beach (USA) | Laem Chabang (Thailand) | Nhava Sheva (India) | Barcelona (Spain) |
| 36 | Lae Chabang (Thailand) | Xingang (China) | Dalian (China) | Norfolk (USA) | Kwangyang (Korea) |
| 37 | Piraeus (Greece) | Algeciras (Spain) | Norfolk (USA) | Santos (Brazil) | Mundra (India) |
| 38 | Buenos Aires(Argentina) | Valencia (Spain) | Nagoya (Japan) | Dalian (China) | Port Said (Egypt) |
| 39 | Melbourne (Australia) | Laem Chabang (Thailand) | Los Angeles (USA) | Ho Chi Minh (Viet Nam) | Charleston (USA) |
| 40 | Sydney (Australia) | Keelung (China) | Salalah (Oman) | Tanger Med (Morocco) | Genoa (Italy) |
Table A2.
Top 40 container ports metrics.
Table A2.
Top 40 container ports metrics.
| Ports | Degree | Centrality | Betweenness | Closeness | Clustering | |
|---|---|---|---|---|---|---|
| 1 | Singapore (Singapore) | 276 | 0.34500 | 0.05786 | 0.58358 | 0.15916 |
| 2 | Shanghai (China) | 268 | 0.33500 | 0.08714 | 0.57682 | 0.15297 |
| 3 | Ningbo (China) | 255 | 0.31875 | 0.04360 | 0.57473 | 0.17755 |
| 4 | Pusan (Korea) | 247 | 0.30875 | 0.13014 | 0.56534 | 0.14624 |
| 5 | Hong Kong (Hong Kong) | 238 | 0.29750 | 0.05095 | 0.56494 | 0.18721 |
| 6 | Qingdao (China) | 213 | 0.26625 | 0.03383 | 0.55125 | 0.19612 |
| 7 | Port Klang (Malaysia) | 204 | 0.25500 | 0.03072 | 0.54935 | 0.21202 |
| 8 | Yantian (China) | 203 | 0.25375 | 0.02468 | 0.54859 | 0.21426 |
| 9 | Shekou (China) | 202 | 0.25250 | 0.04452 | 0.54935 | 0.19955 |
| 10 | Rotterdam (Netherlands) | 184 | 0.23000 | 0.04768 | 0.53567 | 0.20189 |
| 11 | Kaohsiung (China) | 176 | 0.22000 | 0.02051 | 0.52369 | 0.22994 |
| 12 | Xiamen (China) | 171 | 0.21375 | 0.01860 | 0.52821 | 0.24176 |
| 13 | Antwerp (Belgium) | 165 | 0.20625 | 0.01489 | 0.53032 | 0.26157 |
| 14 | Jebel Ali (UAE) | 157 | 0.19625 | 0.02222 | 0.52856 | 0.26580 |
| 15 | Tanjung Pelepas (Malaysia) | 150 | 0.18750 | 0.01892 | 0.51388 | 0.25074 |
| 16 | Nansha (China) | 149 | 0.18625 | 0.01809 | 0.52266 | 0.29730 |
| 17 | Hamburg (Germany) | 149 | 0.18625 | 0.01272 | 0.52438 | 0.29739 |
| 18 | Xingang (China) | 147 | 0.18375 | 0.02515 | 0.51925 | 0.24769 |
| 19 | Colombo (Sri Lanka) | 145 | 0.18125 | 0.03675 | 0.51992 | 0.21916 |
| 20 | Algeciras (Spain) | 141 | 0.17625 | 0.02522 | 0.49969 | 0.25319 |
| 21 | Le Havre (France) | 139 | 0.17375 | 0.01670 | 0.50095 | 0.25837 |
| 22 | Valencia (Spain) | 136 | 0.17000 | 0.01478 | 0.50830 | 0.25076 |
| 23 | Jeddah (Saudi Arabia) | 136 | 0.17000 | 0.02216 | 0.50444 | 0.25327 |
| 24 | NY/NJ (USA) | 136 | 0.17000 | 0.01804 | 0.51322 | 0.28181 |
| 25 | Piraeus (Greece) | 136 | 0.17000 | 0.01367 | 0.51756 | 0.32200 |
| 26 | Laem Chabang (Thailand) | 128 | 0.16000 | 0.01358 | 0.51059 | 0.32333 |
| 27 | Tanger Med (Morocco) | 127 | 0.15875 | 0.01492 | 0.51790 | 0.34596 |
| 28 | Yokohama (Japan) | 124 | 0.15500 | 0.03268 | 0.49906 | 0.29622 |
| 29 | Savannah (USA) | 123 | 0.15375 | 0.02216 | 0.50221 | 0.32067 |
| 30 | Tokyo (Japan) | 121 | 0.15125 | 0.00920 | 0.50508 | 0.30978 |
| 31 | Bremerhaven (Germany) | 117 | 0.14625 | 0.00776 | 0.47779 | 0.29369 |
| 32 | Santos (Brazil) | 115 | 0.14375 | 0.00817 | 0.51223 | 0.39481 |
| 33 | Nhava Sheva (India) | 111 | 0.13875 | 0.00741 | 0.50000 | 0.38624 |
| 34 | Oakland (USA) | 111 | 0.13875 | 0.00679 | 0.47981 | 0.30106 |
| 35 | Barcelona (Spain) | 107 | 0.13375 | 0.01442 | 0.49288 | 0.31899 |
| 36 | Kwangyang (Korea) | 103 | 0.12875 | 0.00475 | 0.49906 | 0.41196 |
| 37 | Mundra (India) | 99 | 0.12375 | 0.00523 | 0.47608 | 0.36075 |
| 38 | Port Said (Egypt) | 99 | 0.12375 | 0.00694 | 0.47438 | 0.32529 |
| 39 | Charleston (USA) | 98 | 0.12250 | 0.00378 | 0.50444 | 0.45487 |
| 40 | Genoa (Italy) | 96 | 0.12000 | 0.03053 | 0.43144 | 0.29518 |
Appendix B
Top 10 container ports calculated by centrality of 2019 for each SA, showing the scale-free characteristics of the networks, and the importance of ports within the SA. Few ports with high degree centrality and mostly of ports with low centrality.
Table A3.
2019 top 10 centrality degree container ports of each SA.
Table A3.
2019 top 10 centrality degree container ports of each SA.
| 2019-Ports | Centrality Degree | |
|---|---|---|
| CMCN | ||
| 1 | Singapore (Singapore) | 0.34500 |
| 2 | Shanghai (China) | 0.33500 |
| 3 | Ningbo (China) | 0.31875 |
| 4 | Pusan (Korea) | 0.30875 |
| 5 | Hong Kong (Hong Kong) | 0.29750 |
| 6 | Qingdao (China) | 0.26625 |
| 7 | Port Klang (Malaysia) | 0.25500 |
| 8 | Yantian (China) | 0.25375 |
| 9 | Shekou (China) | 0.25250 |
| 10 | Rotterdam (The Netherlands) | 0.23000 |
| 2M Alliance | ||
| 1 | Shanghai (China) | 0.32250 |
| 2 | Pusan (Republic of Korea) | 0.30625 |
| 3 | Ningbo (China) | 0.29500 |
| 4 | Rotterdam (The Netherlands) | 0.29250 |
| 5 | Singapore (Singapore) | 0.27250 |
| 6 | Qingdao (China) | 0.23875 |
| 7 | Antwerp (Belgium) | 0.23875 |
| 8 | Shekou (China) | 0.21500 |
| 9 | Hong Kong (Hong Kong) | 0.21375 |
| 10 | Hamburg (Germany) | 0.19500 |
| Mini Alliance | ||
| 1 | Shanghai (China) | 0.27785 |
| 2 | Rotterdam (The Netherlands) | 0.27034 |
| 3 | Pusan (Republic of Korea) | 0.26408 |
| 4 | Ningbo (China) | 0.25282 |
| 5 | Singapore (Singapore) | 0.24280 |
| 6 | Qingdao (China) | 0.22153 |
| 7 | Antwerp (Belgium) | 0.21652 |
| 8 | Shekou (China) | 0.19900 |
| 9 | Hong Kong (Hong Kong) | 0.19775 |
| 10 | Hamburg (Germany) | 0.19149 |
| Ocean Alliance/The Alliance | ||
| 1 | Shanghai (China) | 0.27910 |
| 2 | Rotterdam (The Netherlands) | 0.27034 |
| 3 | Pusan (Republic of Korea) | 0.26658 |
| 4 | Ningbo (China) | 0.25282 |
| 5 | Singapore (Singapore) | 0.24406 |
| 6 | Qingdao (China) | 0.22403 |
| 7 | Antwerp (Belgium) | 0.21652 |
| 8 | Hong Kong (Hong Kong) | 0.20275 |
| 9 | Shekou (China) | 0.20025 |
| 10 | Hamburg (Germany) | 0.19149 |
| Ocean Alliance | ||
| 1 | Shanghai (China) | 0.32500 |
| 2 | Ningbo (China) | 0.30125 |
| 3 | Pusan (Republic of Korea) | 0.29875 |
| 4 | Rotterdam (The Netherlands) | 0.29125 |
| 5 | Singapore (Singapore) | 0.28375 |
| 6 | Qingdao (China) | 0.25250 |
| 7 | Hong Kong (Hong Kong) | 0.23500 |
| 8 | Antwerp (Belgium) | 0.23250 |
| 9 | Shekou (China) | 0.23250 |
| 10 | Port Klang (Malaysia) | 0.21875 |
| The Alliance | ||
| 1 | Shanghai (China) | 0.30000 |
| 2 | Pusan (Republic of Korea) | 0.28875 |
| 3 | Rotterdam (The Netherlands) | 0.28750 |
| 4 | Ningbo (China) | 0.27625 |
| 5 | Singapore (Singapore) | 0.26250 |
| 6 | Qingdao (China) | 0.24125 |
| 7 | Antwerp (Belgium) | 0.23875 |
| 8 | Hong Kong (Hong Kong) | 0.22750 |
| 9 | Hamburg (Germany) | 0.21875 |
| 10 | Shekou (China) | 0.21625 |
| No Alliance | ||
| 1 | Shanghai (China) | 0.27785 |
| 2 | Rotterdam (The Netherlands) | 0.27034 |
| 3 | Pusan (Republic of Korea) | 0.26408 |
| 4 | Ningbo (China) | 0.25282 |
| 5 | Singapore (Singapore) | 0.24280 |
| 6 | Qingdao (China) | 0.22153 |
| 7 | Antwerp (Belgium) | 0.21652 |
| 8 | Shekou (China) | 0.19900 |
| 9 | Hong Kong (Hong Kong) | 0.19775 |
| 10 | Hamburg (Germany) | 0.19149 |
Table A4.
2019 top 10 Betweenness centrality degree container ports of each SA.
Table A4.
2019 top 10 Betweenness centrality degree container ports of each SA.
| 2019-Ports | Betweenness Degree | |
|---|---|---|
| CMCN | ||
| 1 | Shanghai (China) | 0.66438 |
| 2 | Singapore (Singapore) | 0.50250 |
| 3 | Rotterdam (The Netherlands) | 0.32059 |
| 4 | Pusan (Republic of Korea) | 0.27770 |
| 5 | Jebel Ali (UAE) | 0.07298 |
| 6 | Manzanillo (PA) (Panama) | 0.06844 |
| 7 | Piraeus (Greece) | 0.06787 |
| 8 | Algeciras (Spain) | 0.06711 |
| 9 | Antwerp (Belgium) | 0.06603 |
| 10 | Hong Kong (Hong Kong) | 0.04869 |
| 2M Alliance | ||
| 1 | Singapore (Singapore) | 0.53556 |
| 2 | Shanghai (China) | 0.46030 |
| 3 | Rotterdam (The Netherlands) | 0.28581 |
| 4 | Pusan (Republic of Korea) | 0.28030 |
| 5 | Antwerp (Belgium) | 0.10120 |
| 6 | Santos (Brazil) | 0.08139 |
| 7 | Algeciras (Spain) | 0.08129 |
| 8 | Cartagena (CO) (Colombia) | 0.07079 |
| 9 | Jebel Ali (UAE) | 0.06748 |
| 10 | Bremerhaven (Germany) | 0.06162 |
| Mini Alliance | ||
| 1 | Singapore (Singapore) | 0.56158 |
| 2 | Rotterdam (The Netherlands) | 0.24301 |
| 3 | Shanghai (China) | 0.23300 |
| 4 | Nhava Sheva (India) | 0.22069 |
| 5 | Pusan (Republic of Korea) | 0.21872 |
| 6 | Antwerp (Belgium) | 0.13614 |
| 7 | Santos (Brazil) | 0.13410 |
| 8 | Jebel Ali (UAE) | 0.12352 |
| 9 | Cartagena (CO) (Colombia) | 0.08802 |
| 10 | Ambarli (Turkey) | 0.06039 |
| Ocean Alliance/The Alliance | ||
| 1 | Singapore (Singapore) | 0.56116 |
| 2 | Rotterdam (The Netherlands) | 0.24212 |
| 3 | Shanghai (China) | 0.23679 |
| 4 | Nhava Sheva (India) | 0.21719 |
| 5 | Pusan (Republic of Korea) | 0.21023 |
| 6 | Santos (Brazil) | 0.13406 |
| 7 | Antwerp (Belgium) | 0.13388 |
| 8 | Jebel Ali (UAE) | 0.12224 |
| 9 | Cartagena (CO) (Colombia) | 0.08592 |
| 10 | Algeciras (Spain) | 0.06325 |
| Ocean Alliance | ||
| 1 | Singapore (Singapore) | 0.52396 |
| 2 | Shanghai (China) | 0.48532 |
| 3 | Rotterdam (The Netherlands) | 0.35327 |
| 4 | Pusan (Republic of Korea) | 0.26581 |
| 5 | Port Klang (Malaysia) | 0.14391 |
| 6 | Antwerp (Belgium) | 0.11534 |
| 7 | Piraeus (Greece) | 0.09267 |
| 8 | Santos (Brazil) | 0.08891 |
| 9 | Jebel Ali (UAE) | 0.08530 |
| 10 | Cartagena (CO) (Colombia) | 0.07403 |
| The Alliance | ||
| 1 | Singapore (Singapore) | 0.69255 |
| 2 | Shanghai (China) | 0.30384 |
| 3 | Pusan (Republic of Korea) | 0.30154 |
| 4 | Rotterdam (The Netherlands) | 0.25182 |
| 5 | Antwerp (Belgium) | 0.08975 |
| 6 | Manzanillo (PA) (Panama) | 0.08664 |
| 7 | Cartagena (CO) (Colombia) | 0.07505 |
| 8 | Jeddah (Saudi Arabia) | 0.06855 |
| 9 | Jebel Ali (UAE) | 0.06598 |
| 10 | Piraeus (Greece) | 0.06360 |
| No Alliance | ||
| 1 | Singapore (Singapore) | 0.55994 |
| 2 | Rotterdam (The Netherlands) | 0.24301 |
| 3 | Shanghai (China) | 0.23543 |
| 4 | Nhava Sheva (India) | 0.22061 |
| 5 | Pusan (Republic of Korea) | 0.21203 |
| 6 | Antwerp (Belgium) | 0.13614 |
| 7 | Santos (Brazil) | 0.13459 |
| 8 | Jebel Ali (UAE) | 0.12352 |
| 9 | Cartagena (CO) (Colombia) | 0.08814 |
| 10 | Hong Kong (Hong Kong) | 0.06123 |
Table A5.
2019 top 10 Closeness centrality degree container ports of each SA.
Table A5.
2019 top 10 Closeness centrality degree container ports of each SA.
| 2019-Ports | Closeness Degree | |
|---|---|---|
| CMCN | ||
| 1 | Ningbo (China) | 23.09414 |
| 2 | Shanghai (China) | 23.09414 |
| 3 | Singapore (Singapore) | 23.09094 |
| 4 | Pusan (Republic of Korea) | 23.08046 |
| 5 | Port Klang (Malaysia) | 23.07844 |
| 6 | Qingdao (China) | 23.02961 |
| 7 | Hong Kong (Hong Kong) | 23.02682 |
| 8 | Shekou (China) | 23.01447 |
| 9 | Rotterdam (The Netherlands) | 23.00573 |
| 10 | Yantian (China) | 22.99651 |
| 2M Alliance | ||
| 1 | Shanghai (China) | 22.57062 |
| 2 | Port Klang (Malaysia) | 22.56651 |
| 3 | Singapore (Singapore) | 22.56651 |
| 4 | Ningbo (China) | 22.56335 |
| 5 | Pusan (Republic of Korea) | 22.54576 |
| 6 | Hong Kong (Hong Kong) | 22.46699 |
| 7 | Shekou (China) | 22.46691 |
| 8 | Tanjung Pelepas (Malaysia) | 22.46378 |
| 9 | Qingdao (China) | 22.43215 |
| 10 | Colombo (Sri Lanka) | 22.38990 |
| Mini Alliance | ||
| 1 | Singapore (Singapore) | 21.75920 |
| 2 | Port Klang (Malaysia) | 21.75920 |
| 3 | Shanghai (China) | 21.71250 |
| 4 | Ningbo (China) | 21.70293 |
| 5 | Hong Kong (Hong Kong) | 21.66675 |
| 6 | Pusan (Republic of Korea) | 21.65820 |
| 7 | Shekou (China) | 21.63897 |
| 8 | Nhava Sheva (India) | 21.63157 |
| 9 | Tanjung Pelepas (Malaysia) | 21.62138 |
| 10 | Colombo (Sri Lanka) | 21.60047 |
| Ocean Alliance/The Alliance | ||
| 1 | Port Klang (Malaysia) | 21.77106 |
| 2 | Singapore (Singapore) | 21.77106 |
| 3 | Shanghai (China) | 21.72763 |
| 4 | Ningbo (China) | 21.71062 |
| 5 | Hong Kong (Hong Kong) | 21.67991 |
| 6 | Pusan (Republic of Korea) | 21.67450 |
| 7 | Shekou (China) | 21.66161 |
| 8 | Nhava Sheva (India) | 21.64350 |
| 9 | Tanjung Pelepas (Malaysia) | 21.63307 |
| 10 | Colombo (Sri Lanka) | 21.61211 |
| Ocean Alliance | ||
| 1 | Shanghai (China) | 22.59861 |
| 2 | Ningbo (China) | 22.59556 |
| 3 | Port Klang (Malaysia) | 22.58929 |
| 4 | Singapore (Singapore) | 22.58929 |
| 5 | Pusan (Republic of Korea) | 22.55398 |
| 6 | Hong Kong (Hong Kong) | 22.52048 |
| 7 | Qingdao (China) | 22.50966 |
| 8 | Shekou (China) | 22.48208 |
| 9 | Rotterdam (The Netherlands) | 22.44694 |
| 10 | Tanjung Pelepas (Malaysia) | 22.42866 |
| The Alliance | ||
| 1 | Singapore (Singapore) | 22.51059 |
| 2 | Port Klang (Malaysia) | 22.51059 |
| 3 | Shanghai (China) | 22.48597 |
| 4 | Ningbo (China) | 22.47150 |
| 5 | Pusan (Republic of Korea) | 22.46322 |
| 6 | Hong Kong (Hong Kong) | 22.44066 |
| 7 | Shekou (China) | 22.41133 |
| 8 | Colombo (Sri Lanka) | 22.37353 |
| 9 | Tanjung Pelepas (Malaysia) | 22.35942 |
| 10 | Laem Chabang (Thailand) | 22.35270 |
| No Alliance | ||
| 1 | Singapore (Singapore) | 21.75694 |
| 2 | Port Klang (Malaysia) | 21.75694 |
| 3 | Shanghai (China) | 21.71054 |
| 4 | Ningbo (China) | 21.70097 |
| 5 | Hong Kong (Hong Kong) | 21.65935 |
| 6 | Pusan (Republic of Korea) | 21.65551 |
| 7 | Shekou (China) | 21.63762 |
| 8 | Nhava Sheva (India) | 21.62933 |
| 9 | Tanjung Pelepas (Malaysia) | 21.61914 |
| 10 | Colombo (Sri Lanka) | 21.59823 |
Table A6.
2019 top 10 Eigenvector centrality degree container ports of each SA.
Table A6.
2019 top 10 Eigenvector centrality degree container ports of each SA.
| 2019-Ports | Eigenvector Degree | |
|---|---|---|
| CMCN | ||
| 1 | Shanghai (China) | 0.40532 |
| 2 | Singapore (Singapore) | 0.39626 |
| 3 | Ningbo (China) | 0.35776 |
| 4 | Pusan (Republic of Korea) | 0.28110 |
| 5 | Hong Kong (Hong Kong) | 0.24972 |
| 6 | Port Klang (Malaysia) | 0.22549 |
| 7 | Qingdao (China) | 0.21780 |
| 8 | Shekou (China) | 0.20045 |
| 9 | Yantian (China) | 0.19808 |
| 10 | Kaohsiung (Taiwan) | 0.16409 |
| 2M Alliance | ||
| 1 | Singapore (Singapore) | 0.39760 |
| 2 | Shanghai (China) | 0.38997 |
| 3 | Ningbo (China) | 0.34365 |
| 4 | Pusan (Republic of Korea) | 0.28593 |
| 5 | Hong Kong (Hong Kong) | 0.25424 |
| 6 | Port Klang (Malaysia) | 0.25079 |
| 7 | Shekou (China) | 0.22317 |
| 8 | Qingdao (China) | 0.19417 |
| 9 | Tanjung Pelepas (Malaysia) | 0.17341 |
| 10 | Kaohsiung (Taiwan) | 0.16232 |
| Mini Alliance | ||
| 1 | Singapore (Singapore) | 0.40887 |
| 2 | Shanghai (China) | 0.35148 |
| 3 | Ningbo (China) | 0.30990 |
| 4 | Port Klang (Malaysia) | 0.30734 |
| 5 | Hong Kong (Hong Kong) | 0.29594 |
| 6 | Pusan (Republic of Korea) | 0.25485 |
| 7 | Shekou (China) | 0.24992 |
| 8 | Qingdao (China) | 0.19250 |
| 9 | Kaohsiung (Taiwan) | 0.19232 |
| 10 | Tanjung Pelepas (Malaysia) | 0.13359 |
| Ocean Alliance/The Alliance | ||
| 1 | Singapore (Singapore) | 0.41078 |
| 2 | Shanghai (China) | 0.35476 |
| 3 | Ningbo (China) | 0.30681 |
| 4 | Port Klang (Malaysia) | 0.30415 |
| 5 | Hong Kong (Hong Kong) | 0.29677 |
| 6 | Shekou (China) | 0.25529 |
| 7 | Pusan (Republic of Korea) | 0.25342 |
| 8 | Qingdao (China) | 0.19920 |
| 9 | Kaohsiung (Taiwan) | 0.18981 |
| 10 | Nansha (China) | 0.13190 |
| Ocean Alliance | ||
| 1 | Singapore (Singapore) | 0.39612 |
| 2 | Shanghai (China) | 0.38555 |
| 3 | Ningbo (China) | 0.35673 |
| 4 | Port Klang (Malaysia) | 0.29722 |
| 5 | Hong Kong (Hong Kong) | 0.27254 |
| 6 | Pusan (Republic of Korea) | 0.23565 |
| 7 | Shekou (China) | 0.22457 |
| 8 | Qingdao (China) | 0.22220 |
| 9 | Kaohsiung (Taiwan) | 0.18072 |
| 10 | Yantian (China) | 0.14036 |
| The Alliance | ||
| 1 | Singapore (Singapore) | 0.41375 |
| 2 | Shanghai (China) | 0.36857 |
| 3 | Ningbo (China) | 0.31561 |
| 4 | Hong Kong (Hong Kong) | 0.29491 |
| 5 | Pusan (Republic of Korea) | 0.27791 |
| 6 | Port Klang (Malaysia) | 0.27485 |
| 7 | Shekou (China) | 0.24214 |
| 8 | Kaohsiung (Taiwan) | 0.20338 |
| 9 | Qingdao (China) | 0.19971 |
| 10 | Laem Chabang (Thailand) | 0.12105 |
| No Alliance | ||
| 1 | Singapore (Singapore) | 0.40758 |
| 2 | Shanghai (China) | 0.35346 |
| 3 | Ningbo (China) | 0.31179 |
| 4 | Port Klang (Malaysia) | 0.30917 |
| 5 | Hong Kong (Hong Kong) | 0.29411 |
| 6 | Shekou (China) | 0.25138 |
| 7 | Pusan (Republic of Korea) | 0.24996 |
| 8 | Qingdao (China) | 0.19356 |
| 9 | Kaohsiung (Taiwan) | 0.19346 |
| 10 | Tanjung Pelepas (Malaysia) | 0.13438 |
References
- Haralambides, H.E. Gigantism in Container Shipping, Ports and Global Logistics: A Time-Lapse into the Future. Marit. Econ. Logist. 2019, 21, 1–60. [Google Scholar] [CrossRef]
- UNCTAD. Review of Maritime Transport; UNCTAD: New York, NY, USA, 2020. [Google Scholar]
- Cariou, P.; Guillotreau, P. Capacity Management by Global Shipping Alliances: Findings from a Game Experiment. Marit. Econ. Logist. 2022, 24, 41–66. [Google Scholar] [CrossRef]
- Alphaliner. Alphaliner Top 100. 2023. Available online: https://alphaliner.axsmarine.com/PublicTop100/ (accessed on 25 October 2024).
- Merk, O.; Teodoro, A. Alternative Approaches to Measuring Concentration in Liner Shipping. Marit. Econ. Logist. 2022, 24, 723–746. [Google Scholar] [CrossRef]
- Ducruet, C. The Geography of Maritime Networks: A Critical Review. J. Transp. Geogr. 2020, 88, 102824. [Google Scholar] [CrossRef]
- Ghorbani, M.; Acciaro, M.; Transchel, S.; Cariou, P. Strategic Alliances in Container Shipping: A Review of the Literature and Future Research Agenda. Marit. Econ. Logist. 2022, 24, 439–465. [Google Scholar] [CrossRef]
- Jasper, C.; Tan, C. China Blocks European Shipping Pact, Sending Maersk Down. Available online: https://www.bloomberg.com/news/articles/2014-06-17/china-rejects-shipping-alliance-application-by-maersk-msc-cma?embedded-checkout=true (accessed on 25 October 2024).
- MAERSK. Maersk Line, MSC and CMA CGM to Establish an Operational Alliance. 2013. Available online: https://www.maersk.com/news/articles/2013/06/18/maersk-line-msc-and-cma-cgm-to-establish-an-operational-alliance (accessed on 25 October 2024).
- Quartieri, F. Are Vessel Sharing Agreements Pro-Competitive? Econ. Transp. 2017, 11–12, 33–48. [Google Scholar] [CrossRef]
- Hirata, E. Service Recovery and Customer Satisfaction in Container Liner Shipping Industry—An Ordered Logit Approach. Int. J. Shipp. Transp. Logist. 2020, 12, 563. [Google Scholar] [CrossRef]
- Li, L.; Wan, Y.; Yang, D. Do Shipping Alliances Affect Freight Rates? Evidence from Global Satellite Ship Data. Transp. Res. Part A Policy Pract. 2024, 181, 104010. [Google Scholar] [CrossRef]
- Nair, A.; Vidal, J.M. Supply Network Topology and Robustness against Disruptions—An Investigation Using Multi-Agent Model. Int. J. Prod. Res. 2011, 49, 1391–1404. [Google Scholar] [CrossRef]
- Zhao, K.; Kumar, A.; Harrison, T.P.; Yen, J. Analyzing the Resilience of Complex Supply Network Topologies Against Random and Targeted Disruptions. IEEE Syst. J. 2011, 5, 28–39. [Google Scholar] [CrossRef]
- Panayides, P.M.; Wiedmer, R. Strategic Alliances in Container Liner Shipping. Res. Transp. Econ. 2011, 32, 25–38. [Google Scholar] [CrossRef]
- Tjemkes, B.; Vos, P.; Burgers, K. Strategic Alliance Management. Available online: https://www.routledge.com/Strategic-Alliance-Management/Tjemkes-Vos-Burgers/p/book/9781032119250?srsltid=AfmBOoq1ZwQBe2rAg0Hn0PkE2AYQOc2nD1cb8uv_Jz4GYzHq2L-BY9WR (accessed on 25 October 2024).
- Gayle, P.G.; Xie, X. Firms’ Markup, Cost, and Price Changes When Policymakers Permit Collusion: Does Antitrust Immunity Matter? J. Econ. Behav. Organ. 2019, 157, 680–707. [Google Scholar] [CrossRef]
- Bilotkach, V. Price Competition between International Airline Alliances. J. Transp. Econ. Policy 2004, 39 Pt 2, 167–189. [Google Scholar] [CrossRef]
- Bilotkach, V.; Hüschelrath, K. Airline Alliances, Antitrust Immunity, and Market Foreclosure. Rev. Econ. Stat. 2013, 95, 1368–1385. [Google Scholar] [CrossRef]
- Hüschelrath, K.; Müller, K. Market Power, Efficiencies, and Entry Evidence from an Airline Merger. Manag. Decis. Econ. 2015, 36, 239–255. [Google Scholar] [CrossRef]
- Huang, S.T.; Yoshida, S. Analysis of Key Factors for Formation of Strategic Alliances in Liner Shipping Company: Service Quality Perspective on Asia/Europe Route after Global Economic Crisis. Int. J. Econ. Manag. Eng. 2013, 7, 1414–1418. [Google Scholar] [CrossRef]
- Chen, J.; Ye, J.; Zhuang, C.; Qin, Q.; Shu, Y. Liner Shipping Alliance Management: Overview and Future Research Directions. Ocean Coast. Manag. 2022, 219, 106039. [Google Scholar] [CrossRef]
- Saito, T.; Shibasaki, R.; Murakami, S.; Tsubota, K.; Matsuda, T. Global Maritime Container Shipping Networks 1969–1981: Emergence of Container Shipping and Reopening of the Suez Canal. J. Mar. Sci. Eng. 2022, 10, 602. [Google Scholar] [CrossRef]
- Shibuya, K.; Shibasaki, R. Modeling Structural Changes in Intra-Asian Maritime Container Shipping Networks Considering Their Characteristics. Sustainability 2023, 15, 10055. [Google Scholar] [CrossRef]
- Arslan, O.; Archetti, C.; Jabali, O.; Laporte, G.; Grazia Speranza, M. Minimum Cost Network Design in Strategic Alliances. Omega 2020, 96, 102079. [Google Scholar] [CrossRef]
- Agarwal, R.; Ergun, Ö. Ship Scheduling and Network Design for Cargo Routing in Liner Shipping. Transp. Sci. 2008, 42, 175–196. [Google Scholar] [CrossRef]
- Asgari, N.; Farahani, R.Z.; Goh, M. Network Design Approach for Hub Ports-Shipping Companies Competition and Cooperation. Transp. Res. Part A Policy Pract. 2013, 48, 1–18. [Google Scholar] [CrossRef]
- Tovar, B.; Hernández, R.; Rodríguez-Déniz, H. Container Port Competitiveness and Connectivity: The Canary Islands Main Ports Case. Transp. Policy 2015, 38, 40–51. [Google Scholar] [CrossRef]
- Ferrari, C.; Parola, F.; Benacchio, M. Network Economies in Liner Shipping: The Role of Home Markets. Marit. Policy Manag. 2008, 35, 127–143. [Google Scholar] [CrossRef]
- Albert, R.; Jeong, H.; Barabási, A.-L. Error and Attack Tolerance of Complex Networks. Nature 2000, 406, 378–382. [Google Scholar] [CrossRef] [PubMed]
- Thadakamalla, H.P.; Raghavan, U.N.; Kumara, S.; Albert, R. Survivability of multiagent-based supply networks: A topological perspect. In IEEE Intelligent Systems Survivability of Multiagent-Based Supply Networks: A Topological Perspective A Topological Perspective; IEEE: New York, NY, USA, 2004. [Google Scholar]
- Adenso-Díaz, B.; Mar-Ortiz, J.; Lozano, S. Assessing Supply Chain Robustness to Links Failure. Int. J. Prod. Res. 2018, 56, 5104–5117. [Google Scholar] [CrossRef]
- Lu, B.; Sun, Y.; Wang, H.; Wang, J.-J.; Shuai Liu, S.; Cheng, T.C.E. Dynamic Resilience Analysis of the Liner Shipping Network: From Structure to Cooperative Mechanism. Transp. Res. E Logist. Transp. Rev. 2024, 191, 103755. [Google Scholar] [CrossRef]
- Tagawa, H.; Kawasaki, T.; Hanaoka, S. Evaluation of International Maritime Network Configuration and Impact of Port Cooperation on Port Hierarchy. Transp. Policy 2022, 123, 14–24. [Google Scholar] [CrossRef]
- Asadabadi, A.; Miller-Hooks, E. Maritime Port Network Resiliency and Reliability through Co-Opetition. Transp. Res. E Logist. Transp. Rev. 2020, 137, 101916. [Google Scholar] [CrossRef]
- Ransikarbum, K.; Mason, S.J. A Bi-Objective Optimisation of Post-Disaster Relief Distribution and Short-Term Network Restoration Using Hybrid NSGA-II Algorithm. Int. J. Prod. Res. 2022, 60, 5769–5793. [Google Scholar] [CrossRef]
- Kawasaki, T.; Yotsushima, T. Topological Features for the Robustness of Global Supply Chain Networks. Res. Sq. 2023. [Google Scholar] [CrossRef]
- Tocchi, D.; Sys, C.; Papola, A.; Tinessa, F.; Simonelli, F.; Marzano, V. Hypergraph-Based Centrality Metrics for Maritime Container Service Networks: A Worldwide Application. J. Transp. Geogr. 2022, 98, 1–45. [Google Scholar] [CrossRef]
- Sugimura, Y.; Akakura, Y.; Yotsushima, T.; Kawasaki, T. Evaluation of Japanese Port Policies through Network Analysis. Transp. Policy 2023, 135, 59–70. [Google Scholar] [CrossRef]
- Boccaletti, S.; Latora, V.; Moreno, Y.; Chavez, M.; Hwang, D.U. Complex Networks: Structure and Dynamics. Phys. Rep. 2006, 424, 175–308. [Google Scholar] [CrossRef]
- Freeman, L.C. Centrality in Social Networks Conceptual Clarification. Soc. Netw. 1978, 1, 215–239. [Google Scholar] [CrossRef]
- Wasserman, S.; Faust, K. Social Network Analysis; Cambridge University Press: Cambridge, UK, 1994; ISBN 9780521387071. [Google Scholar]
- Brandes, U. A Faster Algorithm for Betweenness Centrality. J. Math. Sociol. 2001, 25, 163–177. [Google Scholar] [CrossRef]
- Newman, M. Networks; Oxford University Press: Oxford, UK, 2010; ISBN 9780199206650. [Google Scholar]
- Brintrup, A.; Ledwoch, A.; Barros, J. Topological Robustness of the Global Automotive Industry. Logist. Res. 2016, 9, 1. [Google Scholar] [CrossRef]
- Raychaudhuri, S. Introduction to Monte Carlo Simulation. In Proceedings of the 2008 Winter Simulation Conference, Miami, FL, USA, 7–10 December 2008; IEEE: New York, NY, USA, 2008; pp. 91–100. [Google Scholar]
- Notteboom, T.; Rodrigue, J.-P. Maritime Container Terminal Infrastructure, Network Corporatization, and Global Terminal Operators: Implications for International Business Policy. J. Int. Bus. Policy 2023, 6, 67–83. [Google Scholar] [CrossRef]
- Martel, H. How to Build Resilient Industrial Networks and Reduce Downtime. Available online: https://www.controleng.com/articles/how-to-build-resilient-industrial-networks-and-reduce-downtime/ (accessed on 22 December 2024).
- Derr, A. How To Build Resilient Community Networks: 7 Tips From Systems Theory. Available online: https://visiblenetworklabs.com/2024/01/17/how-to-build-resilient-community-networks/ (accessed on 22 December 2024).
- Bhatia, U.; Kumar, D.; Kodra, E.; Ganguly, A.R. Network Science Based Quantification of Resilience Demonstrated on the Indian Railways Network. PLoS ONE 2015, 10, e0141890. [Google Scholar] [CrossRef]
Disclaimer/Publisher’s Note: The statements, opinions and data contained in all publications are solely those of the individual author(s) and contributor(s) and not of MDPI and/or the editor(s). MDPI and/or the editor(s) disclaim responsibility for any injury to people or property resulting from any ideas, methods, instructions or products referred to in the content. |
© 2025 by the authors. Licensee MDPI, Basel, Switzerland. This article is an open access article distributed under the terms and conditions of the Creative Commons Attribution (CC BY) license (https://creativecommons.org/licenses/by/4.0/).