Abstract
Background: A multi-faceted analysis of the positioning of logistics facilities relative to airports is a topical aspect of the interconnections between transport infrastructure and the spatial configuration of economic activities. Regardless of the wide range of studies that exist on the topic, little is known about the logistics catchment of airports. Towards extending the literature, the objective of the paper is to analyse the spatial configuration of logistics firms relative to Cape Town International Airport (CTIA) in South Africa. Methods: The inclination of logistics facilities to locate in industrial areas is widely acknowledged in the literature. As such, the data on the main industrial and economic nodes in the City of Cape Town metropolitan area were obtained from the City of Cape Town municipality and used to ascertain the extent of the industrial areas across the metropolitan area. The resultant geographic information system (GIS) shapefile of the industrial and economic nodes was used to obtain the logistics firms’ data from AfriGIS. Following the cleaning of the data from AfriGIS, ArcGIS 10.8 and QGIS 3.16 were used for spatial analysis (buffer, kernel density and network analysis) to establish the spatial configuration of the logistics firms relative to CTIA. Results: The results showed that of the 985 logistics firms in the metropolitan area, 937 were located within 20 km of CTIA. Furthermore, the kernel density results showed that high density values were found in the environs of the Cape Town central business district (CBD), Port of Cape Town and Milnerton. The results of the network analysis indicated that the furthest firm was 50 km and 64 min away on the shortest route to CTIA, while it was 55 km and 49 min away on the fastest route. Conclusions: Relative to the literature, the results show that CTIA has the potential to facilitate the emergence of a logistics hub at the city or metropolitan scale.
1. Introduction
As exemplified by the normative models of airport-led development, an analysis of the location of logistics facilities is a topical theme of the nexus between transport infrastructure and the spatial configuration of economic activities. As encapsulated in the airport city and the aerotropolis, the models are used worldwide to inform policies, plans and strategies on urban and regional development. Owing to the dependency of particular economic activities on the aviation infrastructure and services, the airport city model aspires to concentrate urban development in the immediate surrounds of the airport [1,2]. It is anticipated that as the airport city matures, development would radiate outward and stretch for miles from the airport, resulting in the spatial form of the aerotropolis [2,3]. The aerotropolis, therefore, contains an airport as the core of the airport city, enclosed by a stretch of development in which mainly manufacturing- and aviation-related logistics businesses are located to take advantage of the proximity to the airport [4].
In light of the interest in airports, as epitomised by the models of airport-led development, there is a wide range of studies on the positioning of logistics facilities relative to airports. The literature can be classified into three overlapping themes, namely: the concentration of logistics facilities in the vicinity of airports [5,6,7,8,9,10,11,12,13,14,15,16,17,18,19,20,21,22,23,24,25,26,27,28,29,30,31,32,33]; metropolitan areas and regions as logistics hubs [34,35,36,37]; and the airfreight catchment of airports [38,39,40,41,42].
As reflected by the aforementioned themes of the literature (also refer to Section 2), the majority of the studies focus on the analysis of logistics facilities, which are situated in the immediate vicinity of airports, particularly those involved in warehousing, distribution and wholesale activities. This dominant focus calls for an extension to the analysis of logistics facilities, which are located beyond the environs of airports. Based on this background, the objective of this paper is to analyse the spatial configuration of logistics firms relative to Cape Town International Airport (CTIA) in South Africa.
The rest of the paper is structured as follows: Section 2 reviews the literature that is relevant to the topic of the spatial configuration of logistics facilities relative to airports. Section 3 provides a brief overview of the study area. Section 4 outlines the research design and methods used. Section 5 presents and discusses the findings. Section 6 concludes the paper with recommendations for future research.
2. Literature Review
This section presents the findings of the literature that is relevant to the spatial configuration of logistics facilities relative to airports, followed by the identification of the literature’s strengths and weaknesses. The findings of the literature are subsequently incorporated into the interpretation of the study’s results in Section 4.
2.1. Concentration of Logistics Facilities in the Vicinity of Airports
A number of researchers focus on the development of methods for identifying logistics clusters, i.e., the geographical concentration of firms that provide logistics services [17]; some apply the established methods, while others advance proposals on how the clustering of logistics facilities can be achieved in the vicinity of airports. Önden et al. [20] established a method for evaluating logistics centre locations wherein the factors considered included the proximity to airports, seaports, railways and highways. Similarly, Rivera et al. [17] developed and applied a method for identifying logistics clusters in the United States of America (USA) and identified seven largest clusters, which included the environs of the following airports: Hartfield–Jackson Atlanta, Dallas–Fort Worth (the core of the Dallas cluster) and Miami. Focusing on the airport economic zone relative to Dalian Airport in China, Wang et al. [26] proposed a method for determining the structure of a basic airport industry cluster wherein it was found that the airport logistics facilities were mainly located within 10 km of the airport. This result was obtained after the following relationships were factored in: logistical relationships, non-logistical relationships and equal consideration of the logistical and non-logistical relationships [26].
Focusing on the study area of Singapore, Raguraman [7] analysed ways in which the hubbing of the logistical chain can take place through the clustering of logistics activities. To facilitate the handling and movement of cargo, the proposal centred on integrating the essential facilities in an airfreight complex situated on the airport premises so as to provide for the efficient cargo handling. Rolko and Friedrich [24] analysed the spatial and structural patterns of logistics locations in Germany wherein among other locations, a cluster was identified in the vicinity of Frankfurt Airport. In the state of Victoria, Australia, Chhetri et al. [15] delineated spatial logistics employment clusters and discovered airport-dependent logistics services around the suburbs in the vicinity of Tullamarine and Essendon airports. These clusters accommodated freight business parks, freight transshipment activities, business activity centres, freight storage and handling activities. Kumar et al. [23] analysed the transportation and logistics clusters across the USA and assessed whether jobs in the clusters could be explained by the intensity of the transport infrastructure in the region. It was discovered that the airports, following the intermodals, had a large effect on jobs. In Spain, Holl and Marioti [25] complemented the aforementioned studies with a finding that on average, logistics firms were located closer to the airports, highways and seaports than the firms in other sectors.
Focusing on Chongqing, in China, Li et al. [32] examined whether the planned logistics parks attracted the establishments in a way that was significant enough to change the spatial configuration of logistics activities. One of the logistics parks analysed was situated in the vicinity of Jiangbei International Airport, in a suburban context. It was discovered that the majority of the logistics establishments in the suburban area had low co-location, reflecting that the logistics parks in those areas were not popular among the logistics establishments. In Sweden, Olsson and Woxenius [16] investigated the potential for establishing urban freight consolidation centres for small road hauliers delivering goods to the retail sector in the Gothenburg region. Although the investigations did not particularly focus on the airport, the maps produced by the authors showed that, compared to other areas in the region, the environs of the airport accommodated fewer freight forwarders.
A great number of the studies analysed the location of warehousing, distribution, wholesale and allied activities relative to airports. In South Africa, it was uncovered that warehouse businesses had the lowest airport inclination factor of the air-cargo-related businesses analysed relative to OR Tambo International Airport [21]. Focusing on Los Angeles, Yuan [27] tested the relationship between the spatial distribution of warehouses and the neighbourhoods with different demographic and socioeconomic characteristics. Among the transport access variables analysed, access to the nearest airport was found to be marginally significant.
Against this backdrop, a multitude of studies discovered a strong trend of the positioning of warehousing in the vicinity of airports. The seminal study of Bowen [11] examined the degree to which warehousing establishments moved towards the areas with good accessibility to air, sea, rail and highway systems in the USA. It was discovered that the number of the establishments in 2005, and the 1998 to 2005 growth in the number of the establishments were significantly correlated with the accessibility to the air and/or highway networks. Building on the work of Bowen, Van den Heul et al. [18] analysed the relationship between freight accessibility and the employment patterns in the USA. Considering four transportation modes (road, air, maritime and rail), the study discovered that, at a county level, there was a relationship between freight accessibility and employment, implying that the counties with better accessibility accommodated more logistics employment. Similarly, Sivitanidou [6] investigated the factors that attracted the 812 warehousing and distribution facilities in the USA, exploring the variables of distance to Los Angeles, Glendale–Burbank–Pasadena and John Wayne airports; the closest seaport; and the rail infrastructure. The results yielded the statistical significance of the distance to the airports, showing the importance of air transportation in the location-choice decisions of warehousing and distribution establishments. In the examination of warehousing and distribution activities, it was discovered that the patterns of logistics land development were influenced by the access to airports and highways [12].
McMillen and McDonald [8] investigated the effects that the access to transportation facilities had on the employment density in the Chicago metropolitan area, in the USA. The variables investigated were distance to O’Hare Airport, Chicago CBD, the nearest commuter station and the highway interchanges. The study identified twenty subcentres, of which two (Addison and O’Hare) were located adjacent to O’Hare Airport. Showing the relationship between airports and the location of warehousing; manufacturing and transportation, communications, utilities and warehousing activities dominated the mix of these two centres. Heitz, Launay and Beziat [22] established a method for collecting the data on logistics facilities and established a database of warehouse and transport terminals in the Paris region for 2015. It was uncovered that transport infrastructure such as Charles de Gaulle Airport (and highway intersections) encouraged the clustering of warehouses. In the analysis of the spatial patterns of freight in Canada, Woudsma and Jakubicek [30] discovered the emergence of logistics establishments around Calgary Airport. Similarly, in Winnipeg, there was a growing number of warehouses in the vicinity of the airport. In Montreal, there was a slight increase in the number of establishments near Mirabel Airport; albeit a decrease in the concentration of warehouses was uncovered near Trudeau International Airport [30]. Still in Canada, in the analysis of the relationship between land-use patterns and transport infrastructure, Gingerich and Maoh [28] discovered a significant concentration of warehouses situated within 7 km of Pearson International Airport. Interestingly, there are studies that uncovered the propensity of warehousing facilities to locate in the vicinity of decommissioned airports. For instance, McKinnon [13] discovered a cluster of warehousing and distribution facilities at a disused military airfield in the West Midlands, United Kingdom (UK).
Related to the aforementioned literature, a number of studies focused specifically on the positioning of wholesale, parcel and allied activities relative to airports. Shukla and Waddell [5] examined the location decisions of the firms in Dallas–Fort Worth (the USA), with Dallas–Fort Worth Airport, the highways and the CBDs analysed to uncover their impact on the placement of the firms. Among others, the study found that, given the role of Dallas as a distribution centre of regional and national significance, access to the airport was critical for the wholesale firms in light of their role in the storage and distribution processes. In Belgium, Strale [29] discovered that while the majority of the wholesale jobs were located in the central part of the Brussels region, other logistics activities (such as freight forwarding and warehousing) preferred the suburbs, especially areas close to the highways and the airport. Sakai et al. [33] analysed the location choices for logistics facility development in the Paris region and discovered that the areas with the highest number of wholesale jobs were the clusters of wholesale establishments close to Charles de Gaulle and Paris Orly airports. Relatedly, De Silva et al. [31] analysed the spatial organisation and the locational characteristics of e-commerce logistics in Japan and the UK. In the UK, logistics facilities were, among other areas, found to locate within 20 km radii of the airports. Given that during the busy shopping seasons, Amazon utilised dedicated cargo aircraft, access to the airport infrastructure was significant. Raimbault et al. [14] compared the spatial logics in the Paris region with regard to parcel service terminals, distribution centres and inland ports. The study discovered that the parcel service activities typically concentrated around the zones such as airports, ports and logistics parks. Heitz and Beziat [19] discovered a similar pattern in a study of the placement of parcel logistics facilities in the Paris region, with a high concentration of the parcel industry identified around the infrastructure such as Charles de Gaulle and Orly airports.
2.2. Metropolitan Areas and Regions as Logistics Hubs
Rather than limiting the analysis to airports and their environs, a number of studies focused on corridors, metropolitan areas and functional regions. Hesse [35] analysed the city of Luxembourg, which emerged as the airfreight hub due to the availability of the aviation infrastructure as well as its advantageous location in Western Europe. The airfreight companies were also found to use the former US airbase, a pattern similar to the findings of McKinnon [13] with regard to the placement of logistics facilities in the vicinity of decommissioned airports. Notably, Hesse [35] argued that Luxembourg thrived as the airfreight hub despite the competition from airports in the neighbouring countries, such as Paris Charles de Gaulle, Frankfurt and Amsterdam airports. In a related study, Sundarakani [37] analysed the factors that augmented Dubai as the ideal location for a logistics hub. The factors uncovered included Jebel Ali Port, which is positioned in the vicinity of Dubai International Airport. Another crucial factor was Al Maktoum International Airport, which is one of the busiest airports in the world. At a regional scale, Rodrigue [34] analysed the freight transportation relative to the Boston–Washington Corridor, which accommodated 13 major airports, seaports and other intermodal facilities. These facilities provided continuity of the global, national and regional freight distribution and contributed to the articulation function in their specific metropolitan areas. The two major airports in the New York metropolitan area were found to be important in handling a large portion of freight [34]. In a related study, Shen et al. [36] analysed the concept of a multi-airport logistics system (MLS), which exists in territories that have multiple airports. An MLS is a complex formed by an integrated set of airports, logistics parks and free-trade zones encompassing various components of the air cargo industry. One of the characteristics of an MLS is the spatial concentration, which strengthens the interactions between logistics firms at different airports.
2.3. Airfreight Catchment of Airports
Closely related to the foregoing presentation, a number of studies analysed the airfreight catchment of airports, which can span multiple geographical scales. In the analysis of the airfreight catchment of selected airports in Europe, Boonekamp [40] discovered that 95% of the freight handled at Amsterdam Schiphol Airport originated within an access distance of about 1250 km of said airport, which extended to the neighbouring countries. Further pointing to the existence of multi-country catchments, Heinitz et al. [41] analysed the spatial configuration of the hinterlands of the air cargo hubs in Europe wherein it was discovered that the majority of the road feeder service connections stretched from as far as England to Italy. Complemented by (and in a way explaining) the findings of Boonekamp [40] on the catchment of Amsterdam Schiphol, the authors identified a particularly dense schedule between Schiphol, London Heathrow and Paris Charles De Gaulle airports, while the hubs such as Frankfurt, Copenhagen, Milan Malpensa and Vienna airports were also found to attract additional air cargo demand through the surface transport. Boonekamp and Burghouwt [42] added that large hub carriers compete for airfreight through the road feeder networks, which are essential for transporting the shipments (from other airports or consolidation areas) to the respective hubs. Focusing on one of the aforementioned airports at a different geographical scale, in an earlier study, Hoare [38] plotted Heathrow Airport’s share of freight so as to approximate the extent of the catchment, and it was uncovered that the breakpoint for the agents’ shipments was around 240 km. Showing the monopoly of Heathrow Airport in the south-east region, it was only beyond the boundaries of the region that it was feasible for the firms to ship through other airports. In the analysis of the airfreight flows relative to Hong Kong International Airport, Zhang [39] discovered that although Hong Kong was a major source of cargo, its significance rested largely on its role as the hub for the cargo originating from the broader Pearl River Delta region. For such traffic, Hong Kong Airport faced competition from the neighbouring airports, which shared the catchment area of the region. As such, and while noting the wide gap in the years the studies were conducted, Hong Kong Airport was not a monopoly in the region unlike Heathrow Airport per the study of Hoare [38].
2.4. Analysis of the Literature
Building upon the foregoing overview, this section critically reviews the literature to identify its strengths and weaknesses [43] and to accordingly assess the extent to which the literature deals with the topic of the spatial configuration of logistics firms relative to airports. A connection can be established between airports and the spatial configuration of logistics facilities at different geographical scales. This connection relates to a number of the closely intertwined aspects of logistics, viz. service firms, warehouse, distribution, wholesale and allied activities and third-party logistics. Further reflecting on the relevance of the diverse geographical scales as levels of analysis, the aforementioned components of logistics are applicable to the following closely related themes: the airfreight catchment of airports; the concentration of logistics facilities in the vicinity of airports; and metropolitan areas and regions as logistics hubs.
It should be acknowledged that despite the propensity of airports to be the centres of the concentration of logistics facilities, there are instances where logistics parks situated in the environs of airports are less successful in attracting logistics establishments compared to parks situated elsewhere. This situation raises a question on the need of the logistics facilities to be positioned geographically proximate to the airports. This may arguably be the case because the literature has shown that the airfreight catchment is not limited to the environs of airports, implying that the logistics establishments can be positioned at various areas within the catchment and transport cargo to and from the airports via road transport. These findings on the catchment are notably inconsistent with the essence of the concept of logistics optimisation (as part of operation research), which is crucial for transferring the goods from, for instance, the manufacturer to the consumers in the fastest possible manner towards minimising cost [44]. There are also arguments that the focus should not simply be on the fastest or cheapest transport but on reducing the cost for the integrated system, including transportation, materials handling, warehousing and so on [45]. This argument can in part explain the aforementioned findings of the literature on the geographically wide-ranging catchment of airports.
The literature also unveiled instances where particular airports acted as the airfreight monopolies in their respective regions, while in other cases, there was some level of competition and cooperation between the airports (and their associated logistics facilities) in a territory. This aspect also has relevance to the notion of multi-airport logistics systems wherein logistics firms at a number of airports complement each other towards improving the role of a metropolitan area or a region as a logistics hub. In this regard, there are cases where the metropolitan areas or regions succeed as the logistics hubs despite the competition from other airports in the region, country and even major airports in the neighbouring countries that may share the catchment.
Of the literature themes identified in the paper, the majority of the studies focused on the description of the concentration of logistics facilities in the vicinity of airports, particularly those involved in warehousing and distribution activities. This concentration in part results from the sprawling of logistics activities from the centrally located urban areas towards, among other suburban locations, the environs of airports. The focus on the concentration of logistics facilities also includes studies on a related topical aspect, i.e., the notion of logistics parks and/or logistical clusters, which further cements the literature’s preoccupation with the analysis of logistics facilities that are geographically proximate to airports. Relatedly, airports feature strongly as one of the variables in the methods that are employed to identify logistics clusters. The outcome of such methods is used by the authorities, developers and other stakeholders as a motivation for the placement of logistics facilities in the vicinity of airports in the manner of the normative models of airport-led development. However, numerous airports across the world have failed to transform towards airport cities [46]; hence, it is important to analyse the connection between airports and the spatial configuration of logistics facilities at the geographical scales that extend beyond the environs of airports.
3. Study Area
The paper focuses on the study area of the City of Cape Town metropolitan area (herein used interchangeably with the City of Cape Town metropolitan municipality) in the Western Cape province of South Africa (Figure 1). With the gross domestic product (GDP) of ZAR 445 billion [47], the City of Cape Town municipality has a population of at least 4.4 million people and occupies a land area of 2446 km2 [48]. Aligned with the administrative municipal boundaries, the study area accommodates Cape Town International Airport (CTIA), which is the second-busiest airport in South Africa after OR Tambo International Airport. Being the only international airport in the Western Cape province, CTIA handled over 10 million passengers in the 2019/2020 financial year [49] and processed around 68,000 tonnes of cargo during the same period [50].
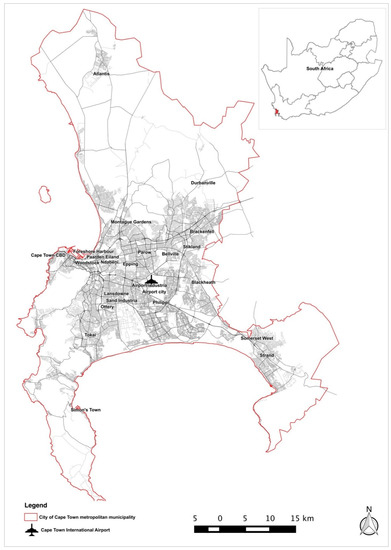
Figure 1.
City of Cape Town metropolitan area.
Opened in 1954, CTIA is situated about 19 km east of the Cape Town central business district (CBD). Strategically located in terms of the local, regional and national road networks, the airport is easily accessible from various areas of the metropolitan area as well as the surrounding municipalities.
4. Research Design and Methods
The study that the paper reports on was based on a quantitative descriptive design, as depicted in Figure 2. This section focuses on: the delimitation of the study (i.e., specific focus areas within the City of Cape Town metropolitan area); the identification of the logistics firms in the study area (i.e., the units of analysis); and the presentation of the spatial analysis methods used.

Figure 2.
Research design.
4.1. Delimitation of the Study
As stated in Section 1, the objective of the paper is to analyse the spatial configuration of logistics firms in the City of Cape Town metropolitan area relative to CTIA. Given the difficulties in accessing the appropriate geospatial data, it would have been infeasible to analyse the logistics firms situated in all areas across the metropolitan area. Therefore, to delimit the investigations, the paper focuses on the main industrial areas and economic nodes. Because of the extensive land and/or building requirements relative to the lower land cost, logistics firms typically locate in industrial areas; hence, a decision was taken to delimit the analysis to such areas. The connections between the placement of logistics facilities and industrial areas have been established in the literature wherein some scholars even argue that the logistics space is a form of industrial space [51]. It should however be noted that although not an industrial area, it was befitting to include the Cape Town CBD in the investigations in light of its traditional importance of being the economic heartbeat of the City of Cape Town municipality and the Western Cape province.
The first preparatory task involved the delimitation of the study in accordance with the foregoing discussion about the connections between the placement of logistics facilities and the industrial areas. The following data, which were obtained from the City of Cape Town municipality in the GIS shapefile and geodatabase formats, were used to ascertain the location and the extent of the industrial areas across the metropolitan area:
- The land-use information, which classified the municipality in terms of the standard categories of residential, commercial, industrial, open space and so on, was the first port of call for the preliminary analysis. As a standard practice, these land-use categories are aggregated at the level of individual property to depict the dominant use on each property towards providing the land-use picture across the municipality. Given the connections between logistics facilities and industrial areas, the classes of ‘industrial’ and ‘commercial_industrial’ were split from the land-use shapefile so as to delineate the extent of the industrial areas in the metropolitan area.
- The non-residential land-use geodatabase was superimposed onto the aforementioned isolated industrial areas’ shapefile to cross-check the accuracy of the extent of the industrial areas. In most instances, the two datasets overlapped, which to a large degree reflected the accuracy of the information. However, the overlap was not perfect because of the minor changes that were introduced to the planning boundaries used by the municipality in different years, as well as urban development that had emerged post the compilation of the first set of data. In that regard, aerial photography (Google Maps) was utilised to verify the information further, particularly for the areas that were depicted by the non-residential data as having sizeable concentrations of development but were not part of the previous industrial land-use data. It should be noted that the information in the geodatabase reflected the non-residential uses broadly, without specifying the constituent components; hence, although useful, the data could not be used alone to ascertain the extent of the industrial areas.
The foregoing identification of the study’s focus areas resulted in the delineation of the industrial and economic nodes in the Cape metropolitan area, reflected in Figure 3. This delineation was used as the foundation for the subsequent analysis.

Figure 3.
Delineation of the focus area.
4.2. Identification of the Logistics Firms (the Units of Analysis)
The second preparatory task involved the compilation of a list of the logistics firms situated in the industrial and economic nodes identified from the City of Cape Town’s land-use information. The data on the logistics firms were obtained from AfriGIS, as reflected in Table 1. To guide the data-extraction process, AfriGIS was provided with the shapefile of the industrial and economic nodes collated from the preparatory process involving the municipal land-use datasets.

Table 1.
Categories of logistics firms.
The underlying data were received from AfriGIS in the GIS shapefile format, in which each entry included, inter alia, the firm’s name (ent_name), the description of the economic activity conducted (usr_sic_desc), the physical/street address and the year of establishment. It was pertinent to check the accuracy of the classification, reflected in Table 2. In the manner of the logic used by AfriGIS in compiling the underlying data, a keyword search was conducted on the ‘ent_name’ and the ‘usr_sic_desc’ fields of the dataset, using the 14 aforementioned categories. The outcome of this exercise is reflected in the ‘number of firms 1′ column in Table 2.
Table 2.
Number of logistics firms by different categories.
The following aspects were then taken into consideration in the subsequent data-cleaning process:
- The firms that were evidently not logistics-related in the manner of the paper were identified from the ‘usr_sic_desc’ field and deleted from the dataset. These included the firms with the following activity descriptions: waste ‘removal’; motion picture and video production and ‘distribution’; ‘removal’ of alien vegetation; ‘removal’ of asbestos; debt ‘removal’; wreck ‘removal’ dent ‘removal’; ‘supply’ of energy efficient technology; ‘supply’ of community-based service; blue cross services; earth ‘movers’; ‘distribution’ of student stipend.
- The records with duplicates were removed from the data so as to keep one record per firm. This was specifically in relation to the firms that had the same or similar names and were located at the same physical address. Some of these firms appeared to be based on ‘group of firms’ structure. A decision was therefore taken that such firms should be regarded as one entity, specifically in the instances where the firms were located at the same physical address.
- In the instances where there were overlaps resulting from the keyword search (i.e., the search yielding results on different logistics categories for a particular firm), a number of assumptions were employed towards classifying the affected firms. For instance, a firm that yielded ‘warehousing’ and other categories was classified under the category ‘warehousing’.
The foregoing cleaning of the data received from AfriGIS resulted in the information shown in the ‘number of firms 2′ column in Table 2 which accordingly formed the basis for the analysis.
4.3. Spatial Analysis
Spatial analyses (comprising buffer, kernel density and network analysis) were conducted through GIS to establish the spatial configuration of the logistics firms in the City of Cape Town metropolitan area relative to CTIA. ArcGIS 10.8 [52] and QGIS 3.16 [53] were used in the study. The buffer method was applied to determine the spatial distribution of the logistics facilities and their proximity to the airport. Kernel density was also applied to ascertain the spatial distribution and the configuration of the logistics firms relative to CTIA. Kernel density calculates the density of the features in an area and creates a smoothly tapered surface to each point [54,55]. This GIS tool searches for the points within a default search radius (bandwidth) based on the spatial configuration of the data and the number of input points, which is corrected for spatial outliers (that is, input points that are very far from the rest) so that the search radius is not unreasonably large [54,55]. The value is highest at the location of a given point and diminishes with the increasing distance from that point.
The predicted density at a new (x, y) location is determined by the following formula [54]:
where:
- i = 1,…,n are the input points. Only include points in the sum if they are within the radius distance of the (x, y) location.
- popi = the population field value of point I, which is an optional parameter.
- disti = the distance between point i and the (x, y) location.
The calculated density is then multiplied by the number of points and makes the spatial integral equal to the number of points (sum or population field) rather than always being equal to 1 [54]. This logic was derived from the quartic kernel developed by Silverman [56].
Network route analysis was then conducted to establish the fastest and shortest routes from the premises of the logistics firms to the airport. The intention was to show the positioning of the furthest logistics firms from the cardinal directions, and to also determine the time it would take to travel (using road transport) from these firms to or from the airport. Further, the digital elevation model (DEM) data were overlaid, and it showcased that the ground surface where almost all the firms were located was uniformly flat. Hence, the DEM was not incorporated in the shortest and fastest route analysis.
5. Results and Discussion
This section discusses the results of the spatial analysis in relation to the literature reviewed in Section 2. Of the 985 logistics firms located in the various industrial and economic nodes in the City of Cape Town metropolitan area, the majority (937) were situated within the Euclidean distance of 20 km of the airport (Figure 4). This shows that relative to the airport, the logistics firms in the metropolitan area were situated within the range of the urban form of the aerotropolis, which consists of airport-related development that could extend up to 30 km from the airport [2,3]. Similarly, the geographic scope of the location of the majority of the logistics firms were within the spatial range of the airea, which is a derivative of the aerotropolis that is framed more from a metropolitan perspective [57]. In the conception of the airea, the airport’s sphere of influence is separated into a number of the clusters of airport-related development, with varying degrees of the linkages between each other and with the airport [57,58]. The distinct clusters, in the manner of the airea, could be represented by the industrial nodes that accommodate, among other businesses, the logistics firms across the City of Cape Town metropolitan area. The concentration of the logistics facilities (e.g., in the industrial areas in the context of the paper) provides an environment conducive to the generation of agglomeration economies [59], which could be based on either the inter-firm linkages of the establishments in the same economic sector or the linkages between the firms in different sectors.
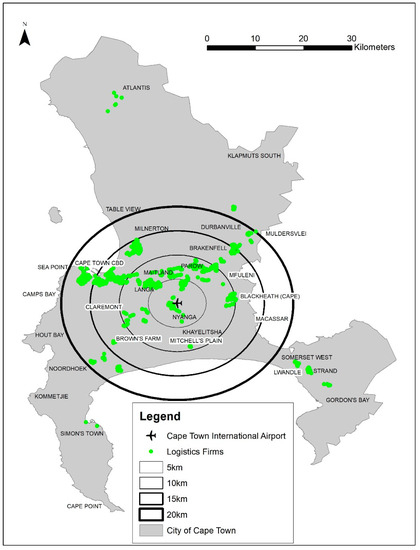
Figure 4.
A map showing the logistics firms, with different buffers around the airport.
The results of the Euclidean distance analysis on the positioning of the logistics firms in the City of Cape Town metropolitan area relative to CTIA are similar to the results of a number of the studies mentioned in Section 2. The study of Wang et al. [26] found that logistics activities were mainly located within 10 km of Dalian Airport in China. Relatedly, De Silva et al. [31] discovered that in the UK, logistics facilities were located within 20 km radii of the airports. Relative to some studies on the airfreight/air cargo catchment of the airports, the distance of 10 km to 20 km, i.e., in the manner of the results of the paper as well as Wang et al. [26] and De Silva et al. [31], represent a geographically small possible logistics-related catchment of airports. For instance, in the UK, Hoare [38] discovered that the breakpoint for the agents’ shipments was within approximately 240 km of Heathrow Airport, while Boonekamp [40] found out that the freight handled at Amsterdam Airport originated within the access distance of 1250 km of the airport. In the further discussion of the nature of the airfreight catchment of airports, Boonekamp and Burghouwt [42] noted that hub carriers typically compete for airfreight through the road feeder networks, which are essential for transporting shipments (from other airports and/or consolidation areas) to the respective hubs.
Relative to the results of the paper, the aforementioned studies on the airfreight catchments of airports show that the City of Cape Town metropolitan area could potentially become a logistics hub wherein the airport (and Port of Cape Town) could play a pivotal role in terms of providing connections to different areas within the country and internationally. Within the metropolitan area, other modes of transport would connect the various clusters/industrial nodes with each other and with the airport in the manner of the airea and/or the aerotropolis. The notion of a logistics hub is arguably plausible because CTIA, the second-largest airport in South Africa, is the only commercial airport within the City of Cape Town municipality and the only international airport in the Western Cape province. As noted earlier in the paper, situated within the second-largest municipal economy in South Africa, CTIA processes around 68,000 tonnes of cargo per annum [50]. The literature supports the notion of airports (and seaports) being the anchors of the logistics hubs at the city or metropolitan scale. For instance, Sundarakani [38] found that Jebel Ali Port (which is situated in the vicinity of Dubai International Airport) was one of the factors that augmented Dubai as the ideal place for a logistics hub. Hesse [35] also noted that the city of Luxembourg (the capital of Luxembourg) emerged as an airfreight hub because of, among other factors, the availability of the aviation infrastructure. In the USA, Shukla and Wadell [5] reported that the access to Dallas–Fort Worth Airport was at a premium in Dallas, which is a logistics centre of regional and national significance. This anchoring role of the airports can occur within, for instance, the framework of the aerotropolis or the airea discussed earlier in this section.
To further analyse the spatial configuration of the logistics firms relative to CTIA, a fieldwork survey (in which 110 firms out of 985 were randomly sampled) discovered that 16 firms shipped or received cargo through CTIA. As displayed in Figure 5, only 2 airfreight-related firms out of the 16 were situated within 5 km of the airport. The majority of the firms that reported to ship or receive cargo through CTIA were positioned beyond the 10 km radius.
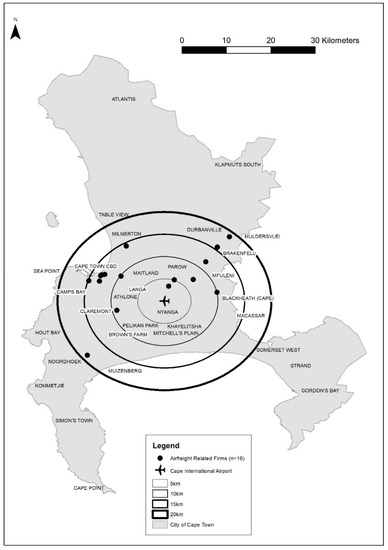
Figure 5.
A map showing the logistics firms which reported to ship or receive cargo through CTIA.
Kernel density results showed that the highest density values were found in the vicinity of the Cape Town CBD, Port of Cape Town and Milnerton (Figure 6). Areas such as Brakenfell, Parow and Maitland also accommodated higher density values than areas in close proximity to the airport. These results support the argument that logistics firms do not necessarily have to be situated in the vicinity of airports.

Figure 6.
A map showing kernel density values of the logistics firms relative to CTIA.
In addition to the rudimentary analysis of the Euclidean distance presented in the foregoing discussion, it was imperative to conduct drive-time analysis of the positioning of the logistics firms relative to the airport. Compared to the Euclidean distance, drive-time analysis provides a more accurate measure of access. Figure 7 depicts that the furthest logistics firm was situated in the north of the municipality, around the area of Atlantis.

Figure 7.
A map showing the logistics firms with the fastest and shortest routes to the airport.
Focusing on the logistics firms, which were located furthest from CTIA, network analysis showed that the furthest firm was 50 km and 64 min away on the shortest route to the airport, while it was 55 km and 49 min away on the fastest route. On the southern side, the furthest firm was 39 km and 62 min away on the shortest route to the airport, while it was 36 km and 33 min away on the fastest route. On the eastern side, the furthest firm was 24 km and 39 min away on the shortest route to the airport, while it was 27 km and 25 min away on the fastest route. Lastly, on the western side, the furthest firm was 22 km and 34 min away on the shortest route to the airport, while it was 22 km and 26 min away on the fastest route (Table 3 and Figure 7).
Table 3.
The fastest and shortest routes of the firms located the furthest away from Cape Town International Airport.
Figure 8 shows the overlay of the DEM data for the City of Cape Town metropolitan municipality. The majority of the firms were situated in the flat areas. This is evidenced by the fact that almost all the firms were located in the areas with the DEM values between −435 m and 105 m, with a few situated in the areas with the DEM values between 106 and 225 m, especially those in Atlantis in the north. This shows that the inclusion of the DEM in the network analysis would have not yielded significantly different results from the network analysis results presented in the paper.

Figure 8.
A map showing the logistics firms with overlay of the DEM data for the City of Cape Town metropolitan municipality.
In the context of the logistics flows, the travelling distances and time reflected in Table 3 are short relative to the findings of some studies, in part providing support to the argument that CTIA has the potential to be an anchor that could facilitate and propel the City of Cape Town metropolitan area as a logistics hub. Boonekamp and Burghouwt [42] asserted that the catchment area for airfreight activities is much larger in comparison to the catchment for passengers. For instance, in the analysis of the spatial configuration of the hinterlands of the air cargo hubs in Europe, it was discovered that the majority of the road feeder service connections extended from England to Italy [41]. Although Heinitz et al. [41] did not mention the physical distances involved, the Euclidean distance between England and Italy is way over 1000 km. Compared to Heinitz et al. [41], the fastest and shortest routes of the logistics firms situated in the furthest areas relative to CTIA are short. Furthermore, in a scenario in which the firms situated at the furthest points in the metropolitan area were airport-related, the freight flows would occur within one municipal area, with no customs huddles.
Despite the short travel time relative to the findings of some of the literature, there are studies that found the negative impact of the increasing distance from airports on the positioning of logistics facilities. In the Gauteng province of South Africa, a negative correlation was discovered between the largest airport in the country (i.e., OR Tambo International Airport) and the percentage of air cargo properties, for which the number of the air-cargo-related properties became minute beyond a 10 min travelling distance from the air cargo terminal [21]. This in part brings into the spotlight the different interpretations of logistics optimisation, as well as the influence of context, wherein the catchments of airports would differ depending on the broader spatial and economic conditions of a given airport. For instance, the Gauteng city region contains a commercial multi-airport system (MAS), while the City of Cape Town municipality and its broader functional region rely on one airport [60], which is solely responsible for the airfreight flows. In a fully fledged MAS, the use of airports for airfreight purposes is substitutable [42], based on, among other factors, the travelling distance between the source of cargo and a given airport. Some authors [61] contend that the establishment of a MAS should not be considered in the City of Cape Town metropolitan area, at least in the medium term, signifying the possibility of the future role of CTIA in the logistics processes. It should however be noted while the Gauteng city region is situated inland, the City of Cape Town municipality is home to the country’s second-biggest seaport, whose freight-related role needs to be considered in relation to CTIA.
It is noted in Figure 7 that some of the fastest routes transcend a number of the industrial and economic nodes that accommodate logistics firms. The fastest route of the firm located furthest in the north cuts across the concentration of logistics facilities in the industrial areas of Montague Gardens/Milnerton as well as Epping. Similarly, the shortest route for the firm in the east transcends a number of the industrial nodes in Bellville and Brackenfell. A number of industrial nodes are also situated along the fastest route in the south east, around the area of Strand. The environs of the aforementioned routes would therefore be well placed to fulfil the transportation/movement requirements of a range of the logistics firms that require access to the airport. The only routes that do not have a clearly observable pattern of the concentration of logistics firms are the fastest and shortest routes of the firm in the furthest south of the municipality (Figure 7).
Furthermore, it can be discerned that (in terms of the Euclidean distance and drive-time analysis) the airport is located in a relatively central position within the City of Cape Town metropolitan area, which makes it accessible from different parts of the municipality.
6. Conclusions
Towards extending the literature on the nexus between transport infrastructure and the spatial distribution of economic activities, the paper analysed the spatial configuration of the logistics firms in the City of Cape Town metropolitan area relative to CTIA. In light of the widely acknowledged connection between the positioning of logistics firms and industrial areas, the paper was delimited to the selected industrial areas and economic nodes in the metropolitan area. The paper was based on spatial analyses (buffer, kernel density and network analysis) conducted in ArcGIS 10.8 [52] and QGIS 3.16 [53]. It was found that the majority (95%) of the logistics firms were situated within 20 km of the airport. Kernel density results showed that high density values were found in the environs of the Cape Town CBD, Port of Cape Town and Milnerton. Network analysis showed that the furthest firm, situated in the north of the municipality, was 50 km and 64 min away on the shortest route and 55 km and 49 min away on the fastest route to CTIA. Relative to the findings of the literature, it was argued that CTIA has the potential to facilitate a logistics hub at the city or metropolitan level, which could be informed by, for instance, the models of the aerotropolis or the airea. This possibility of the logistics hub is strengthened by the fact that CTIA is the only commercial airport in the metropolitan area and the only international airport in the Western Cape province. During the development planning processes, the stakeholders (e.g., Airports Company South Africa, the provincial government and the City of Cape Town municipality) could consider the potential role of CTIA towards the establishment of the logistics hub.
The paper is, however, not meant to directly inform policymaking. One of its significance is to sensitise the stakeholders on the possibility of the metropolitan logistics hub that would hinge on the airport and to accordingly lay a foundation for further discussion between researchers and policymakers. This approach to knowledge creation and knowledge use challenges the typical understanding of a linear relationship between research and policymaking, and rather takes a stance that research and policymaking could be mutually constitutive [62]. Another significance of the paper is that it drew on the rich literature on the spatial configuration of logistics firms in relation to airports and identified a gap through analysing and synthesising the previous studies. This gap was addressed by using the secondary data on the economic nodes and the positioning of the logistics firms relative to the airport in the Global South context. The analytical techniques of buffer, kernel density and network analysis were applied to showcase the spatial configuration of the logistics firms relative to the airport.
The main limitation of the paper is that it described the spatial configuration of the logistics firms without considering the factors that influenced the placement of such firms. It is therefore recommended that future research systematically identify airfreight-related logistics firms (as opposed to focusing on the logistics facilities, in general, in the manner of this paper) and analyse the factors that influence their placement.
Author Contributions
Conceptualisation, M.M. and T.M.; methodology, M.M. and T.M.; software, M.M. and T.M.; formal analysis, M.M. and T.M.; investigation, M.M. and T.M.; writing—original draft preparation, M.M.; writing—review and editing, M.M. and T.M.; visualisation, M.M. and T.M.; project administration, M.M.; funding acquisition, M.M. All authors have read and agreed to the published version of the manuscript.
Funding
This research was funded by the National Research Foundation, grant number 120662, and the APC was funded by Cape Peninsula University of Technology.
Institutional Review Board Statement
The study was conducted in accordance with the Declaration of Helsinki and approved by the Research Ethics Committee of the Faculty of Informatics and Design, Cape Peninsula University of Technology (14 October 2019).
Informed Consent Statement
Not applicable.
Data Availability Statement
Data sharing not applicable.
Conflicts of Interest
The authors declare no conflict of interest. The funders had no role in the design of the study; in the collection, analyses or interpretation of data; in the writing of the manuscript; or in the decision to publish the results.
References
- Conway, M. Airport Cities 21: The New Global Transport Centers of the 21st Century; Conway Data: Atlanta, GA, USA, 1993. [Google Scholar]
- Kasarda, J.D. Airport cities. Urban Land 2009, 68, 56–60. [Google Scholar]
- Kasarda, J.D.; Lindsay, G. Aetrotropolis: The Way We’ll Live Next; Penguin Group: London, UK, 2011. [Google Scholar]
- Banai, R. The aerotropolis: Urban sustainability perspectives from the regional city. J. Transp. Land Use 2017, 10, 357–373. [Google Scholar] [CrossRef]
- Shukla, V.; Waddell, P. Firm location and land use in discrete urban space. A study of the spatial structure of Dallas-Fort Worth. Reg. Sci. Urban Econ. 1991, 21, 225–253. [Google Scholar] [CrossRef]
- Sivitanidou, R. Warehouse and distribution facilities and community attributes: An empirical study. Environ. Plan. 1996, 28, 1261–1278. [Google Scholar] [CrossRef]
- Raguraman, K. International air cargo hubbing: The case of Singapore. Asia Pac. Viewp. 1997, 38, 55–74. [Google Scholar] [CrossRef]
- McMillen, D.P.; McDonald, J.F. Suburban subcentres and employment density in metropolitan Chicago. J. Urban Econ. 1998, 43, 157–180. [Google Scholar] [CrossRef]
- Hong, J. Location determinants and patterns of foreign logistics services in Shanghai, China. Serv. Ind. J. 2007, 27, 339–354. [Google Scholar] [CrossRef]
- Warffemius, P.M.J. Modelling the Clustering of Distribution Centres around Amsterdam Airport Schiphol. Location Endowments, Economic Agglomeration, Locked-in Logistics and Policy Implications. Ph.D. Dissertation, TRAIL Research School, Delft, The Netherlands, 2007. [Google Scholar]
- Bowen, J.T. Moving places: The geography of warehousing in the US. J. Transp. Geogr. 2008, 16, 379–387. [Google Scholar] [CrossRef]
- Woudsma, C.; Jensen, J.F.; Kanaroglou, P.; Maoh, H. Logistics land use and the city: A spatial-temporal modelling approach. Transp. Res. Part E 2008, 44, 277–297. [Google Scholar] [CrossRef]
- McKinnon, A. The present and future land requirements of logistical activities. Land Use Policy 2009, 26S, S293–S301. [Google Scholar] [CrossRef]
- Raimbault, N.; Andriankaja, D.; Paffoni, E. Understanding the diversity of logistics facilities in the Paris region. Procedia -Soc. Behav. Sci. 2012, 39, 543–555. [Google Scholar] [CrossRef]
- Chhetri, P.; Butcher, T.; Corbitt, B. Characterising spatial logistics employment clusters. Int. J. Phys. Distrib. Logist. Manag. 2014, 44, 221–241. [Google Scholar] [CrossRef]
- Olsson, J.; Woxenius, J. Localisation of freight consolidation centres serving small road hauliers in a wider urban area: Barriers for more efficient freight deliveries in Gothenburg. J. Transp. Geogr. 2014, 34, 25–33. [Google Scholar] [CrossRef]
- Rivera, L.; Sheffi, Y.; Welsch, R. Logistics agglomeration in the US. Transp. Res. Part A Policy Pract. 2014, 59, 222–238. [Google Scholar] [CrossRef]
- Van den Heuvel, F.P.; Rivera, L.; Van Donselaar, K.H.; de Jong, A.; Sheffi, Y.; de Langen, P.W.; Fransoo, J.C. Relationship between freight accessibility and logistics employment in US counties. Transp. Res. Part A 2014, 59, 91–105. [Google Scholar] [CrossRef]
- Heitz, A.; Beziat, A. The parcel industry in the spatial organisation of logistics activities in the Paris region: Inherited spatial patterns and innovations in urban logistics systems. Transp. Res. Procedia 2016, 12, 812–824. [Google Scholar] [CrossRef]
- Önden, İ.; Acar, A.Z.; Eldemir, F. Evaluation of the logistics centre locations using a multi-criteria spatial approach. Transport 2016, 33, 322–334. [Google Scholar] [CrossRef]
- Coetzee, P.J.v.V.; Swanepoel, P.A. Spatial relationships and movement patterns of the air cargo industry in airport regions. J. Transp. Supply Chain Manag. 2017, 11, 1–10. [Google Scholar] [CrossRef]
- Heitz, A.; Launay, P.; Beziat, A. Rethinking data collection on logistics facilities: New approach for determining the number and spatial distribution of warehouses and terminals in metropolitan areas. Transp. Res. 2017, 2609, 67–76. [Google Scholar] [CrossRef]
- Kumar, I.; Zhalnin, A.; Kim, A.; Beaulieu, L.J. Transportation and logistics cluster competitive advantages in the U.S. regions: A cross-sectional and spatio-temporal analysis. Res. Transp. Anal. 2017, 61, 25–36. [Google Scholar] [CrossRef]
- Rolko, K.; Friedrich, H. Locations of logistics service providers in Germany—The basis for a new freight transport generation model. Transp. Res. Procedia 2017, 25, 1061–1074. [Google Scholar] [CrossRef]
- Holl, A.; Mariotti, I. The geography of logistic firm location: The role of accessibility. Netw. Spat. Econ. 2018, 18, 337–361. [Google Scholar] [CrossRef]
- Wang, D.; Gong, Z.; Yang, Z. Design of industrial clusters and optimization of land use in an airport economic zone. Land Use Policy 2018, 77, 288–297. [Google Scholar] [CrossRef]
- Yuan, Q. Location of warehouses and environmental justice: State of the Art. J. Plan. Lit. 2018, 33, 287–298. [Google Scholar] [CrossRef]
- Gingerich, K.; Maoh, H. The role of airport proximity on warehouse location and associated truck trips: Evidence from Toronto, Ontario. J. Transp. Geogr. 2019, 74, 97–109. [Google Scholar] [CrossRef]
- Strale, M. Logistics sprawl in the Brussels metropolitan area: Toward a socio-geographic typology. J. Transp. Geogr. 2019, 88, 102372. [Google Scholar] [CrossRef]
- Woudsma, C.; Jakubicek, P. Logistics land use patterns in metropolitan Canada. J. Transp. Geogr. 2019, 88, 102381. [Google Scholar] [CrossRef]
- De Silva, C.K.; Sano, K.; Hatoyama, K. Exploring the relationship between urban form and spatial organisation of Amazon fulfilment facilities in the United Kingdom and Japan. Transp. Res. Procedia 2020, 46, 149–156. [Google Scholar] [CrossRef]
- Li, G.; Sun, W.; Yuan, Q.; Liu, S. Planning versus the market: Logistics establishments and logistics parks in Chongqing, China. J. Transp. Geogr. 2020, 82, 102599. [Google Scholar] [CrossRef]
- Sakai, T.; Beziat, A.; Heitz, A. Location factors for logistics facilities: Location choice modeling considering activity categories. J. Transp. Geogr. 2020, 85, 102710. [Google Scholar] [CrossRef]
- Rodrigue, J.-P. Freight, gateways and mega-urban regions: The logistical integration of the Bostwash corridor. Tijdschr. Voor Econ. En Soc. Geogr. 2003, 95, 147–161. [Google Scholar] [CrossRef]
- Hesse, M. The Luxembourg air freight-hub. Market niche development, supply chain-insertion, global positionality. In Airports in Cities and Regions: Research and Practise, Proceedings of the 1st International Colloquium on Airports and Spatial Development, Karlsruhe, Germany, 9–10 July 2009; KIT Scientific Publishing: Karlsruhe, Germany, 2010. [Google Scholar]
- Shen, D.; Rankin, W.B.; Lee, M. Self-education of agents in the multi-airport logistic system: A multiple cases study. J. Intell. Fuzzy Syst. 2016, 31, 2745–2755. [Google Scholar] [CrossRef]
- Sundarakani, B. Transforming Dubai logistics corridor into a global logistics hub. Asian J. Manag. Cases 2017, 14, 115–136. [Google Scholar] [CrossRef]
- Hoare, A.G. International airports as growth poles: A case study of Heathrow Airport. Trans. Inst. Br. Geogr. 1974, 63, 75–96. [Google Scholar] [CrossRef]
- Zhang, A. Analysis of an international air-cargo hub: The case of Hong Kong. J. Air Transp. Manag. 2003, 9, 123–138. [Google Scholar] [CrossRef]
- Boonekamp, T. Network Quality and Catchment Area Analysis in the Air Cargo Industry; Seo Economic Research: Amsterdam, The Netherlands, 2014. [Google Scholar]
- Heinitz, F.; Hirschberger, M.; Westat, C. The role of road transport in scheduled air cargo networks. Procedia -Soc. Behav. Sci. 2013, 104, 1198–1207. [Google Scholar] [CrossRef][Green Version]
- Boonekamp, T.; Burghouwt, G. Measuring connectivity in the air freight industry. J. Air Transp. Manag. 2017, 61, 81–94. [Google Scholar] [CrossRef]
- Torraco, R.J. Writing integrative reviews of the literature: Methods and purposes. Int. Adult Vocat. Educ. Technol. 2016, 7, 62–70. [Google Scholar] [CrossRef]
- Shukla, H.; Chhadva, J.; Arora, J.; Sheth, K.; Malhotra, K. Application of Operation Research in Logistics and Warehouse Optimization. Int. J. Innov. Res. Technol. Sci. 2017, 5, 1–7. [Google Scholar]
- Pienaar, W.J. Operations research: An indispensable toolkit for the logistician. ORiON 2005, 21, 77–91. [Google Scholar] [CrossRef]
- Peneda, M.J.A.; Reis, V.D.; Macario, M.D.R.M. Critical factors for the development of airport cities. Transp. Res. Rec. 2011, 2214, 1–9. [Google Scholar] [CrossRef]
- City of Cape Town. State of Cape Town 2018; Cape Town: City of Cape Town; 2018. Available online: https://resource.capetown.gov.za/documentcentre/Documents/City%20research%20reports%20and%20review/State%20of%20Cape%20Town%202018.pdf (accessed on 20 June 2021).
- Republic of South Africa. City of Cape Town. Profile and Analysis. Available online: https://www.cogta.gov.za/ddm/wp-content/uploads/2020/11/City-of-CT-September-2020.pdf (accessed on 19 June 2021).
- Available online: www.acsa.co.za (accessed on 20 November 2021).
- ACSA (Airports Company South Africa). Airports Company South Africa 2020 Integrated Annual Report. 2020. Available online: https://www.airports.co.za/Documents/ACSA%202020%20IR.pdf (accessed on 19 June 2021).
- He, M.; Shen, J.; Wu, X.; Luo, J. Logistics space: A literature review from the sustainability perspective. Sustainability 2018, 10, 2815. [Google Scholar] [CrossRef]
- ESRI. What’s New in ArcGIS Enterprise 10.8? California: United States of America. 2020. Available online: https://www.esri.com/arcgis-blog/products/arcgis-enterprise/announcements/whats-new-in-arcgis-enterprise-10-8/ (accessed on 20 August 2021).
- QGIS Development Team. QGIS Geographic Information System. Open Source Geospatial Foundation Project. 2021. Available online: https://qgis.osgeo.org (accessed on 25 August 2021).
- ESRI. How Kernel Density Works. 2019. Available online: https://desktop.arcgis.com/en/arcmap/10.7/tools/spatial-analyst-toolbox/how-kernel-density-works.htm (accessed on 9 June 2022).
- Weir-Smith, G.; Mokhele, T. Quintile 1 Schools in the Eastern Cape: A Spatial Lens; Friday Bulletin; Human Sciences Research Council: Pretoria, South Africa, 2021. [Google Scholar]
- Silverman, B.W. Density Estimation for Statistics and Data Analysis; Chapman and Hall: New York, NY, USA, 1986. [Google Scholar]
- Freestone, R.; Baker, D. Spatial planning models of airport-driven urban development. J. Plan. Lit. 2011, 26, 263–279. [Google Scholar] [CrossRef]
- Schlaack, J. Defining the Airea. Evaluating urban output and forms of interaction between airport and region. In Airports in cities and Regions: Research and Practice, Proceedings of the 1st International Colloquium on Airports and Spatial Development, Karlsruhe, Germany, 9–10 July 2009; KIT Scientific Publishing: Karlsruhe, Germany, 2010. [Google Scholar]
- Hylton, P.J.; Ross, C.L. Agglomeration economies’ influence on logistics clusters’ growth and competitiveness. Reg. Stud. 2018, 52, 350–361. [Google Scholar] [CrossRef]
- Mokhele, M. Spatial Economic Attributes of Airport-Centric Developments in Cape Town and Johannesburg. Ph.D. Thesis, Stellenbosch University, Stellenbosch, South Africa, 2016. [Google Scholar]
- Zietsman, D.; Vanderschuren, M. Analytic hierarchy process assessment for potential multi-airport systems—The case of Cape Town. J. Air Transp. Manag. 2014, 36, 41–49. [Google Scholar] [CrossRef]
- Boswell, C.; Smith, K. Rethinking policy ‘impact’: Four models of research-policy relations. Palgrave Commun. 2017, 3, 1–10. [Google Scholar] [CrossRef]


Publisher’s Note: MDPI stays neutral with regard to jurisdictional claims in published maps and institutional affiliations. |
© 2022 by the authors. Licensee MDPI, Basel, Switzerland. This article is an open access article distributed under the terms and conditions of the Creative Commons Attribution (CC BY) license (https://creativecommons.org/licenses/by/4.0/).