1. Introduction
As we move further into an economy driven by service systems, a company’s logistics and transportation come to the fore as they are among the key drivers of the supply chain [
1]. Warehousing is an important part of a supply chain or any production facility that allows the company to manage fluctuations in market demand [
2] and to match product demand with supply [
3]. Along with storage, warehouses can be used for a number of other activities [
4] such as recovering products, materials, and product carriers from customers in order to redistribute them to other customers, recyclers, and original-equipment manufacturers [
5]. However, the main function is that goods arrive at a warehouse in a carrier and are unloaded at the receiving docs. They are put away into storage and later picked and shipped through shipping docks [
6]. For each of these stages to be well-performed previous organizational decisions have to be taken. Any underperformance in warehouse processes can lead to high costs, low reaction time, and service level and result in losses of all supply chains. Moreover, it includes many other regular activities such as receiving, batching, storing, picking, packaging, and shipping goods [
7,
8]. The complexity of individual warehouses depends on product specifications and variety, customer requirements, and service level [
9].
The receiving process at a warehouse is the first action that meets an arriving item [
10] and it typically entails several steps, from inbound trucker delivery appointment to merchandise storage in an assigned location [
11], positioning the item to supply the production or an internal or external customer. It also includes unloading products from the truck, updating the inventory record, and inspecting the incoming material(s) to determine if there is any quantity or quality inconsistency.
According to the study in [
8], the receiving process is among the least investigated topics in the warehousing literature, thereby making it an interesting topic of research. Furthermore, according to [
12] warehousing is the largest operational cost in an organization’s supply chain representing 2 to 5 percent of the company’s selling costs. Thus, the emphasis on optimizing the material handling process and more specifically the receiving process can help the company’s profits. Some papers that are found in literature aiming to improve the receiving process include [
1], in which the authors test different check-in policies using discrete-event simulation models through a case study. Two studies [
13,
14] study the truck-to-dock assignment problem, while in [
15] the authors study the problem of scheduling trucks with multiple inbound doors. Regarding papers dealing with put away and storage processes, for example, [
2], the authors study the storage allocation problem through mathematical modeling. Also, Ref. [
16] reports a study seeking to increase storage capacity and productivity in the case of a company through redesign of the warehouse layout, changes to the warehousing and material handling processes, and improvements in the warehouse management system software. As in Ref. [
16], this study reports a case study developed in the logistics department of a company in the area of security and communication systems, fire alarms, and electronic displays. In another study [
17], the response surface methodology was used with the purpose of determining the levels of factors that affect inventory management. A solution to an order planning problem in the construction supply chain is presented in [
18] using simulation modeling and response surface methodology. However, these studies did not take into account challenges such as the unstable markets, the lead time uncertainty, and the stochastic demand. In
Table 1 a summary of some different works found in the literature is presented.
For the sustainable growth of the company, it becomes essential to improve the raw material reception process, make the flow more agile, and reduce throughput times, thereby helping to reduce associated costs. The supply chain stakeholders coordinate and integrate their business processes with the purpose of achieving the lowest possible cost while providing superior customer value [
26]. For instance, in Ref. [
27], a stochastic production inventory model with numerous factors such as production preparation time, demand, partial backorders, and lost sales through a model is formulated in a fuzzy-stochastic environment. Reducing associated costs is essential since to this end, in [
28], a sustainable supply chain network allowing for the production of biofuels and bioenergy under a flexible manufacturing system is proposed. Finally, in another study [
26], a partial back-ordering and multi-delay-in-payments inventory model was introduced with the intent of handling the reparation of defective items. In the study, the global supplier’s manufacturing system is inefficient and produces defective goods for this purpose.
The scientific problem to be addressed in this study consists in finding out what kind of methodology and tools should be implemented in the warehouse receiving process to identify the main waste and improve the process flows performance. Thus, the main contribution of this paper is the detailed description of a successful design and implementation project in a warehouse receiving process, through the application of lean manufacturing practices and tools in conjunction with simulation. The aim is to contribute to future practical applications in real contexts of similar studies. Despite the vast body of literature on warehouse management, very few detailed descriptions of the practical application of lean manufacturing practices and tools to improve such types of processes can be found in the literature. The goal of this study was to improve the flow of material during the reception process by designing a new layout with a pallet transportation system and better balancing the workstations to improve the productivity of this area in order to boost the growth of the company while respecting its needs. Considering the general objective, the following specific objectives were defined: (1) improve the area’s productivity; (2) decrease the throughput times of the process; (3) improve the ergonomic conditions of workers.
Regarding the structure of this paper,
Section 2 presents the literature review supporting the focus of the study; in
Section 3, the research design and methods are described; in
Section 4, a case study is developed; improvements are proposed, and results are presented in
Section 5; in
Section 6, the main results are described; and in
Section 7, final remarks are made.
2. Literature Review
The warehouse is the interface area for production lines, markets, customers, suppliers, and the business environment in general. Warehouses are likely to be involved in the handling of raw materials, work-in-progress, sourcing, production, and distribution of goods all the way through to finished products [
29]. Warehousing generally involves the performance of administrative and physical functions associated with the storage of goods and materials.
An inefficiently planned warehousing system can lead to the overloading of inventory and deadlock of manufacturing orders during the transfer of products from the manufacturer to the customer. Therefore, maintaining an efficient flow of the inventory from the warehouse is a crucial task and efficient management of the warehouse system chain [
30].
Understanding a process is very important. A process is a combination of a set of activities within a company with a structure that aims to describe the logic, order, and dependencies necessary for the achievement of its objectives [
31]. As there may be several processes taking place within a company, it is essential that they are optimized, making it essential to consider several principles, practices, and tools that assist in this goal. To improve the efficiency of processes, companies should use Process Mapping. This is a technique of Business Process Management (BPM) that analyzes how a business process works [
32], providing a visual display of the steps characterizing a production process, identifying the human resources and machines, and the relationships that contribute to reaching a business goal [
33].
According to the study in [
33], BPM is considered an important tool for industrial practitioners and is incorporated into daily use software under different forms such as flow charts, workflow diagrams, and value stream maps. However, before using this approach, a Gemba Walk should be performed to identify any problem in the processes. A Gemba Walk is an inspection—on foot—that is undertaken through the factory and all the stations associated with production, checking in detail the work done by the operators and all the surroundings of the processes that take place in the manufacturing element of a company [
34]. This practice assumes great importance in the correct definition of the alignment of all processes within an organization in which a precise understanding of metrics is essential for decision-making [
35].
One of the tools most used by companies to analyze the efficiency of processes is Value Stream Mapping (VSM), which was adapted by the authors of [
36] from Toyota’s internal “Material & Information Flow” diagrams. Apart from mapping the physical flow of materials, the VSM also emphasizes information flow that is often overlooked by other methods. In Ref. [
36], the authors advocate that information flow and material flow are equally important and form the two sides of a single coin, and that both need to be mapped clearly to fully understand and realize the potential improvements in the value stream. According to the authors of [
37], VSM is a method used to explore the waste, inefficiencies, and additional steps not yet considered in a defined process. Thus, it is one of the main optimization tools used to identify opportunities in a process [
38]. VSM involves all stages of a process, whether pertaining to the added value or not and is a way of developing maps of the current and future states of a process to clearly verify what is happening on the shop floor.
After the analysis and characterization of the current flow, it is necessary to design what the optimized flow should be like. To this end, VSM is a tool that allows the idealization of a future improved state of the flows, using a graphical representation. Its objective is to contribute to the elimination of waste in processes, focusing on their optimization.
Many companies have started to create lean flow in their operations, but it is often seen that such companies struggle to sustain the steady output in their lean journey. The problem is due to the lack of a lean material handling system to support the value-adding process. Many firms that have “leaned” their value-adding processes are still mass producers from the material supply system perspective [
39], which results in more search time for operators doing a value-adding process, excess total inventory in the value stream, redundant forklift movements to transport the pallet load of material downstream in the flow (thus leading to safety hazards), and higher cost of expediting the missing parts/elements.
With the increasing popularity of Lean Thinking, there has been an increasing awareness of value creation, improving quality, and becoming more efficient in companies. The concept of continuous improvement, also known as Kaizen, is said to be the key to Japan’s competitive success [
40]. The prerequisite for the Lean improvement activities is the process and flow perspective. Therefore, processes, and the company’s ability to continuously improve them, determine the success and failure of the whole company.
There are various techniques that can be used to create a process model. Flowcharts and the annotations within the international standards IDEF0, IDEF3, etc. are just a few examples, each of which has its own pros and cons. However, one method commonly used by Lean is VSM (described above). Whichever technique and approach are used when modeling, it is important that the people who live the process are active and participate in the process modeling activity [
41].
In the Japanese business culture, the word “Gemba”—see Gemba Walk, above—is used and is as important as “Kaizen” to understand the process [
40]. Gemba means something like “the place where things happen”, and it is here where the information for the process modeling can be found [
42]. One of the main reasons for companies to work with processes is to work with continuous improvements, which is also advocated both by the ISO 9001 and the lean theories [
43,
44]. Graphical process maps are useful for understanding the process(es) they represent and are necessary to identify areas of improvement [
44]. According to [
41] one key issue at companies is the lack of qualified process modelers. The challenge of achieving process orientation can also stem from the strong resource orientation that still exists [
45].
An important issue associated with process management is reducing waste, including the constant movement of employees performing activities that add no value. The authors of [
46] mention that the material handling process and inefficient body movements or postures do not add value to a product. Moreover, Refs. [
47,
48] mention that uncomfortable body postures, as well as repetitive movements, represent a risk factor for employees since they can cause musculoskeletal disorders and negatively affect employees’ health and performance, altering their well-being. In the same way, in Ref. [
49] it is shown that repetitive movements may cause fatigue and loss of concentration while performing a task, which increases the probability of making mistakes, negatively affecting their performance. These problems may be generated by poor workstation design, which generates uncomfortable postures, causes musculoskeletal disorders, and consequently, affects work performance and well-being [
50], as well as adding to production costs [
46]. In Ref. [
51] the most basic movements are named therbligs, which were introduced by Frank B. Gilbreth, who developed certain subdivisions or events that he considered common to all kinds of manual work. According to [
52], therbligs can be effective or ineffective: effective therbligs directly advance work progress and can often be shortened, but generally cannot be removed entirely; ineffective therbligs do not advance the progress of the job and should be removed if possible.
The layout of the installations also has an important influence on the efficiency of the process and should therefore be considered in the process mapping. For example, Ref. [
53] proposes zone picking as an efficient way of dealing with warehousing procedures, whereby a worker picks only those Stock-Keeping Units (SKUs) stored within their picking zone. According to these authors, the size or storage capacity of the zone, the number of items on the pick list, and the storage policy have a significant effect on picking zone configuration.
The “time study” is also a fundamental tool to complement a good process mapping. Its purpose is to quantify the time of each process and thus have a realistic view of any flow to be analyzed. This tool is divided into the study of times, which corresponds to the analysis and recording of processing times, and the study of methods linked to the employees’ part, establishing standard times and methodologies, and is also related to the ergonomics of workstations. It consists of observation, data obtained from the industrial shop floor and information recording, critical analysis, and the proposal of new methods or opportunities for improvement. Its use also allows companies to reduce variability in processes and eliminate waste [
54].
The assessment of a process is affected by the participation of value-added actions in it. Compression of time comprising supply, production, and distribution processes becomes more and more often a necessity for many branches, allowing them to stay in the market. Efficient supply chain management results in cutting down the cycle time and lowering costs [
55,
56,
57,
58].
3. Methods and Research Design
A research methodology can be understood as a systematic way to solve research problems, or as the science that studies the way that research is carried out scientifically [
59,
60,
61].
Sometimes more than one method or methodological approach must be used for reaching the research goal(s), which is named methodology triangulation. Triangulation is often used to describe research in which two or more methods or methodological approaches are used, known as mixed methods. In this work, triangulation is used, namely exploratory-explanatory—exploratory approaches.
The method used in this research is the case study. In Ref. [
62] the author considers a case study as an empirical investigation that aims to ascertain a contemporary phenomenon within its real-life context. According to the author of [
62], a case study is a good method for answering “how” and “why” questions. To conduct the present case study, the following four stages suggested by the authors of [
63] were used: (1) defining the research question; (2) data collection; (3) data analysis; and (4) dissemination—that is, disseminating the information through the publication of the case study.
Regarding the Research Question, this company has many and diverse suppliers, some of which are Portuguese, who deliver goods daily. This is the most comfortable condition given the previously defined parameterization, which makes them easier to receive at the warehouse. As for suppliers from outside the EU—in which the goods originate mainly from China—it is difficult to receive the material(s) due to the lack of parameterization of deliveries.
This business model, in which the number of suppliers is high, but the quantities delivered by each is small, makes the parameterization of processes difficult, due to the unpredictability of the type of material to be received. Thus, this challenge was focused on improving the flow of the processes for receiving material, through the following practices: (1) reducing waste, such as the constant movement of employees; (2) balancing processes and respective workstations; and (3) improving the ergonomics of the processes inherent to the operation. The research question of this work is, therefore: how to improve the logistics flow of material reception in the warehouse of the case study company?
According to Ref. [
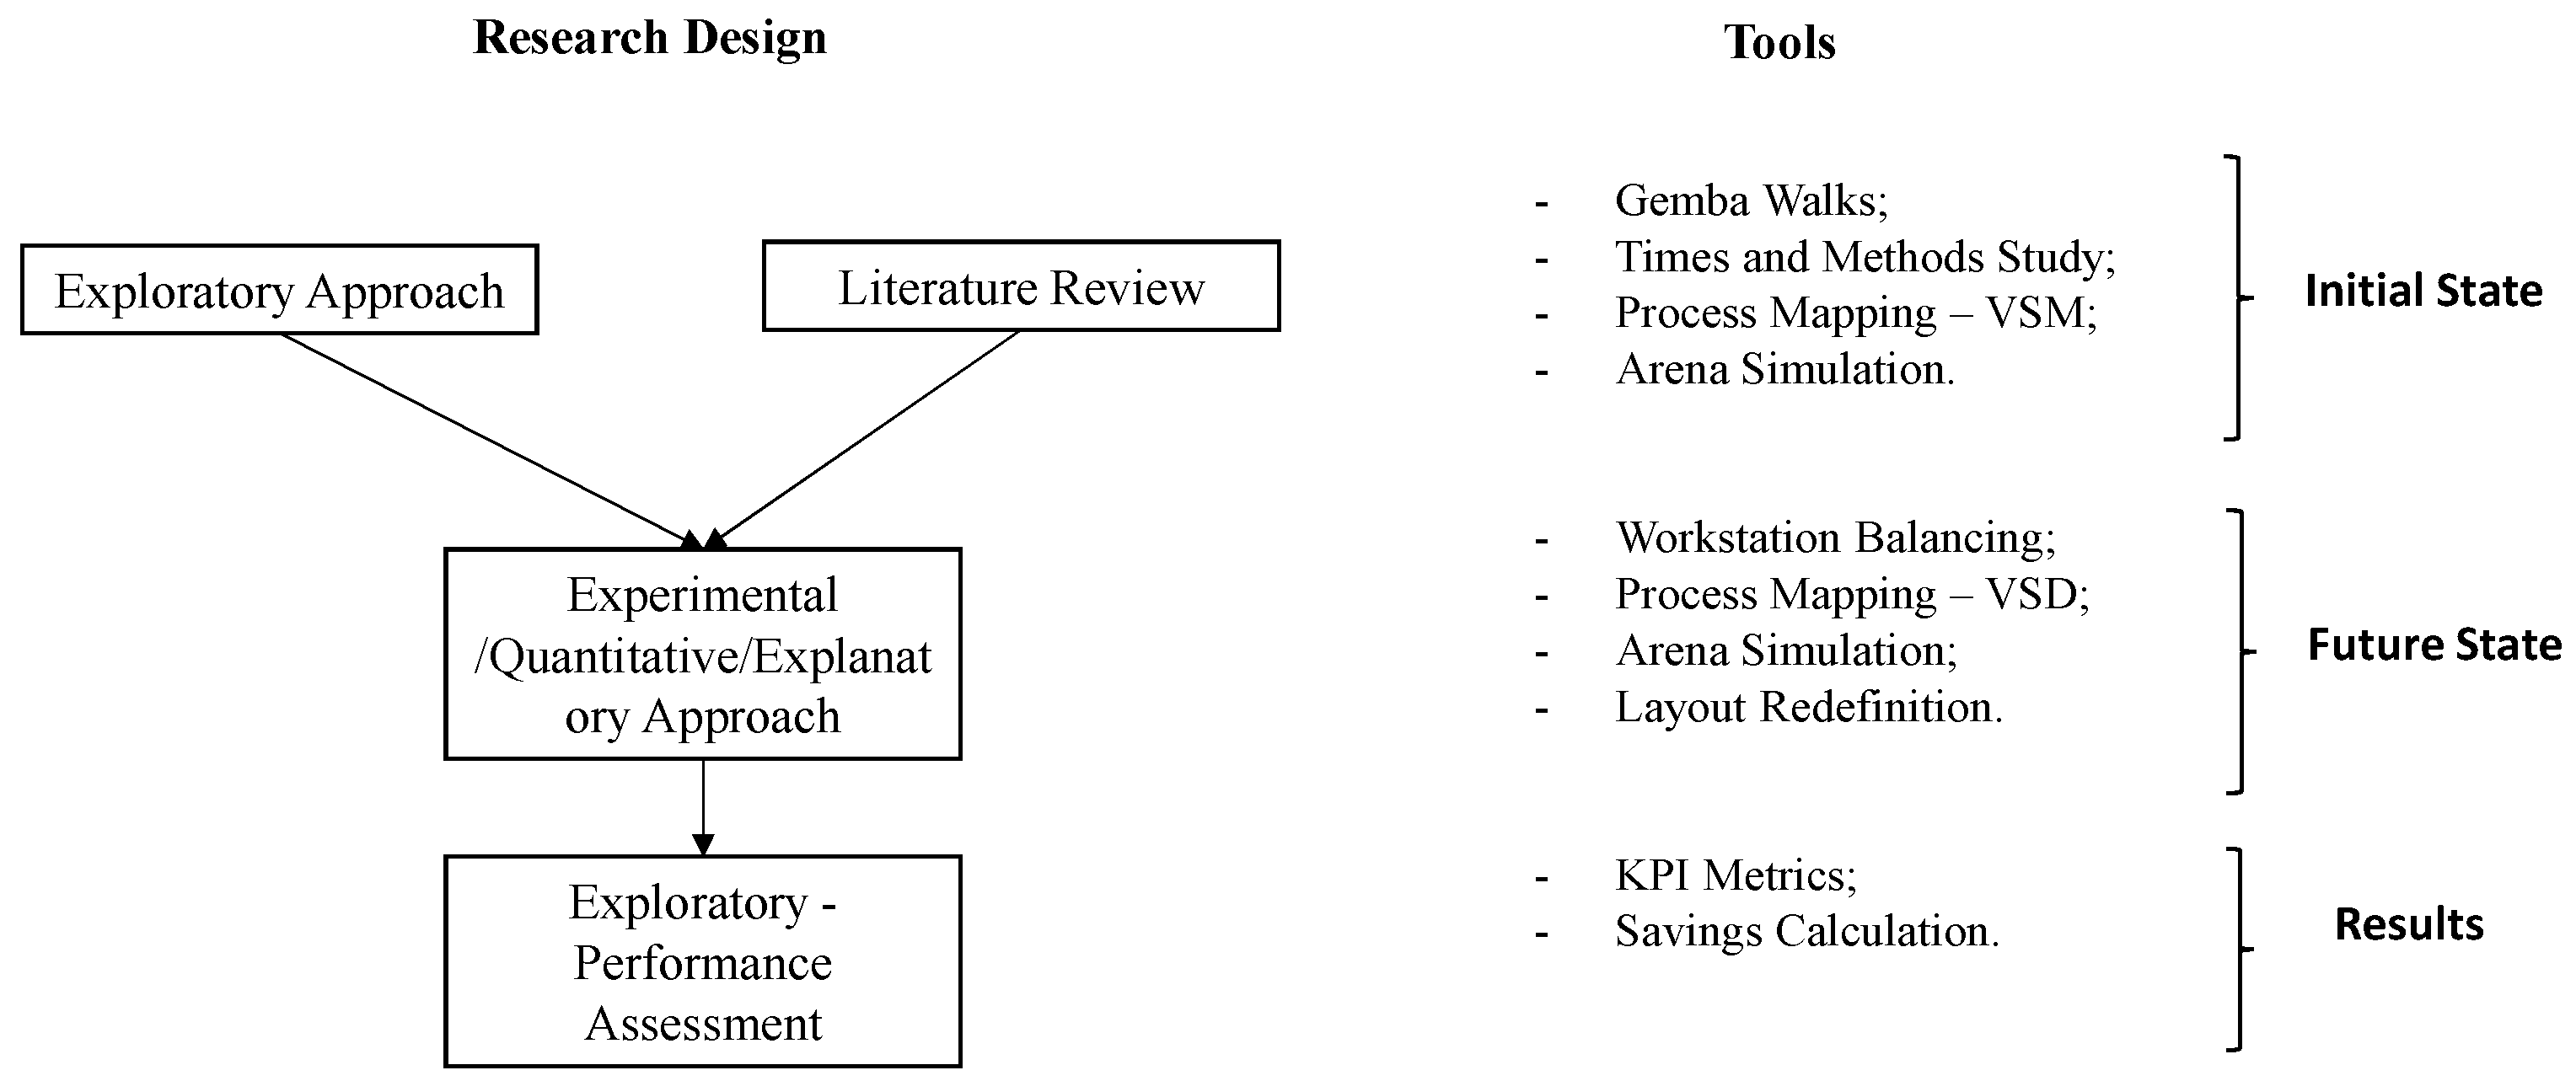
64], this methodology is also suitable for organizational problems and the creation of improvement practices for the problems detected. In our work, an exploratory/qualitative approach is used to analyze and characterize the initial state of the products’ reception process in the company and then define and design the future state through the implementation and monitoring of various tools and methods and the stabilization of the KPIs.
This study emerged as an attempt to deal with a real problem: the lack of efficiency of the logistics flows in the receiving process of a warehouse. For a better way of working, a clean process of investigation should be followed. It was essential to first understand the context of the company under study and then to identify opportunities for improvements. These findings should be clearly listed so that other companies that face similar problems might be able to implement a similar strategy. Therefore, the other approach used in this research was an experimental/quantitative one using process mapping, and arena simulation, among others. To simulate the initial state for mapping the research process and studying the times spent on tasks we used the Arena
® software. It should be noted that the research action methodology is also suitable for organizational problems and the creation of improvement practices for the problems detected, and in this research, we have used it. The action research method allows a systematic approach that makes it possible to find effective solutions to everyday problems, addressing the complex dynamics in a concrete environment [
65], in this case, the daily logistics flows in the receiving process of the warehouse of a company. For this methodology to work, co-operation among the company’s employees and researchers must exist [
66], which was indeed of extreme importance as several aspects of the problem studied required the knowledge of the workers in the field. This kind of methodology favors a principle of “learning by doing” [
67]. Despite these explanations, our choice was the case study because we have tried to solve a problem from a specific company, even if this solution can be applied in another one. In this sense, an exploratory approach was used to assess company performance. In
Figure 1, the research methods and tools that supported this research are summarized.
4. Case Study Description and Data Collection and Analysis
This research was tackled in a company warehouse logistics department. Here, all the material necessary for production is received and it is also here that the same, after being manufactured, is sent to the customer. The warehouse is divided into five areas: reception of material; storage and repacking to supply the production; quality control; transportation; and dispatch. The case study was developed in the material reception area. The activities of this area begin with the unloading of all the material received at the plant and end with its preparation and availability for storage. The data used in this paper are from industry, it was obtained from the industrial shop floor.
4.1. Gemba Walks
The Gemba Walks were used to collect data obtained from the industrial shop floor, also known as
Gemba, on how all the work associated with the process under study is carried out [
68]. This method is characterized by going to the place where the work is in fact executed, in this case, the warehouse. By observing the various procedures associated with the process, we determined that all the material was divided upon reception into unloaded material, workstations, and urgent material. A brief explanation of each type of material is provided next.
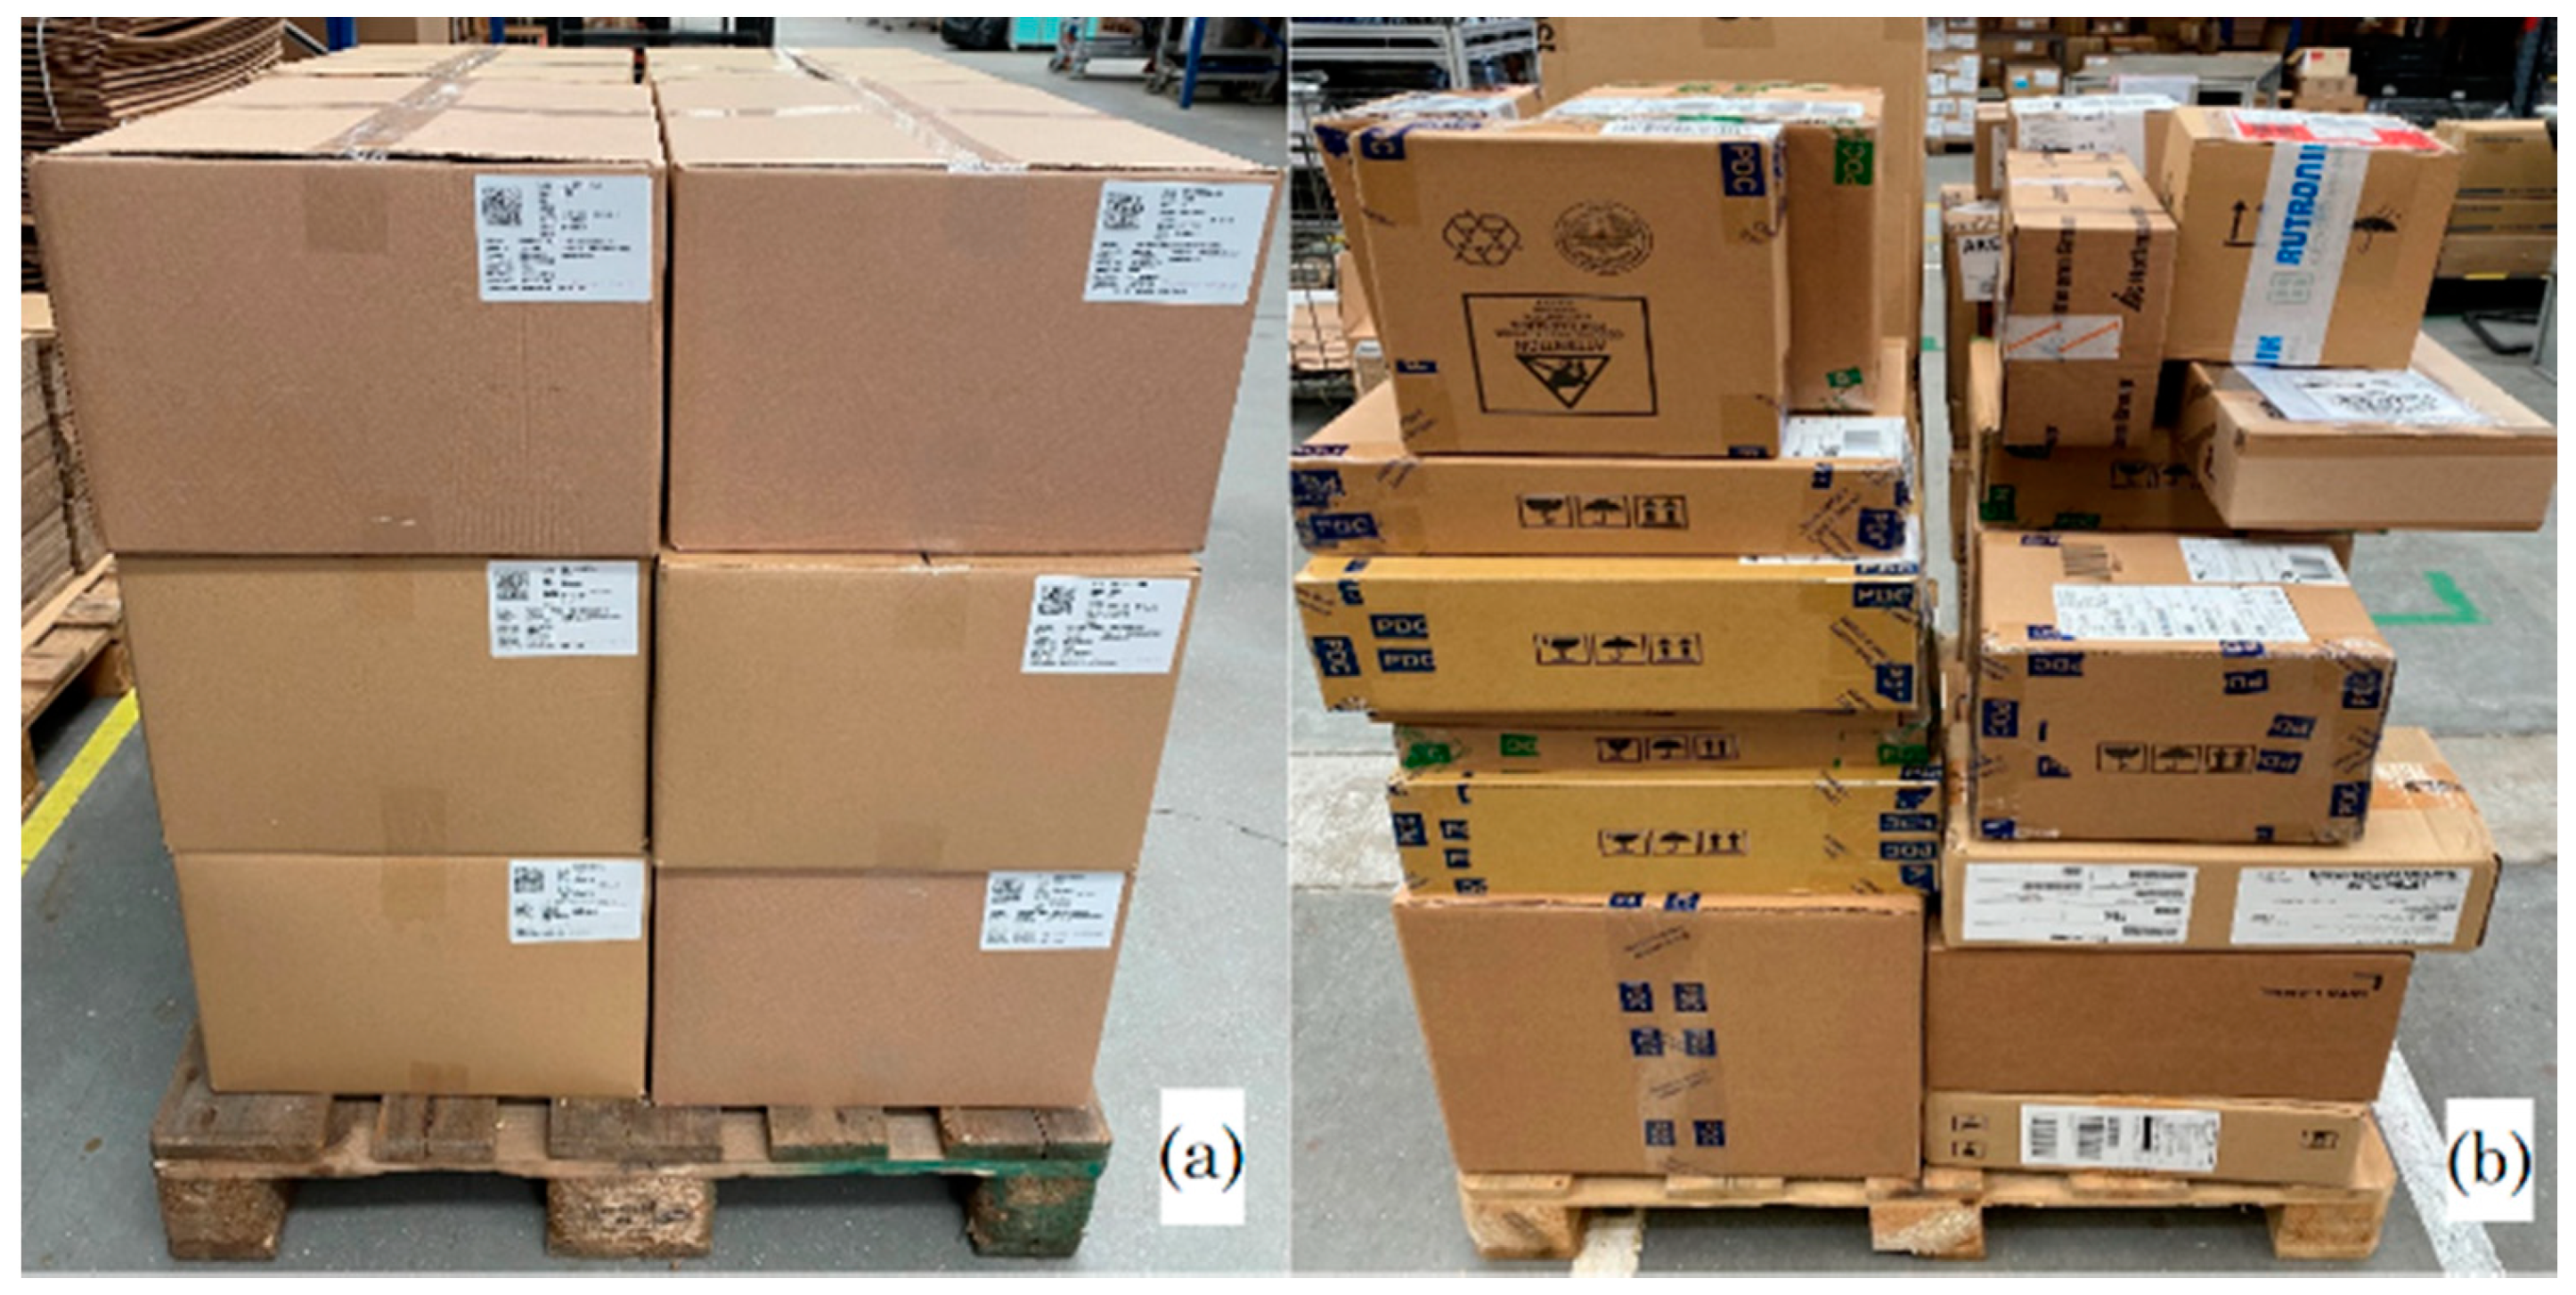
Unloaded Material—When the operators were asked about what factors made them divide the material upon unloading, the answer was that they did so according to the supplier. This forced the operators to be aware of all the company’s suppliers, which generated constant doubts, in addition to not being a standardized process. The process was analyzed in detail. To facilitate this analysis, an important step was taken at the beginning of the work which was to assign the terms Single Code (SC) (
Figure 2a) and Multi-Code (MC) (
Figure 2b) as follows:
Single Code: is the term given when a pallet is filled with a single given code, because the quantity of that material is sufficient to fill the pallet (
Figure 2a).
Multi Code: when the quantity of material having a certain code is not enough to fill a pallet, different codes are assigned (different materials/products), which may or may not be from different suppliers (
Figure 2b).
Workstations—In the Gemba Walks we also identified several points of possible slowdown and inefficiency issues through conversations with operators. One of the issues identified was the high level of clutter at the workstations due to the need for the operators to move to their own station to collect pallets for their work. This was a waste of time, as the operators had to clean up their work area before starting the procedures to which they were assigned. These movements were also associated with possible loss of concentration on the part of the operators. Furthermore, the movement of empty pallets within the workstation was carried out using a pallet truck, which could reduce the ergonomics of the workstation, given that the work ends up being somewhat physical and repetitive.
Urgent Material—When production needs material that has already been unloaded but has not yet been processed in the receiving facility (and is queued), this material is called urgent material. During the Gemba Walks, we observed that the pallets were being unloaded and the material was queued while waiting to be received. The wish of the plant operators was that this material spent no more than two days waiting in this stage, between the unloading and the end of its reception processing. However, what happened was that the material languished in these queues between 5 and 20 days. As the queue grew, so too did the amount of urgent material needed on the production line. This created a bottleneck problem. Consider as an example that cable X (fictitious name) is required at production and this cable is queued. Besides demanding time in searching for the cable (because while the material has not completed the reception stage there is no information about its location), there will be a greater amount of queued material that, sooner or later, will also be urgent for production.
Two operators are needed whose sole function is to consult the list of urgent material, go in search of it, and receive it ahead of the rest of the material in the queue. During the Gemba Walks, we noted that the main cause for the existence of these queues was a poor balancing of workstations.
4.2. Times and Methods Study
Along with the process mapping, several times studies were performed to characterize the initial state of the process using the Arena
® software. These identified bottlenecks and provided data for making a comparison with the future state. After mapping the process and defining all of the tasks, a study of times and working methods was carried out to quantify the impact of each task in the process (
Table 1). We measured and monitored the operators in their daily routine, timing all tasks performed by them, thereby collecting information that was later used to identify waste and possible improvements. The unit of measure chosen was the pallet—the time that, on average, a pallet took for each task was measured. With this information, we grouped the tasks by process type and calculated the average Process Time for each process.
Single Code pallets took 1.7 min to be unloaded, 0.7 min to be recorded, and 0.8 min to be checked, making a total of 3.2 min, which is the Process Time (the time that the pallet takes to be processed from the moment it is unloaded until it is ready to be stored). For Multi Code pallets, the unloading time was 7.0 min, and then 3.8 min more to be moved to their respective area/lane. These values were equal to the pallets going to the Bulk area or to the ones going to the FIFO area. From here on, the pallets go to different destinations and therefore have different times in the remaining tasks.
A pallet that is considered bulky is repalletized after arriving at its designated area, taking an additional 13.4 min, and then recorded and checked, demanding 2.7 min and 3.5 min more, respectively. Adding up the average time of all these tasks, the Throughput Time of a Multi Code pallet that goes to the bulky area is 30.4 min.
If the Multi Code pallet goes to the FIFO area, it is only recorded and checked. These tasks take 26.0 and 250.0 min, respectively. Thus, the Throughput Time of a Multi Code pallet in the FIFO area is 286.8 min (
Table 2).
Once the logistics process was well-described and quantified, it was necessary to understand the impact of each task on the company’s day-to-day operations. This mapping alone does not allow any conclusions to be drawn since if, for example, a task that takes 1 min is repeated 300 times in a work shift, it has more impact than a task that takes 30 min but is performed only 5 times during the same period. In this way, all materials unloaded during the month of November 2020 were registered. With these records, the necessary inputs were extracted in order to understand the distribution and frequency of these two types of pallets (Single Code and Multi Code). In addition to recording the quantities per type of pallet, the times at which they were unloaded were also recorded, to observe if there was any pattern (
Table 2 and
Table 3).
The information in
Table 3 shows that the Single Code pallets were delivered to the warehouse reception three times per day, with an interval of approximately 4 h between these deliveries, while the Multi Code pallets were received twice a day, at 10 a.m. and 1 p.m.
Table 4 shows the total number of each type of pallet received at the warehouse’s reception desk during the month of November and also the daily average, which shows that considerably more Single Code pallets were received than Multi Code pallets.
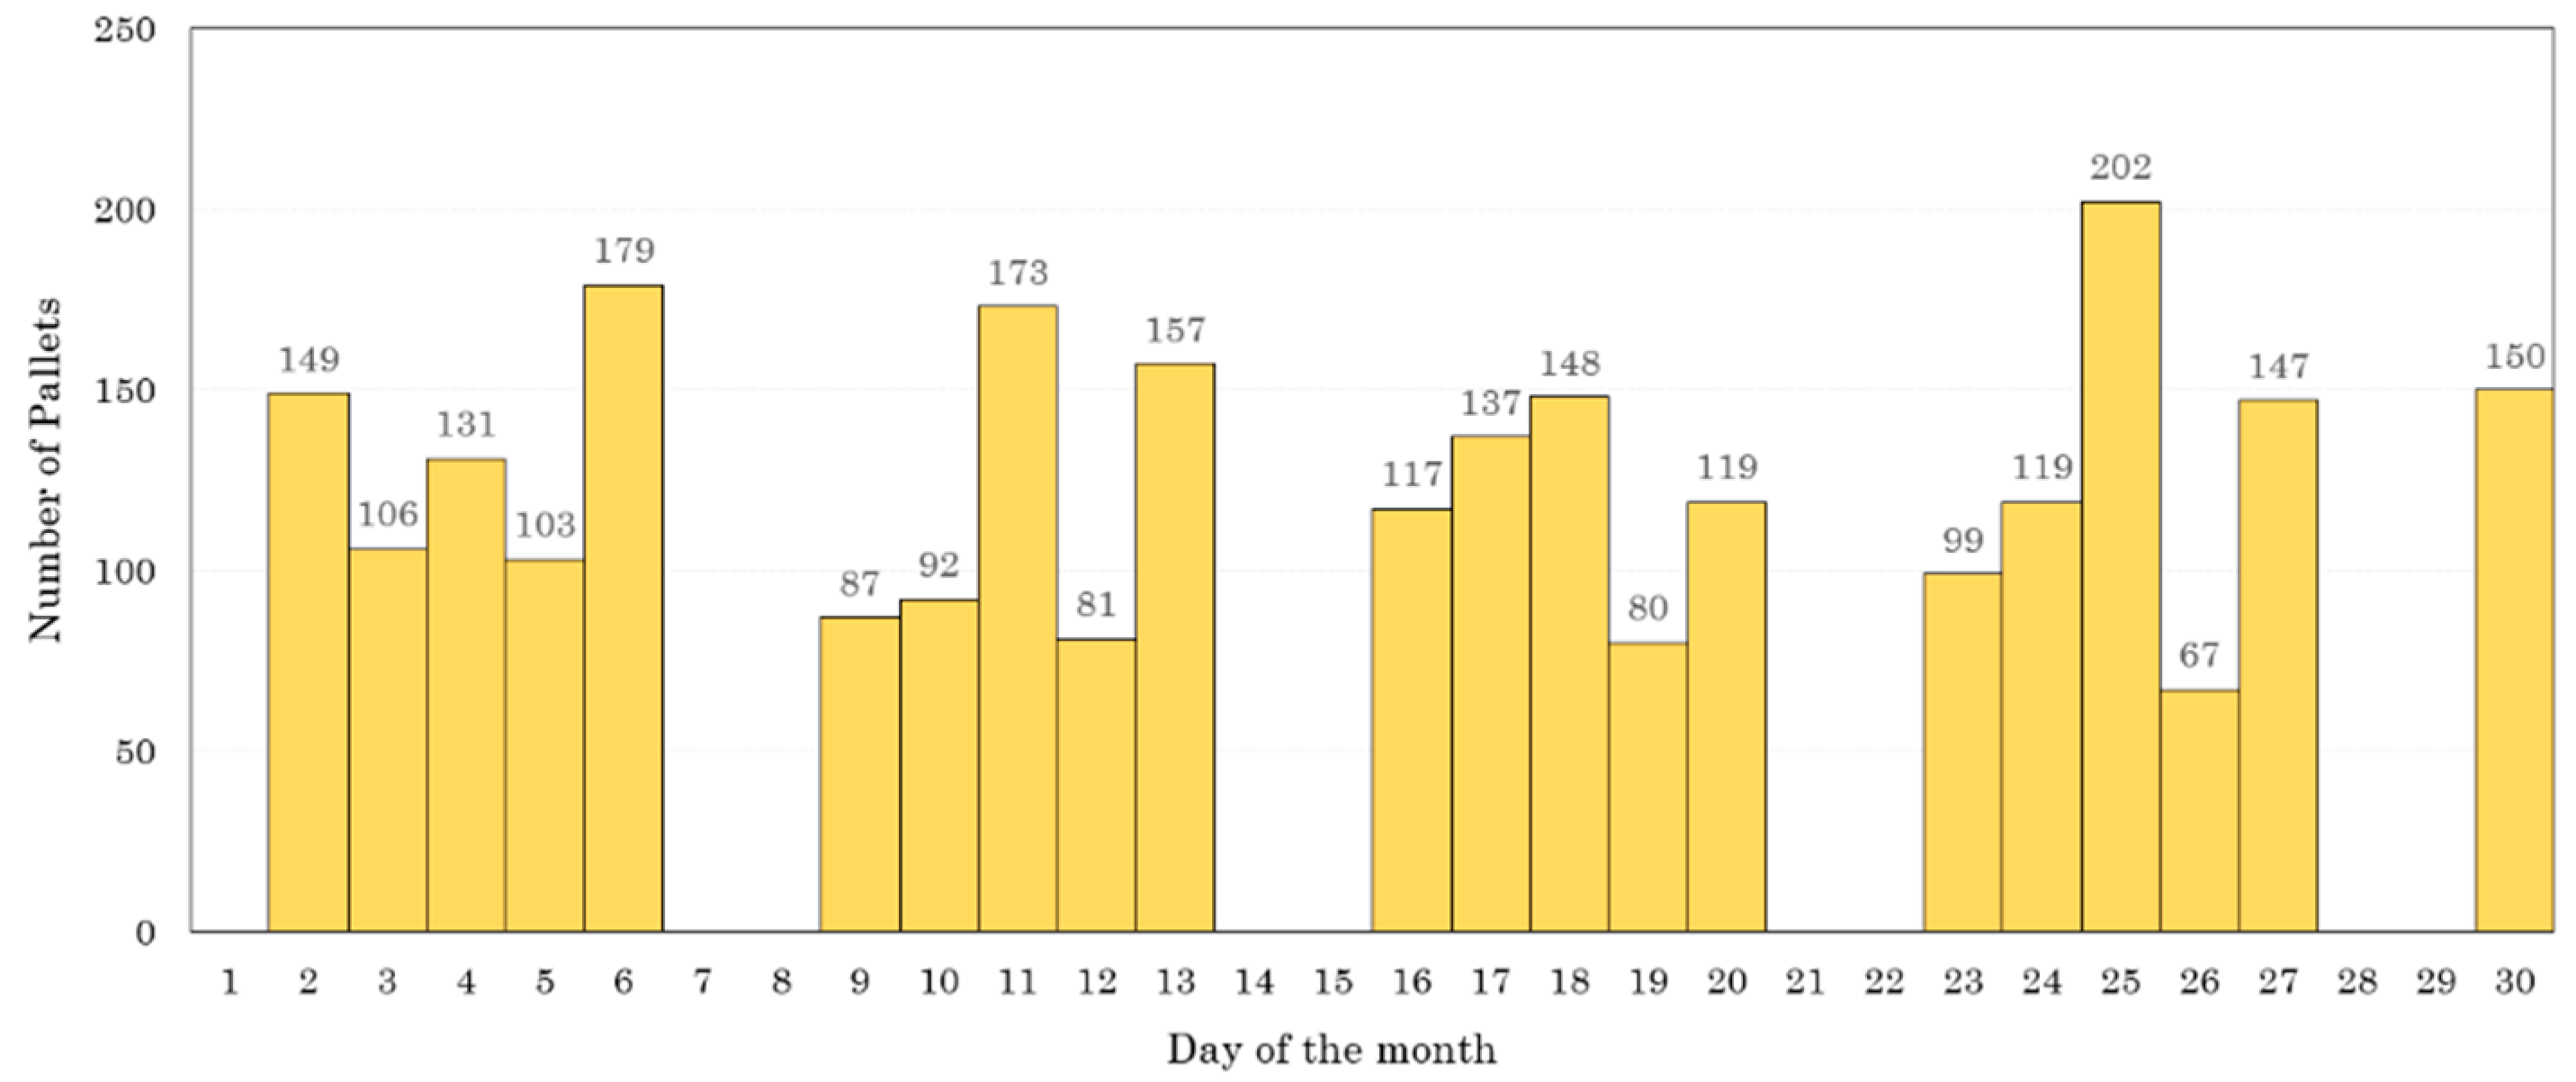
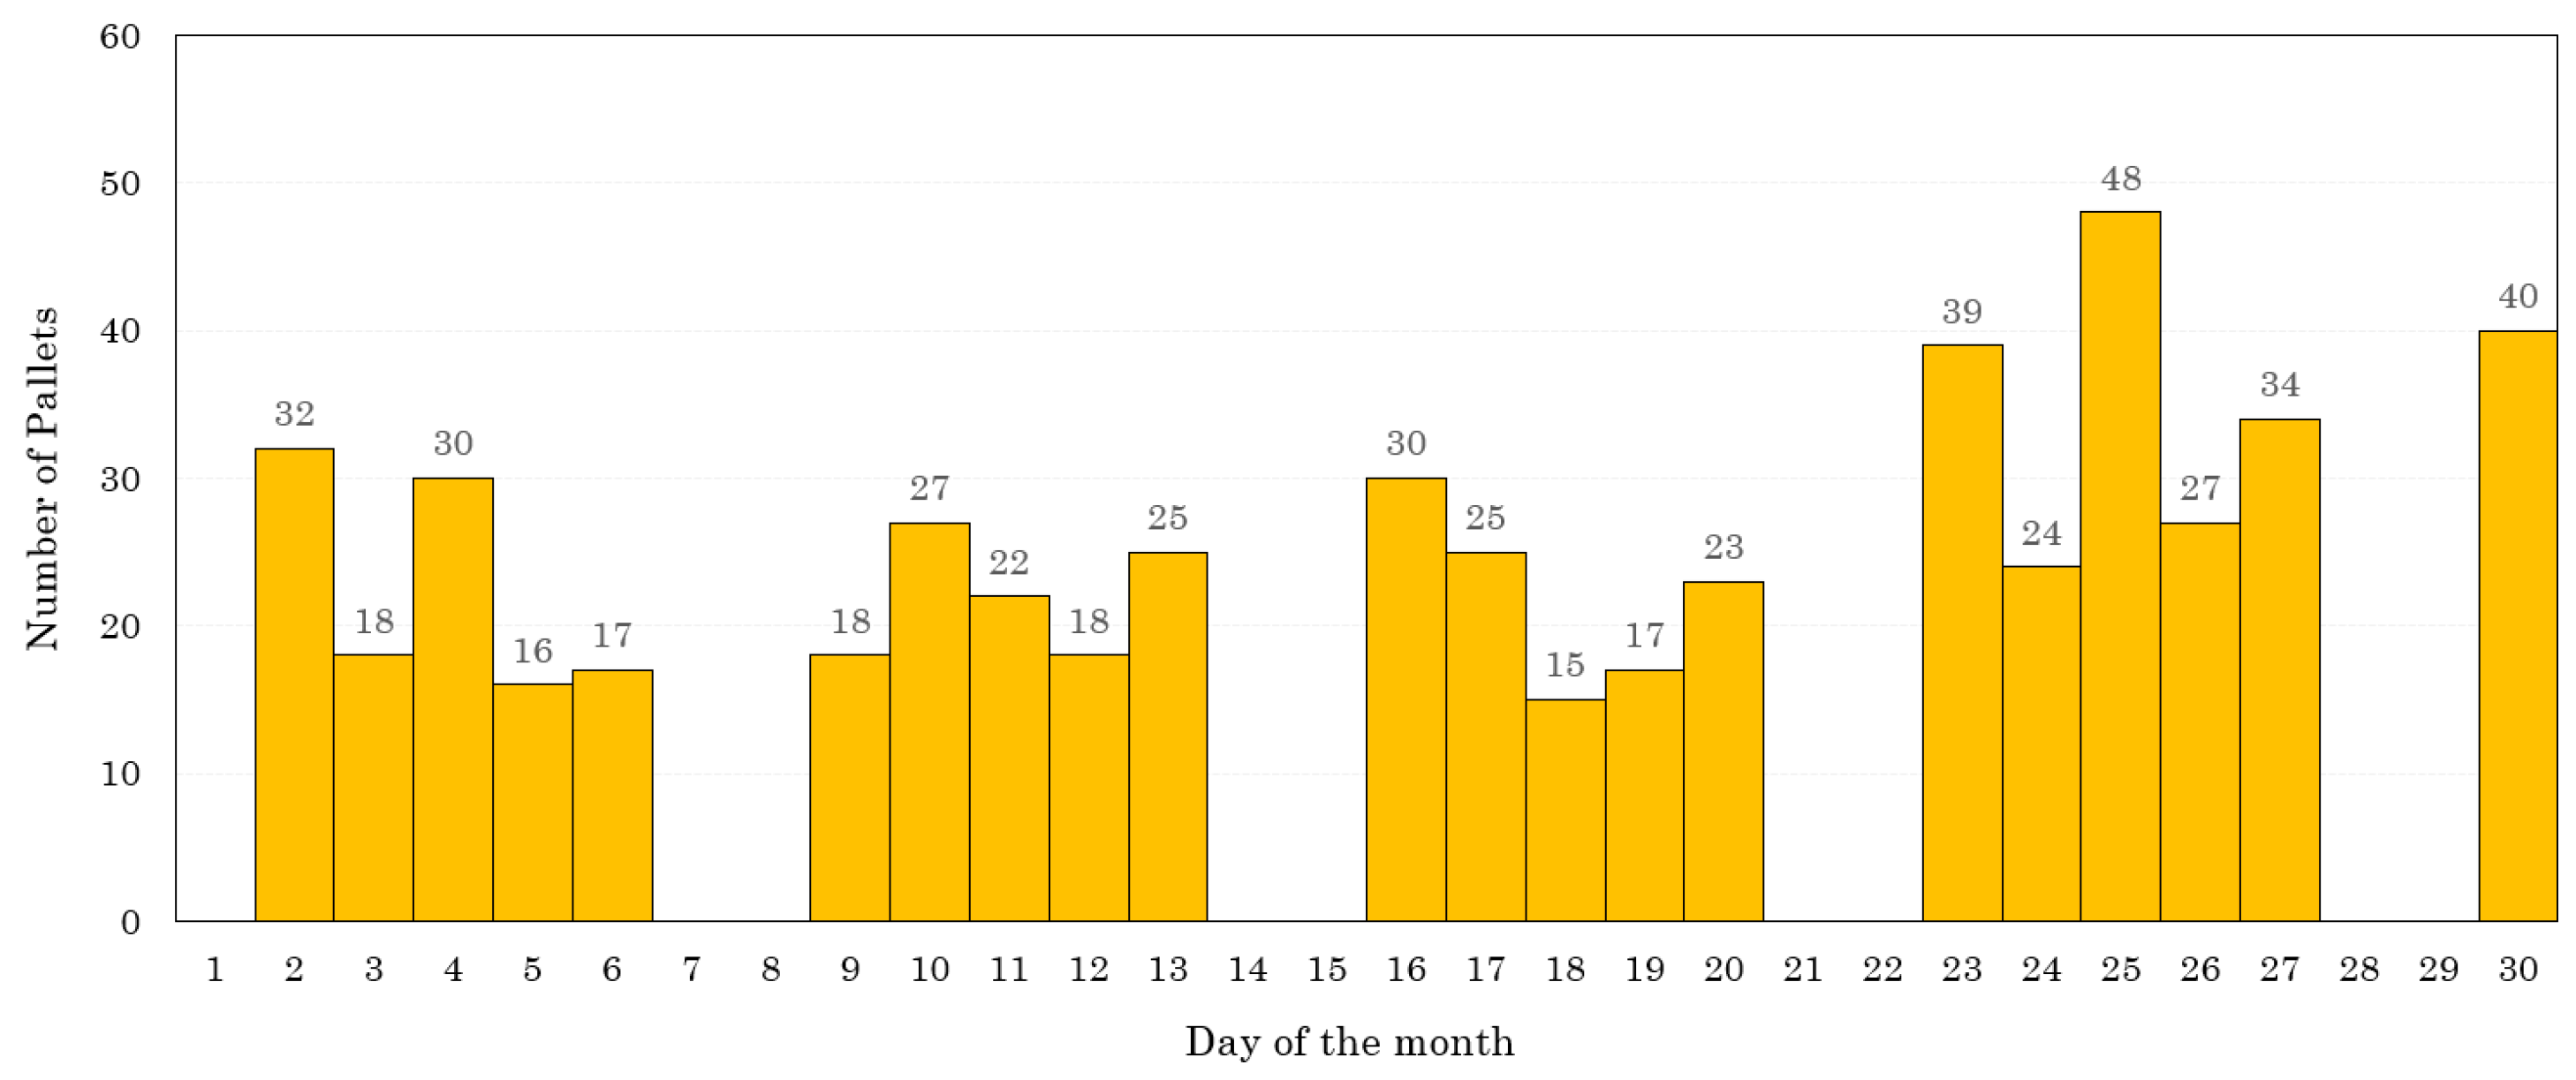
Finally, two charts were developed (
Figure 3 and
Figure 4) showing the daily trend in the number of pallets received during November 2020, for each pallet type. Although the slight downward trend over the month for the Single Code pallets was not significant, which may have been caused by the fact that on day 26 only 67 pallets were received, the number of Multi Code pallets showed constant growth over the month, which points to the continuous growth of the company’s activity, and consequently the need to make more purchases and, in turn, receive more pallets.
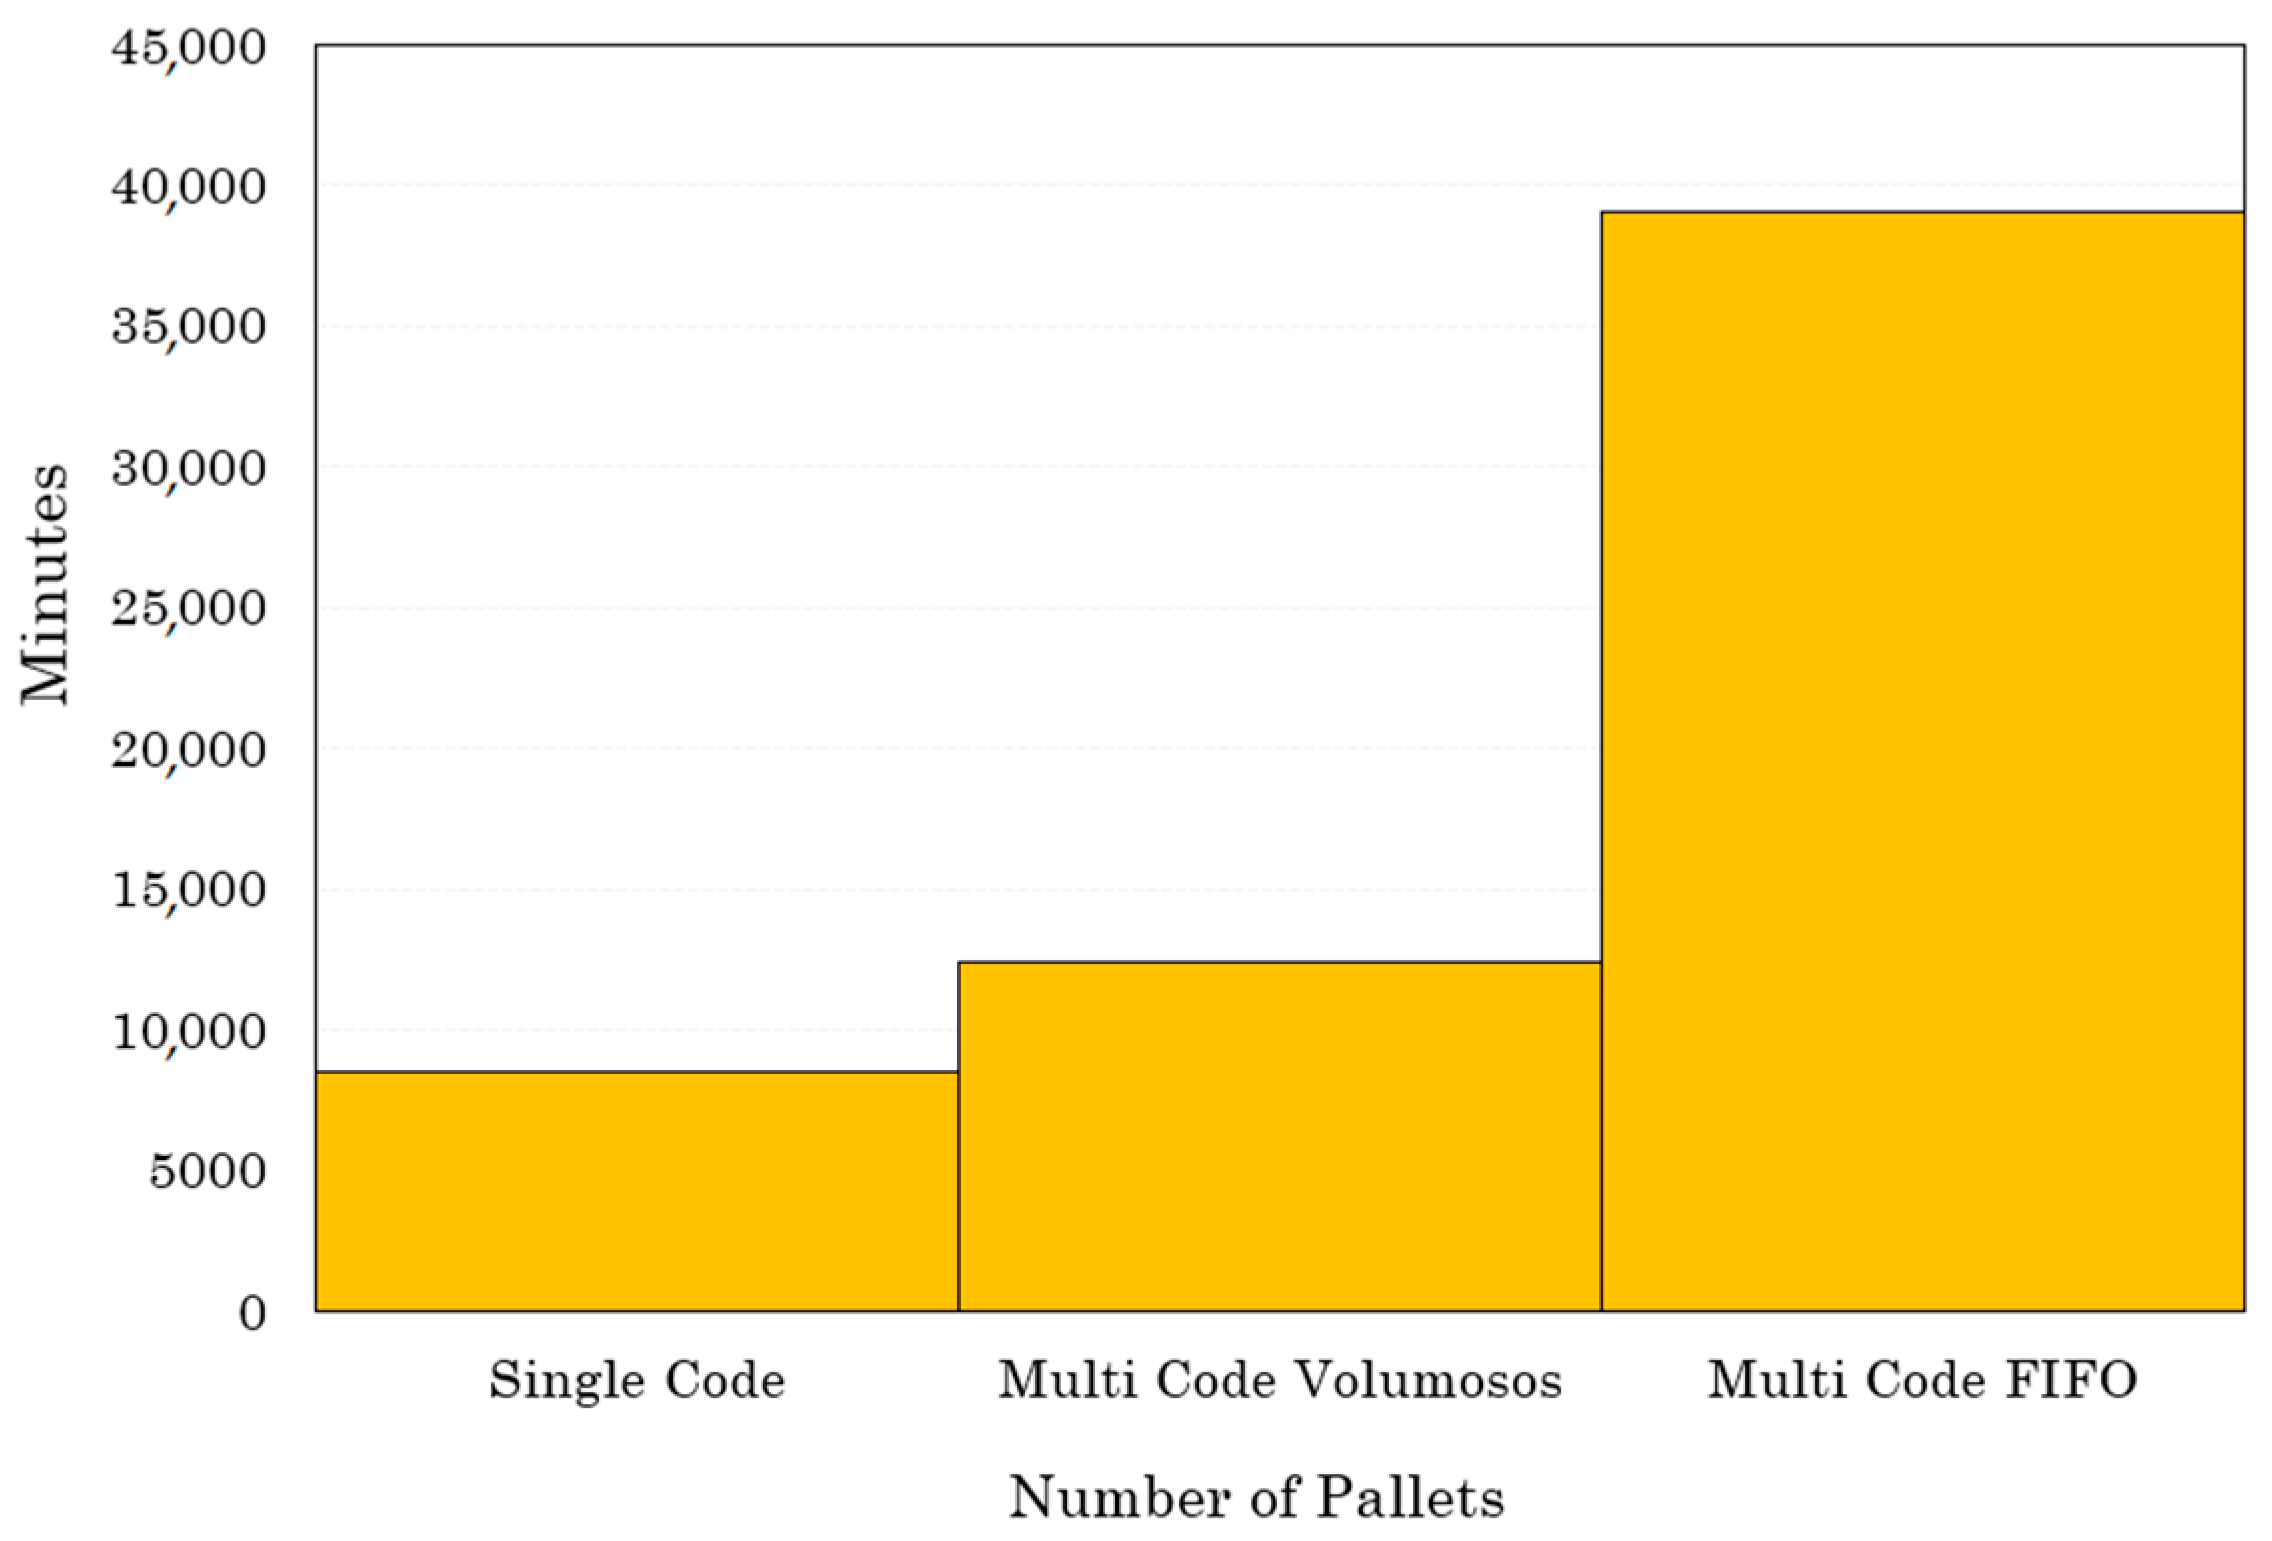
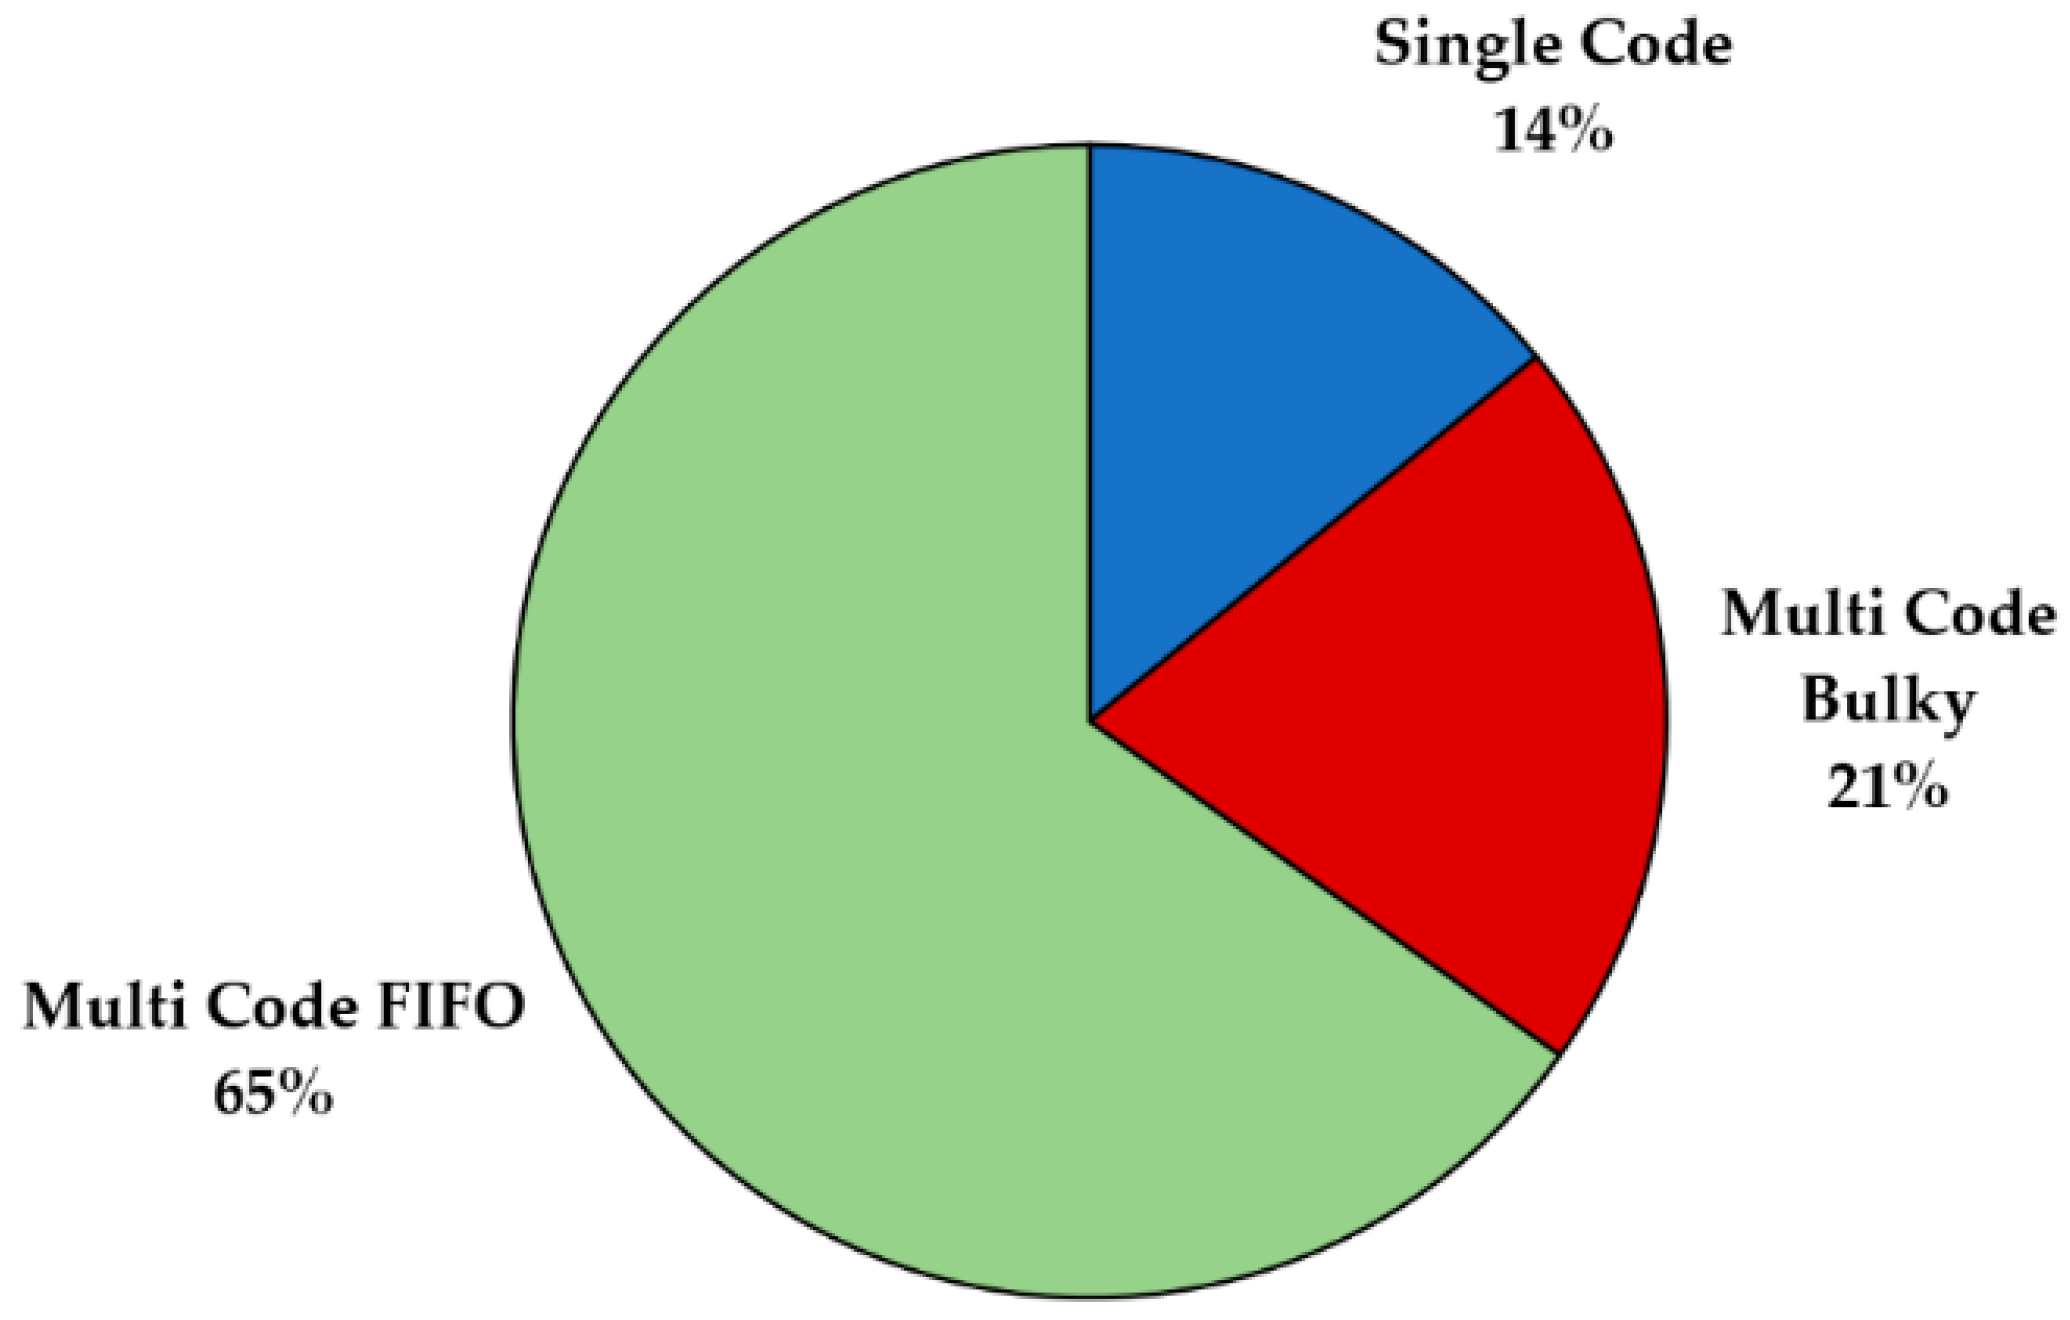
As mentioned, during the processing of the pallets in the receiving area the Multi Code pallets are divided into two sub-types and sent to the corresponding areas, Bulky and FIFO. Through physical verification of the reception process, and all the following methods associated with its detailed analysis, we determined that 75% of the Multi Code pallets should be treated in the FIFO area and the remaining 25% in the Bulk area. Once the times spent by each receiving process had been measured, it was important to observe the proportion of the time spent in processing each type of pallet. Based on the results obtained through these measurements, two charts were prepared (
Figure 5 and
Figure 6).
Figure 5 and
Figure 6 reveal that the time spent processing Multi Code FIFO pallets is considerably greater, at least three times more than the time spent with each of the other two pallet types (Single Code and Multi-Code Bulky). We thus identified the greatest point of inefficiency at the reception stations (the place at which the improvement effort should be first focused).
In a second phase, in the definition and design of the future state, a balancing of processes was carried out, as well as a study for a change and improvement of the layout. In this study the application of pallet moving systems was considered, to automate the process, improve ergonomics and the organization of workstations (through the application of the 5 S’s). To this end, the AutoCAD® (Autodesk, San Rafael, CA, USA) tool was used to ensure the feasibility of the implementation, so that the measures of the designed layout correspond to the intended reality.
4.3. Process Mapping
We then carried out a Process Mapping followed by a VSM development [
69] in order to represent and identify the various types of wastes. After having observed at a macro level how the reception of material was organized, a process mapping was carried out to understand all the tasks that are performed. Regarding this second step, a visual scheme was first elaborated that included the detail of the process and all associated procedures (
Figure 7).
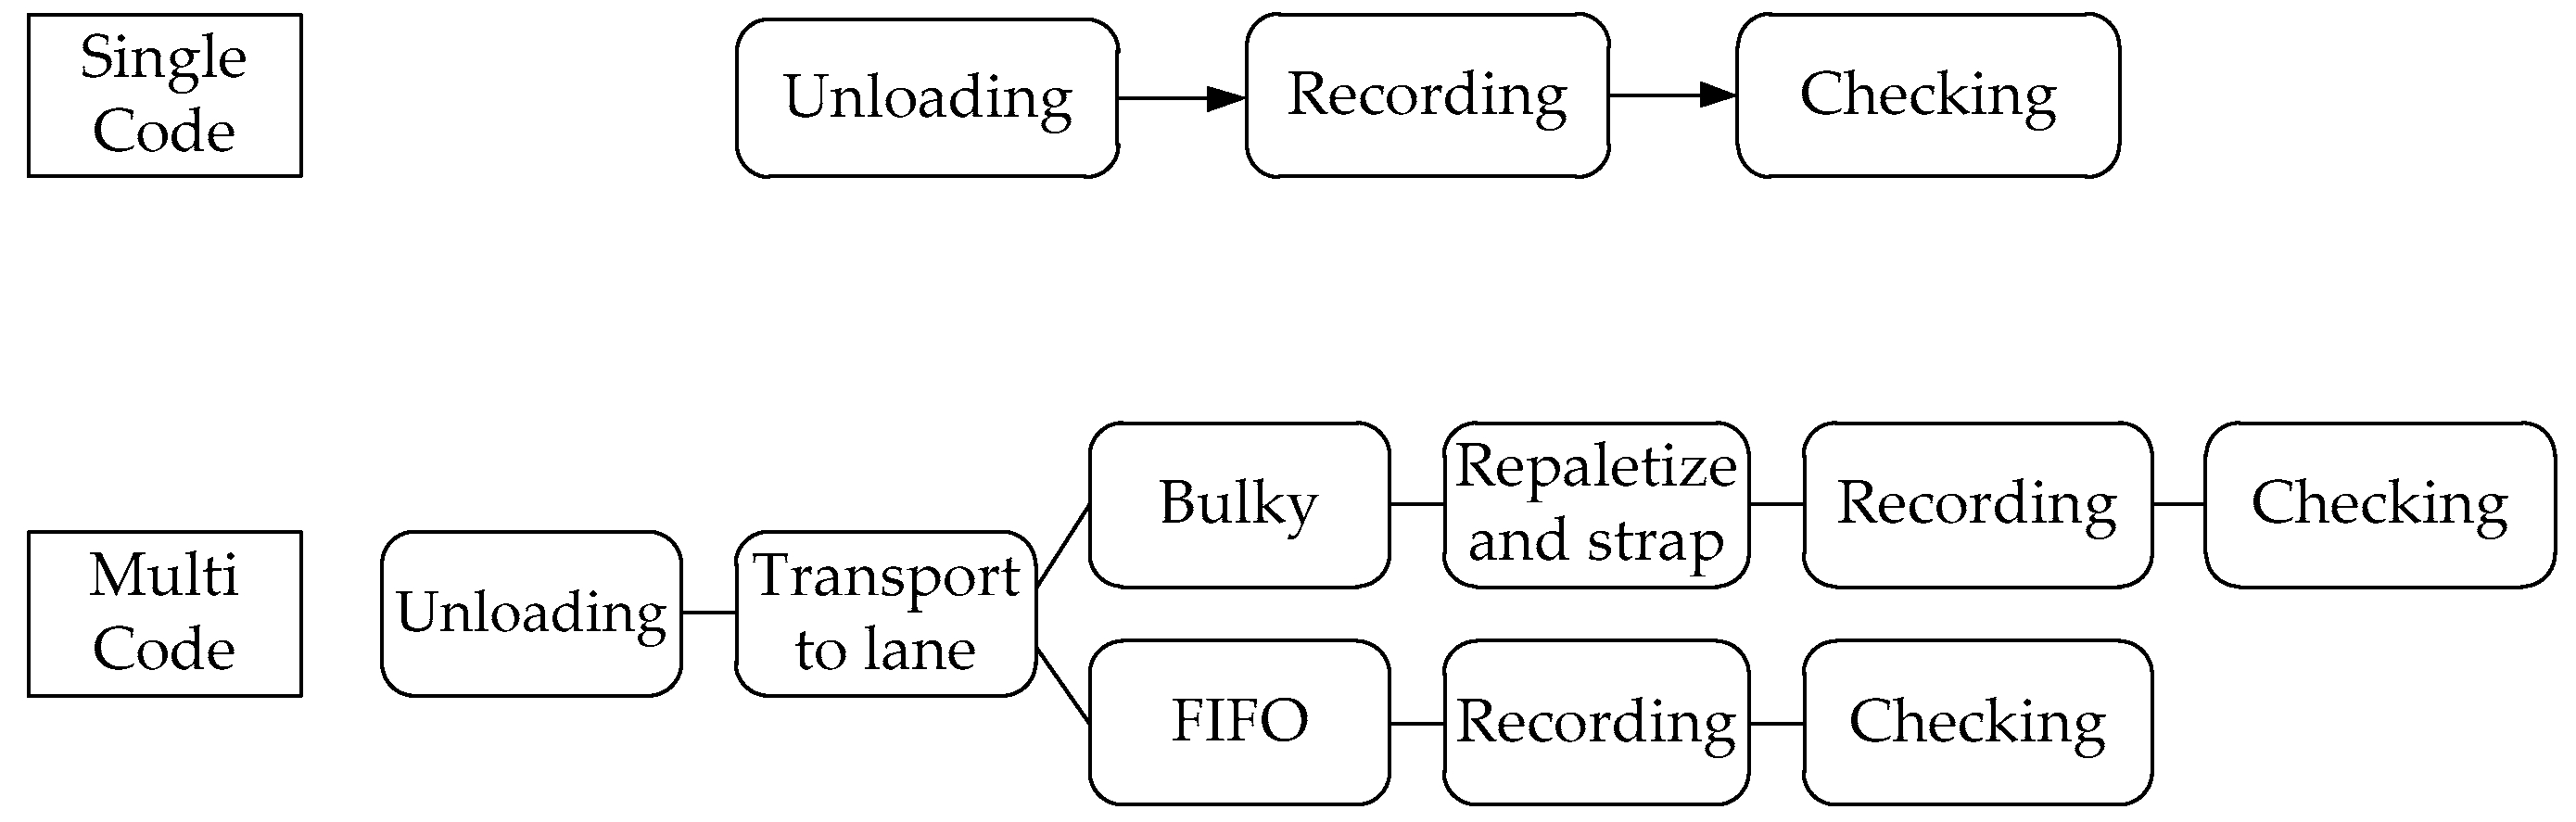
In more detail, the flow of Single Code pallets consisted of: (1) unloading—the pallets were unloaded from the conveyor and placed in the bulk area; (2) recording—the codes were recorded in ERP SAP, to enter them into the system and thus make it visible to the whole plant that these codes were already available for production; (3) checking—confirmation that the codes and respective quantities of the invoices that were recorded corresponded to the existing material. After this confirmation, the internal labels were printed and glued to the material. With the labels already glued, the pallets remained in the same place waiting for the allocator, who is external to this receiving process, to come and remove them from that location and position them in the warehouse.
Regarding Multi Code pallets, the flow consists of: (1) unloading—the pallets are unloaded at the docking area; (2) transport to the lanes—after unloading at the dock station, the material is separated by type (Bulky or FIFO) and moved from the dock to its respective area; (3) bulky—the pallets that had been moved to the Bulky area are repalletized, to form Single Code pallets, and strapped with tape so that they can be safely placed in a rack. Then the process is followed with the previously explained recording and checking steps; (4) FIFO—In this area, the pallets are Multi Code. Therefore, after the material is recorded in SAP, these pallets undergo a more thorough and time-consuming checking process, since the codes have to be separated by electric or mechanical means and labeled/checked one by one.
4.4. Value Stream Mapping
4.4.1. Initial State Characterization
In order to verify which improvement opportunities exist in the processes, eliminating waste and inefficiencies, Value Stream Mapping was applied to each of the pallet types previously defined. With this method, it was possible to verify the relationship between the processes on the shop floor.
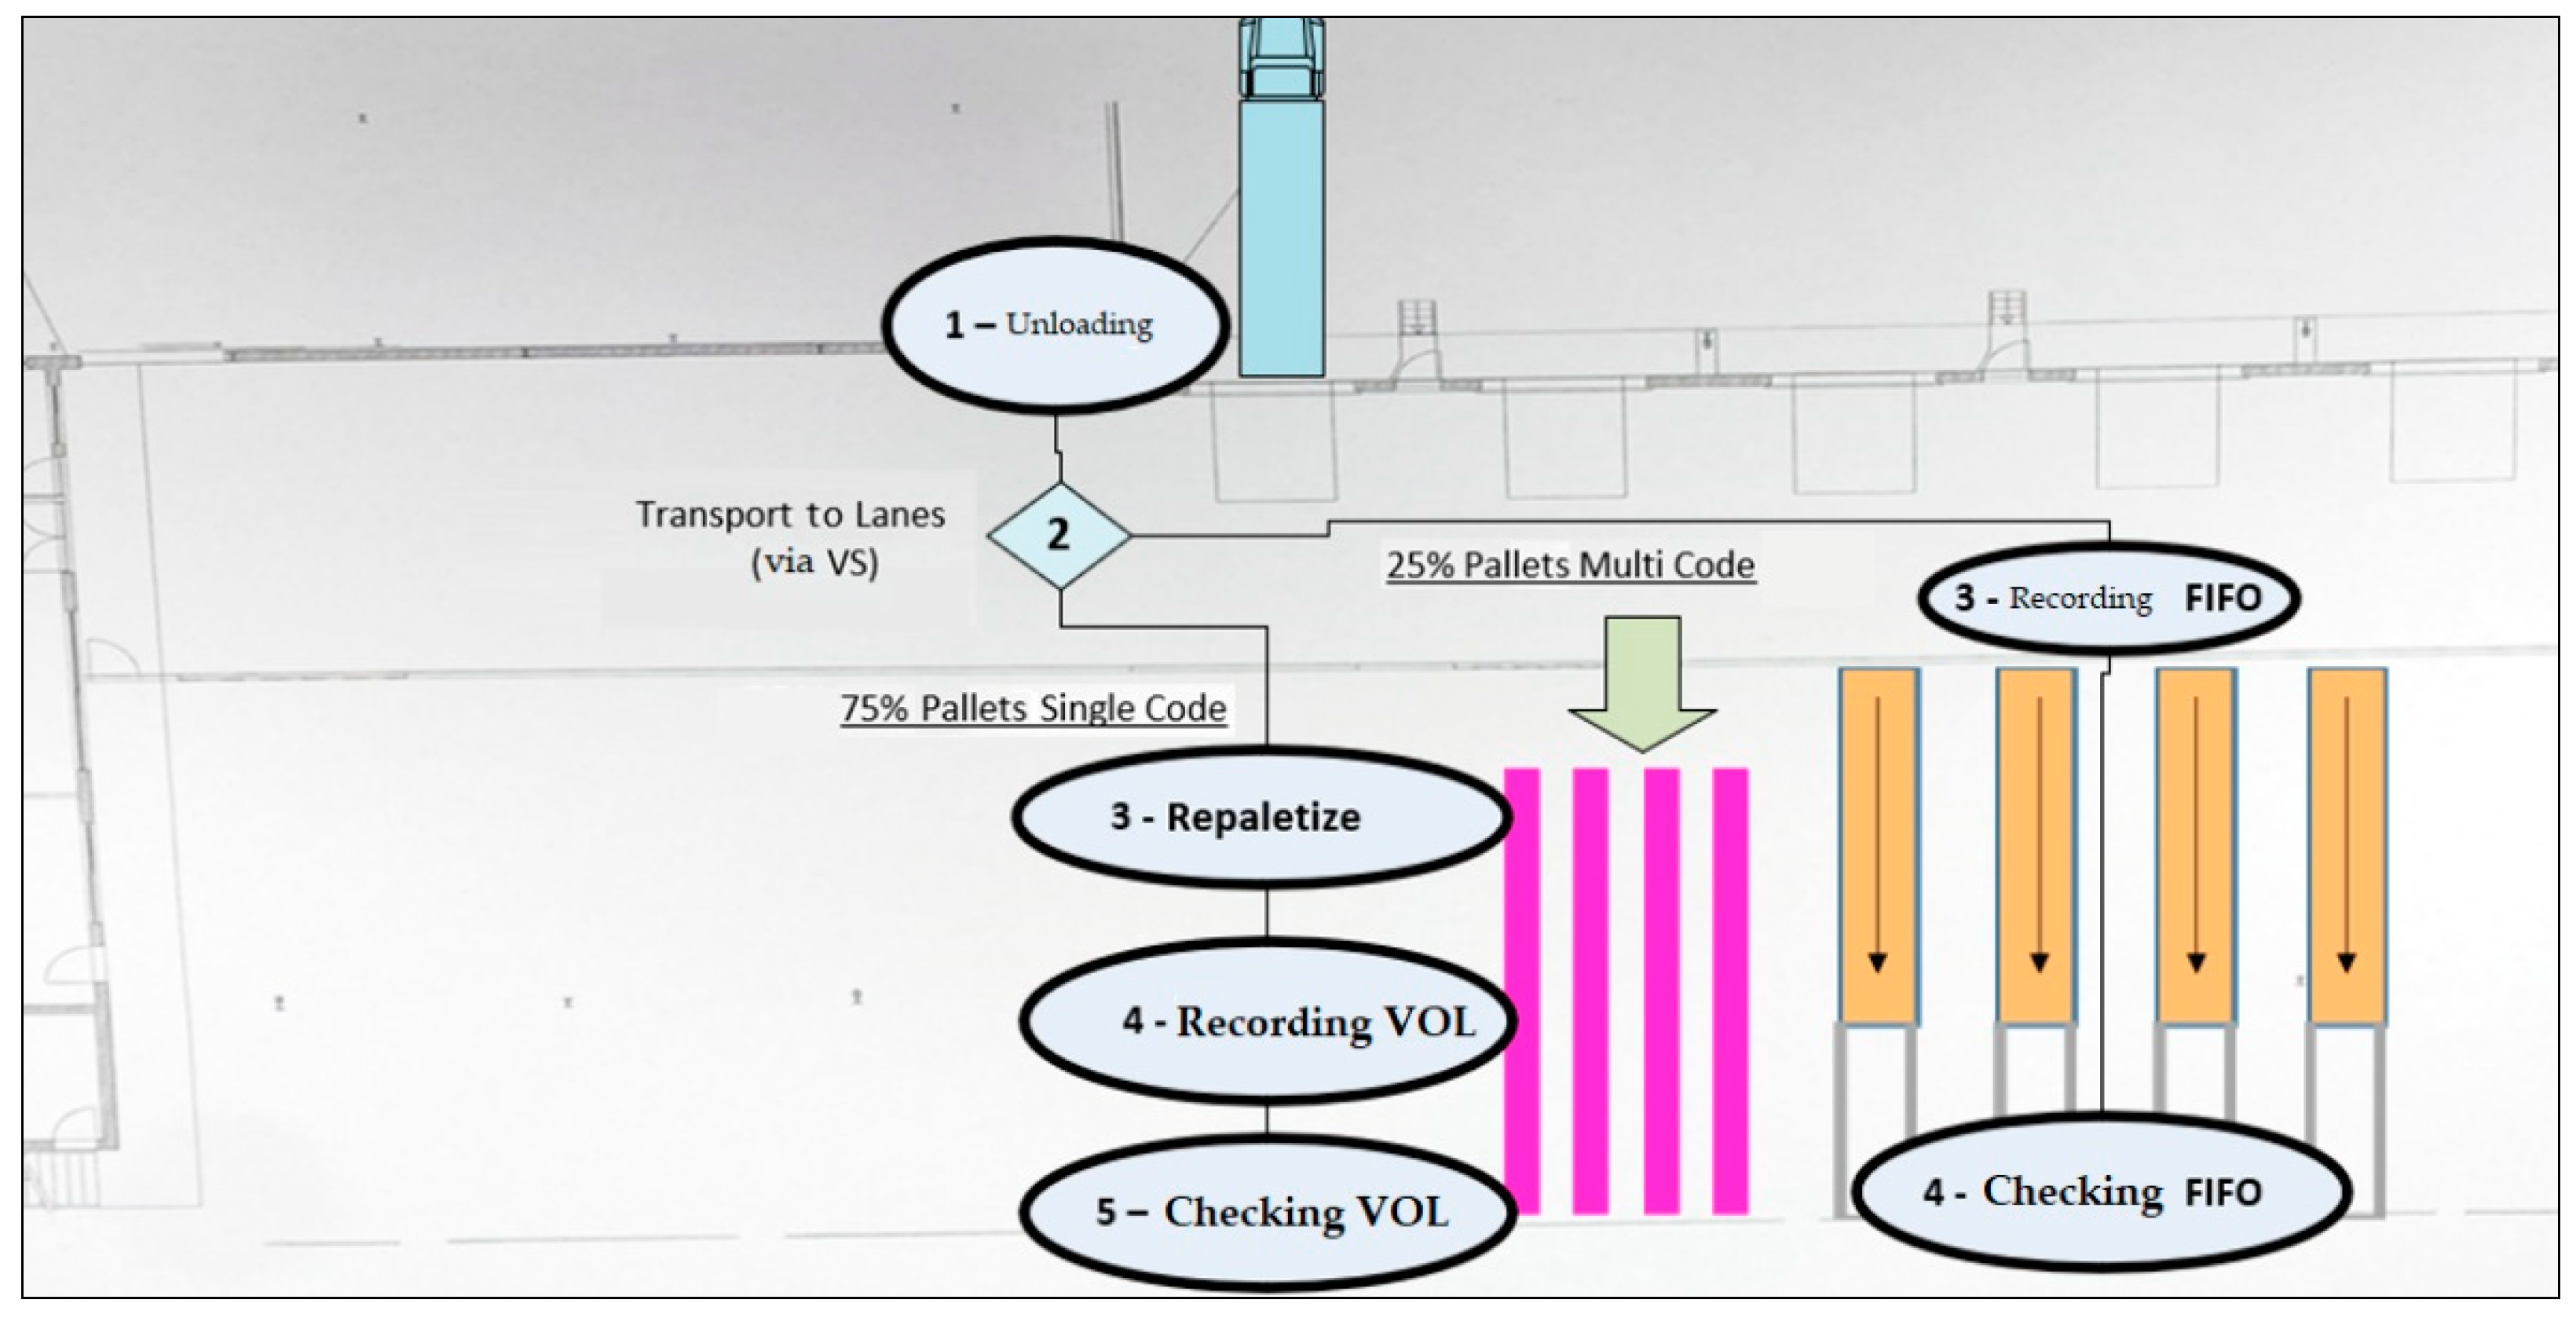
Single Code Pallets—As can be seen in
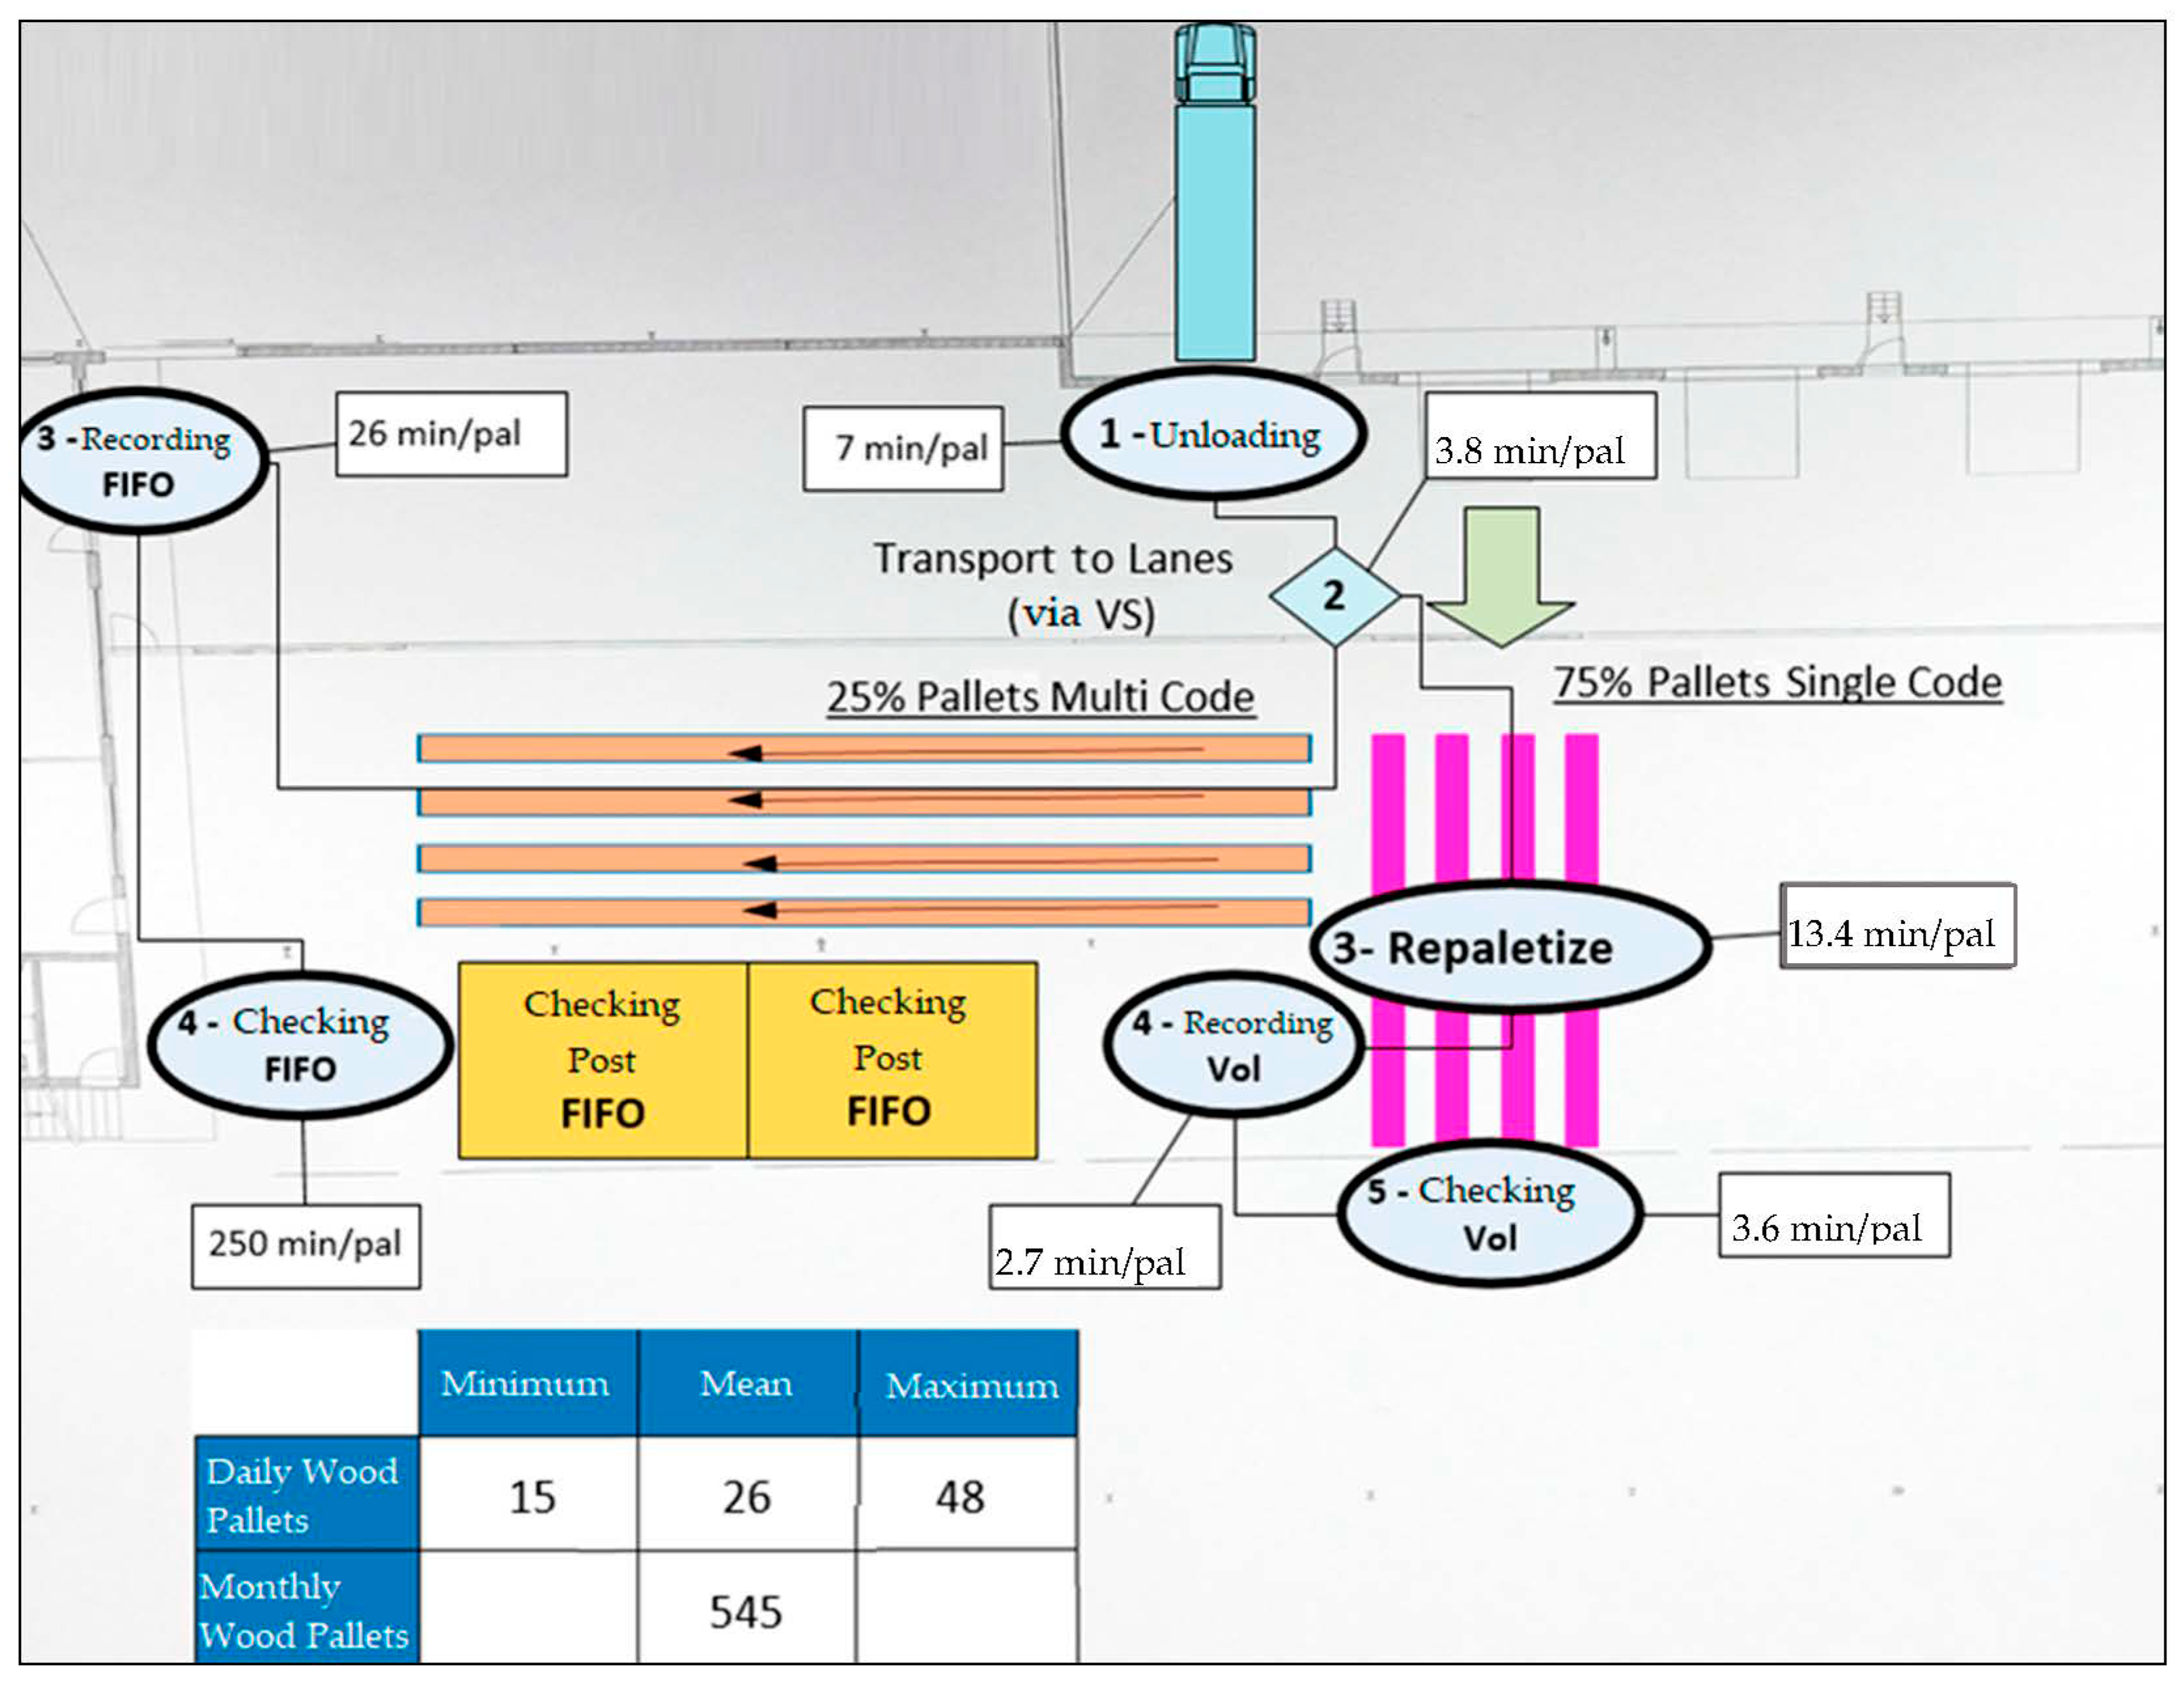
Figure 8, the process begins with the unloading of the material from the supplier. Thereafter this load is moved to the vertical lines (pink), by an operator. Here the pallets wait while an operator records them, entering them into the system, and consequently checking them. Once checked, the pallets are available for allocation and remain in this same area until someone in charge of production comes to pick them.
Multi Code Pallets—In the case of an unload (point 1 in
Figure 8) of Multi-Code pallets, the first step (marked in point 2) is, with the unloaded Multi Code pallet, to try to form Single Code pallets. If this is possible: (i) they are moved to the vertical lanes (pink), an area dedicated to Single Code pallets; (ii) in this area they are repalletized, that is, carefully formed and strapped with tape to be safe for storage; (iii) in the next step the material contained in the pallets is recorded in the system, thus “entering the material into the system”; (iv) finally, the pallet is labeled and properly identified, thereby ending the reception process.
If it is not possible to form Single Code pallets the following steps are taken: (i) the pallets are moved to the horizontal lanes (orange color); (ii) thereafter each pallet is recorded in the system; (iii) finally, the material is labeled and properly identified, thereby ending the reception process.
4.4.2. Arena® Simulation—Initial State
Once at this stage of the study the initial stage data (the mapping of processes and the study of methods and times) were already collected from the industrial shop floor, it was then possible to simulate the Initial State using the Arena® software.
Based on the measurements made, and since during the month of November 2020, the warehouse’s reception worked three shifts per day (24 h), the following assumptions were considered for the simulation:
21 working days (month of November 2020);
Reception operating in three 8 h shifts (24 h per day);
Results presented in hours;
Daily input of Single Code pallets, minimum of 67 pallets per day, maximum of 202 and average of 126;
Daily entry of Multi Code pallets, minimum of 15 pallets, maximum of 48, and average of 26 pallets.
In the simulation model, the existing workstations were considered, that is, a workstation corresponding to each task except for the FIFO checking task, which has two associated workstations.
The goal of this simulation was to understand how the arrangement of workstations influenced the reception flow, thereby identifying bottlenecks and possible points of improvement. It also allowed us to calculate the number of operators necessary to satisfy the assumed conditions. From this model, the main objective was to understand what could be done to reduce the Throughput Time of each procedure, improving the flow and in this way also reducing the number of operators necessary to satisfy the process needs. The capacity of each task was obtained, which resulted in the total capacity after summation.
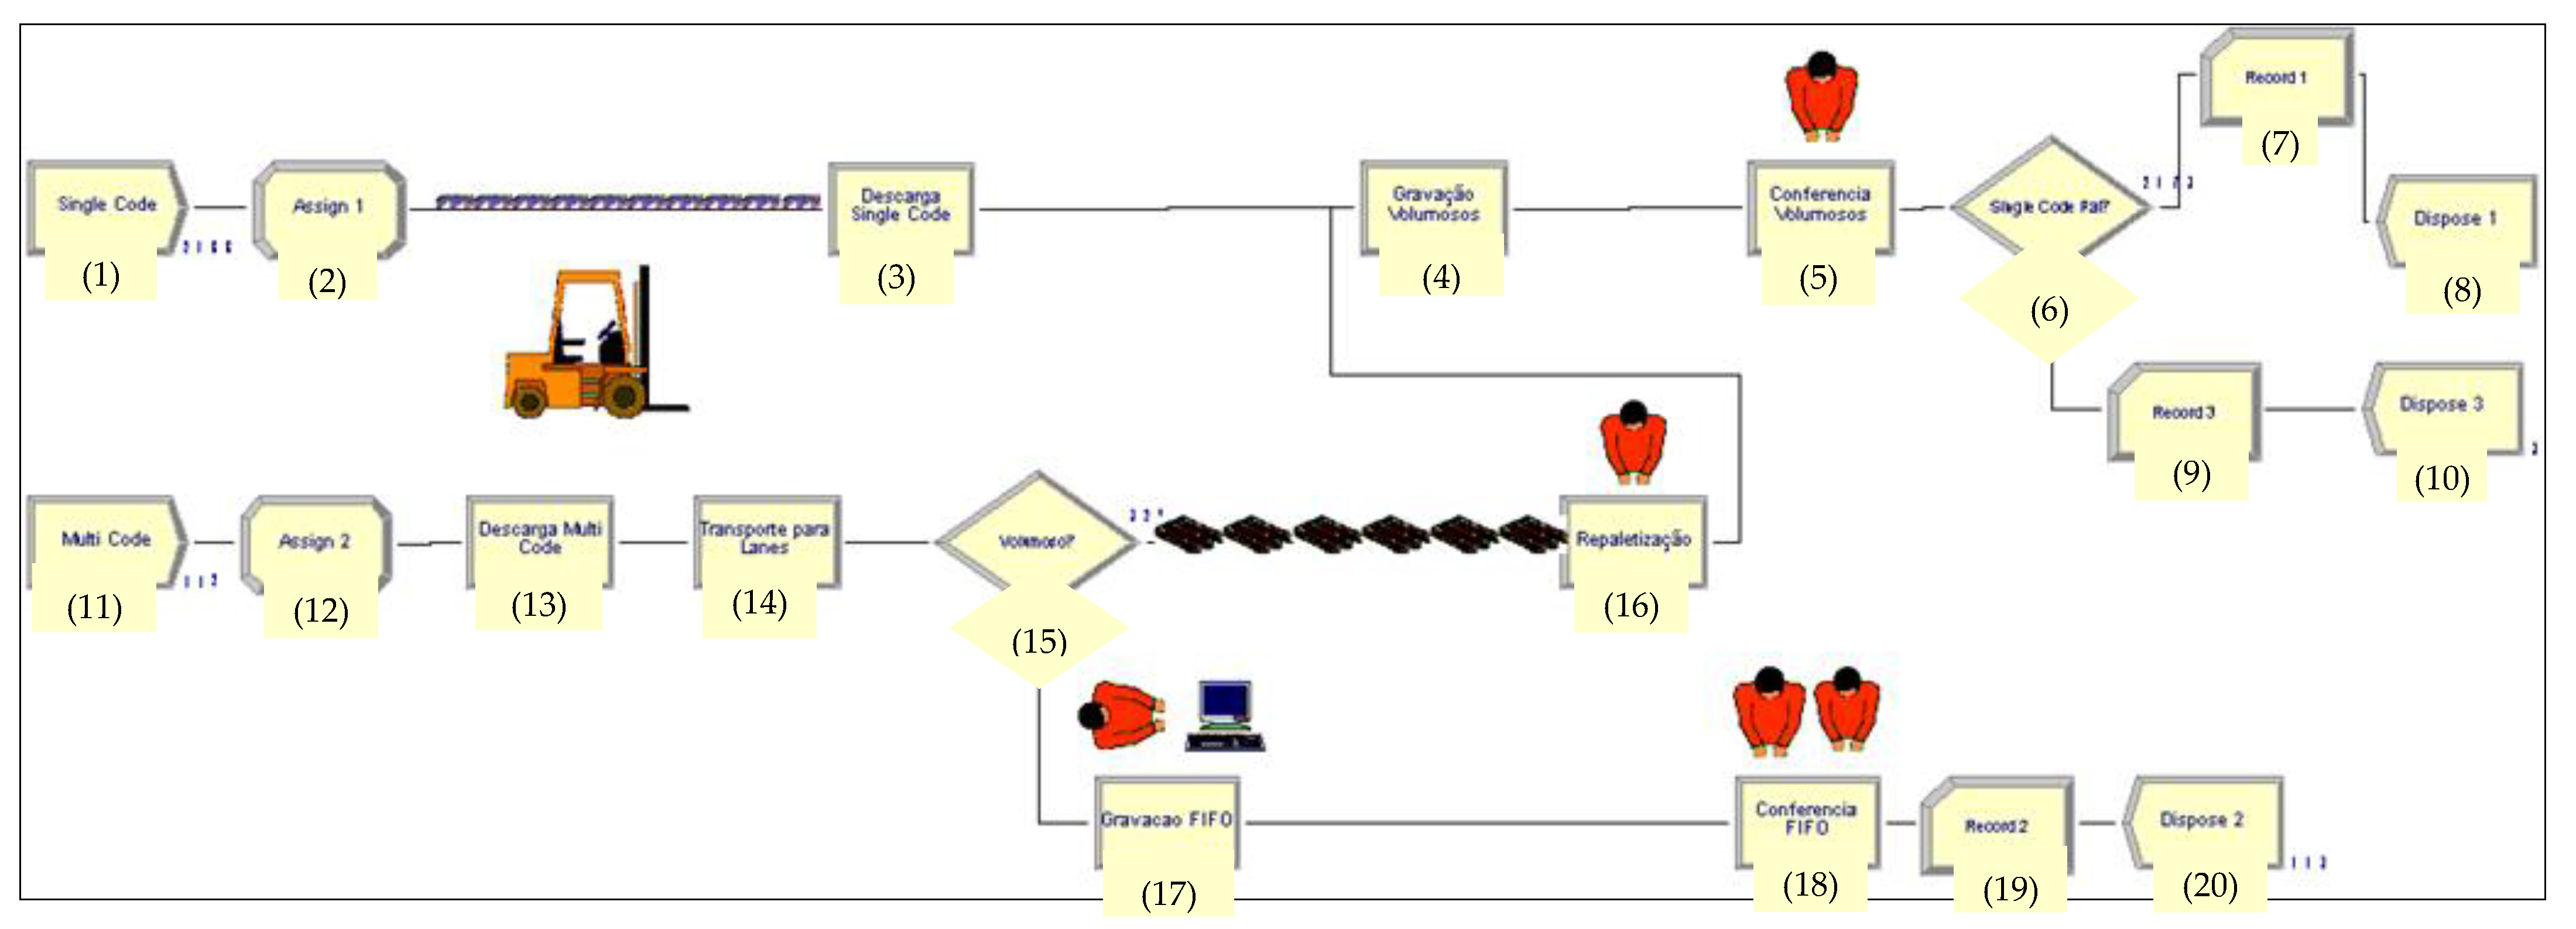
Figure 9 illustrates the model created in the Arena
® software representing the current state of the raw material reception process.
The processes considered in
Table 5 were those found through the process mapping and study of times.
Having defined the model, it was possible to proceed with the simulation, running the model in the Arena
® software and obtain the reports generated (
Table 6 and
Table 7, and
Figure 10) at the end of the simulation, so that they could be analyzed and conclusions could be drawn about the initial state.
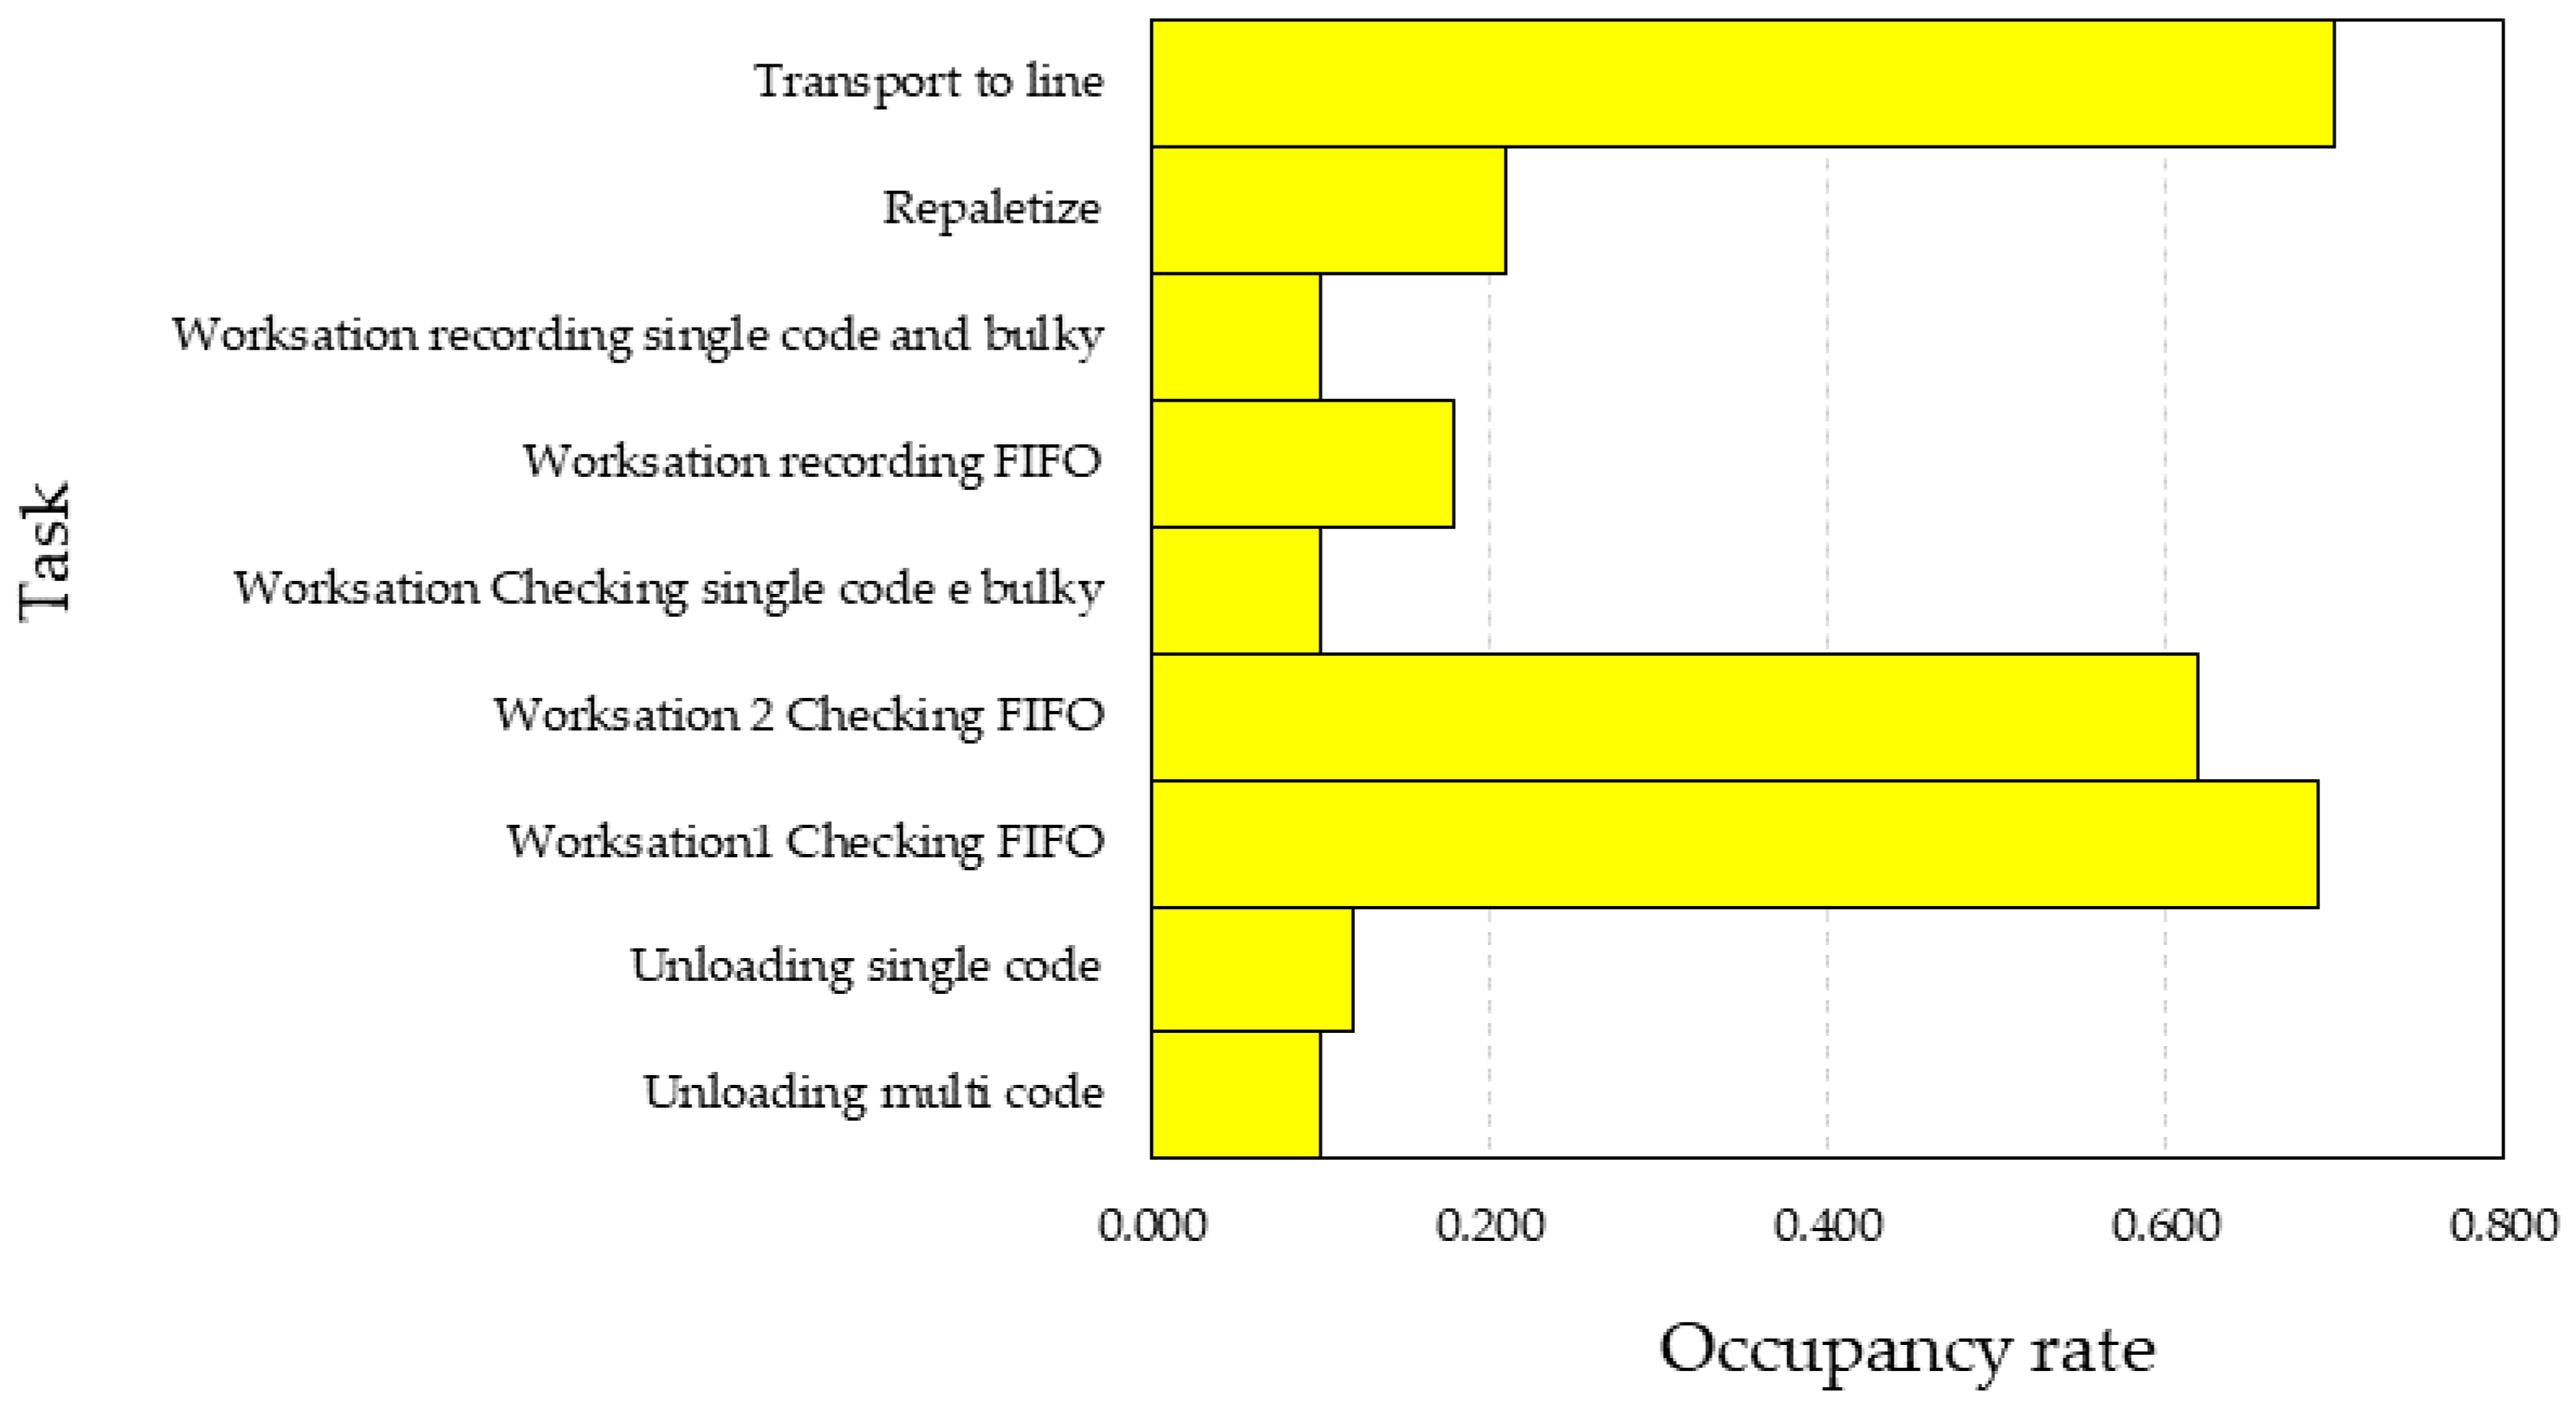
Table 6 reveals that the main bottleneck is the Multi Code FIFO pallet checkpoint, as previously predicted based on the process mapping and the methods and time study.
Note that the simulation assumptions considered that a working day includes three shifts of 8 h, therefore an occupancy rate equal to 1, corresponding to the workstation working 24 h. Thus, three operators would be necessary, one per shift.
The results associated with the throughput times of the three types of pallets reveal that the highest one is the FIFO (
Table 8).
All the analyses described above served as a starting point for the evaluation and proposal of possible improvements based on the identified bottlenecks. In a preliminary analysis of the initial state, based on the simulation reports, it was possible to identify the points to be improved, which are: (i) the queueing time, essentially in the FIFO checkpoint; (ii) the throughput times, once again, considering the FIFO as the main constraint point.
By improving these points, it was intended to reduce the number of operators needed to perform these tasks in order to improve the company’s productivity.
5. Improvement Proposals and Results
After understanding the initial state, we determined that the Multi Code pallets process was the main problem in the material reception flow. As such, this section presents the techniques used to mitigate this point of constraint and consequently improve the overall flow.
5.1. Workstations Balancing
During the processing of Multi Code pallets, it is possible to allocate extra operators to any of the processes to make it faster, except for FIFO checking stations. For this it is possible to allocate only one operator per workstation, that is, this number of workstations must be very well dimensioned so that it does not become a bottleneck in this flow.
As evaluated in the initial state simulation, the fact that there were only two FIFO checking stations was identified as the greatest constraint point in the flow of Multi Code pallets. For this reason, it became fundamental to develop a study for the correct balancing of workstations in the warehouse.
5.2. Process Analyzer
The function of the Process Analyzer is to allow various possible scenarios to be compared, depending on the changes to be tested in the initial model and to observe the respective results. To begin this balancing process, we used this tool, which belongs to the Arena® software, to decide the ideal number of FIFO checkpoints in order to improve the respective flow. Four scenarios were tested:
- −
Initial scenario (existing in the warehouse at the beginning of the project)—2 FIFO checkpoints;
- −
Scenario 2–3 FIFO checkpoints;
- −
Scenario 3–4 FIFO checkpoints;
- −
Scenario 4–5 FIFO checkpoints;
- −
Scenario 5–6 FIFO checkpoints.
After choosing the scenarios we defined which control variables (points to be changed in the initial scenario) and which responses we wished to obtain for subsequent evaluation and making our choice of the best scenario. The controls and responses were:
- −
Controls:
FIFO checking station 1;
FIFO checking station 2;
- −
Responses:
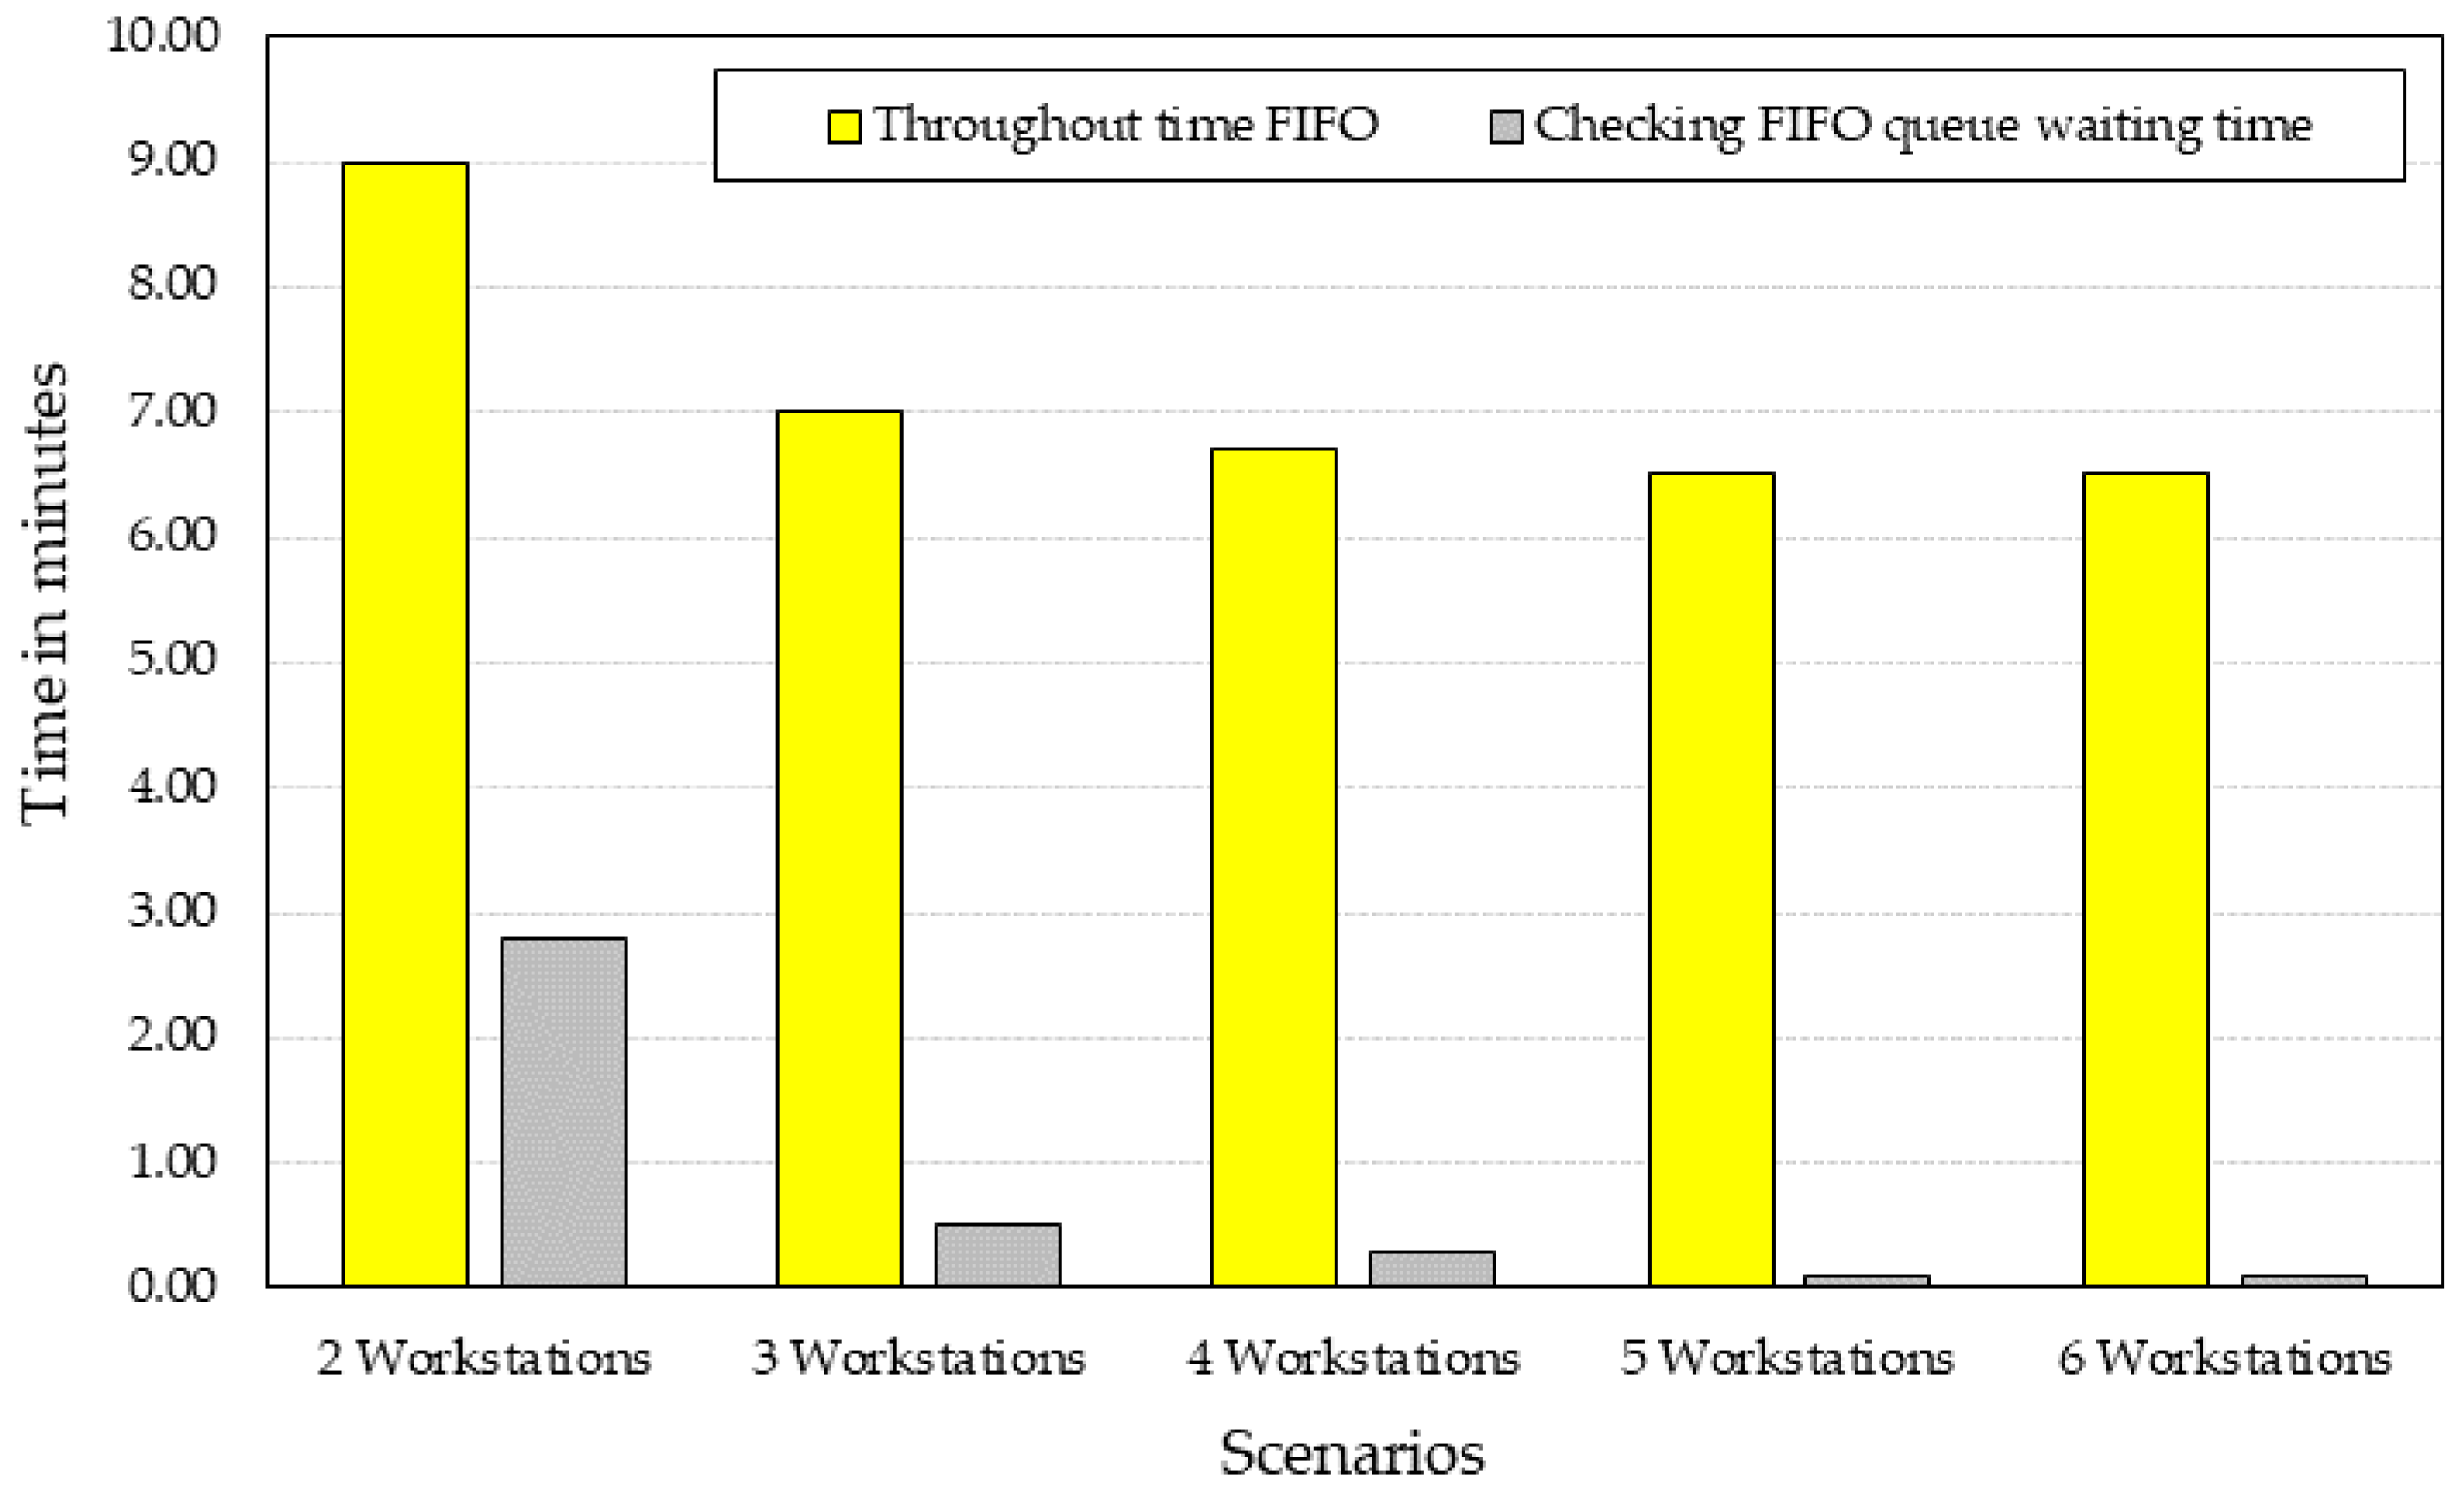
As can be seen in
Table 9 and
Figure 11, the simple increment of one FIFO checkpoint from the initial scenario to scenario 2 reduced the FIFO checkpoint queue time by 78% and the FIFO throughput time by 24%.
From the initial scenario to scenario 3, the increment of two FIFO checkpoints reduced the FIFO queue time by 91% and the throughput time by 28%.
From
Figure 11 it is possible to see that the difference between scenarios 4 and 5 and scenario 3 is not relevant, and therefore these were not considered, as the operational costs for the creation of these stations did not justify the gains in terms of time and efficiency.
After these different scenarios were presented to the company, they were discussed with the team responsible for the warehouse logistics department and scenario 3 was chosen for implementation in the warehouse because it was the most suitable for improving the logistics flow of the warehouse reception area.
5.3. Value Stream Design
As presented in
Section 5.2, the FIFO checkpoints were increased from two to six in order to improve the flow. Continuing in this line of thought, the warehouse reception layout was analyzed to eliminate the waste previously found that was causing inefficiencies in this same flow.
The main waste to eliminate (already detected in the Gemba Walks method) was the unnecessary and constant movements of the operators. The change in the layout focused on the orientation of the queues to the workstations, allowing the material to come to the operators instead of the operators going to the material (as was the situation initially, whereby the operators, upon starting a new pallet, had to obtain it from the queue area, far from their workstation).
For the development of this new layout, the Value Stream Design was used (
Figure 12), which, as described in the previous section, allows one to graphically visualize the ideal flow to eliminate the waste previously found with the application of the VSM.
By comparing
Figure 8 and
Figure 12, which correspond respectively to the initial flow (VSM) and the improved flow (VSD), the simplification of flow is evident, eliminating several load movements, since the layout was organized according to the sequence of processes (which remain the same as the initial ones).
5.4. Pallet Transport System (Autocad®)
Another improvement opportunity encountered at the start of this research had to do with ergonomics and the disorganization of workstations, caused by the constant need to move pallets. After being unloaded, the pallets were moved by the operators with a pallet truck, which demanded extra physical effort from them.
One of the goals of this project was to improve the working conditions of operators, reducing the movement of pallets as much as possible. The change in the warehouse layout allowed this reduction. This change was complemented by the application of an automatic pallet-moving system, eliminating any need for transportation by operators.
Along with the application of the pallet-moving system, the 5 S’s tool was used to mark the floor in order to delimit the location where the pallets are left, thus making the workstation more organized and cleaner.
This pallet-moving system was applied between the FIFO recording station and the FIFO checking station since this is where the improvement in ergonomics at the workstation would have the greatest impact.
Figure 12 shows these lanes in orange. This part of the project was designed with the AutoCAD
® software so that the supplier of these systems would receive the exact specifications, as well as know the place to apply them precisely.
7. Conclusions
This paper described the analysis and implementation of a redesign in the receiving process operations in a case study company. The aim was to define a new process or methodology for improving the flow of material during the reception process. The main motivations for this study were the needs of the company and the lack of studies that were found in the literature about the receiving process in warehouse operations management.
In the first phase of this research, it was important to understand the challenge and the industrial environment—hence the importance of the Gemba Walks to understand how the warehouse area worked and identify the failures. This approach was complemented by an exhaustive analysis of the scholarly literature to understand which methods and tools to apply for problem identification and for respective solutions. The Arena® software was also fundamental for the characterization and identification of constraint points in the initial situation, as well as in the improvements introduced for a better balancing of the workstations.
After identifying the failures (such as long queues and a layout inadequate to the flow of the tasks to be performed) and their correction, it was possible to observe improvements in terms of throughput times of the reception process and to quantify considerable annual savings for the organization. The throughput time is reduced by 28%, workstations are streamlined, and an increased capacity for receiving more material can be achieved without further investments. Each operator costs the company an average of 15.500 euros per year, resulting in an annual savings of about 47.101 euros. Thus, it can be concluded that the proposed objectives were successfully achieved and that the techniques used were useful.
This study represents an important contribution to logistics managers by highlighting the contribution of mapping processes for improving their performance and by using a set of tools and approaches that can be easily implemented.
By using layout change, applying pallet-moving systems, balancing the workstations, and eliminating the category of urgent materials in the warehouse it was possible to reduce the manual moving of pallets by operators, which contributes to a very positive gain in ergonomic terms. Also, a set of wastes was eliminated, contributing to the reduction of throughput times, and employees could be allocated to other functions in the organization where they are more needed. The warehouse can now be managed in a more efficient way.
The main limitation of the current research is related to the case study since the results achieved are provisional and do not take into account an evaluation over time. Moreover, the findings are limited due to the focused nature of the case study. Although the solution is designed for a particular plant, the methodology is fully exportable. Experience indicates that the suggested tools and processes to improve the logistics flow of material reception in warehouses are suitable, useful, and practical for any company. Nevertheless, every factory is different and needs to adapt these tools to its particular manufacturing characteristics, layout, inventory, flow charts, and organization.
In the future, it will be important to continue to develop the automation of the reception process, as was started during this study through pallet conveyors, thereby eliminating manual processes, which apart from normally consuming more execution time, are more prone to errors and normally less ergonomic for the operators. Another interesting topic for further research will be to analyze the relationship and impact that the developed improvements in the receiving process would have in the warehouse proceeding and succeeding processes.


 ,
, 


