Article

Has Carbon Disclosure Become More Transparent in the Global Logistics Industry? An Investigation of Corporate Carbon Disclosure Strategies Between 2010 and 2015

Institute for Transport and Logistics Management, WU (Vienna University of Economics and Business), Welthandelsplatz 1, 1020 Vienna, Austria
Logistics 2018, 2(3), 13; https://doi.org/10.3390/logistics2030013
Submission received: 4 July 2018 / Revised: 23 July 2018 / Accepted: 26 July 2018 / Published: 28 July 2018

Abstract

:
Global logistics companies are increasingly disclosing carbon related information due to institutional and stakeholder pressures. Existing research, however, is limited to categorizing these pressures and their influences on corporate carbon disclosure strategies. In particular, literature to date has not distinguished between different carbon disclosure strategies and how they may have changed over time. In response, this paper: (1) proposes a framework that depicts four different carbon disclosure responses and strategies based on internal and external pressures; and (2) subsequently analyzes and compares corporate carbon disclosure strategies between 2010 and 2015. Using a sample of 39 leading global logistics companies, carbon disclosure strategies are categorized based on the analysis of 25 applied carbon management practices from Bloomberg ESG to see if carbon management practices and the associated strategies have changed. The findings show overall shifts to more transparent corporate carbon disclosure strategies between 2010 and 2015 with an increase of applied carbon management practices in both internal and external actions.

1. Introduction

In the last two decades, growing institutional and stakeholder pressures to reduce carbon emissions have led to an increasing number of corporate engagements in voluntary climate change initiatives [1,2,3,4]. In corporate circles, the response to these pressures by implementing various carbon management practices is increasingly regarded as a key strategic component for a company’s long-term sustainability [5,6,7]. Existing research, however, found that companies implement carbon management practices in different ways and to different extents [8,9,10,11,12]. Research links the difference in applied carbon management practices to the various multiple pressures, and current literature distinguishes between internal and external pressures and a company’s reaction to these pressures [8,9,13]. For instance, institutions such as Carbon Disclosure Project (CDP) increasingly put pressure on organizations to disclose their carbon related information and companies respond internally to these demands by integrating carbon management practices into their operations, structures and processes [14,15,16]. On the other hand, societal awareness of climate change has also risen and companies have implemented carbon management practices to mitigate the risk of potential stakeholders’ backlash and satisfy external audiences.
As such, companies take various internal and external actions and an important question arises regarding the relationship between them and how it affects the implementation of carbon management practices associated disclosure strategies. In particular, literature to date has not examined specific carbon management practices and how they may have changed over time; thus, the key issue of how a change of internal and external carbon management practices may lead to a change in carbon disclosure strategies remains underexplored.
Given this gap in the literature, we propose an integrative model that distinguishes between internal and external actions and is based on the underlying constructs within institutional and stakeholder theory. Existing literature claims that internal carbon management practices are influenced by the extent of dissemination of sustainability and climate change values within the organization [17], while external carbon management practices are influenced by the salience of stakeholders [18]. From a theoretical viewpoint, the extent of internal climate change actions reflects—from an institutional logics perspective—how central the sustainability logic is integrated into the company’s value system [19,20]. The extent of external carbon management practices actions can be linked to stakeholder theory, in particular to extent carbon disclosure claims from stakeholders are given priority [17,21]. Based on the relative degree of the combined internal and external actions and partially applying the strategic responses from Oliver [22], we propose four ideal types of carbon disclosure strategies: Acquiesce, Compromise, Avoid and Excellence. This integrative model provides a foundation to categorize carbon disclosure strategies based on the extent of applied carbon management practices. To understand the change and the influence on carbon disclosure strategies, a more detailed investigation of carbon management practices over time is required, which leads to two research questions:
RQ1.
“To what extent have internal and external pressures led to a change in carbon management practices?”
RQ2.
“To what extent have internal and external pressures led to a change in carbon disclosure strategies?”
To measure the carbon management practices and the associated disclosure strategy, we use a dataset from Bloomberg ESG terminals and the associated data from Carbon Disclosure Project (CDP) reports, which allows us to conduct a company comparison and categorization over time. Our final sample includes 1950 observations for 39 global logistics companies and compares data between 2010 and 2015. Methodologically, we introduce a novel empirical analysis using 25 specific carbon management practices (CMPs) to calculate scores and to categorize carbon disclosure strategies according to the four types in the model.
This article makes three key contributions. First, we conceptualize a model of carbon disclosure behavior that proposes four ideal types, thus providing an understanding of the dynamic interaction between internal and external management practices and their influence on carbon disclosure strategies. Second, using 25 specific carbon management practices (CMPs) from Bloomberg ESG and Carbon Disclosure Project (CDP) data, we construct a model to measure how CMPs have changed between 2010 and 2015. Third, empirically, we categorize carbon disclosure strategies and analyze how these strategies have changed over time, thereby advancing the literature on strategic carbon management and disclosure. Thus, this study presents a more nuanced empirical, as well as theoretical, understanding of the mechanisms through which internal and external carbon management practices influence carbon disclosure strategies.
The remainder of the study is structured as follows: First, strategic internal and external responses and their implications are discussed before the framework to categorize carbon disclosure strategies is introduced. This followed by a description of the research design and the presentation of the results. The results are subsequently discussed and the study concludes with recommendations for future research.

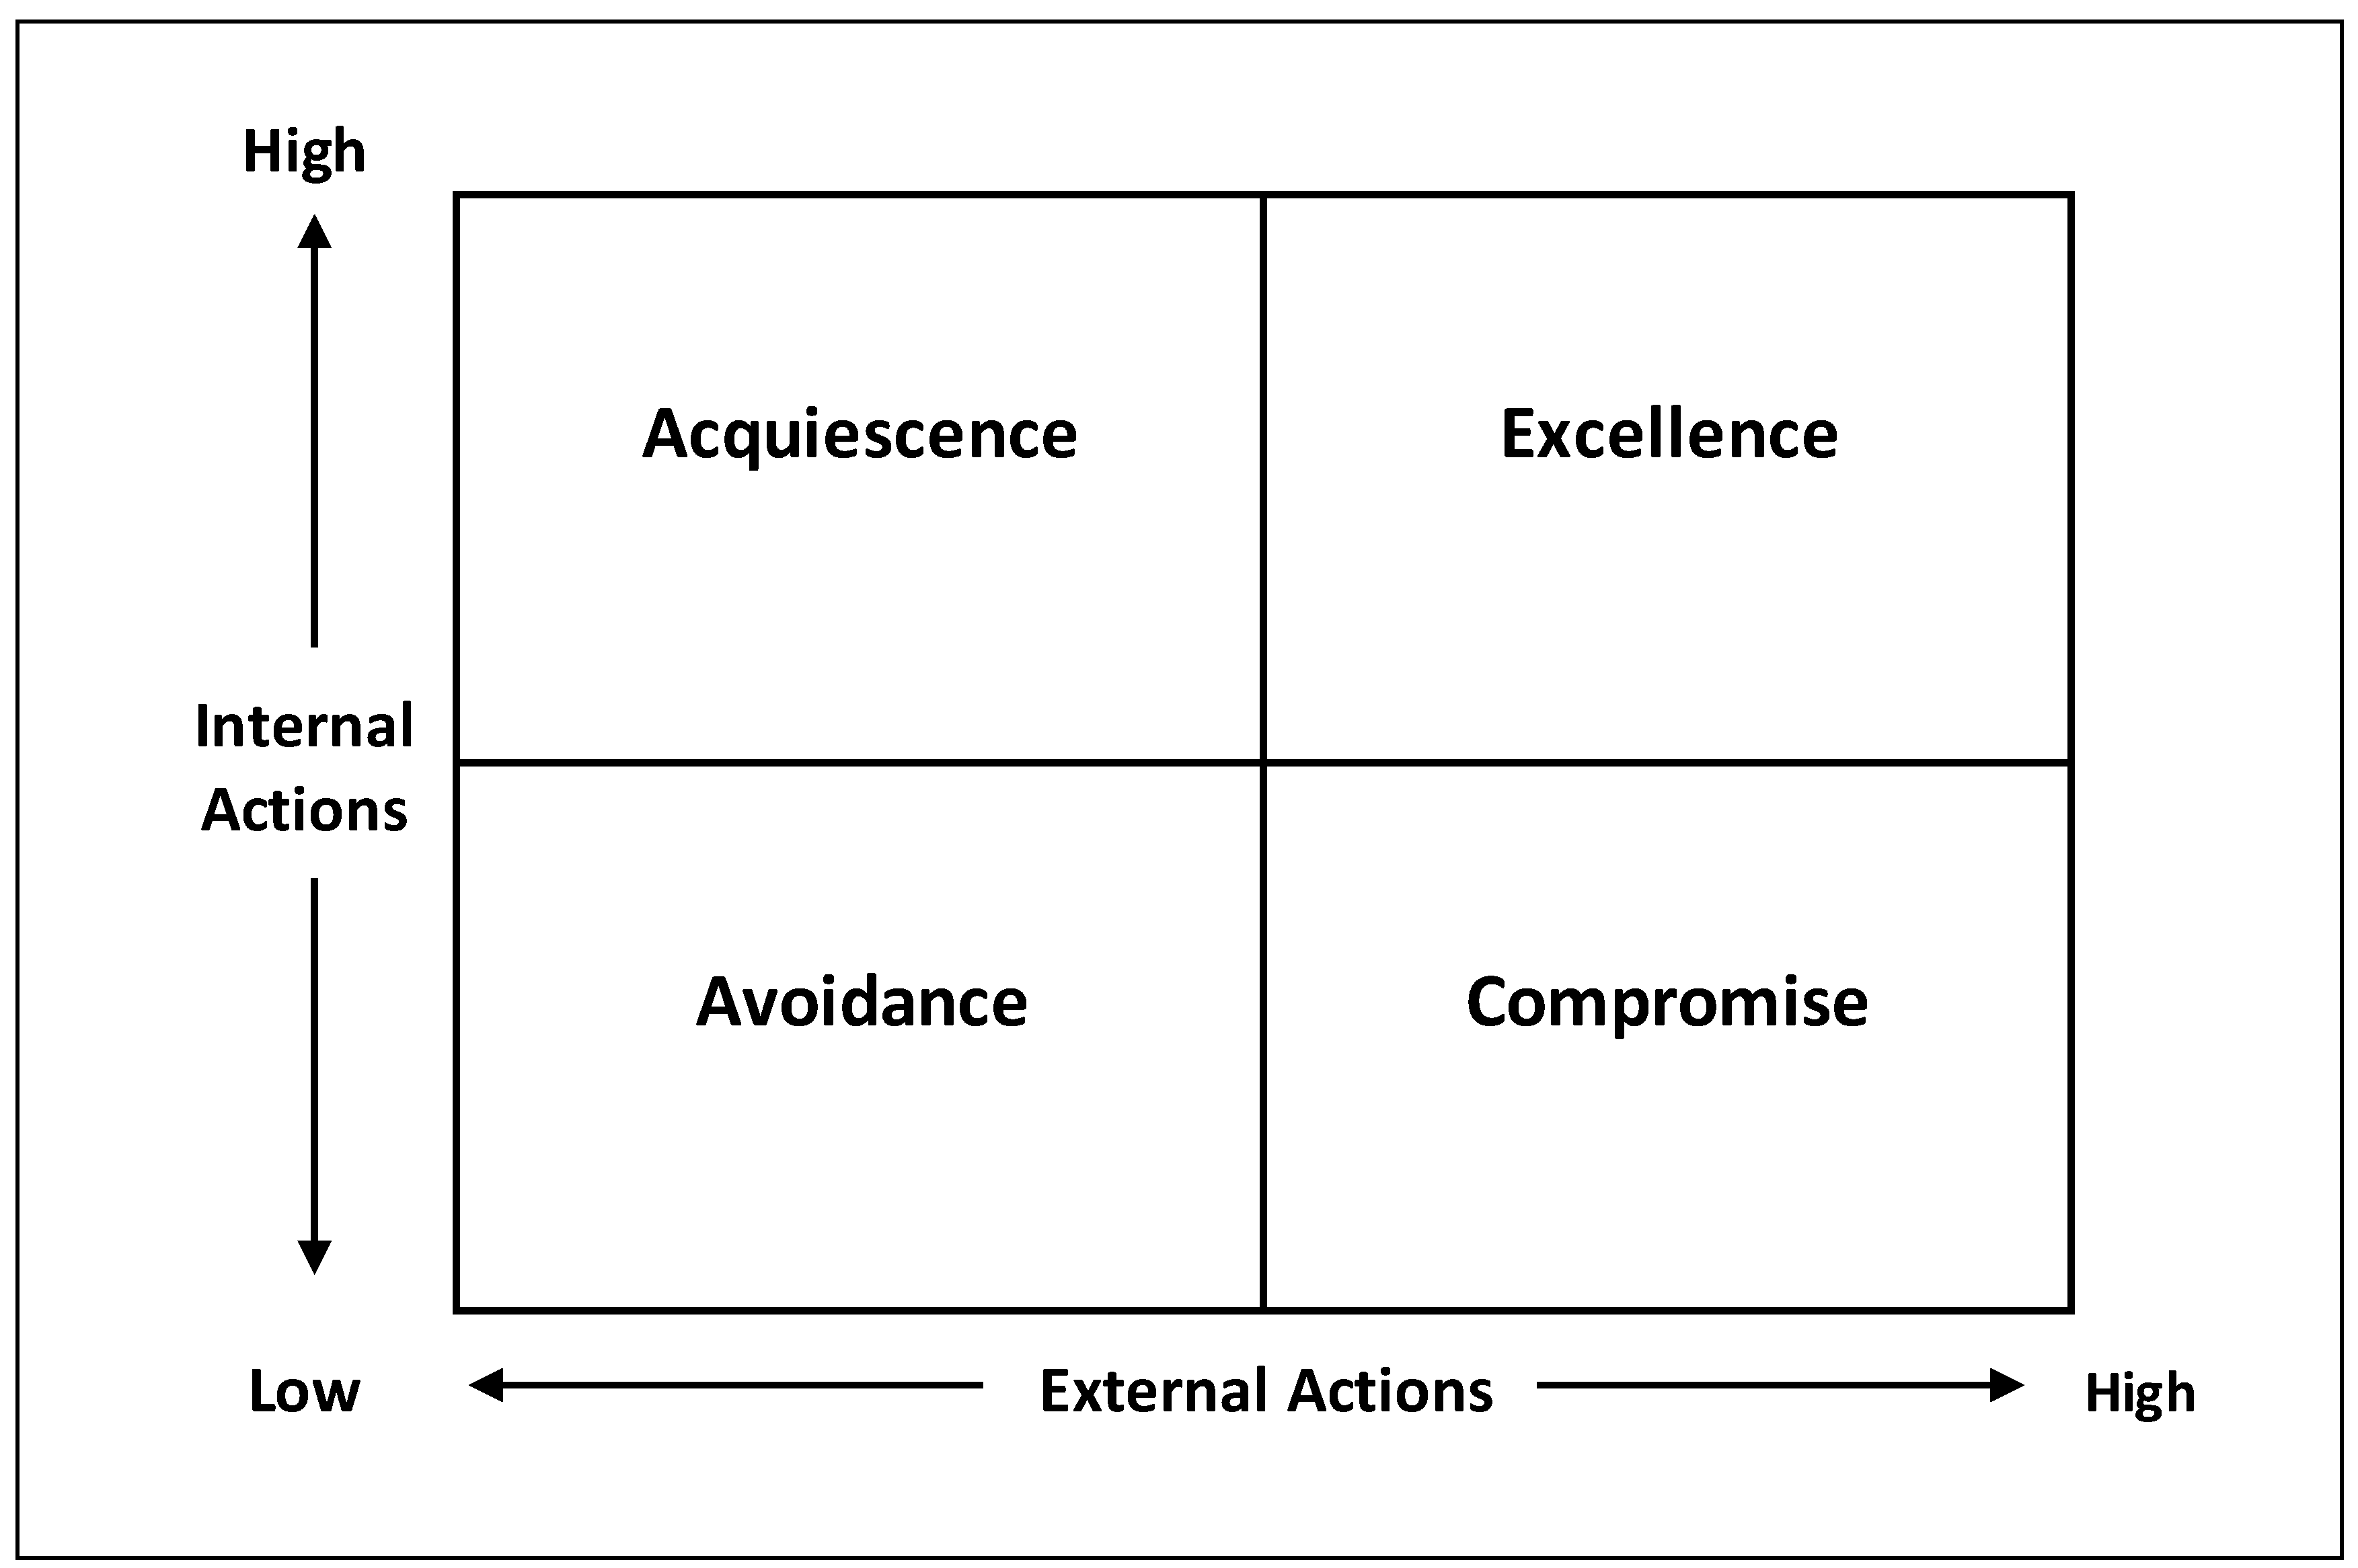
2. Strategic Internal and External Responses

In response to institutional and stakeholder pressures, companies adopt two types of actions: internally focused actions and externally focused actions [13]. The former, internal actions, is related to internal structural change that involves the implementation of appropriate organizational practices and corporate actions to develop organizational capabilities [23]. With regard to carbon disclosure, the set of internal practices may include the forming of a board-level sustainability committee or the implementation of climate change policies or energy-reducing initiatives. The latter, external actions, is mainly related to communications and engagement activities to persuade stakeholders that the company’s operations are legitimate and the company is operating as an environmentally responsible citizen [9,24]. With regard to carbon disclosure, the set of external practices may include the verification of the company’s emissions through a third party, engagement with business or investor organizations such as the Carbon Disclosure Project (CDP), the acknowledgement of industry guidelines (e.g., GRI) or signatories with international organizations (e.g., United Nations Global Compact).
Companies may take internal and external actions at the same time, e.g. while focusing on internal initiatives for structural change, they may seek to appease or satisfy immediate audiences and key stakeholders [25]. United Parcel Service (UPS), for example, formalizes its internal carbon management strategy through five principles in its “Sustainability Report” while also undertaking several external actions to communicate to key stakeholders and capital market participants, the objectives and outcomes of that strategy [26]. The strategy statements focus on transparency and reduction of carbon emissions and that the main goal of the climate change strategy is to gain a strategic advantage over its competitors. Through detailed reports and other disclosures, the company explains why this goal makes business sense, sets out intermediate targets and elaborates on specific carbon management practices that help to achieve them. In other words, UPS lays the foundation for internal transformation as well as external credibility. However, companies may also choose between internal and external actions, i.e. a company may focus on one particular dimension and subsequently neglect others. For example, Federal Express (FedEx), although also presenting and discussing an overall carbon reduction approach, has implemented internal carbon management practices to a different extent, reflecting a different strategy. For instance, Herold and Lee [27] found that FedEx follows a less transparent approach with, e.g. not providing full disclosure of Scope 3 emissions or a lack of third party verification for all carbon emissions.
This argument based on the distinction internal and external actions is broadly consistent with a stream of work that explores the reaction of a different set of stakeholders to a company’s current carbon disclosure activities by considering the results of prior action (or inaction) by a company in the form of reputation. For example, Schuler and Cording [28] posited that, if a company’s current internal actions and past reputation are incongruent, then customers do not respond positively to external information. In addition, Barnett [29] argued that the response to external actions depends on their prior beliefs regarding the company’s internal intentions and that therefore the same activity may generate different benefits for different firms. Similarly, Du, Bhattacharya, and Sen [30] proposed that the positive effect of external actions and its associated communication may be amplified for companies having a good prior reputation.
However, the process and interaction between internal and external carbon management practices and their implications on is closure strategies are so far little understood. It may be that carbon disclosure strategies are driven by prior internal actions in combination with current external actions. As internal actions often dictate organizational changes, these actions may take relatively longer to materialize than externally focused and predominantly ceremonial actions [13]. A good example is carbon reporting: the issuance of a carbon report can be considered as an external action a company takes to inform stakeholders about their internal actions taken in the prior year, assuming that it takes at least a year for these carbon practices to be implemented and actually have an impact (e.g., the implementation of energy-efficiency policies or climate change initiatives) [12]. In other words, while external actions may report the beginning of internal carbon practices, external actions following a year of internal practices being implemented may in fact communicate progress or results that external audiences value more than simple communication of climate change engagement [13].
These dynamics of the relationship between internal and external represent a constant fight for power between management and stakeholders outside the company regarding the extent of carbon disclosure. Therefore, we argue that both internal and external actions are critical to determine the carbon disclosure strategies.

2.1. Carbon Disclosure Responses and Strategies

Based on the discussion above, companies can thus implement a broad range of internal and external carbon management practices to address institutional and stakeholder pressures. From a theoretical viewpoint, the extent of implemented internal carbon management practices can be related to the institutional logics perspective and the position of the so-called sustainability logic within the organization [12]. The sustainability logic reflects a construct to address environmental challenges under the premise of the Brundtland Commission to meet “the needs of the present without compromising the ability of future generations to meet their own needs” [31] (p.8). In other words, the extent of internal carbon management practices depend on how the sustainability logic can manifest itself as a core feature that is central to the organizational functioning and is what Besharov and Smith [20] called the “centrality” of an institutional logic in the field. The positioning of sustainability logic, however, varies between companies, as the differences in carbon disclosure approaches indicate [5,32]. While some companies have integrated climate change into their policies to reduce carbon emissions, others are more restrictive in providing carbon-related information and rely more on symbolic management strategy [9]. Thus, from a theoretical point, the relative position of the sustainability logic to the company core functions influences the extent of carbon disclosure and its applied internal carbon management practices and may represent different carbon disclosure responses and strategies.
The extent of applied external carbon management practices can be linked to the degree to which managers give priority to competing stakeholders’ claims, representing the concept of stakeholder salience in stakeholder theory [18,21]. In a climate change context, the degree of salience depends on the extent to which stakeholders can hold companies accountable for carbon-related practices. As such, stakeholder salience is high when companies have implemented a transparent strategy with the aim of full disclosure, and lower when stakeholder pressure is uncoordinated or can be avoided without serious implications for the company’s legitimacy. Thus, from a theoretical point, the relative salience of stakeholders influences the extent of carbon disclosure and its applied external carbon management practices and may represent different carbon disclosure strategies.
Based on the assumption of potential variation between internal and external actions, we combine these dimensions to propose four ideal types of carbon disclosure strategies. We integrate three strategies of Acquiescence, Compromise and Avoidance in our model that companies may enact in response to institutional and stakeholder pressures, as proposed by Oliver [22]. However, to reflect the context of carbon disclosure, we extend that view by adding another strategy type called Excellence to illustrate internal and external actions that go beyond isomorphic pressures and market demands. Figure 1 depicts the four types, but it needs to be emphasized that internal and external actions are dynamic dimensions, and that carbon disclosure can therefore vary between the ideal types. Below, we describe each ideal type in our model and explain how it implies a distinct level of carbon disclosure.

2.2. Acquiescence

Organizational acquiescence reflects to organization’s conscious intent to conform to institutional pressures and its expectation that conformity will be self-serving to organizational interests [22]. In the context of carbon disclosure, it is argued that related activities reflect the corporate actions taken by a company to achieve carbon-related accomplishments in order to reduce its carbon footprint in line with cost reductions [9,33,34,35]. Because companies have high internal pressures, the integration of climate change values is reflected in organizational structures and is exhibited by top management and shared by organizational members [19]. Moreover, because these companies face low external pressures, there is no need for the company’s management to include demands from stakeholders for carbon disclosure beyond market-driven initiatives.

2.3. Avoidance

Avoidance is motivated by the desire to circumvent the conditions that make conforming behavior necessary [22]. With regard to carbon disclosure, it is argued this strategy can be related to reputation management, which Schaltegger and Burritt [36] described as a company’s focus on societal, political and media attention. Because these companies have low internal pressures, carbon-related activities and their disclosure may be closely linked to the PR department to gain the support of the company’s most immediate audiences [9]. Moreover, because these companies face low external pressures, management may employ self-interested or narcissist behavior, with claims of carbon-related achievements that are not accompanied by corporate action and reflects the use of rhetorical statements designed to create an impression of environmental responsibility [36]. As a result, companies have to deal with uncoordinated action from stakeholders and thus with little demand for full carbon disclosure, nor being pushed to implement any carbon-related initiatives that lead to a reduction of the carbon footprint.

2.4. Compromise

Compromise is employed in the spirit of conforming to and accommodating external rules and norms, but in contract to acquiescence, compliance is only partial and organizations are more active in promoting their own interests [22]. In the context of carbon disclosure, we argue that these companies engage in consultations with well-organized stakeholders to discuss the company’s carbon-related practices mainly in order to maintain legitimacy. Due to the high external pressures, however, stakeholder will continually ask for accountability regarding carbon emissions, which may include requests to adopt technical international and industry procedures and to follow official international guidelines. However, because these companies have low internal pressures, they will neglect organizational adaption strategies for climate change and react as little as possible to fulfil only the minimum and mandatory carbon disclosure requirements [37]. Together, these factors result in a minimal engagement with the challenges arising from climate change.

2.5. Excellence

Excellence strategies with regard to carbon disclosure relies on the assumption that the climate change values and principles exhibited by top management will be shared widely and held by all organizational members, leading to a unity between organizational members that fosters a sense of identity and commitment to common corporate carbon-related goals and aspirations [17]. From a stakeholder perspective, the high external pressures reflect an approach aimed at making carbon information comparable by an active engagement to work on the standards and transparency of carbon-related activities in the logistics industry [38]. This may include the adoption of technical international and industry procedures and following official international guidelines (e.g., GRI) as well as engagement in public policy climate change activities, working directly with policy-makers, trade associations, research organizations and non-profit organization.

3. Research Design

To address the research aim to understand how carbon management practices and carbon disclosure strategies have changed over time, the internal and external carbon management practices of companies need to be examined. According to Beattie [39] and Unerman [40], disclosure indexes are a popular way to quantify the extent of disclosure. We adopted his approach and used a merged dataset from Bloomberg ESG terminals and Carbon Disclosure Project (CDP) reports that includes 26 specific carbon management practices (CMPs) that a company may have applied. It needs to be emphasized that the focus of this study was not the examination of statistical differences, but the categorization of carbon management practices and disclosure strategies. To achieve reliability and validity of the data, we focused on a small sub-set of items (CMPs) as well as on inter-company differences in a specific industry (i.e., global logistics) and used an industry index to measure the disclosure level [41,42]. The analysis follows a two-step approach: First, we examined to what extent the internal and external practices of each company are applied or implemented in the years 2010 and 2015. An analysis of these specific CMPs allowed us to understand the interaction between internal and external practices and how these practices have changed over time. This analysis subsequently provides the foundation for the second step: the categorization of companies according to the carbon disclosure strategy model for the years 2010 and 2015, illustrating how strategies have changed in this timeframe.
The dataset was the most up-to-date data available and covers the years from 2010 to 2015. The complete dataset contained 1950 corporation-year observations of CMPs. The sample as well as a detailed description of the measurement of carbon management practices and disclosure strategies is given below.

3.1. Sample

The sample of the study focuses on global logistics companies, representing an own industry or an organizational field [43], and thus providing homogeneous results that can be compared. Due to the limited availability of valid rankings of global logistics companies, the ranking of the Top 50 global 3PL companies from the Journal of Commerce was used [44]. This sample comprises the world’s 50 largest logistics companies in 2015, ranking companies from five continents by gross revenues. Collectively, these 50 companies generated nearly US$230 billion in annual revenue. Corporate data of variables were retrieved from Bloomberg terminals, providing environmental, social and governance (ESG) information. In particular, Bloomberg provides ESG data for more than 9000 companies worldwide [45], including access to data from the Carbon Disclosure Project (CDP). The final sample of the study included 39 global logistics companies, as eleven companies were excluded from the sample because the carbon disclosure data were not sufficient for comparison within the global logistics industry.

3.2. Carbon Disclosure Variables

To measure the internal and external influences, we used 25 carbon management practices (CMPs) from the Bloomberg ESG and CDP dataset that may have been implemented by the global logistics companies. Table 1 describes these CMPs in detail and distinguishes between internal and external influences.

3.3. Measuring Carbon Management Practices (CMPs)

To examine the carbon management practices, the 25 CMPs were grouped into six broader management sections to measure “the intensity of concern with each category” [46] (p.39), three covering the internal influences (“Accountability and Oversight (AO#)”, “Initiatives and Policies (IP#)”, and “Risks and Opportunities (RO#)”), and three covering the external influences (“Emission Verification (EV#)”, “External Engagement (EE#)”, and “Industry Cooperation (IC#)”) (see Table 1). These six broader management sections were also used to calculate scores from the associated CMPs to indicate a specific strategy type for the categorization of the studied companies.
For each CMP, a score between 0 and 1 was awarded, as many CMPs in the dataset were analyzed using a “yes/no” (or 1/0) scoring approach. Where necessary, we re-scaled the scoring ranges in the raw data to that of 0 to 1. In our analysis, we interpreted a zero CMP score as the absence of that practice from the company’s overall carbon management strategy during the years the scores were assigned. The scores refer to the state of corporate management practices in 2010 and 2015. We interpreted a non-zero as the presence of the practice within this timeframe, thus the more often a practice is applied in the timeframe, the higher the score. This makes the scoring ranges of the CMPs and management sections comparable and provides a solid foundation to answer the sub-question RQ1 (“To what extent have internal and external pressures led to a change in carbon management practices?”).

3.4. Carbon Disclosure Measurement

To answer the second research question, RQ2 (“To what extent have internal and external pressures led to a change in carbon disclosure strategies?”), we took the aggregated scores from the three internal and three external management sections to form an overall disclosure score for internal practices and external practices. The overall disclosure scores provide the foundation to categorize the influence of carbon management practices on disclosure strategies of each company.
As the model shows four different carbon disclosure strategy types based on to which extent internal and external CMPs are applied, we distinguish whether the internal or external CMPs are applied to “greater extent” or to a “lesser extent”. To measure the extent of each CMPs, we build an industry average from six management sections (see, e.g. [42]) based on the available data from the sample and use the aggregated scores to categorize the extent of the applied internal CMPs and external CMPs.
For instance, to categorize the extent of internal CMPs (i.e., to which degree climate change values are disseminated within the organization), every company below the industry average was considered to have implemented internal CMPs to a lesser extent, placing them in either Avoidance or Compromise type, depending on the external CMP scores. Every company above the industry average was considered to have implemented internal CMPs to greater extent, placing them in either the Acquiescence or Excellence type, depending on the external CMP scores. To categorize the extent of external CMPs (i.e., to which degree stakeholder claims are given priority), every company below the industry average was considered to have followed external CMPs to a lesser extent, placing them in either Avoidance or Acquiescence type, depending on the internal CMP scores. Every company above the industry average was considered to have followed external CMPs to greater extent, placing them in either the Compromise or Excellence type, depending on the external CMP scores.

4. Results

4.1. Descriptive Statistics of CMPs

The sample is a composite of the applied carbon management practices of the 39 leading global logistics companies for 2010 and 2015. Table 2 presents a summary of the descriptive statistics for all applied carbon management practices and the aggregated data, including the mean, standard deviation and the variance between 2010 and 2015.
Table 2 reveals interesting key patterns in CMPs and management section between 2010 and 2015. Regarding the overall scores of CMPs between 2010 and 2015, the implementation of internal CMPs has increased by 0.10 from 0.42 to 0.52. This change shows that companies have implemented more than half the of studied practices in 2015, representing an increase from 2010, where less than half of the studied practices were implemented.
For the external CMPs with an overall increase from 0.41 to 0.46, we can see a similar result, which means that global logistics companies have reacted to external pressures by adopting more and almost half of the studied practices. While both internal and external overall scores have increased, differences in the management sections and specific CMPs can be observed. For external CMPs, for instance, Emission Verification (EV#) with an increase of 0.17 has the biggest impact on the overall external CMPs score. Surprisingly, External Engagement (EE#) decreased by 0.06 between 2010 and 2015, representing the only negative development in the management sections. A closer look at the specific CMPs in External Engagement (EE#) reveals that the overall score is heavily influenced by a lower score in 2015 for the signatory of the UNGC. The score of Emission Verification (EV#) is mainly driven by an increase in verification for Scope 1 and Scope 3 data, with the biggest growth coming from verification of Scope 3 emissions. Interestingly, the usage of the GRI framework jumped from 0.03 in 2010 to 0.65 in 2015.
For internal CMPs, Initiatives and Policies (IP#) and internal Risks and Opportunities (RO#) are the biggest drivers for the overall internal CMPs scores. The higher score of 0.15 in Initiatives and Policies (IP#) stems mainly from an increase in Climate Change Initiatives/Policies (0.19 increase) and Environmental Supply Chain Initiatives/Policies (0.16 increase). Moreover, the internal Risks and Opportunities (RO#) within global logistics companies with an increase of 0.15 can be mainly attributed to the increase of 0.51 from 2010 to 2015 stemming from the Climate Change Opportunities discussion in Annual reports. From an Accountability and Oversight (AO#) perspective, the implementation of a CSR/Sustainability Committee (from 0.03 in 2010 to 0.38 in 2015) or the appointment of Non-Executive Director for Sustainability (from 0.00 in 2010 to 0.76 in 2015) are the main drivers behind the increase of 0.03 between 2010 and 2015.

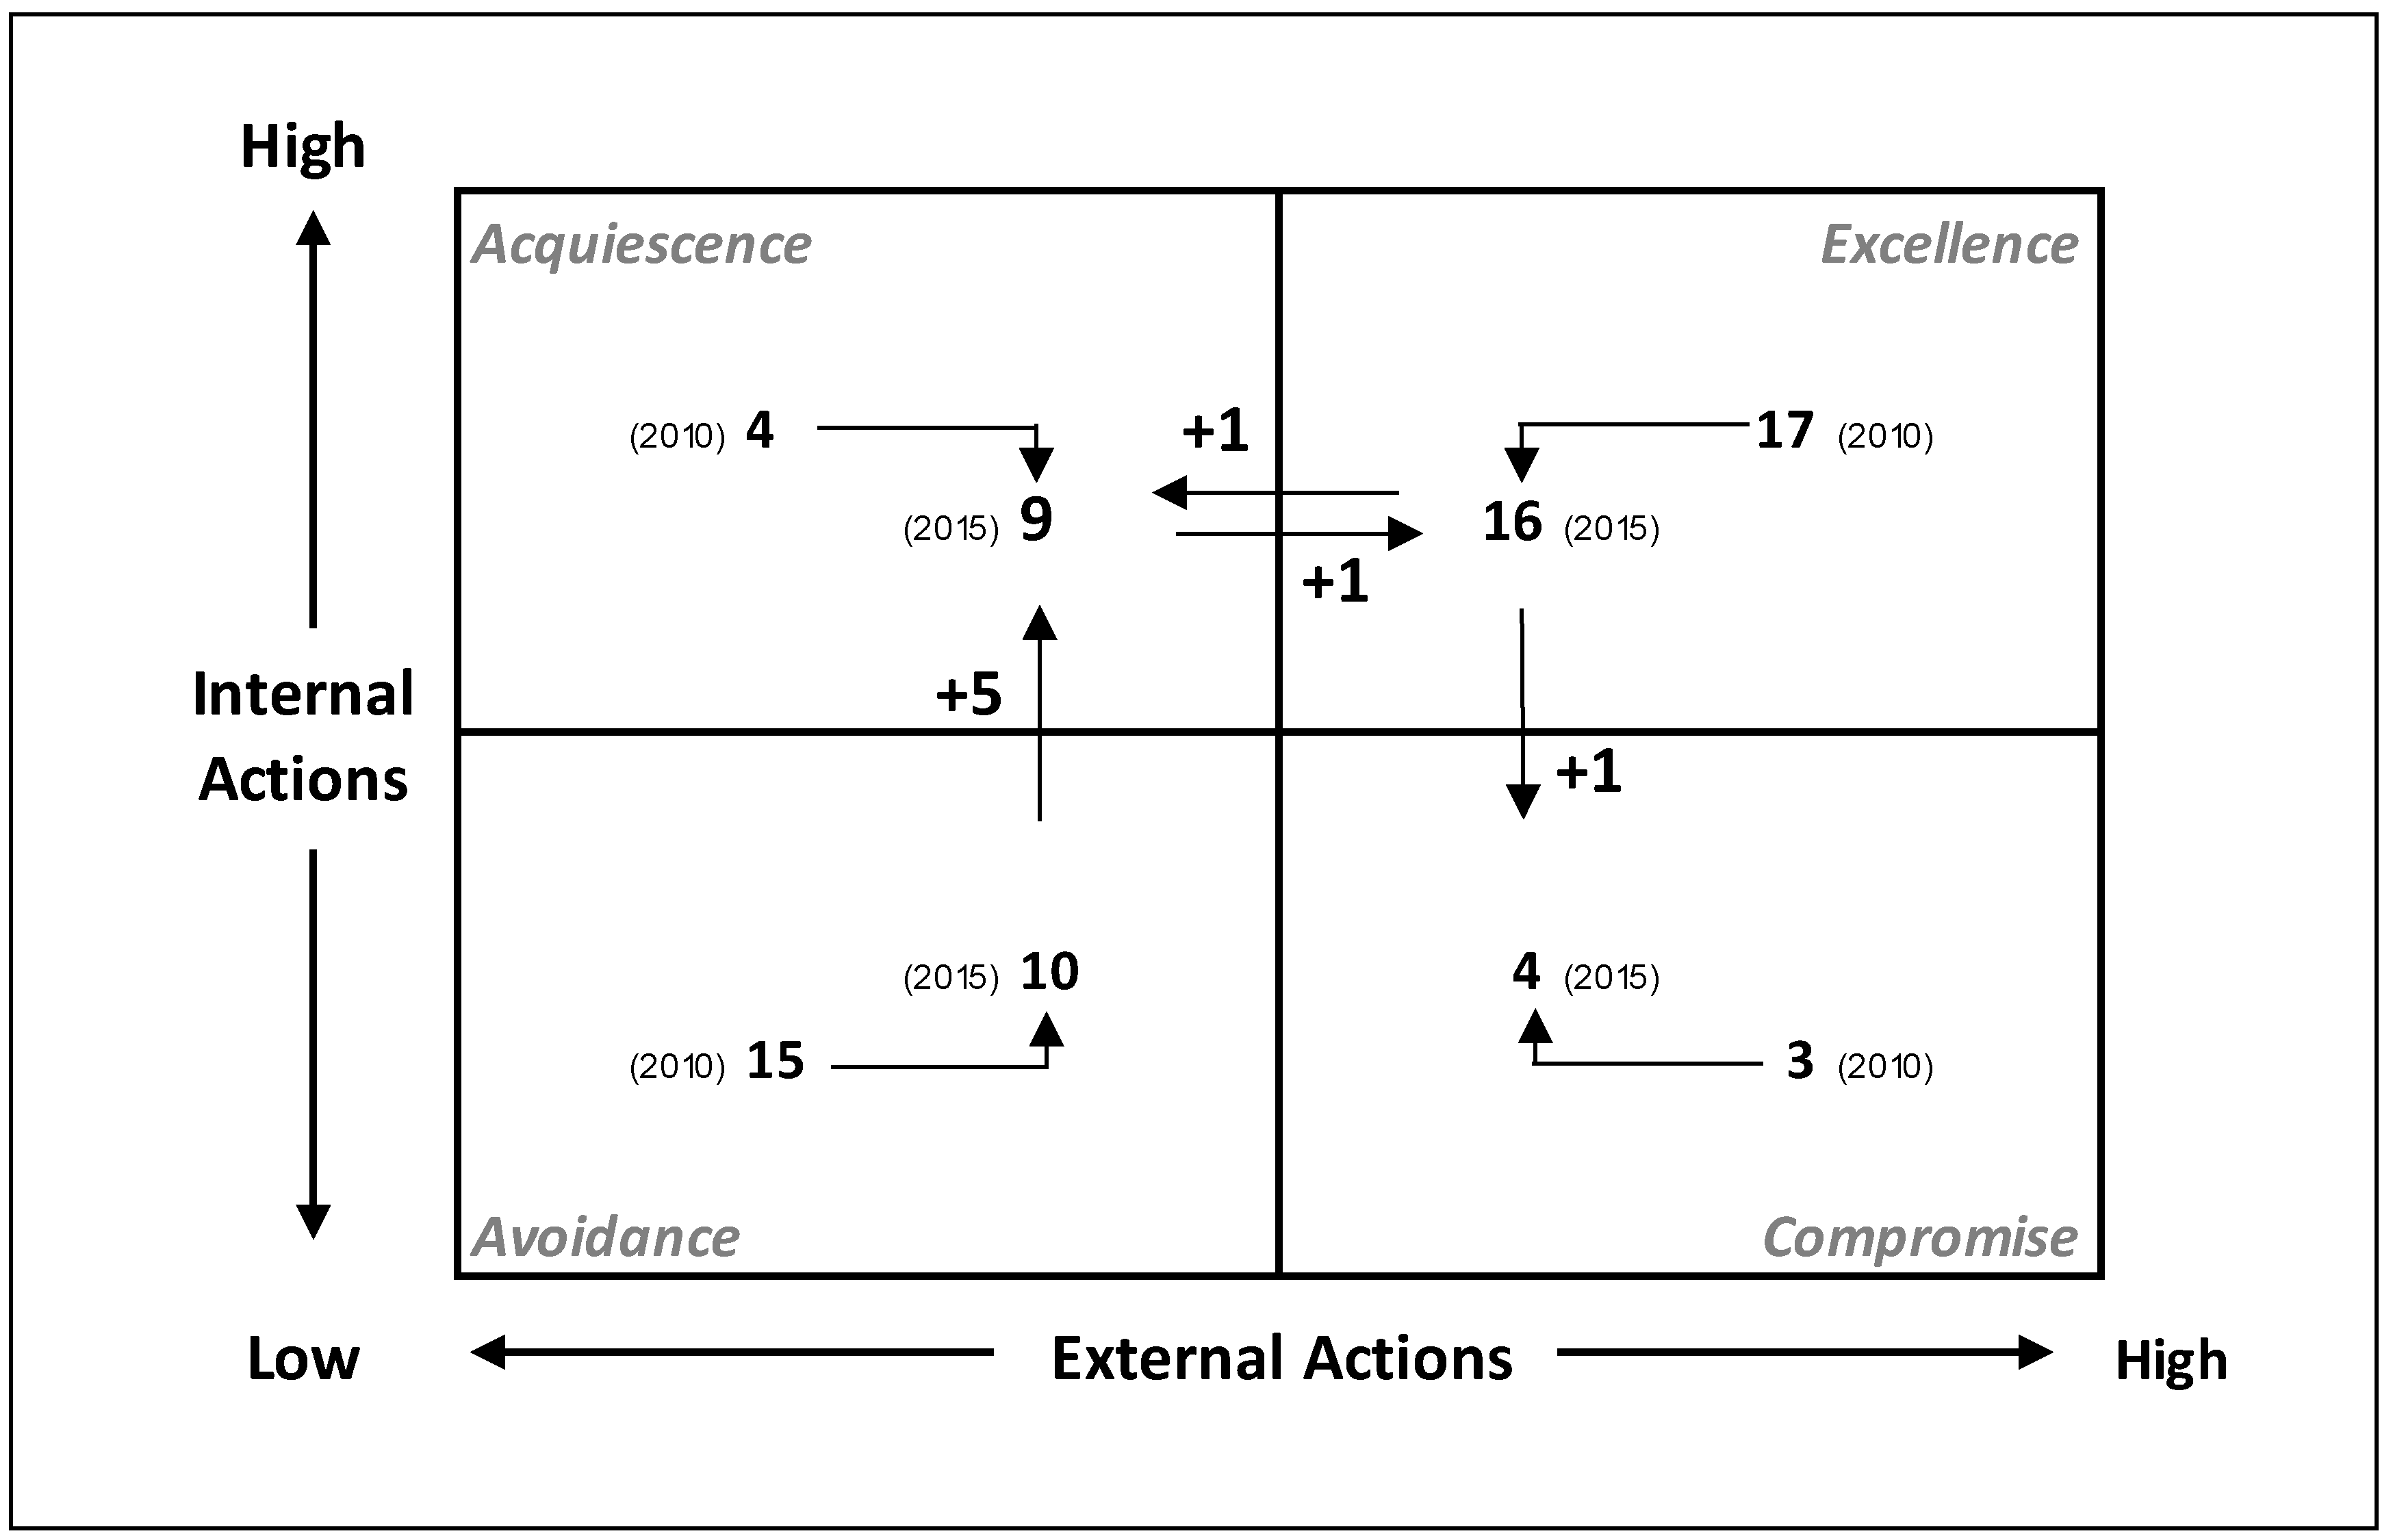
4.2. Categorization of Carbon Disclosure Behavior

The internal and external CMPs research design allows for a categorization of the global logistics companies’ carbon disclosure strategies according to which extent the 25 CMPs are implemented or applied in each company. Following the carbon disclosure model presented in this paper (see Figure 1), we allocated the companies according the specific internal and external CMPs into the four types Acquiescence, Compromise, Avoidance and Excellence. For each company, we calculated an aggregated internal score based on the 15 CMPs from the internal dimension as well as an aggregated score based on the 10 CMPs from the external dimension. These scores were compared to the industry index which represents the average scores of each CMP from the global logistics companies studied in this paper and allow a categorization into the four different carbon disclosure types based on the extent of applied CMPs. For instance, if a company has implemented internal CMPs to a lesser extent (i.e., their score is below industry average) and followed external CMPs to a lesser extent (i.e., their score is below industry average), the company will be placed in the Avoidance type. In contrast, if a company has implemented internal CMPs to a greater extent (i.e., their score is above industry average) and followed external CMPs to a greater extent (i.e., their score is above industry average), the company will be placed in the Excellence type.
The results are shown in Figure 2, where we placed each company based on their respective internal and external CMPs score, once with scores from 2010, and once with the scores from 2015. This gives us the opportunity to analyze the movement within the strategies. In 2010, out of 39 companies, 15 companies (38%) were allocated into the Avoidance type, while 17 companies (44%) were allocated into the Excellence type, representing more than 80% of all companies. In 2015, however, only 10 companies (26%) were allocated into the Avoidance type, while 16 companies (41%) were allocated into the Excellence type, representing shift in strategies over time.
The results show an overall shift to more transparent behavior, with most companies changing their disclosure strategies from the Avoidance type to the Acquiescence type. In other words, the majority of the shift stems from an implementation of more internal CMPs within the global logistics industry. Interestingly, only one company has reduced the extent of their internal practices, changing from the Excellence type to the Compromise type. From an external perspective, we can only observe an exchange of companies, from the Excellence type to the Acquiescence type and vice versa.
To understand the drivers behind these shifts of carbon disclosure strategies, we performed an analysis of the management sections of the companies that shifted their position between 2010 and 2015. In particular, we looked at two drivers: First, we identified “positive drivers” within companies who changed their internal and external carbon practices from a “lesser extent” to a “greater extent”, and second, “negative drivers” for companies who changed their internal and external carbon practices from a “greater extent” to a “lesser extent”. The results can be found in Table 3.
The results present a good overview about the drivers behind the shifts in carbon disclosure strategies. For example, Table 3 reveals that main driver for a positive effect in strategies is related to an increase of carbon management practices in the Initiatives and Policies (IP#) section (the score increased from 0.29 to 0.69). Both remaining internal management sections show also an increase between 2010 and 2015, with the Risks and Opportunities (RO#) having a stronger increase (from 0.29 to 0.64) than Accountability and Oversight (AO#) (from 0.29 to 0.43). The internal score of these companies in 2015 (with an average of 0.59) have put these companies above the industry average, thus leading to a positive shift from an internal CMPs perspective. However, although we can see an improvement in external CMPs, the increase is not sufficient to put these companies above industry average in 2015.
For the external negative shifts, Table 3 reveals that the main driver is the Industry Cooperation (IC#) section with a score decrease from 0.84 to 0.62, followed by Emission Verification (EV#) with a decrease from 0.52 to 0.49. Interestingly, from an internal perspective, these companies have improved their overall internal score from 0.47 to 0.51, but the overall increase of the industry average from 0.42 to 0.52 offsets these improvements, leading to no change in the internal section. The shifts in categorization and the associated analysis of the management sections and CMPs allows for a discussion and insights into the mechanisms behind the strategies and responses of global logistics companies.

5. Discussion of Results

The results provide an interesting insight into the carbon disclosure strategies of global logistics companies. To gain a comprehensive understanding of both the impact of the specific CMPs and the associated type of carbon disclosure strategies within the global logistics industry, the discussion will focus on how the extent of the dynamic interaction between internal and external practices has influenced carbon disclosure strategies over time.
One of the key findings of this study is that an overall shift to a more transparent behavior between 2010 and 2015 can be observed, driven by internal CMPs. Five companies out of 39 (13%), who have implemented internal and external CMPs to a lesser extent in 2010, have implemented internal CMPs to greater extent in 2015, thus changing their disclosure strategies from the Avoidance type to the Acquiescence type. Is seems that the move from the Avoidance type to the Acquiescence type is a first step to a more transparent behavior and indicates that these companies have faced an increase in internal pressures to implement internal CMPs. The increase in internal CMPs is mainly driven by an increase in Initiatives and Policies (IP#). Interestingly, the majority of companies still follows an Excellence approach (from 17 companies in 2010 to 16 companies in 2015). This is interesting, as it shows that the majority of global logistics companies seem to have adopted a holistic carbon disclosure strategy that is consistent with internal and external actions. This finding means, in general, that the institutional setting is significantly associated with the carbon disclosure score, confirming the previous results of Kolk and Perego [47] and Chen and Bouvain [48].
The findings are also interesting from a theoretical view. For the majority of companies in the Excellence type, the implementation of internal CMPs reflects the position of the sustainability logic as a core function and the company’s organizational culture of climate change values. At the same time, it seems these values are transferred to the external dimension where the high salience represents the company’s approach to give priority to stakeholder claims that go beyond market-driven initiatives, leading to transparency and full carbon disclosure. Looking at the overall shifts, the trend between 2010 and 2015 seems positive, with six companies shifting to category where CMPs are implemented to a “greater extent”, while only two companies shift to categories where CMPs are applied to a “lesser extent”.
Moreover, the overall averages of internal and external CMPs between 2010 and 2015 have increased, from 0.42 to 0.52 for internal CMPs and from 0.41 to 0.46 for external CMPs. These shifts indicate that not only the sustainability logic is more integrated into global logistics companies and takes a place closer to the core function within the organization, but also that the companies are increasingly confronted with salient stakeholders who apply pressure for more transparency. The main driver behind the internal shifts is an increase in applied carbon management practice in Initiatives and Policies (IP#), while the driver for external improvements is related to Industry Cooperation (IC#) and Emission Verification (EV#).

Conclusion and Limitations

To gain a more nuanced understanding of how internal and external carbon management practices influence carbon disclosure strategies, it is critical to investigate the variety of organizational responses that companies adopt, rather than treating carbon disclosure as a monolithic construct. In a carbon disclosure context, however, existing research has to date not only omitted to distinguish between internal and external actions, but it also limited to describe how carbon disclosure strategies have evolved over time. We address this gap by examining the extent of implemented internal and external carbon disclosure management practices and the associated disclosure strategies, using a data from Bloomberg ESG and the Carbon Disclosure Project (CDP).
Our analysis showed an overall shift to a more transparent behavior between 2010 and 2015, with an increase of applied carbon management practices in both internal and external actions, representing a change in carbon disclosure strategies. The majority in shifts can be related to internal actions, driven by an increase in applied carbon management practices in Initiatives and Policies (IP#). The main driver behind the internal shifts is an increase in applied carbon management practice in Initiatives and Policies (IP#), while the driver for external improvements is related to Industry Cooperation (IC#) and Emission Verification (EV#). This indicates that internal drivers seem to be stronger than external, thus, from a theoretical perspective, companies see the sustainability logic closer to the core function within the organization. As such, these findings contribute to prior research on structural change and provide a step towards a more detailed understanding of the mechanisms that influence carbon disclosure strategies.
In particular, this paper contributes in three ways. First, we conceptualized a model of carbon disclosure responses that proposes four ideal types, thus providing an understanding of the dynamic interaction between internal and external actions and their influence on carbon disclosure strategies. Second, methodologically, using 25 specific carbon management practices (CMPs) from Bloomberg ESG and Carbon Disclosure Project (CDP) data, we constructed a model to measure how CMPs have changed between 2010 and 2015. Third, empirically, we categorized carbon disclosure strategies and analyzed how these strategies have changed over time. We thereby advance the literature on strategic carbon management and disclosure and present a more empirical and theoretical understanding of the dynamics between internal and external actions over time.
However, these findings have to be reviewed in the light of its limitations. First, the Bloomberg ESG and the associated CDP dataset is relatively new, therefore only an examination between 2010 and 2015 could take place. Future research could look at longer periods and use complementing datasets to provide a more holistic picture. Second, the sample size is limited, we are therefore cautious about making general claims. Third, although we used valid constructs from institutional and stakeholder theory to build our model, future research could use complementary theoretical lenses to enhance the understanding about carbon disclosure from another perspective. Future research could also examine how carbon disclosure strategies influence carbon emissions or how carbon disclosure impacts financial performance.

Author Contributions

David M. Herold contributed to the manuscript by providing the initial concept and the research design. David M. Herold also performed the data collection and analysis and wrote the manuscript.

Acknowledgments

The author thanks Ki-Hoon Lee from Griffith University for a friendly review.

Conflicts of Interest

The author declares no conflict of interest.

References

  1. Luo, L. The influence of institutional contexts on the relationship between voluntary carbon disclosure and carbon emission performance. Account. Financ. 2017. [Google Scholar] [CrossRef]
  2. Welbeck, E.E. The influence of institutional environment on corporate responsibility disclosures in Ghana. Medit. Account. Res. 2017, 25, 216–240. [Google Scholar] [CrossRef]
  3. De Villiers, C.; Alexander, D. The institutionalisation of corporate social responsibility reporting. Br. Account. Rev. 2014, 46, 198–212. [Google Scholar] [CrossRef] [Green Version]
  4. Pal, A.; Kant, K. A food transportation framework for an efficient and worker-friendly fresh food physical internet. Logistics. 2017, 1, 10. [Google Scholar] [CrossRef]
  5. Schaltegger, S.; Csutora, M. Carbon accounting for sustainability and management. Status quo and challenges. J. Clean. Prod. 2012, 36, 1–16. [Google Scholar] [CrossRef]
  6. Herold, D.M.; Lee, K.-H. Carbon management in the logistics and transportation sector: An overview and new research directions. Carbon Manag. 2017, 8, 79–97. [Google Scholar] [CrossRef]
  7. Adams, C.A.; McNicholas, P. Making a difference: Sustainability reporting, accountability and organisational change. Account. Audit. Account. J. 2007, 20, 382–402. [Google Scholar] [CrossRef]
  8. Kolk, A.; Levy, D.; Pinkse, J. Corporate responses in an emerging climate regime: The institutionalization and commensuration of carbon disclosure. Eur. Account. Rev. 2008, 17, 719–745. [Google Scholar] [CrossRef]
  9. Hrasky, S. Carbon footprints and legitimation strategies: Symbolism or action? Account. Audit. Account. J. 2011, 25, 174–198. [Google Scholar] [CrossRef]
  10. Lee, K.-H.; Herold, D.M. Cultural relevance in environmental and sustainability management accounting (EMA) in the Asia-Pacific region: A link between cultural values. In Accounting for Sustainability: Asia Pacific Perspectives; Lee, K.-H., Schaltegger, S., Eds.; Springer International Publishing AG: Gewerbestrasse, Cham, Switzerland, 2018; Volume 33, pp. 11–37. [Google Scholar]
  11. Herold, D.M. The influence of institutional and stakeholder pressures on carbon disclosure strategies: An investigation in the global logistics industry. PhD. Thesis, Griffith University, South East Queensland, Australia, January 2018. [Google Scholar]
  12. Tozanli, O.; Duman, G.M.; Kongar, E.; Gupta, S.M. Environmentally Concerned Logistics Operations in Fuzzy Environment: A Literature Survey. Logistics. 2017, 1, 4. [Google Scholar] [CrossRef]
  13. Hawn, O.; Ioannou, I. Mind the gap: The interplay between external and internal actions in the case of corporate social responsibility. Strateg. Manag. J. 2016, 37, 2569–2588. [Google Scholar] [CrossRef]
  14. Borghei, Z.; Leung, P.; Guthrie, J. The nature of voluntary greenhouse gas disclosure–an explanation of the changing rationale: Australian evidence. Medit. Account. Res. 2016, 24, 111–133. [Google Scholar] [CrossRef]
  15. Herold, D.M.; Lee, K.-H. Carbon disclosure strategies in the global logistics industry: Similarities and differences in carbon measurement and reporting. In Pathways to A Sustainable Economy; Hossain, M., Hales, R., Sarker, T., Eds.; Springer International Publishing AG: Gewerbestrasse, Cham, Switzerland, 2018; pp. 87–101. ISBN 978-3-319-67702-6. [Google Scholar]
  16. De Villiers, C.; Naiker, V.; Van Staden, C.J. The effect of board characteristics on firm environmental performance. J. Manag. 2011, 37, 1636–1663. [Google Scholar] [CrossRef]
  17. Linnenluecke, M.K.; Griffiths, A. Corporate sustainability and organizational culture. J. World Bus. 2010, 45, 357–366. [Google Scholar] [CrossRef]
  18. Mitchell, R.K.; Agle, B.R.; Wood, D.J. Toward a theory of stakeholder identification and salience: Defining the principle of who and what really counts. Acad. Manag. Rev. 1997, 22, 853–886. [Google Scholar] [CrossRef]
  19. Thornton, P.H.; Ocasio, W. Institutional logics. In The Sage Handbook of Organizational Institutionalism; Greenwood, R., Oliver, C., Suddaby, R., Sahlin, A., Eds.; SAGE Publications Ltd.: London, UK, 2008; Volume 840, pp. 100–129. [Google Scholar]
  20. Besharov, M.L.; Smith, W.K. Multiple institutional logics in organizations: Explaining their varied nature and implications. Acad. Manag. Rev. 2014, 39, 364–381. [Google Scholar] [CrossRef]
  21. Freeman, R.E. Strategic management: A stakeholder approach. Adv. Strateg. Manag. 1983, 1, 31–60. [Google Scholar]
  22. Oliver, C. Strategic responses to institutional processes. Acad. Manag. Rev. 1991, 16, 145–179. [Google Scholar] [CrossRef]
  23. Meyer, J.W.; Rowan, B. Institutionalized organizations: Formal structure as myth and ceremony. Am. J. Sociol. 1977, 83, 340–363. [Google Scholar] [CrossRef]
  24. Hörisch, J.; Freeman, R.E.; Schaltegger, S. Applying stakeholder theory in sustainability management: Links, similarities, dissimilarities, and a conceptual framework. Organ. Environ. 2014, 27, 328–346. [Google Scholar] [CrossRef]
  25. Lee, K.-H.; Herold, D.M. Cultural relevance in corporate sustainability management: A comparison between Korea and Japan. Asian J. Sustain. Soc. Responsib. 2016, 1, 1–21. [Google Scholar] [CrossRef]
  26. UPS. Sustainability Report–The Road Ahead; United Parcel Service: Louisville, GA, USA, 2017. [Google Scholar]
  27. Herold, D.M.; Lee, K.-H. The influence of the sustainability logic on carbon disclosure in the global logistics industry: The case of Dhl, Fdx and Ups. Sustainability. 2017, 9, 601. [Google Scholar] [CrossRef]
  28. Schuler, D.A.; Cording, M. A corporate social performance–corporate financial performance behavioral model for consumers. Acad. Manag. Rev. 2006, 31, 540–558. [Google Scholar] [CrossRef]
  29. Barnett, M.L. Stakeholder influence capacity and the variability of financial returns to corporate social responsibility. Acad. Manag. Rev. 2007, 32, 794–816. [Google Scholar] [CrossRef]
  30. Du, S.; Bhattacharya, C.B.; Sen, S. Maximizing business returns to corporate social responsibility (CSR): The role of CSR communication. Int. J. Manag. Rev. 2010, 12, 8–19. [Google Scholar] [CrossRef]
  31. Brundtland, G.H. Our Common Future: Report of the World Commission on Environment and Development; World Commission on Environment and Development; Oxford University Press: New York, NY, USA, 1987. [Google Scholar]
  32. Bob, S. Transport Report; Carbon Disclosure Project; CDP: London, UK, 2010. [Google Scholar]
  33. Schaltegger, S.; Hörisch, J. In search of the dominant rationale in sustainability management: Legitimacy-or profit-seeking? J. Bus. Ethics 2017, 145, 259–276. [Google Scholar] [CrossRef]
  34. Herold, D.M. Peak oil: Impacts on global trade and transportation. Master’s Thesis, Danube University Krems, Krems, Austria, September 2012. [Google Scholar]
  35. Herold, D.M.; Manwa, F.; Sen, S.; Wilde, S.J. It’s the yeast we can do: Untapping sustainability trends in australian craft breweries. J. Asia Entrep. Sustain. 2016, 12, 82–110. [Google Scholar]
  36. Schaltegger, S.; Burritt, R. Business cases and corporate engagement with sustainability: Differentiating ethical motivations. J. Bus. Ethics 2017, 145, 259–276. [Google Scholar] [CrossRef]
  37. Pålsson, H.; Kovács, G. Reducing transportation emissions: A reaction to stakeholder pressure or a strategy to increase competitive advantage. Int. J. Phys. Distribut. Logist. Manag. 2014, 44, 283–304. [Google Scholar] [CrossRef]
  38. John, E.; Judy, K. Trust Us: The Global Reporters 2002 Survey of Corporate Sustainability Reporting; United Nations Environment Programme (UNEP); SustainAbility: London, UK, 18 November 2002. [Google Scholar]
  39. Beattie, V. Accounting narratives and the narrative turn in accounting research: Issues, theory, methodology, methods and a research framework. Br. Account. Rev. 2014, 46, 111–134. [Google Scholar] [CrossRef]
  40. Unerman, J. Methodological issues-reflections on quantification in corporate social reporting content analysis. Account. Audit. Account. J. 2000, 13, 667–681. [Google Scholar] [CrossRef]
  41. Beattie, V.; McInnes, B.; Fearnley, S. A methodology for analysing and evaluating narratives in annual reports: A comprehensive descriptive profile and metrics for disclosure quality attributes. Account. Forum 2004, 28, 205–236. [Google Scholar] [CrossRef]
  42. Botosan, C.A. Disclosure level and the cost of equity capital. Account. Rev. 1997, 72, 323–349. [Google Scholar]
  43. Scott, W.R. Unpacking institutional arguments. In The New Institutionalism in Organizational Analysis; Powell, W.W., DiMaggio, P.J., Eds.; University of Chicago Press: Chicago, IL, USA, 1991; pp. 164–182. [Google Scholar]
  44. JOC. Top 50 Global 3pl Companies; Pittsburgh, PA, USA, 2015. Available online: https://www.joc.com/special-topics/top-50-3pls (accessed on 27 July 2018).
  45. Bloomberg 2016 Impact Report. Available online: https://www.bloomberg.com/company/announcements/bloomberg-publishes-2016-impact-report/ (accessed on 27 July 2018).
  46. Weber, R.P. Basic Content Analysis, Quantitative Applications in the Social Sciences; Sage Publications: Beverly Hills, CA, USA, 1990. [Google Scholar]
  47. Kolk, A.; Perego, P. Determinants of the adoption of sustainability assurance statements: An international investigation 2010. Bus. Strateg. Environ. 2010, 19, 182–198. [Google Scholar]
  48. Chen, S.; Bouvain, P. Is corporate responsibility converging? A comparison of corporate responsibility reporting in the USA, UK, Australia, and Germany. J. Bus. Ethics 2009, 87, 299–317. [Google Scholar] [CrossRef]
Figure 1. Carbon disclosure responses.
Logistics 02 00013 g001
Figure 2. Summary of the shifts in carbon disclosure strategies.
Logistics 02 00013 g002
Table 1. Carbon management practices (CMPs).
CMPsDescription
INTERNAL
Accountability and Oversight (AO#)
CSR/Sustainability CommitteeIndicates whether the company has a corporate social responsibility (CSR)/sustainability (or equivalent) committee that reports directly to the board.
Responsible Body for Climate ChangeIndicates if a board committee or other executive body has overall responsibility for climate change.
Exec Director for SustainabilityIndicates whether there is an executive director on the board with responsibility for corporate social responsibility (CSR)/sustainability.
Non-Exec Director for SustainabilityIndicates whether there is a non-executive director on the board with responsibility for corporate social responsibility (CSR)/sustainability.
Climate Change Management IncentivesIndicates whether the company provides incentives for individual management of climate change issues including attainment of GHG (Greenhouse Gas) targets.
Initiatives and Policies (IP#)
Climate Change Initiatives/PolicyIndicates whether the company has outlined its intention to help reduce global emissions of the Greenhouse Gases that cause climate change through its ongoing operations and/or the use of its products and services.
Energy Efficiency Initiatives/PolicyIndicates whether the company has implemented any initiatives to make its use of energy more efficient.
Emissions Reductions Initiatives/PolicyIndicates whether the company has implemented any initiatives to reduce its environmental emissions to air.
Environmental Quality Initiatives/PolicyIndicates whether the company has introduced any kind of environmental quality management and/or environmental management system to help reduce the environmental footprint of its operations.
Environmental SC Initiatives/PolicyIndicates whether the company has implemented any initiatives to reduce the environmental footprint of its supply chain.
Risks and Opportunities (RO#)
Assessment of regulatory CC opportunitiesIndicates if the company considers itself exposed to potential climate change regulatory opportunity.
Assessment of physical CC riskIndicates if the company considers itself exposed to climate change physical risk.
Assessment of physical CC opportunitiesIndicates if the company considers itself exposed to potential climate change physical opportunity.
Assessment of other CC risksIndicates if the company considers itself exposed to any other risk associated with climate change.
CC Risks discussion in Annual reportIndicates whether the Management Discussion and Analysis (MD&A) or its equivalent risk section of company’s annual report discusses business risks related to climate change.
CC Opportunities discussion in Annual reportIndicates whether the Management Discussion and Analysis (MD&A) and its equivalent section of company’s annual report discuss business opportunities related to climate change.
EXTERNAL
Emission Verification (EV#)
Verification/Assurance Scope 1 emissionsPercentage of scope 1 reported emissions which have been verified/assured.
Verification/Assurance Scope 2 emissionsPercentage of scope 2 reported emissions which have been verified/assured.
Verification/Assurance Scope 3 emissionsPercentage of scope 3 reported emissions which have been verified/assured.
Policy/data verification via 3rd partyIndicates whether the company’s environmental policies and data were subject to an independent assessment for the reporting period.
External Engagement (EE#)
Engagement with policy makersIndicates if the company engages with policymakers on possible responses to climate change including taxation, regulation and carbon trading.
Signatory of the UNGCIndicates whether the company is a signatory of the United Nations Global Compact (UNGC).
Usage of GRI frameworkIndicates whether the company has used the Global Reporting Initiative (GRI) framework for guidance in its public reporting, to varying degrees of compliance.
Engagement with CDPIndicates whether the company has disclosed their carbon emissions to the Carbon Disclosure Project (CDP).
Industry Cooperation (IC#)
Extend of disclosure to BloombergProprietary Bloomberg score based on the extent of a company’s environmental disclosure as part of Environmental, Social and Governance (ESG) data.
Extend of disclosure to CDPReflects the comprehensiveness of a company’s response in terms of the depth and breadth of its answers to the Carbon Disclosure Project (CDP) questionnaire
Source: Bloomberg ESG.
Table 2. Summary of descriptive statistics.
SectionsCMPs20102015Variance
MeanStd. Dev.MeanStd. Dev.MeanStd. Dev.
Accountability and Oversight (AO#)0.350.230.380.220.03−0.01
CSR/Sustainability Committee0.030.160.080.280.050.11
Responsible Body for Climate Change0.650.480.240.43−0.41−0.05
Exec Director for Sustainability0.080.280.110.310.030.04
Non-Exec Director for Sustainability0.000.000.000.000.000.00
Climate Change Mgmt Incentives0.510.510.680.470.160.03
Initiatives and Policies (IP#)0.580.390.730.360.15−0.03
Climate Change Initiatives/Policy0.410.500.620.490.220.01
Energy Efficiency Initiatives/Policy0.680.470.780.420.110.06
Emissions Reductions Initiatives/Policy0.650.480.840.370.190.11
Envir. Quality Initiatives/Policy0.680.470.700.460.030.01
Environmental SC Initiatives/Policy0.410.500.570.500.160.00
Risks and Opportunities (RO#)0.350.310.500.290.15−0.02
Assessment of regulatory CC opportunities0.490.510.680.470.190.03
Assessment of physical CC risk0.490.510.760.430.270.07
Assessment of physical CC opportunities0.380.490.590.500.220.01
CC Risks discussion in Annual report0.240.430.270.450.030.02
CC Opportunities discussion in Annual report0.050.230.030.16−0.030.06
Internal CMPs0.420.240.520.210.100.03
Emission Verification (EV#)0.240.330.410.410.170.08
Verification/Assurance Scope 1 emissions0.310.460.530.490.230.03
Verification/Assurance Scope 2 emissions0.300.460.490.490.190.03
Verification/Assurance Scope 3 emissions0.090.280.320.460.230.19
Policy/data verification via 3rd party0.240.430.350.480.110.05
External Engagement (EE#)0.500.340.440.28−0.06−0.06
Engagement with policy makers0.510.510.590.500.08−0.01
Signatory of the UNGC0.730.650.270.51−0.460.14
Usage of GRI framework0.030.160.680.280.650.11
Engagement with CDP0.190.400.220.420.030.02
Industry Cooperation (IC#)0.440.260.530.280.080.02
Extend of disclosure to Bloomberg0.260.210.280.210.020.00
Extend of disclosure to CDP0.540.380.630.430.090.05
External CMPs0.410.280.460.270.060.00
Table 3. Drivers for change in carbon disclosure strategies.
Positive DriversNegative Drivers
ManagementSections2010201520102015
MeanMeanMeanMean
Accountability and Oversight (AO#)0.290.430.500.50
Initiatives and Policies (IP#)0.290.690.901.00
Risks and Opportunities (RO#)0.290.640.000.08
Internal CMPs0.290.590.470.51
Industry Average0.420.520.420.52
Emission Verification (EV#)0.060.230.520.49
External Engagement (EE#)0.290.360.750.75
Industry Cooperation (IC#)0.340.460.840.62
External CMPs0.230.350.700.62
Industry Average0.410.460.410.46

