Effect of Individual Skills and Performance on Humanitarian Organisations: A Structural Equation Model


Abstract
1. Introduction
2. Literature Survey
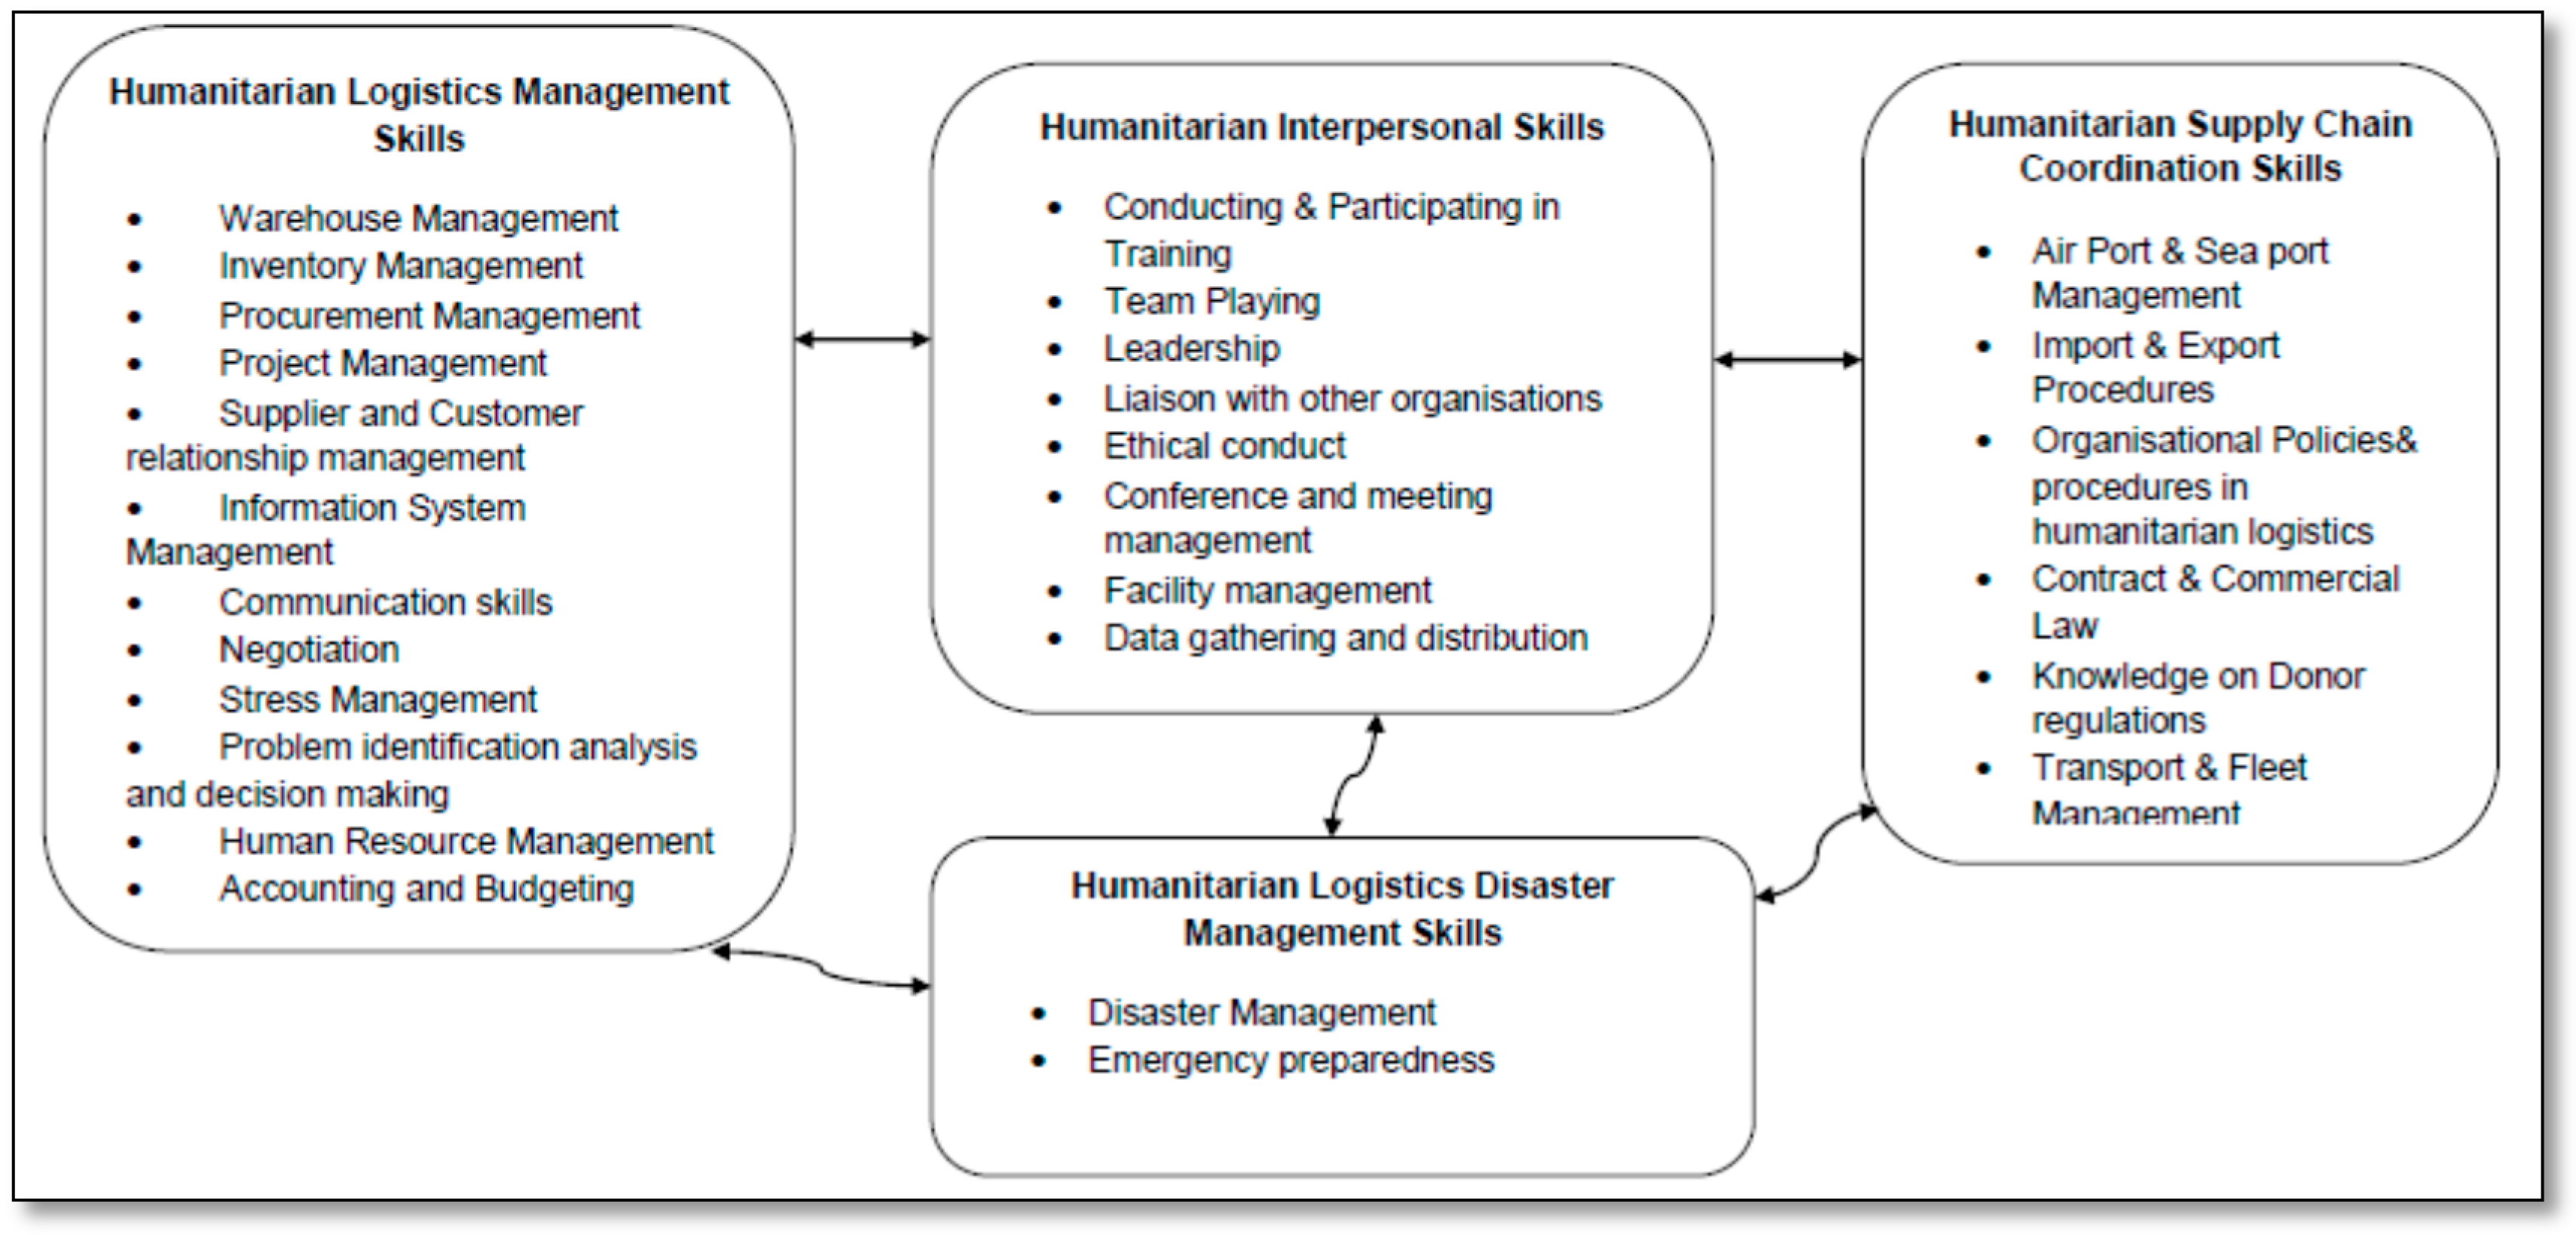
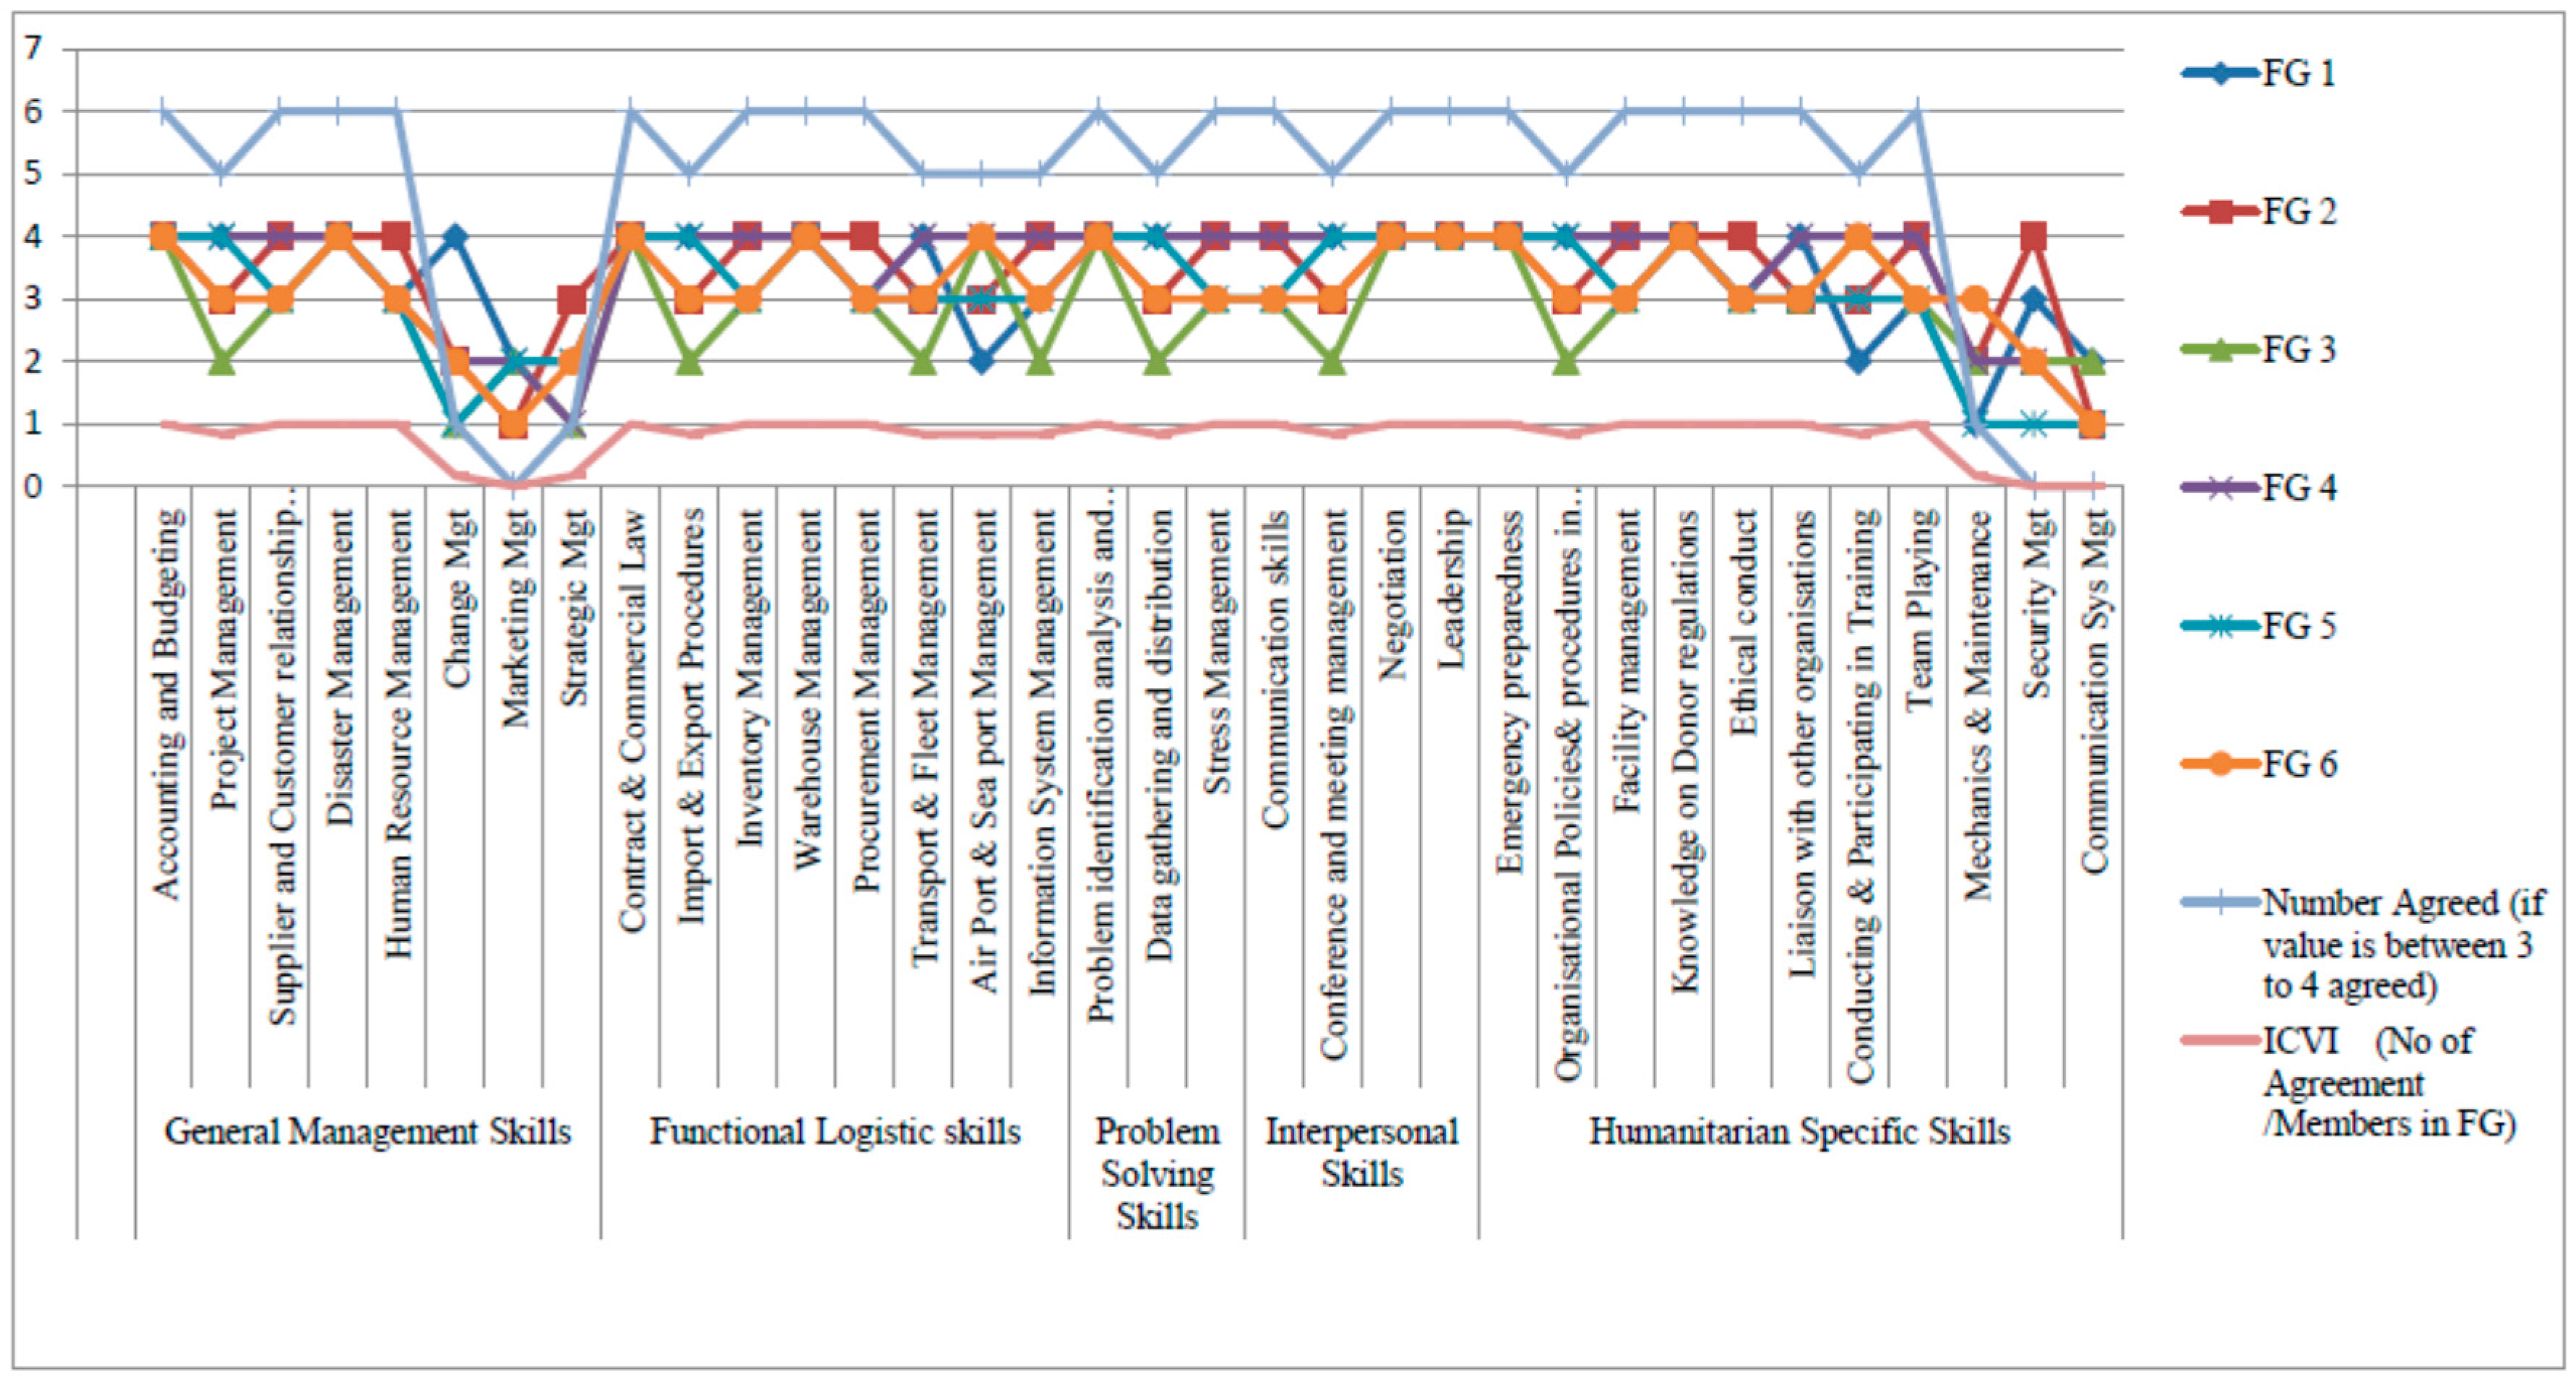
2.1. HL Skills
2.2. HL Practitioner Performance Measurements
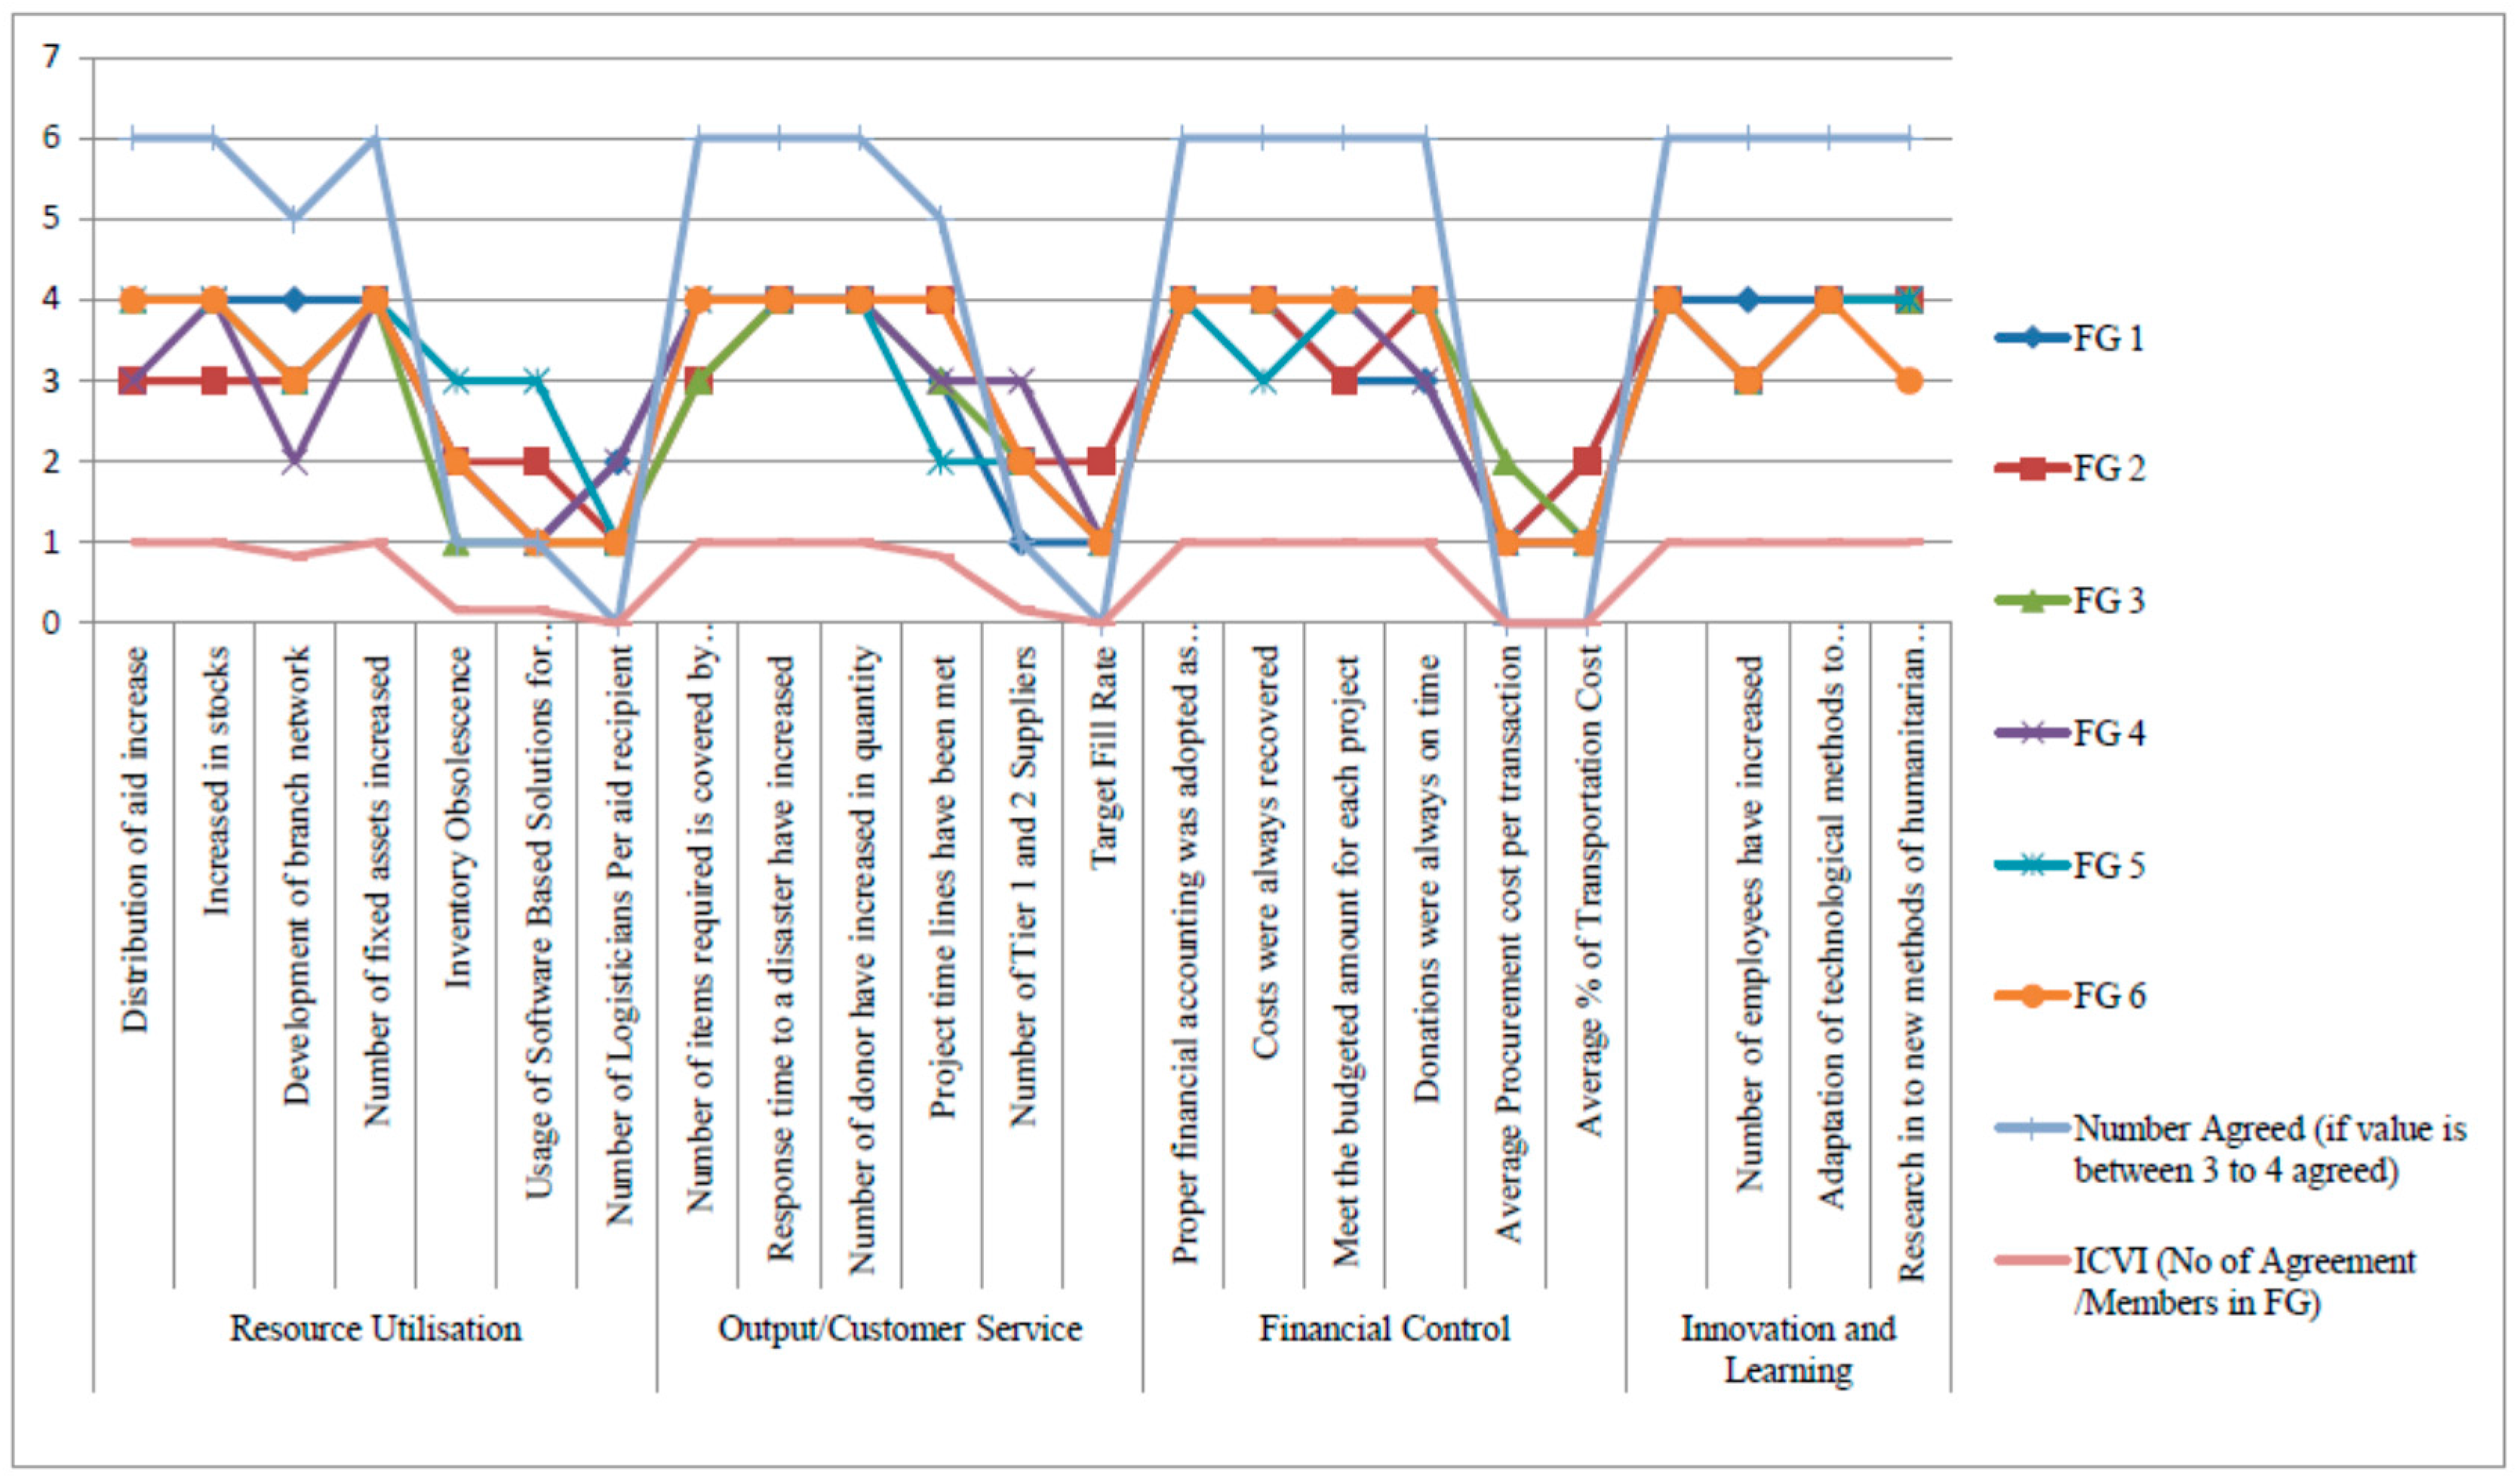
2.3. Humanitarian Organisational Performance
2.4. Application of SEM for Humanitarian Research
- It is the best method for identifying multiple observed variables. Most other statistical methods can only identify a limited number of variables.
- Greater recognition is given to the validity and reliability of observed scores from the observed variables. Measurement errors are considered in analysing all the observed variables.
- It is possible to analyse more sophisticated theoretical models using SEM.
- As SEM software becomes increasingly user-friendly, it will become easier to use in the sort of research discussed in this paper.
3. Research Methodology
3.1. Proposed Model and Hypotheses
3.2. Reliability and Validity of Questionnaire
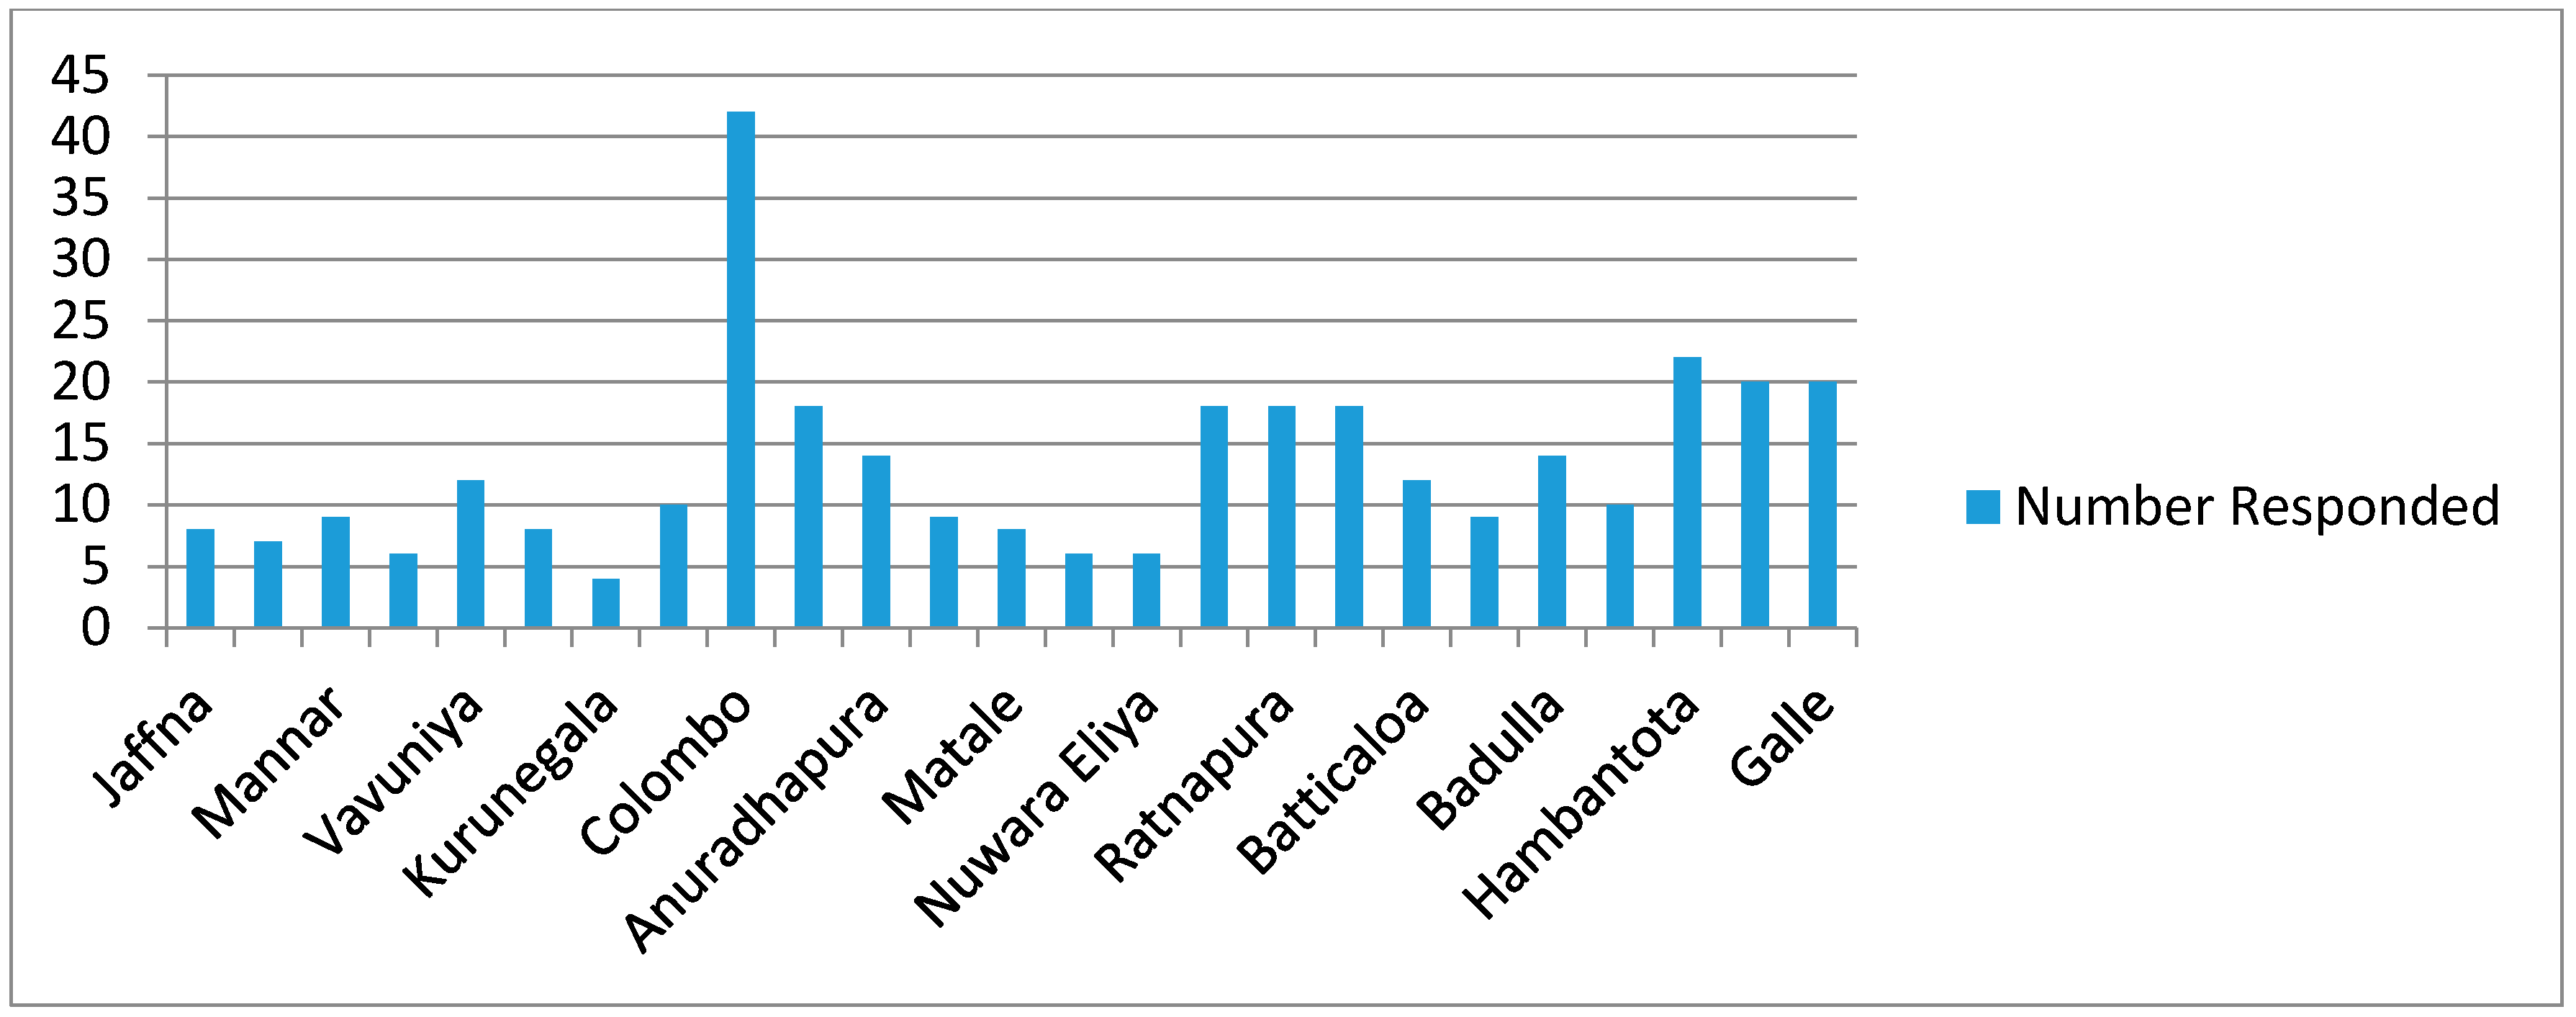
3.3. Data Collection and Sampling Procedure
4. Analysis of Data
4.1. Verifying the Assumptions Prior to SEM
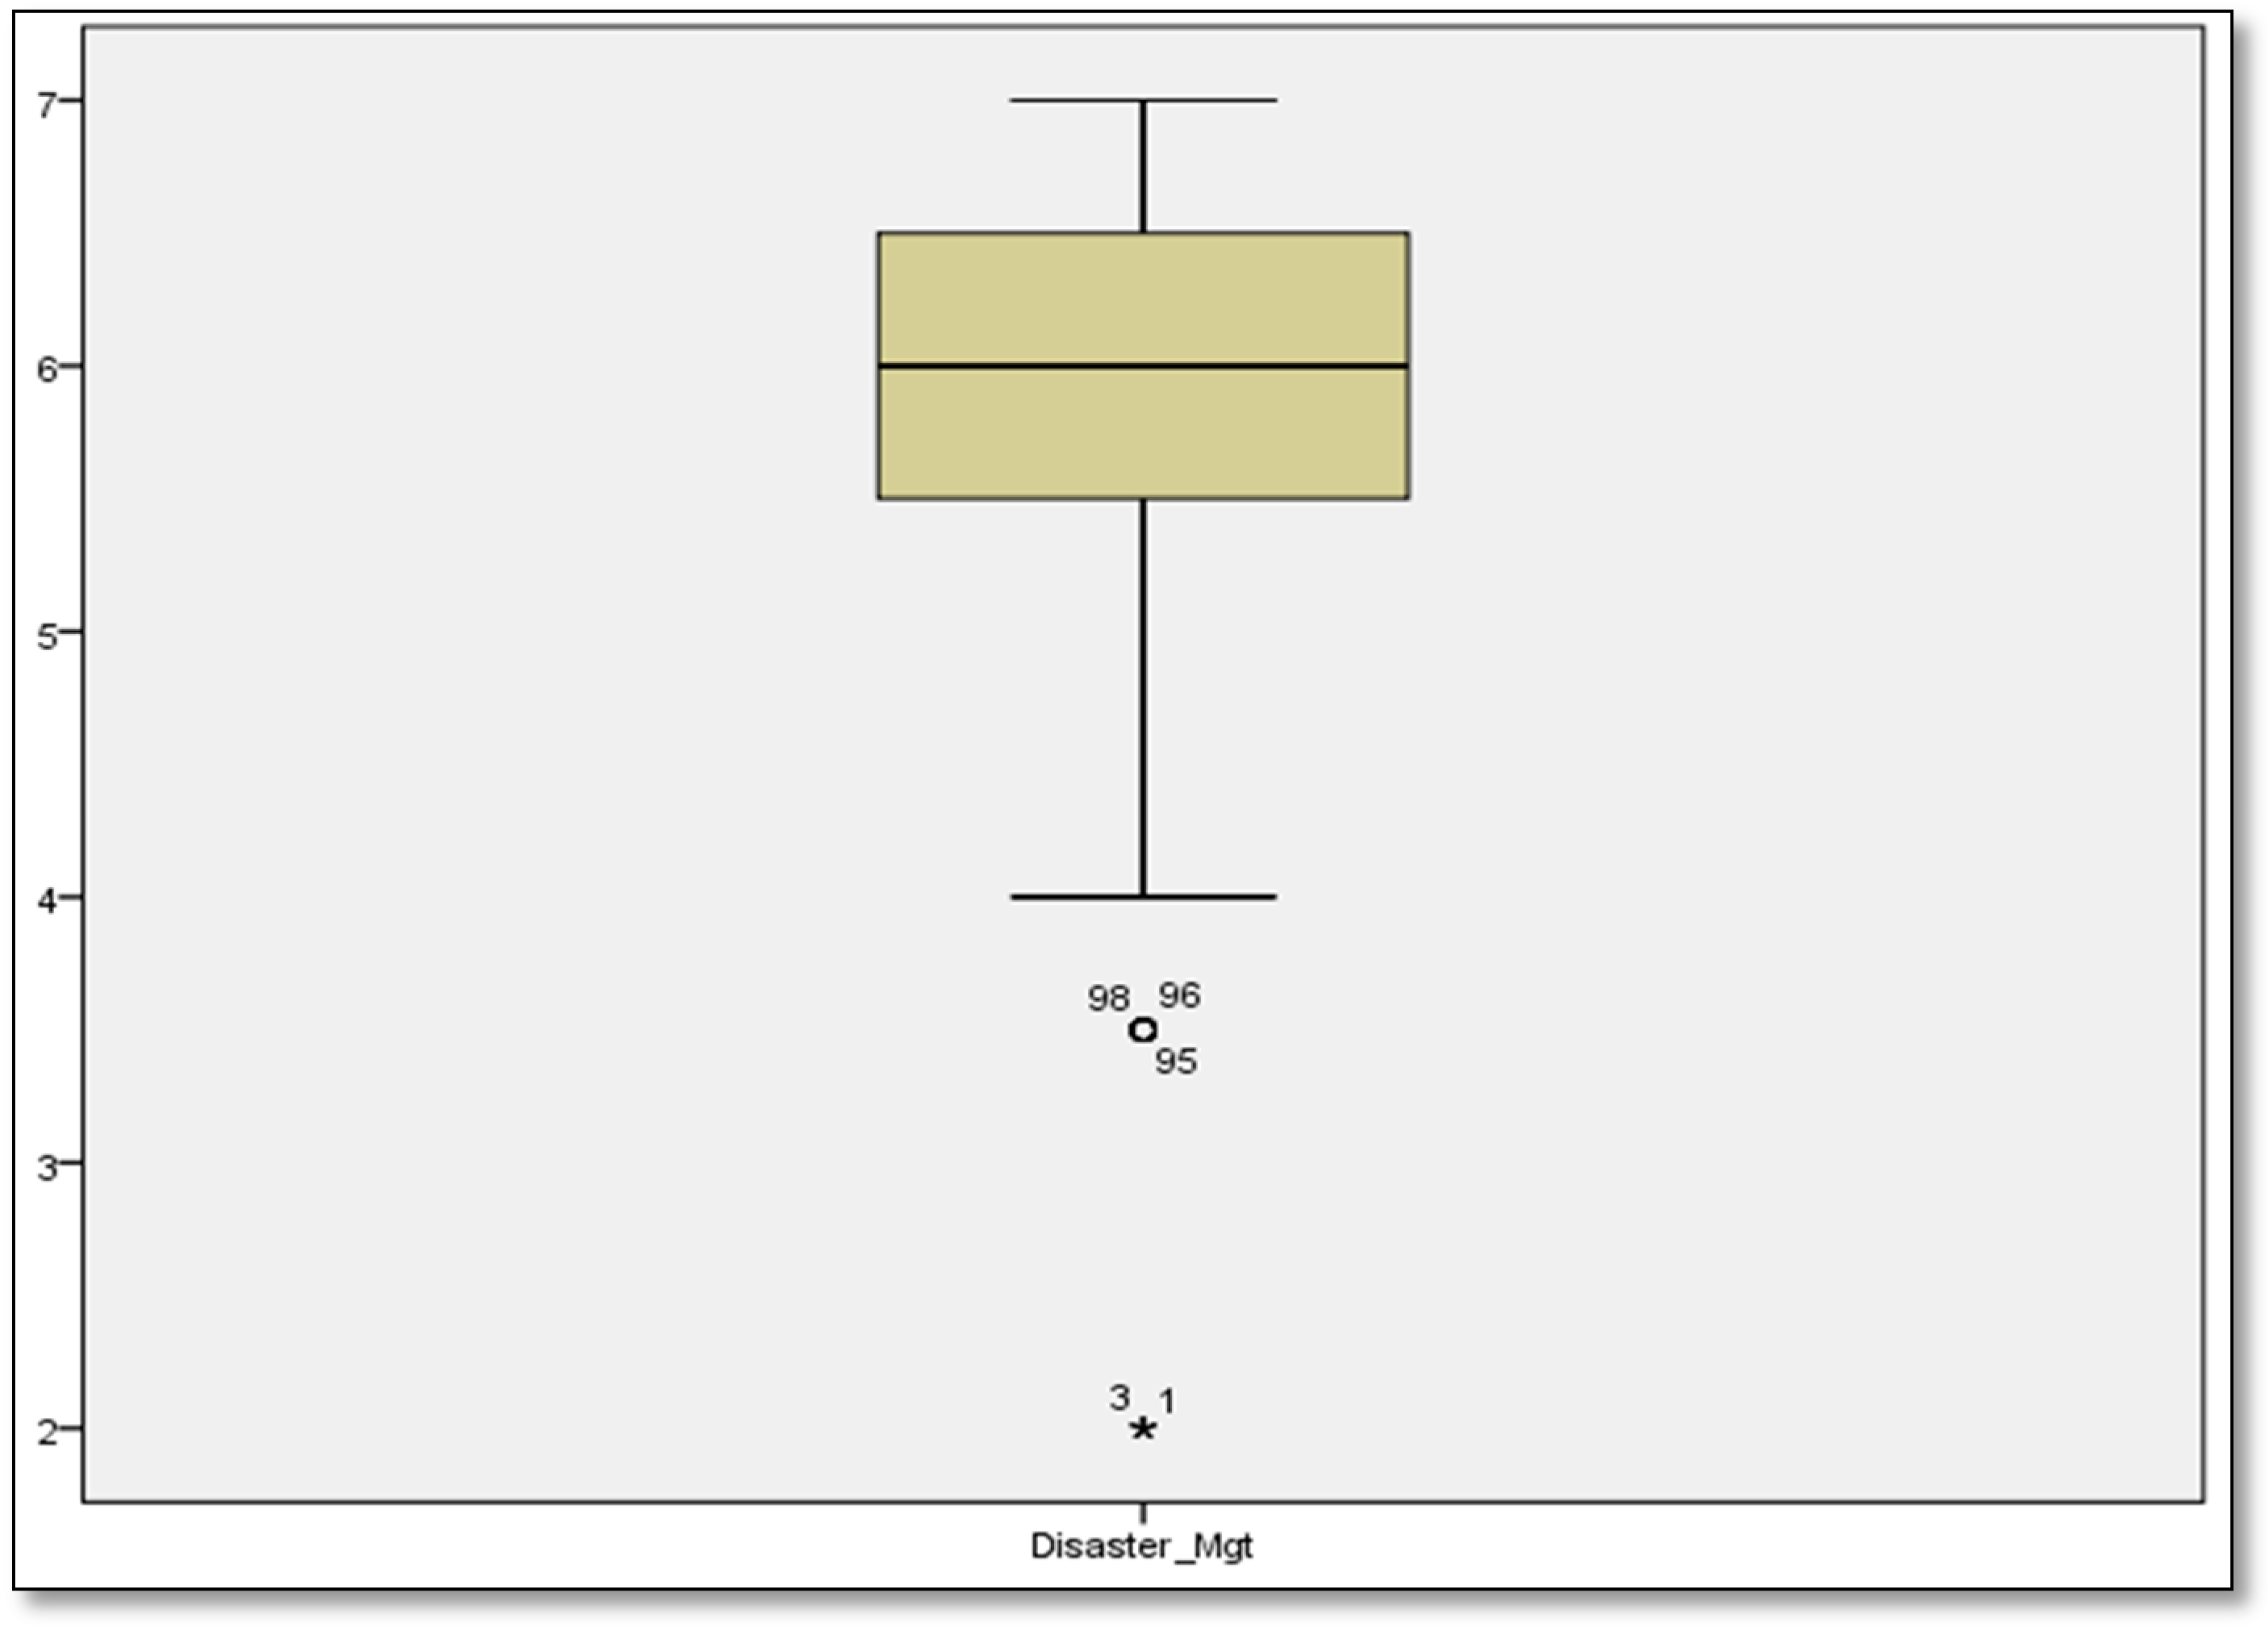
4.1.1. Multivariate Normality
4.1.2. Multicollinearity
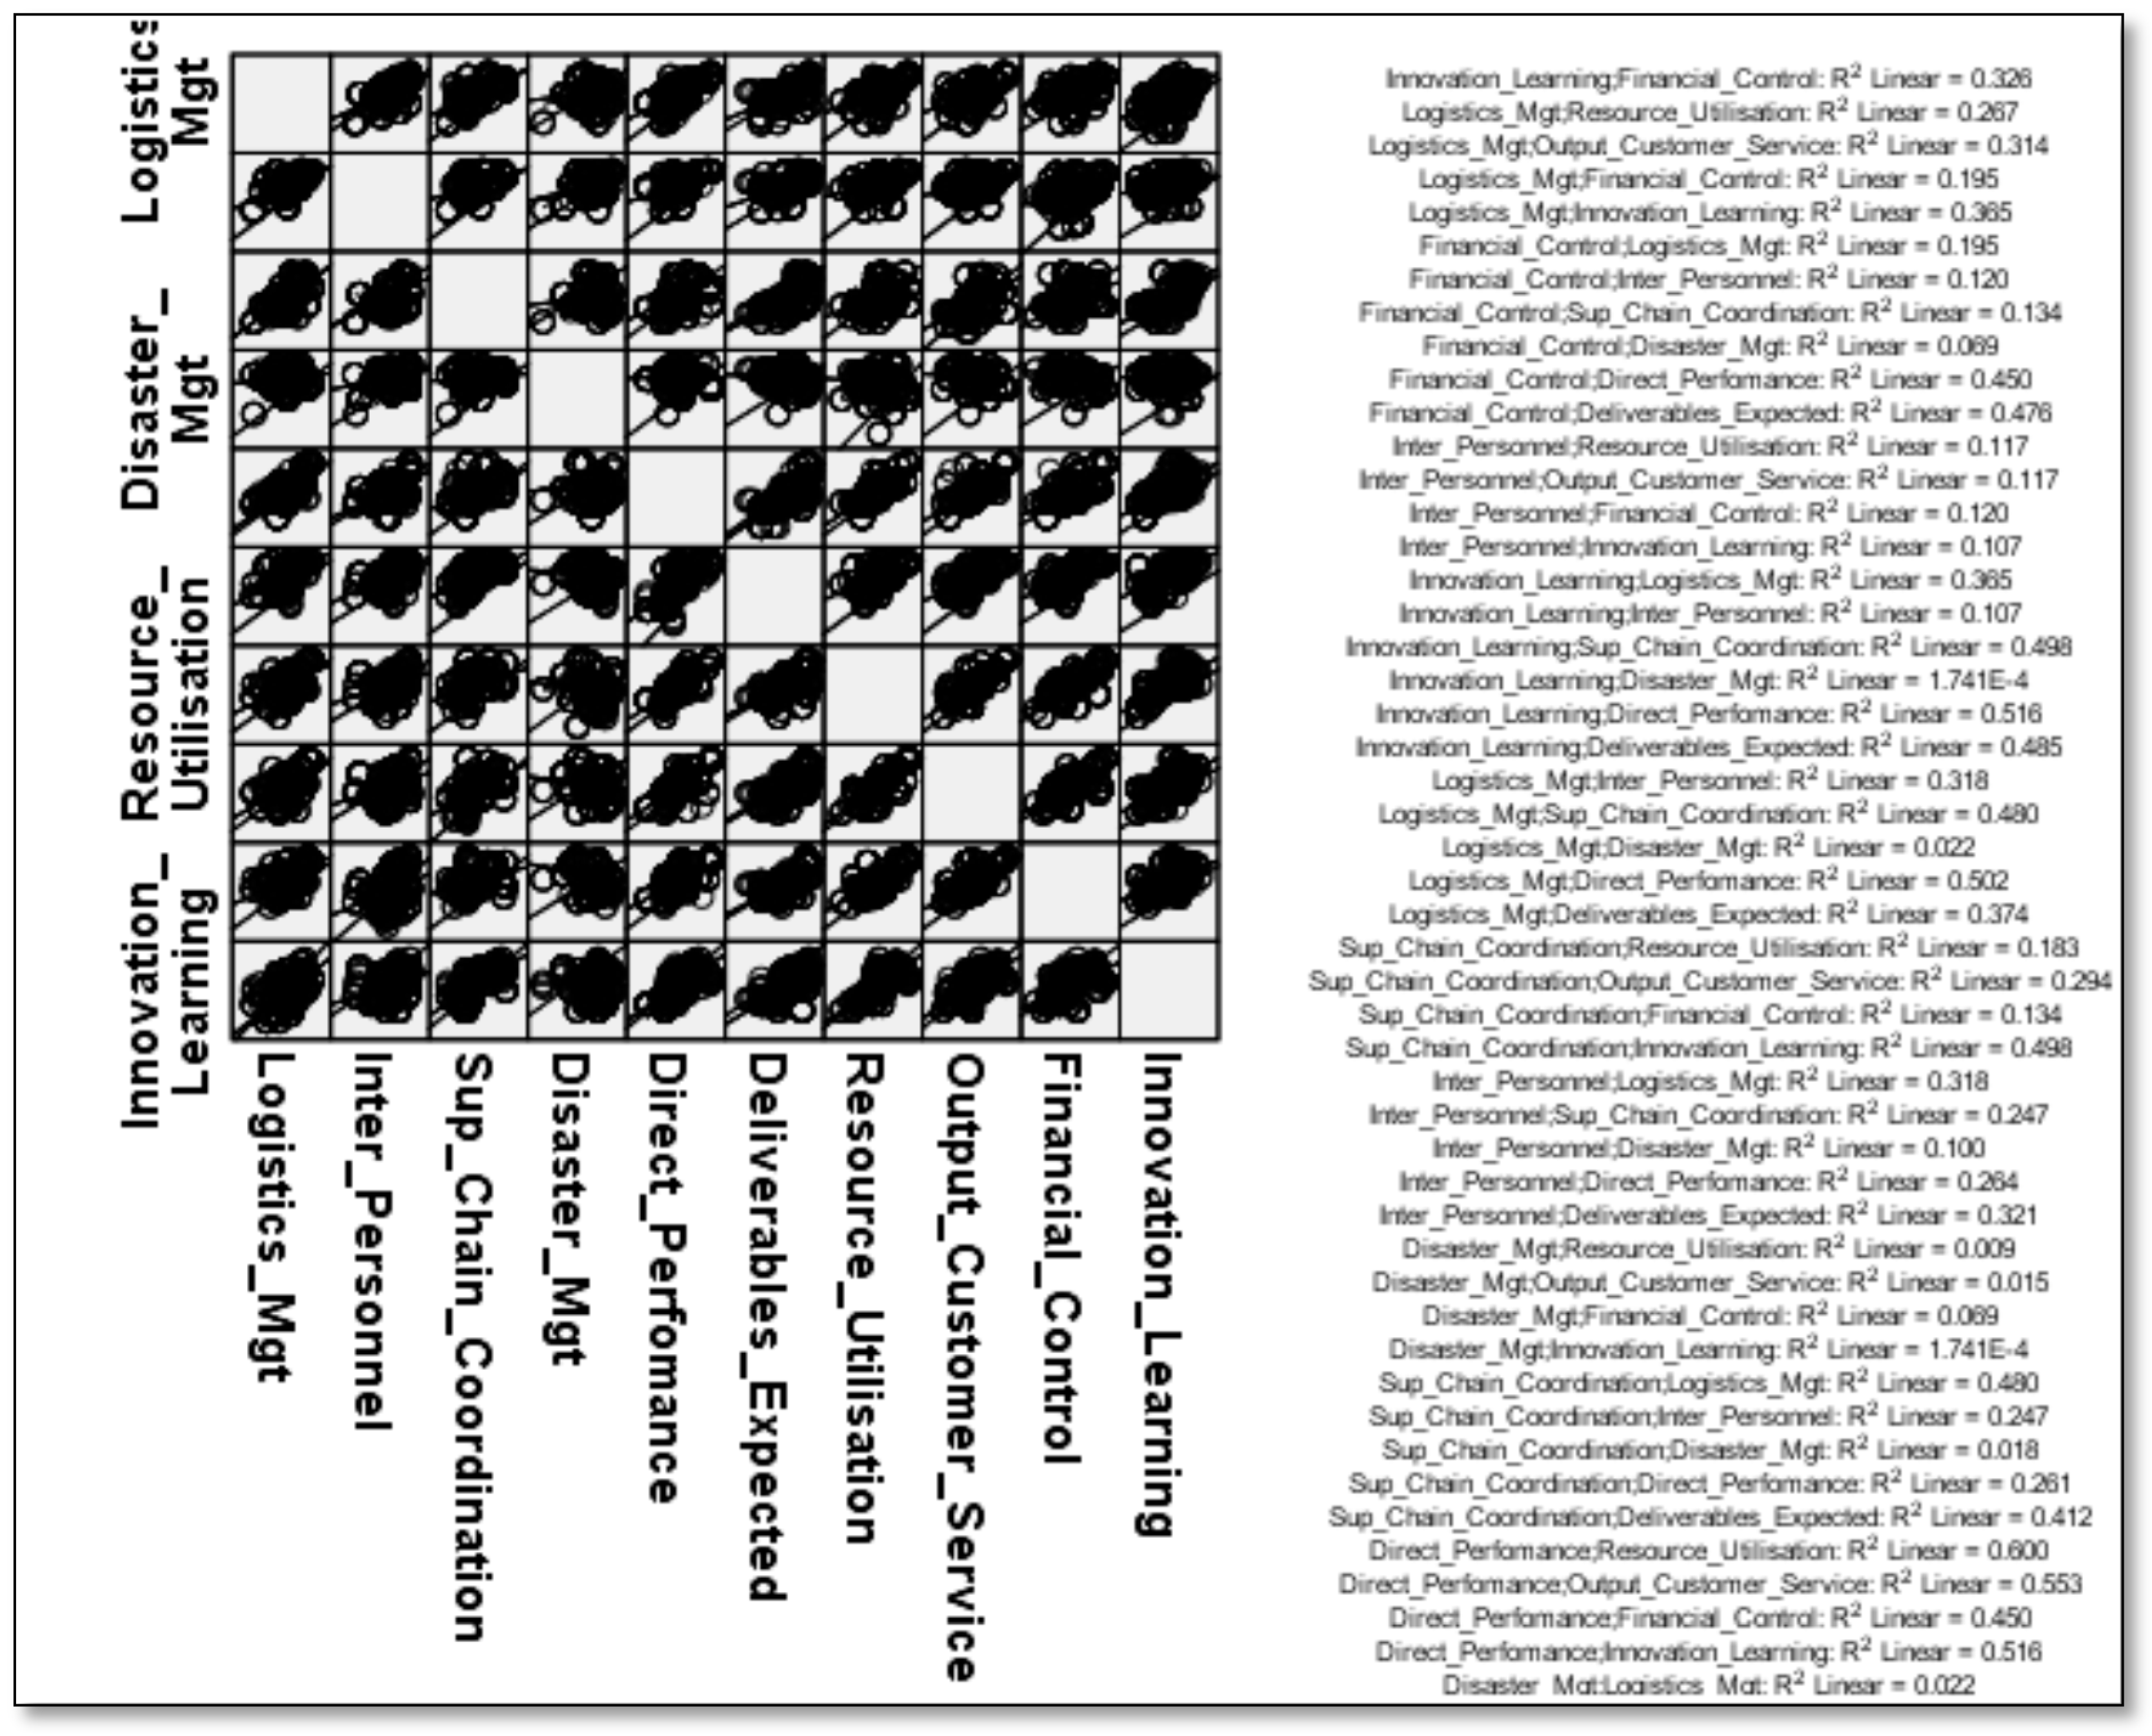
4.1.3. Linearity
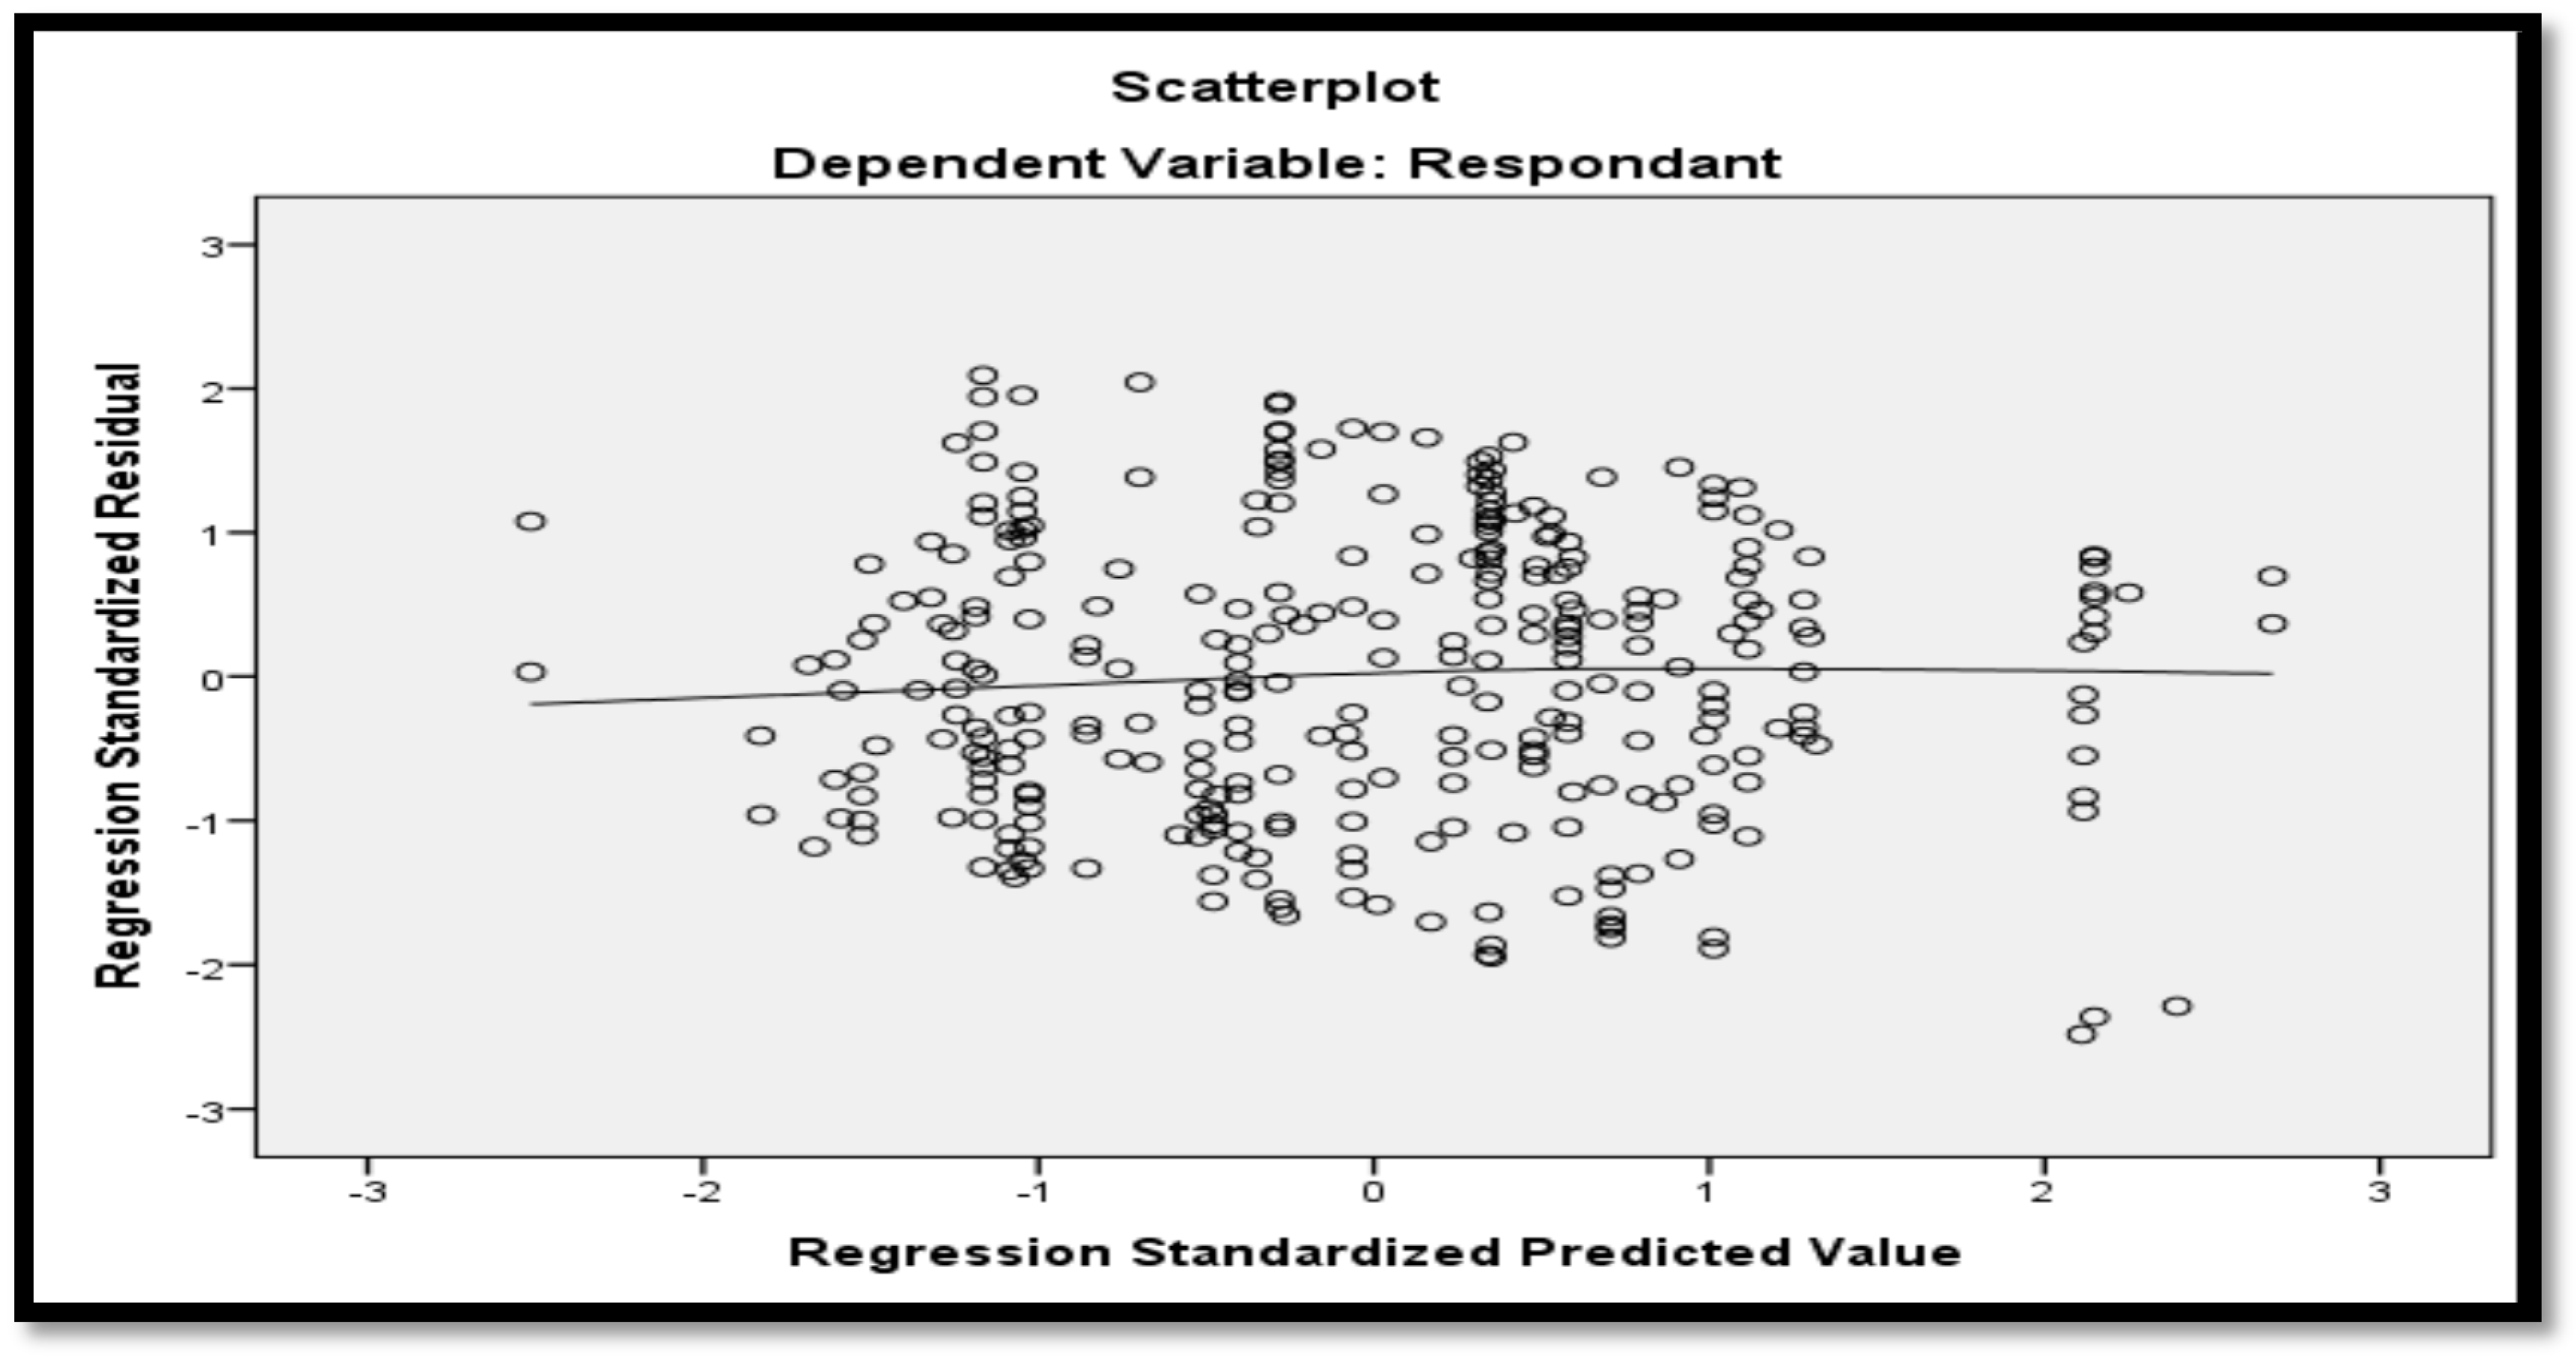
4.1.4. Homoscedasticity
4.1.5. Variance Values
4.1.6. Sample Size Adequacy
4.2. Measure Refinement and Validation
4.2.1. Reliability
4.2.2. Cronbach’s Alpha Reliability
4.2.3. Validity
- Convergent Validity.
- Discriminant Validity.
- Nomological Validity.
Convergent Validity
Discriminant Validity
Nomological Validity
4.2.4. Goodness of Fit (GOF) and Other Indices for Measurement Models
- Absolute Measures that indicate how well the deduced theory fits the observed data.
- Incremental Measures that explains how well a specified model fits relative to some alternative baseline or null model.
- Parsimony Measures that are conceptually similar to R2 as the measure relates model fit to model complexity.
- R2 Value. This measures how close the data fits the regression line. It should have a value higher than 0.25.
- Standardized Value (λ). This provides an indication of the strength of the relationship between variables. Values should be higher than 0.5 if there is a strong relationship.
- ‘T’ Value. This measures the size of the difference relative to the variation in sample data. An acceptable value should be greater than 1.96.
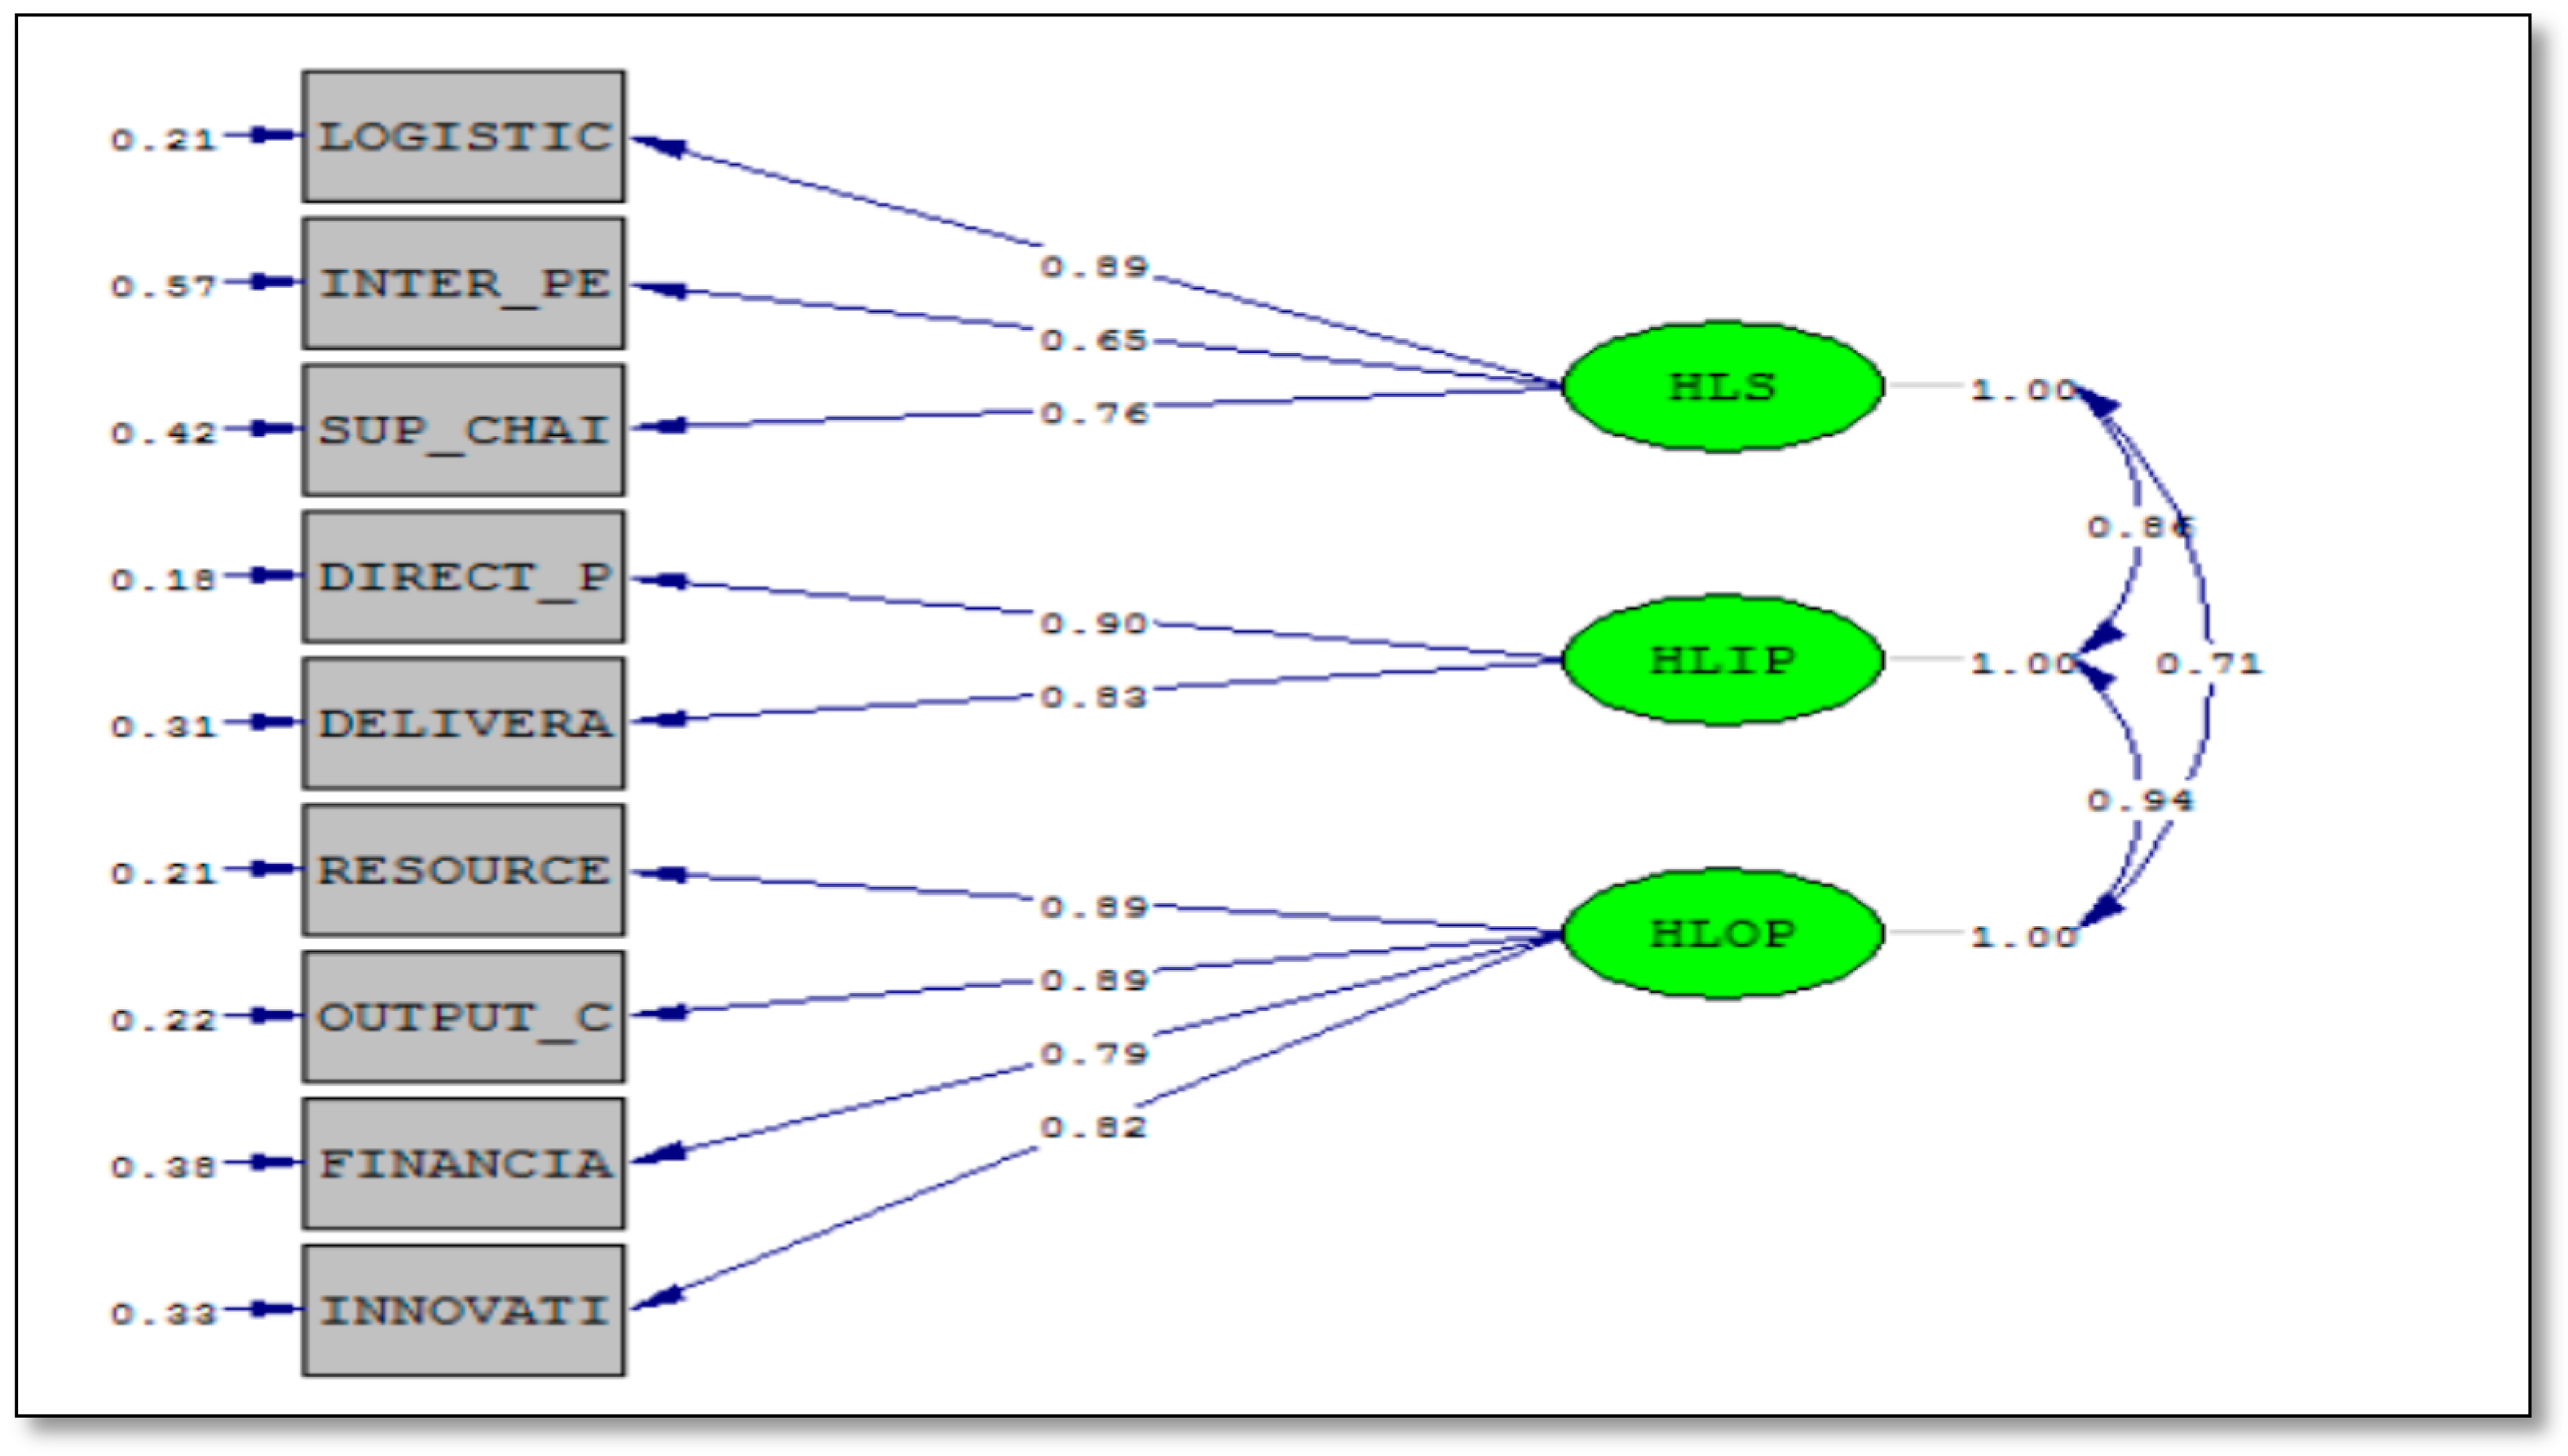
Measurement Model
4.2.5. GOF Measures for the Measurement Model
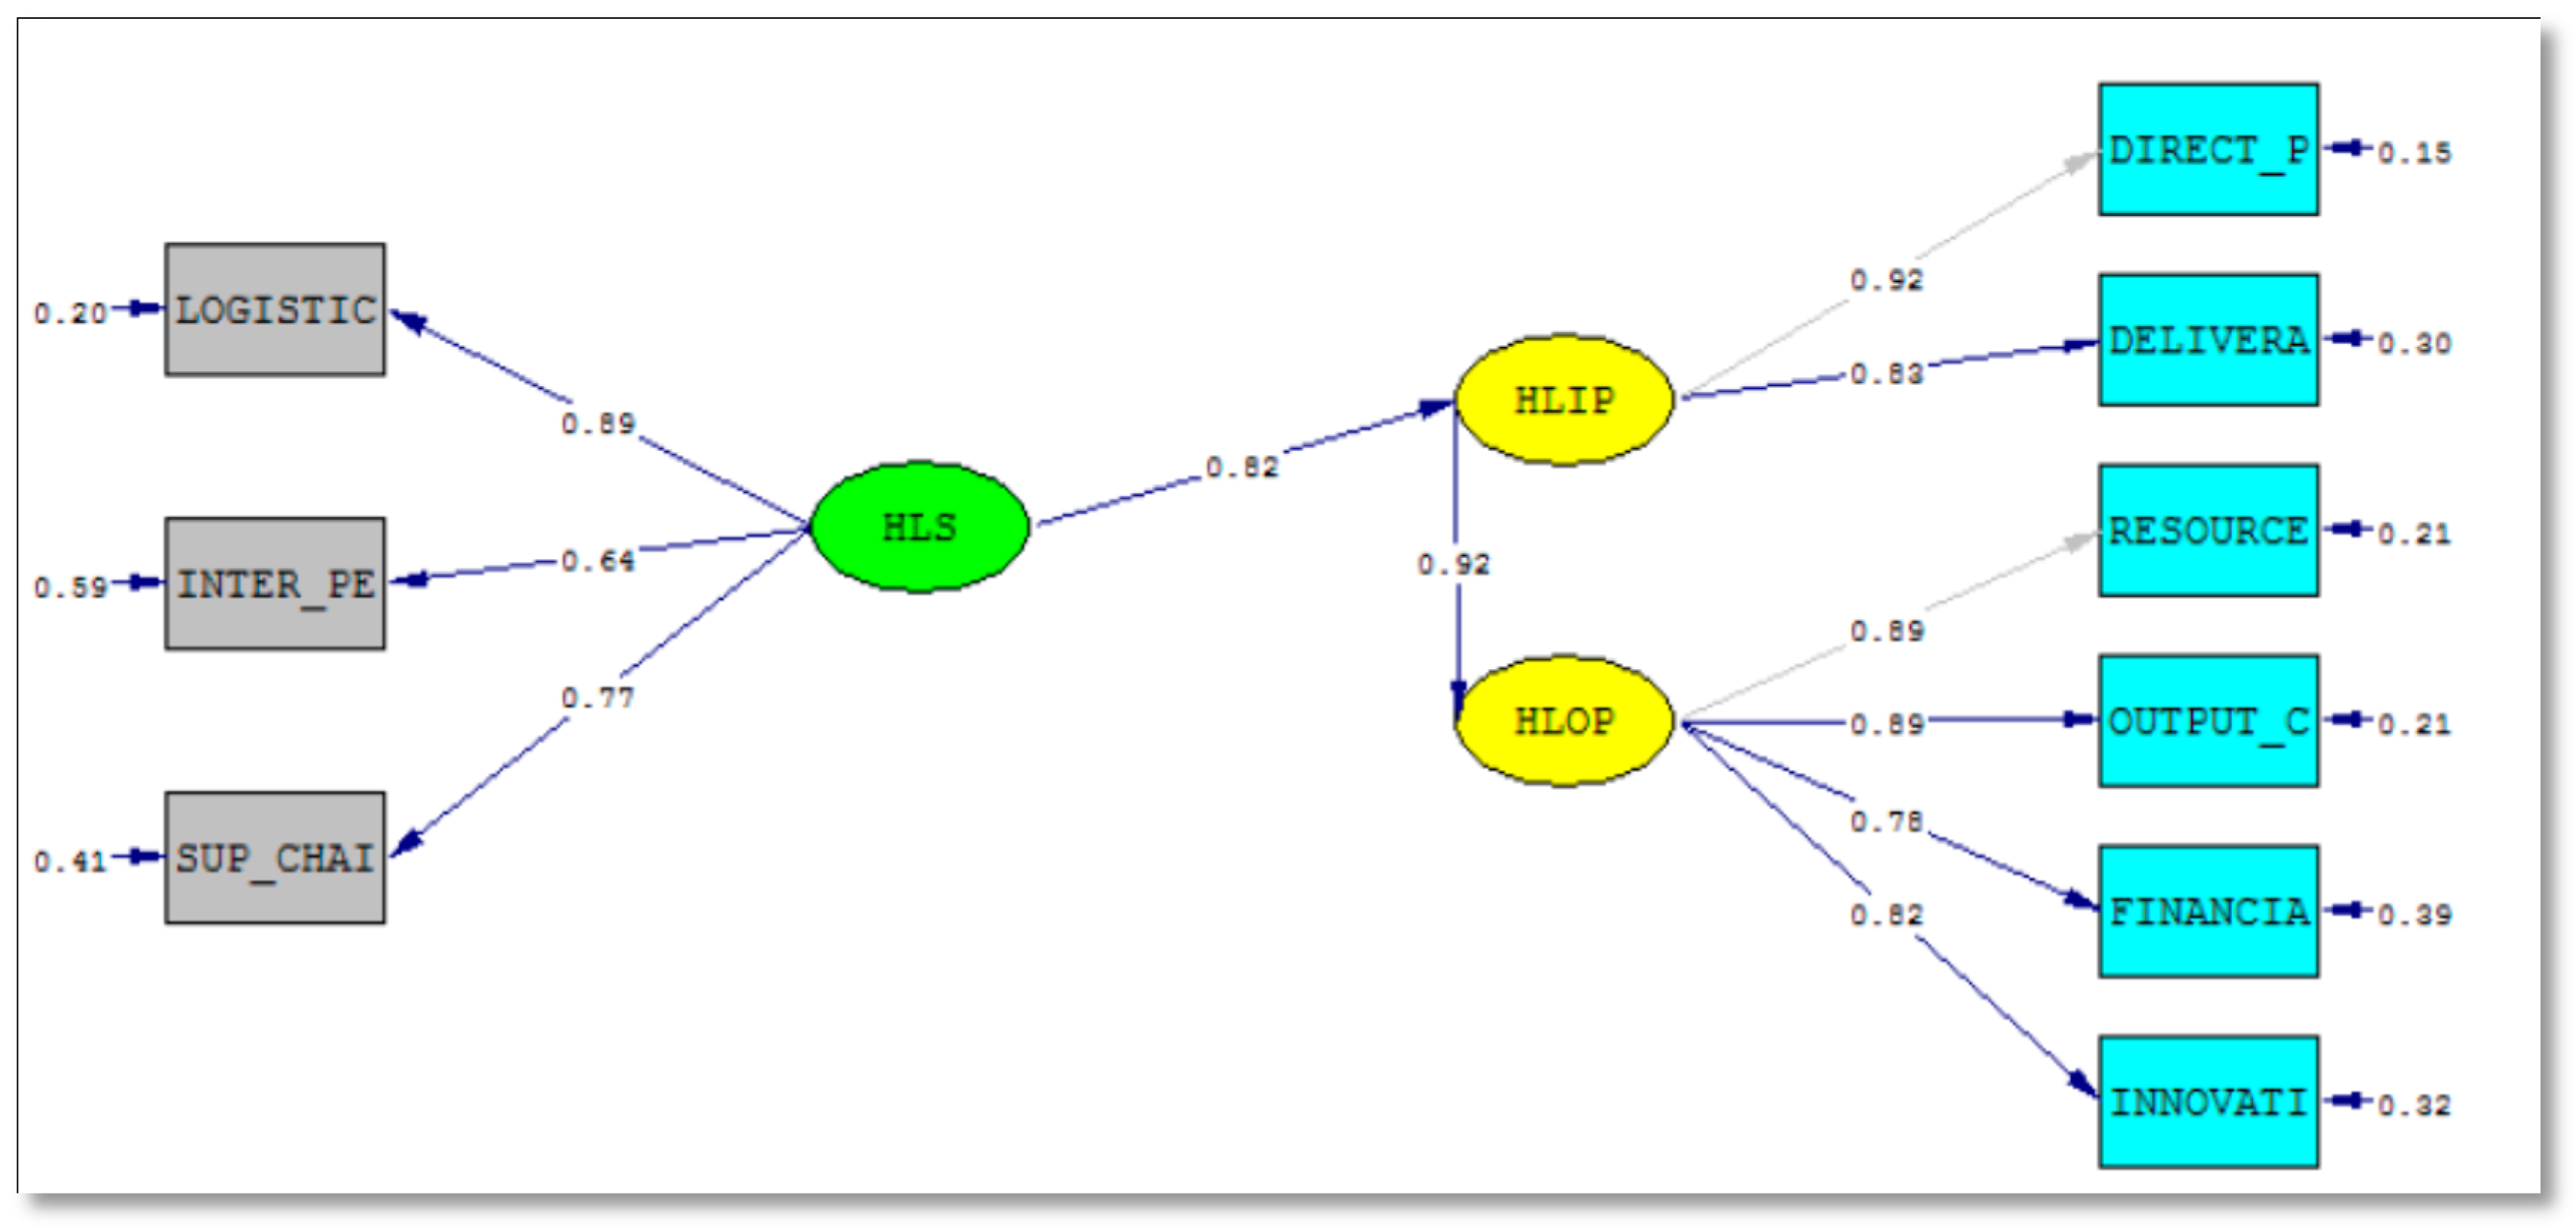
4.3. Structural Model and Hypothesis Testing
- Hypothesis 1 H1: HL Skills (HLS) influence the performance of HL practitioners (HLIP).
- Hypothesis 2 H2: Well performed HL practitioners’ contribute to increase Humanitarian Organisational Performance (HOP).
4.3.1. Parameter Fit of the Structural Model
- Step 1. Examine the parameter estimates to determine whether they have the correct sign (positive or negative). In this study all values do have positive signs. This supports the expectation that there is a positive relationship between each independent and dependent variable.
- Step 2. Examine the Parameter Estimates (Standardized Coefficients) to determine whether they are out of bounds or exceed the expected range of values. When considering the values of each proposition, it was proven that this condition was fulfilled. These are shown in Table 12.
- Step 3. Examine the Parameter Estimates for statistical significance (T or Z-values = parameter estimate divided by standard error of parameter estimate). Tests were carried out on the statistical values generated by the two structural equations of the LISREL output from the Structural Model. The Z values were shown to be equal to the Parameter Estimate divided by the Standard Error of the Parameter Estimates. This is shown in Table 13.
4.3.2. GOF of the Structural Model
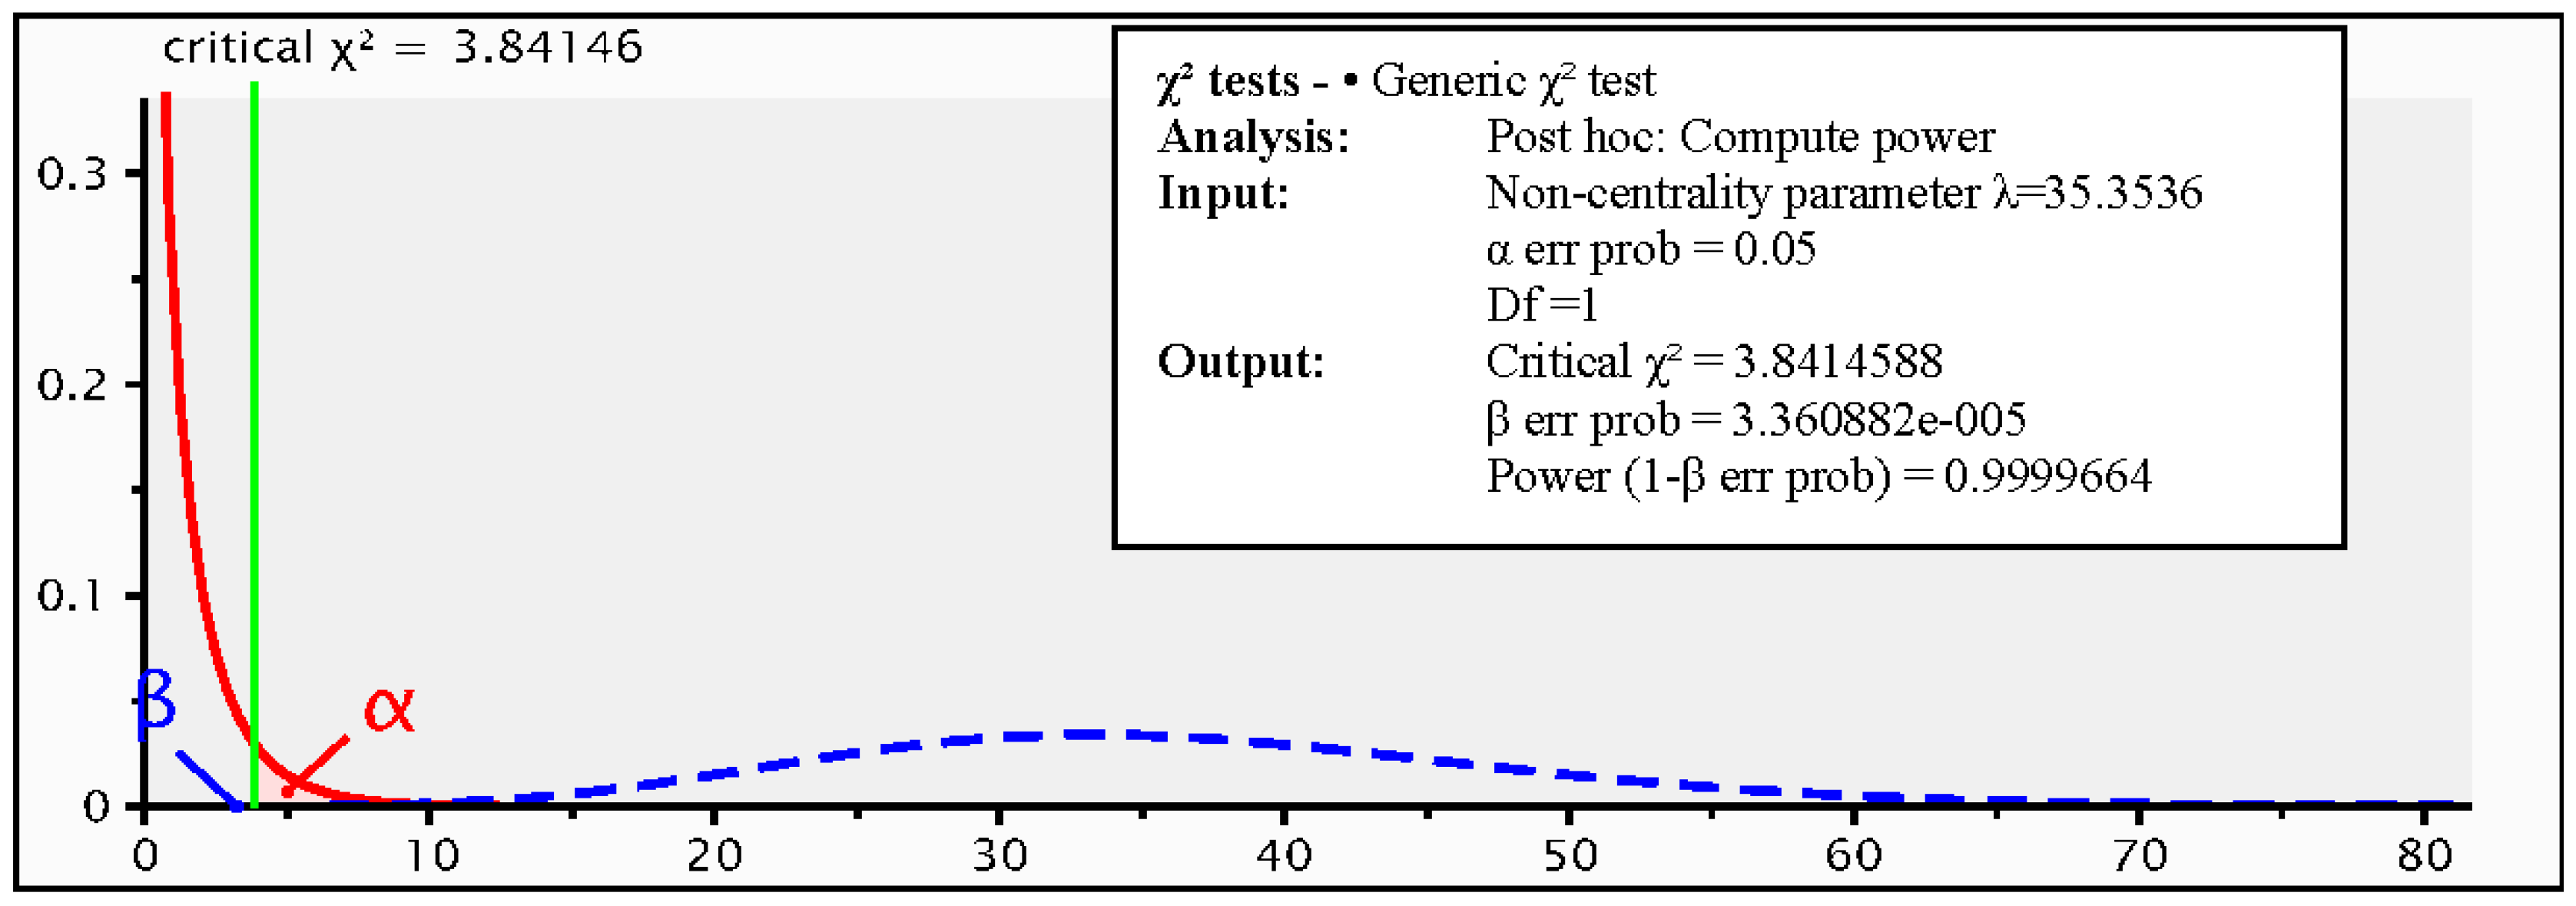
4.4. Power Analysis
5. Results and Discussion
| H1 | - HL Skills Influence the Performance of HL practitioners. |
| H2 | - Performance of HL practitioners Increases the Performance of Humanitarian Organisations. |
6. Conclusions
Acknowledgments
Author Contributions
Conflicts of Interest
References
- Kovács, G.; Spens, K. Identifying challenges in humanitarian logistics. J. Phys. Distrib. Logist. Manag. 2009, 39, 506–528. [Google Scholar] [CrossRef]
- Schulz, S.F.; Heigh, I. Logistics performance management in action within a humanitarian organization. Manag. Res. News 2009, 32, 1038–1049. [Google Scholar] [CrossRef]
- Van Wassenhove, L.N. Humanitarian Aid Logistics: Supply Chain Management in High Gear. J. Oper. Res. Soc. 2006, 57, 475–589. [Google Scholar] [CrossRef]
- Kozlowski, S.; Gully, S.; Brown, F.; Salas, E. Effects of training goals and goal orientation traits on multidimensional training outcomes and performance adaptability. Organ. Behav. Hum. Decis. Process. 2001, 85, 1–31. [Google Scholar] [CrossRef] [PubMed]
- Kovács, G.; Spens, K. Humanitarian Logistics and Supply Chain Management: The start of a new journal. J. Humanit. Logist. Supply Chain Manag. 2011, 1, 5–14. [Google Scholar] [CrossRef]
- De Leeuw, S. Towards a Reference Mission Map for Performance Measurement in Humanitarian Supply Chains; IFIP International Federation for Information Processing: Laxenburg, Austria, 2010. [Google Scholar]
- Fernando, R.; Lalitha, S.; Abeykoon, K. An Analysis of the Effectiveness of Implementing Public Awareness, Education and Training Programmes as a Risk Reduction Strategy in Disaster Management in Sri Lanka. In Strategic Disaster Risk Management in Asia; Springer: New Delhi, India, 2015; pp. 69–86. [Google Scholar]
- Perry, M. Humanitarian Relief Challenges in the Wake of the South Asian Tsunami Disaster; Monash University: Melbourne, Australia, 2006. [Google Scholar]
- Rajakaruna, S.; Wijeratne, A.; Yan, C. Humanitarian Logistics Training Needs: A Systematic Review in Relation to Sri Lankan Humanitarian Sector. In Proceedings of the 13th International Conference in Business Management, University of Sri Jayawardanapura, Colombo, Sri Lanka, 8 December 2016. [Google Scholar]
- Kovács, G.; Tatham, P.H. What is Special About a Humanitarian Logistician? A Survey of Logistic Skills and Performance. Supply Chain Forum Int. J. 2010, 11, 32–41. [Google Scholar]
- Cooper, M.C.; Santosa, J.; Hurst, D.C.; Sander, N.R. Career Patterns of Women in Logistics. 2010. Available online: http://cscmp.org/career/career-patterns.asp (accessed on 20 August 2014).
- Blecken, A.; Hellingrath, B.; Dangelmeier, W.; Schulz, S.F. A humanitarian supply chain process reference model. Int. J. Serv. Technol. Manag. 2009, 12, 391–413. [Google Scholar] [CrossRef]
- Beamon, B.; Balcik, B. Performance measurement in humanitarian relief chains. Int. J. Publ. Sect. Manag. 2008, 21, 4–25. [Google Scholar] [CrossRef]
- Kovács, G.; Tatham, P.; Larson, P.D. What Skills Are Needed to be a Humanitarian Logistician? J. Bus. Logist. 2012, 33, 245–258. [Google Scholar] [CrossRef]
- Fritz. Logistics and the Effective Delivery of Humanitarian Relief; Frtiz Institute: San Francisco, CA, USA, 2005. [Google Scholar]
- Gammelgaard, B.; Larson, P.D. Logistics Skills and Competencies for Supply Chain Management. J. Bus. Logist. 2001, 22, 27–50. [Google Scholar] [CrossRef]
- Gibson, B.J.; Cook, R.L. Hiring Practices in US Third Party Logistics Firms. Int. J. Phys. Distrib. Logist. Manag. 2001, 31, 714–732. [Google Scholar] [CrossRef]
- Collis, D.J.; Montgomery, C.A. Competing on Resources. Harv. Bus. Rev. 1995, 73, 118–128. [Google Scholar]
- André, R. Leading Diverse Management Teams in Logistics. J. Bus. Logist. 1995, 16, 65–84. [Google Scholar]
- Mangan, J.; Christopher, M. Management Development and the Supply Chain Manager of the Future. Int. J. Logist. Manag. 2005, 16, 178–191. [Google Scholar] [CrossRef]
- Rajakaruna, S.; Wijeratne, A.; Mann, T.; Yan, C. Identifying key skill sets in humanitarian logistics: Developing a model for Sri Lanka. Int. J. Disaster Risk Reduct. 2017, 24, 58–65. [Google Scholar] [CrossRef]
- Ellinger, A.E.; Musgrove, C.C.F.; Ellinger, A.D.; Bachrach, D.G.; Baş, A.B.E.; Wang, Y.L. Influences of organisational investments in social capital on service employee commitment and performance. J. Bus. Res. 2013, 66, 1124–1133. [Google Scholar] [CrossRef]
- Barber, A. Recruiting Employees: Individual and Organisational Perspectives; Sage: Thousand Oaks, CA, USA, 1998. [Google Scholar]
- Borman, W.C.; Hanson, M.A.; Oppler, S.H.; Pulakos, E.D.; White, L.A. Role of early supervisory experience in supervisor performance. J. Appl. Psychol. 1993, 78, 443–449. [Google Scholar] [CrossRef]
- Dusterhoff, C.; Cunningham, J.; MacGregor, J. The Effects of Performance Rating, Leader—Member Exchange, Perceived Utility, and Organisational Justice on Performance Appraisal Satisfaction: Applying a Moral Judgment Perspective. J. Bus. Ethics 2014, 119, 265–273. [Google Scholar] [CrossRef]
- A Handbook for Measuring Employee Performance. 2011. Available online: https://www.opm.gov/policy-data-oversight/performance-management/measuring/employee_performance_handbook.pdf (accessed on 12 October 2015).
- Chockalingam, W. Assessment of Individual Job Performance: A Review of the Past Century and a Look Ahead. In Handbook of Industrial, Work and Organisational Psychology; SAGE Publications Ltd.: Thousand Oaks, CA, USA, 2001; Volume 1, pp. 110–126. [Google Scholar]
- Kim, T.; Holzer, M. Public Employees and Performance Appraisal: A Study of Antecedents to Employees’ Perception of the Process. Rev. Public Pers. Adm. 2014, 36, 31–56. [Google Scholar] [CrossRef]
- Mostafa, A.; Gould-Williams, J. Testing the mediation effect of person—Organisation fit on the relationship between high performance HR practices and employee outcomes in the Egyptian public sector. Int. J. Hum. Resour. Manag. 2014, 25, 276–292. [Google Scholar] [CrossRef]
- Yadav, R.; Dabhade, N. Performance management system in Maharatna Companies (a leading public sector undertaking) of India—A case study of B.H.E.L.; Bhopal (M.P.). Int. Lett. Soc. Humanist. Sci. 2013, 4, 49–69. [Google Scholar] [CrossRef]
- Davidson, A. Key Performance Indicators in Humanitarian Logistics. 2006. Available online: http://www.fritzinstitute.org/pdfs/findings/xs_davidson_anne.pdf (accessed on 26 December 2013).
- Abidi, H.; Klumpp, M.; de Leeuw, S. Humanitarian supply chain performance management: A systematic literature review. Supply Chain Manag. Int. J. 2014, 19, 214–221. [Google Scholar] [CrossRef]
- Haavvisto, I. Performance in Humanitarian Supply Chains. Ph.D. Thesis, Hanken School of Economics, Helsinki, Finland, 2014. [Google Scholar]
- Kaplan, R.; Norton, D. The balanced scorecard—Measures that drive performance. Harv. Bus. Rev. 1992, 71–79. [Google Scholar]
- Kunz, N.; Reiner, G. A meta-analysis of humanitarian logistics research. J. Humanit. Logist. Supply Chain Manag. 2012, 2, 116–147. [Google Scholar] [CrossRef]
- Lu, Q.; Goh, M.; De Souza, R. A SCOR framework to measure logistics performance of humanitarian organizations. J. Humanit. Logist. Supply Chain Manag. 2016, 6, 222–239. [Google Scholar] [CrossRef]
- Van der Lan, E.; De Brito, M.; Vergunst, D. Performance measurement in humanitarian supply chains. Int. J. Risk Assess. Manag. 2009, 13, 22–45. [Google Scholar]
- Tatham, P.; Hughes, K. Humanitarian Logistics Metrics: Where We Are, and How We Might Improve. In Humanitarian Logistics: Meeting the Challenge of Preparing for and Responding to Disasters; Christopher, M., Tatham, P., Eds.; Kogan Page: London, UK, 2011; pp. 65–84. [Google Scholar]
- Hair, J.; Barry, W.; Rolph, B. Multivariate Data Analysis; Prentice Hall: New York, NY, USA, 2010. [Google Scholar]
- Afzalur, R.M.; Antonioni, D.; Psenicka, C. A structural equations model of leader power, subordinates’styles of handling conflict, and job performance. Int. J. Confl. Manag. 2001, 12, 191–211. [Google Scholar] [CrossRef]
- Hazen, B.; Overstreet, R.; Boone, C. Suggested reporting guidelines for structural equation modeling in supply chain management research. Int. J. Logist. Manag. 2015, 26, 627–641. [Google Scholar] [CrossRef]
- Medsker, J.; Williams, J. A Review of Current Practices for Evaluating Causal Models in Organisational Behavior and Human Resources Management Research. J. Manag. 1994, 20, 439–464. [Google Scholar]
- Aragón, M.; Jiménez, D.; Valle, R. Training and performance: The mediating role of organisational learning. BRQ Bus. Res. Q. 2014, 17, 161–173. [Google Scholar] [CrossRef]
- Wisner, J. A structural equation model of supply chain management strategies and firm performance. J. Bus. Logist. 2003, 24, 1–26. [Google Scholar] [CrossRef]
- Venkatraman, N.; Ramanujam, V. Measurement of Business Performance in Strategy Research: A Comparison of Approaches. Acad. Manag. Rev. 1986, 11, 801–814. [Google Scholar]
- Morris, S.; Daisley, R.; Wheeler, M.; Boyer, P. A meta-analysis of the relationship between individual assessments and job performance. J. Appl. Psychol. 2015, 100, 5. [Google Scholar] [CrossRef] [PubMed]
- Sekaran, U. Research Methods for Business; John Wiley & Sons Inc.: New Delihi, India, 2007. [Google Scholar]
- Moser, C.; Kalton, G. Survey Methods in Social Investigation, 2nd ed.; Gower Publishing Company Limited: Aldershot, UK, 1979. [Google Scholar]
- Allison, P. Missing Data; University of Pennsylvania; Sage: Thousand Oaks, CA, USA, 2001. [Google Scholar]
- Marina, S. Dealing with Missing Data: Key Assumptions and Methods for Applied Analysis; Boston Unversity: Boston, MA, USA, 2013. [Google Scholar]
- Soper, D. A-priori Sample Size for Structural Equation Models. 2016. Available online: http://www.danielsoper.com/statcalc/calculator.aspx?id=89 (accessed on 22 June 2017).
- Anderson, J.; Gerbing, D. Structural equation modeling in practice: A review and recommended two-step approach. Psychol. Bull. 1988, 103, 411–423. [Google Scholar] [CrossRef]
- Schumacker, R.; Lomax, R. A Beginner’s Guide to Structural Equation Modeling, 3rd ed.; Routledge: London, UK, 2010. [Google Scholar]
- Korchia, M. AVE CR Calculator. 2010. Available online: http://www.watoowatoo.net/sem/sem.html (accessed on 24 June 2017).
- Saris, W.; Satorra, A. Power evaluation in structural equation models. In Testing Structural Equation Models; Bollen, K.A., Long, J.S., Eds.; Sage: Newbury Park, CA, USA, 1993; pp. 181–204. [Google Scholar]


| Performance Objective | Author |
|---|---|
| Flexibility | Beamon and Balcik [13]; Lu et al. [36] |
| Cost | Blecken et al. [12]; Lu et al. [36] |
| Resource efficiency | Beamon and Balcik [13]; Blecken et al. [12] ; Lu et al. [36] |
| Output | Beamon and Balcik [13]; Blecken et al. [12] |
| Service level of customer/beneficiary/donor | Schulz and Heigh [2]; van der Laan et al. [37] ; de Leeuw [6] |
| Financial control and efficiency | Davidson [31]; Schulz and Heigh [2]; de Leeuw [6]; Lu et al. [36] |
| Coverage and equity | Davidson [31]; Lu et al. [36] |
| Innovation and learning | Schulz and Heigh [2]; de Leeuw [6] |
| Utilisation | Blecken et al. [12] |
| Quality of life and well-being of Aid recipients | Tatham and Hughes [38] |
| Process adherence | Schulz and Heigh [2]; Lu et al. [36] |
| Donation to delivery time | Davidson [31]; Blecken et al. [12]; Lu et al. [36] |
| Questionnaire Distribution | |
|---|---|
| E-mailed | 212 |
| Hand-delivered | 80 |
| Posted/Faxed | 120 |
| Through Survey Monkey website | 88 |
| Total | 500 |
| Model | Collinearity Statistics | |
|---|---|---|
| Tolerance | VIF | |
| Logistics Mgt | 0.324 | 3.091 |
| Inter Personnel | 0.440 | 2.275 |
| Sup Chain Coordination | 0.278 | 3.598 |
| Disaster Mgt | 0.696 | 1.438 |
| Direct Performance | 0.190 | 5.252 |
| Deliverables Expected | 0.227 | 4.410 |
| Resource Utilisation | 0.202 | 4.946 |
| Output Customer Service | 0.257 | 3.887 |
| Financial Control | 0.328 | 3.047 |
| Innovation Learning | 0.215 | 4.649 |
| Measured Variable | N | Variance |
|---|---|---|
| Logistics Mgt | 318 | 1.273 |
| Inter Personnel | 318 | 1.017 |
| Sup Chain Coordination | 318 | 1.914 |
| Disaster Mgt | 317 | 0.795 |
| Direct Performance | 318 | 1.707 |
| Deliverables Expected | 318 | 1.362 |
| Resource Utilisation | 318 | 1.693 |
| Output Customer Service | 318 | 1.870 |
| Financial Control | 318 | 1.518 |
| Innovation Learning | 318 | 1.504 |
| Item | Value |
|---|---|
| Effect size | 0.03 |
| Desired Statistical Power level | 0.8 |
| Number of Latent Variables | 3 |
| Number of Observed Variables | 10 |
| Probability Level | 0.05 |
| Therefore, the sample size is, | |
| Minimum sample size to detect effect | 119 |
| Minimum sample size for model structure | 156 |
| Recommended minimum sample size | 156 |
| Observed Sample size | 318 |
| Variable | Items | Corrected Item Total Correlation | Cronbach’s Alpha if Item Deleted | Cronbach’s Alpha |
|---|---|---|---|---|
| HL Skills | Logistics Management Skills | 0.677 | 0.570 | 0.729 |
| Interpersonal Skills | 0.617 | 0.618 | ||
| Supply Chain Coordination Skills | 0.613 | 0.616 | ||
| Disaster Management Skills | 0.223 | 0.802 | ||
| HL practitioners’ Individual Performance | Direct Performance | 0.754 | 0.614 | 0.856 |
| Deliverables | 0.758 | 0.624 | ||
| Humanitarian Organisational Performance | Resource Utilisation | 0.854 | 0.856 | 0.907 |
| Output and Customer Service | 0.835 | 0.863 | ||
| Financial Control | 0.729 | 0.900 | ||
| Innovation & Learning | 0.745 | 0.895 |
| Valuator | HLS | HLIP | HLOP |
|---|---|---|---|
| AVE (Value > 0.5) | 0.597 | 0.749 | 0.720 |
| CR (Value > 0.7) | 0.814 | 0.857 | 0.911 |
| Convergent Validity | Established | Established | Established |
| Construct | Correlation | Squared Correlation | AVE > Squared Correlation | Discriminant Validity |
|---|---|---|---|---|
| HLS-Logistics | 0.794 | 0.630 | 0.792 | Established |
| HLS-Inter Personal | 0.429 | 0.184 | 0.423 | Established |
| HLS-Supply Chain | 0.583 | 0.339 | 0.578 | Established |
| HLIP-Direct Per | 0.819 | 0.670 | 0.810 | Established |
| HLIP-Deliverables | 0.694 | 0.481 | 0.689 | Established |
| HLOP-Resource | 0.792 | 0.627 | 0.792 | Established |
| HLOP-Output | 0.784 | 0.614 | 0.792 | Established |
| HLOP-Finance | 0.622 | 0.386 | 0.624 | Established |
| HLOP-Innovation | 0.669 | 0.447 | 0.672 | Established |
| Categories | Model Fit Criteria | Acceptable Level |
|---|---|---|
| Absolute measures | Chi-square | Tabled χ2 value |
| Goodness-of-fit index (GFI) | 0 (no fit) to 1 (perfect fit) | |
| Root-mean-square error of approximation (RMSEA) | Value of 0.05 to 0.08 indicate close fit | |
| Adjusted GFI (AGFI) | 0 (no fit) to 1 (perfect fit) | |
| Incremental measures | Normed fit index (NFI) | 0 (no fit) to 1 (perfect fit) |
| Non-Normed fit index (NNFI) | 0 (no fit) to 1 (perfect fit) | |
| Comparative Fit Index (CFI) | 0 (no fit) to 1 (perfect fit) | |
| Parsimony measures | Parsimony Normed fit index (PNFI) | 0 (no fit) to 1 (perfect fit) |
| Parsimony Goodness of fit index (PGFI) | 0 (no fit) to 1 (perfect fit) |
| Relationships | Threshold Values for Parameter Estimates | |||
|---|---|---|---|---|
| Standardized Values (λ) | t-Statistic | R2 | p | |
| Requirement | Greater Than (>) 0.5 | Greater Than (>) 1.96 | Greater Than (>) 0.25 | Less Than (<) 0.05 |
| HLS-Logistics | 0.890 | 19.02 | 0.794 | 0.000 |
| HLS-Inter Personal | 0.650 | 12.46 | 0.429 | 0.000 |
| HLS-Supply Chain | 0.760 | 15.29 | 0.583 | 0.000 |
| HLIP-Direct Performance | 0.900 | 20.37 | 0.819 | 0.000 |
| HLIP-Deliverables | 0.830 | 17.95 | 0.694 | 0.000 |
| HLOP-Resource | 0.890 | 19.99 | 0.792 | 0.000 |
| HLOP-Output | 0.890 | 19.83 | 0.784 | 0.000 |
| HLOP-Finance | 0.790 | 16.53 | 0.622 | 0.000 |
| HLOP-Innovation | 0.820 | 17.47 | 0.669 | 0.000 |
| Absolute Measures | Incremental Measures | Parsimony Measures | |||||
|---|---|---|---|---|---|---|---|
| GFI | RMSEA | AGFI | NFI | NNFI | CFI | PNFI | PGFI |
| 0.827 | 0.052 | 0.676 | 0.852 | 0.790 | 0.860 | 0.568 | 0.441 |
| Relationship | Threshold Values for Parameter Estimates | |||
|---|---|---|---|---|
| Standardized Values (λ) | t-Statistic | R2 | p | |
| Greater than (>) 0.5 | Greater than (>) 1.96 | Greater than (>) 0.25. | Less than (<) 0.05 | |
| HLS-HLIP | 0.82 | 15.31 | 0.676 | 0.000 |
| HLIP-HLOP | 0.92 | 20.05 | 0.841 | 0.000 |
| Relationships | Parameter Estimate | Standard Error | Parameter Estimate/Standard Error | Z Value | p Value | Statistical Significance |
|---|---|---|---|---|---|---|
| HLS-HLIP | 0.822 | 0.0537 | 15.30726 | 15.308 | 0.000 | Established |
| HLIP-HLOP | 0.917 | 0.0457 | 20.05364 | 20.053 | 0.000 | Established |
| Absolute Measures | Incremental Measures | Parsimony Measures | |||||
|---|---|---|---|---|---|---|---|
| GFI | RMSEA | AGFI | NFI | NNFI | CFI | PNFI | PGFI |
| 0.817 | 0.052 | 0.671 | 0.847 | 0.791 | 0.855 | 0.588 | 0.454 |
© 2017 by the authors. Licensee MDPI, Basel, Switzerland. This article is an open access article distributed under the terms and conditions of the Creative Commons Attribution (CC BY) license (http://creativecommons.org/licenses/by/4.0/).
Share and Cite
Rajakaruna, S.; Wijeratne, A.W.; Mann, T.; Yan, C. Effect of Individual Skills and Performance on Humanitarian Organisations: A Structural Equation Model. Logistics 2017, 1, 7. https://doi.org/10.3390/logistics1010007
Rajakaruna S, Wijeratne AW, Mann T, Yan C. Effect of Individual Skills and Performance on Humanitarian Organisations: A Structural Equation Model. Logistics. 2017; 1(1):7. https://doi.org/10.3390/logistics1010007
Chicago/Turabian StyleRajakaruna, Shanaka, Alge Wattage Wijeratne, Tim Mann, and Chen Yan. 2017. "Effect of Individual Skills and Performance on Humanitarian Organisations: A Structural Equation Model" Logistics 1, no. 1: 7. https://doi.org/10.3390/logistics1010007
APA StyleRajakaruna, S., Wijeratne, A. W., Mann, T., & Yan, C. (2017). Effect of Individual Skills and Performance on Humanitarian Organisations: A Structural Equation Model. Logistics, 1(1), 7. https://doi.org/10.3390/logistics1010007