
Er:YAG Laser in QSP Modality for Treatment of Indirect Adhesive Restoration Build-Up: Surface Roughness Analysis and Morphology Assessment by Environmental Scanning Electron Microscopy (ESEM)

 ,
,  ,
,  ,
, 
Abstract

1. Introduction
2. Materials and Methods
- −
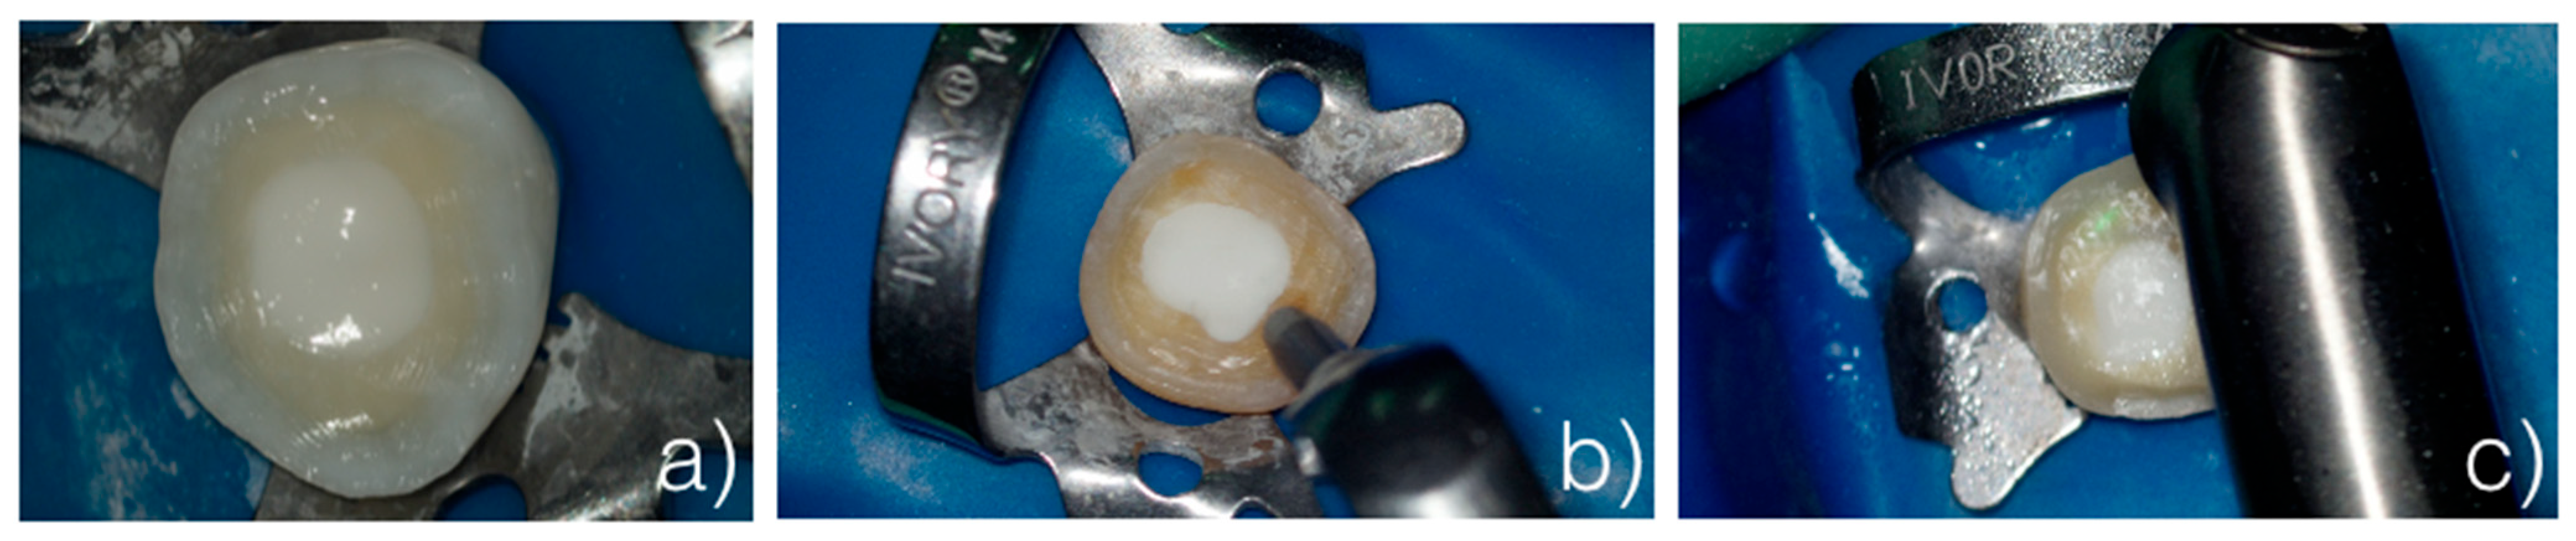
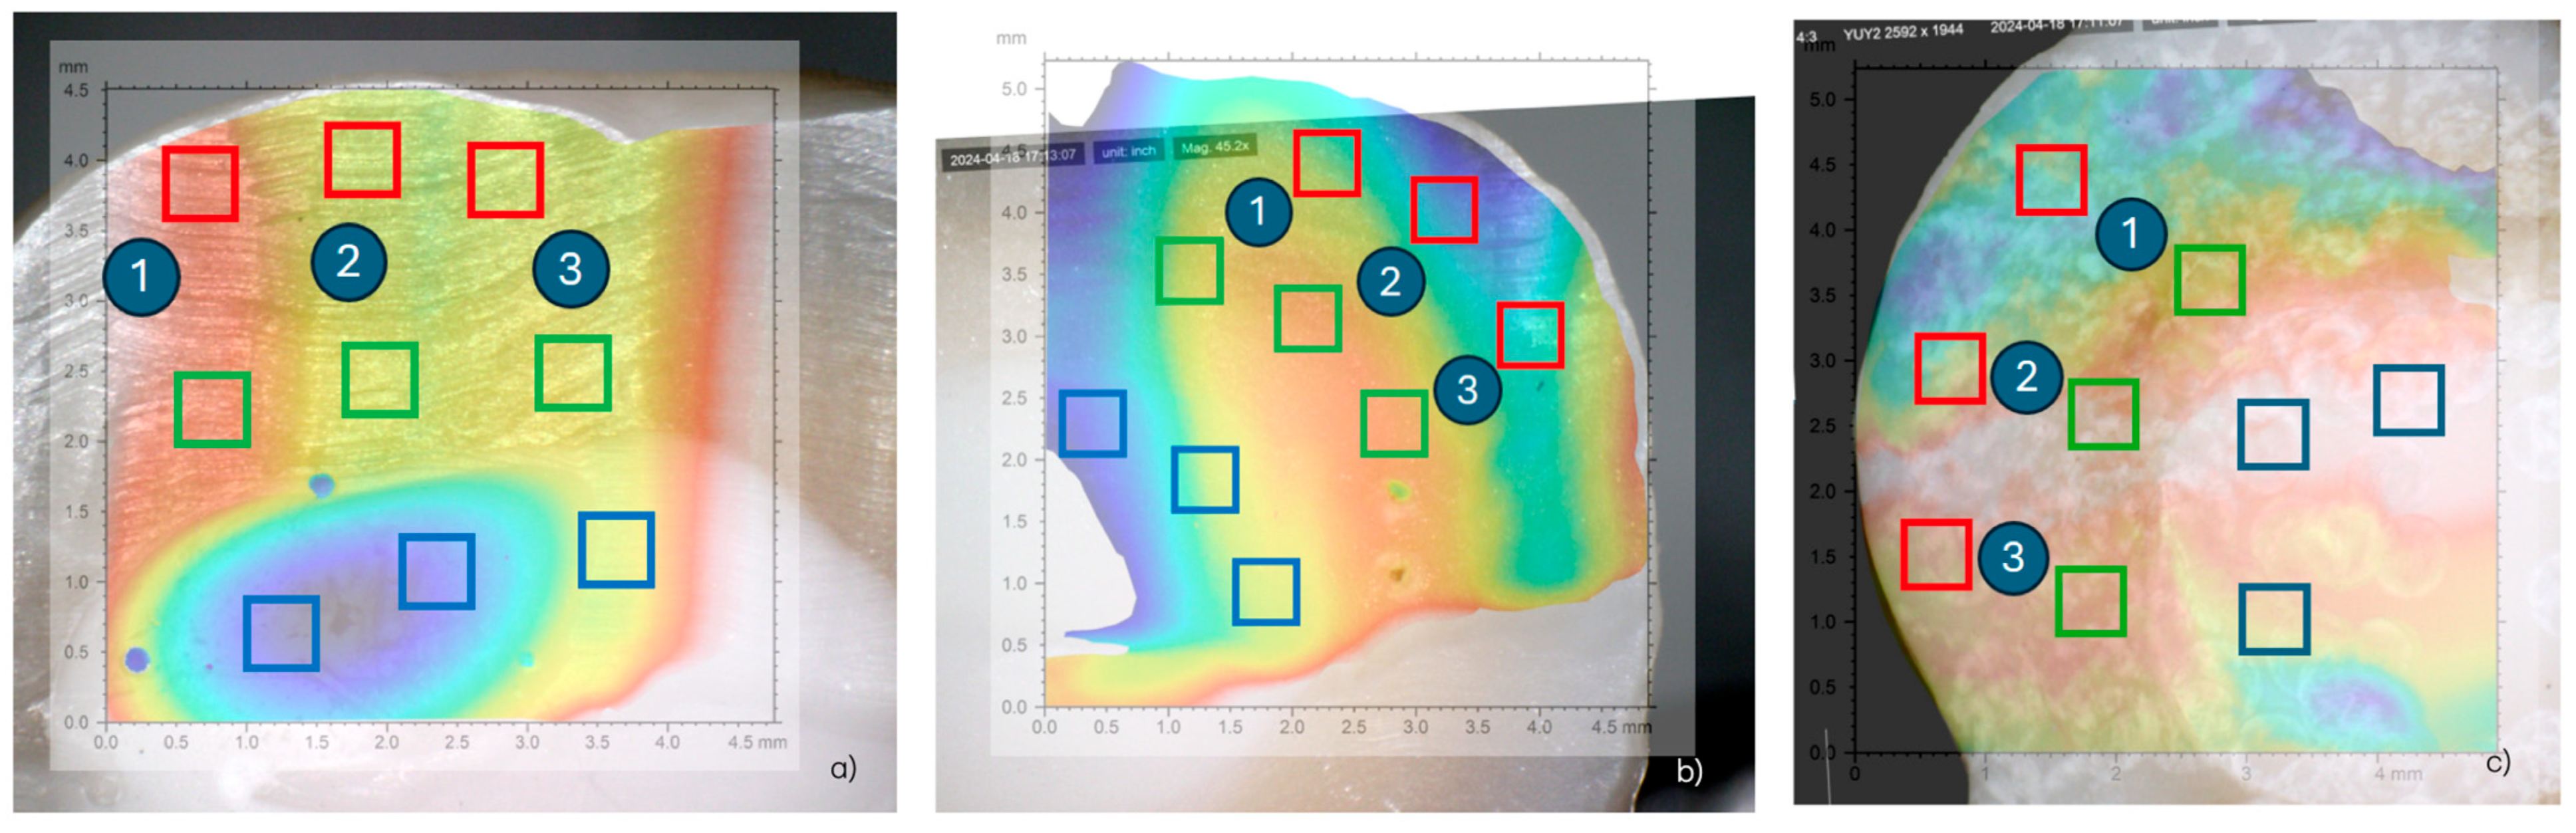
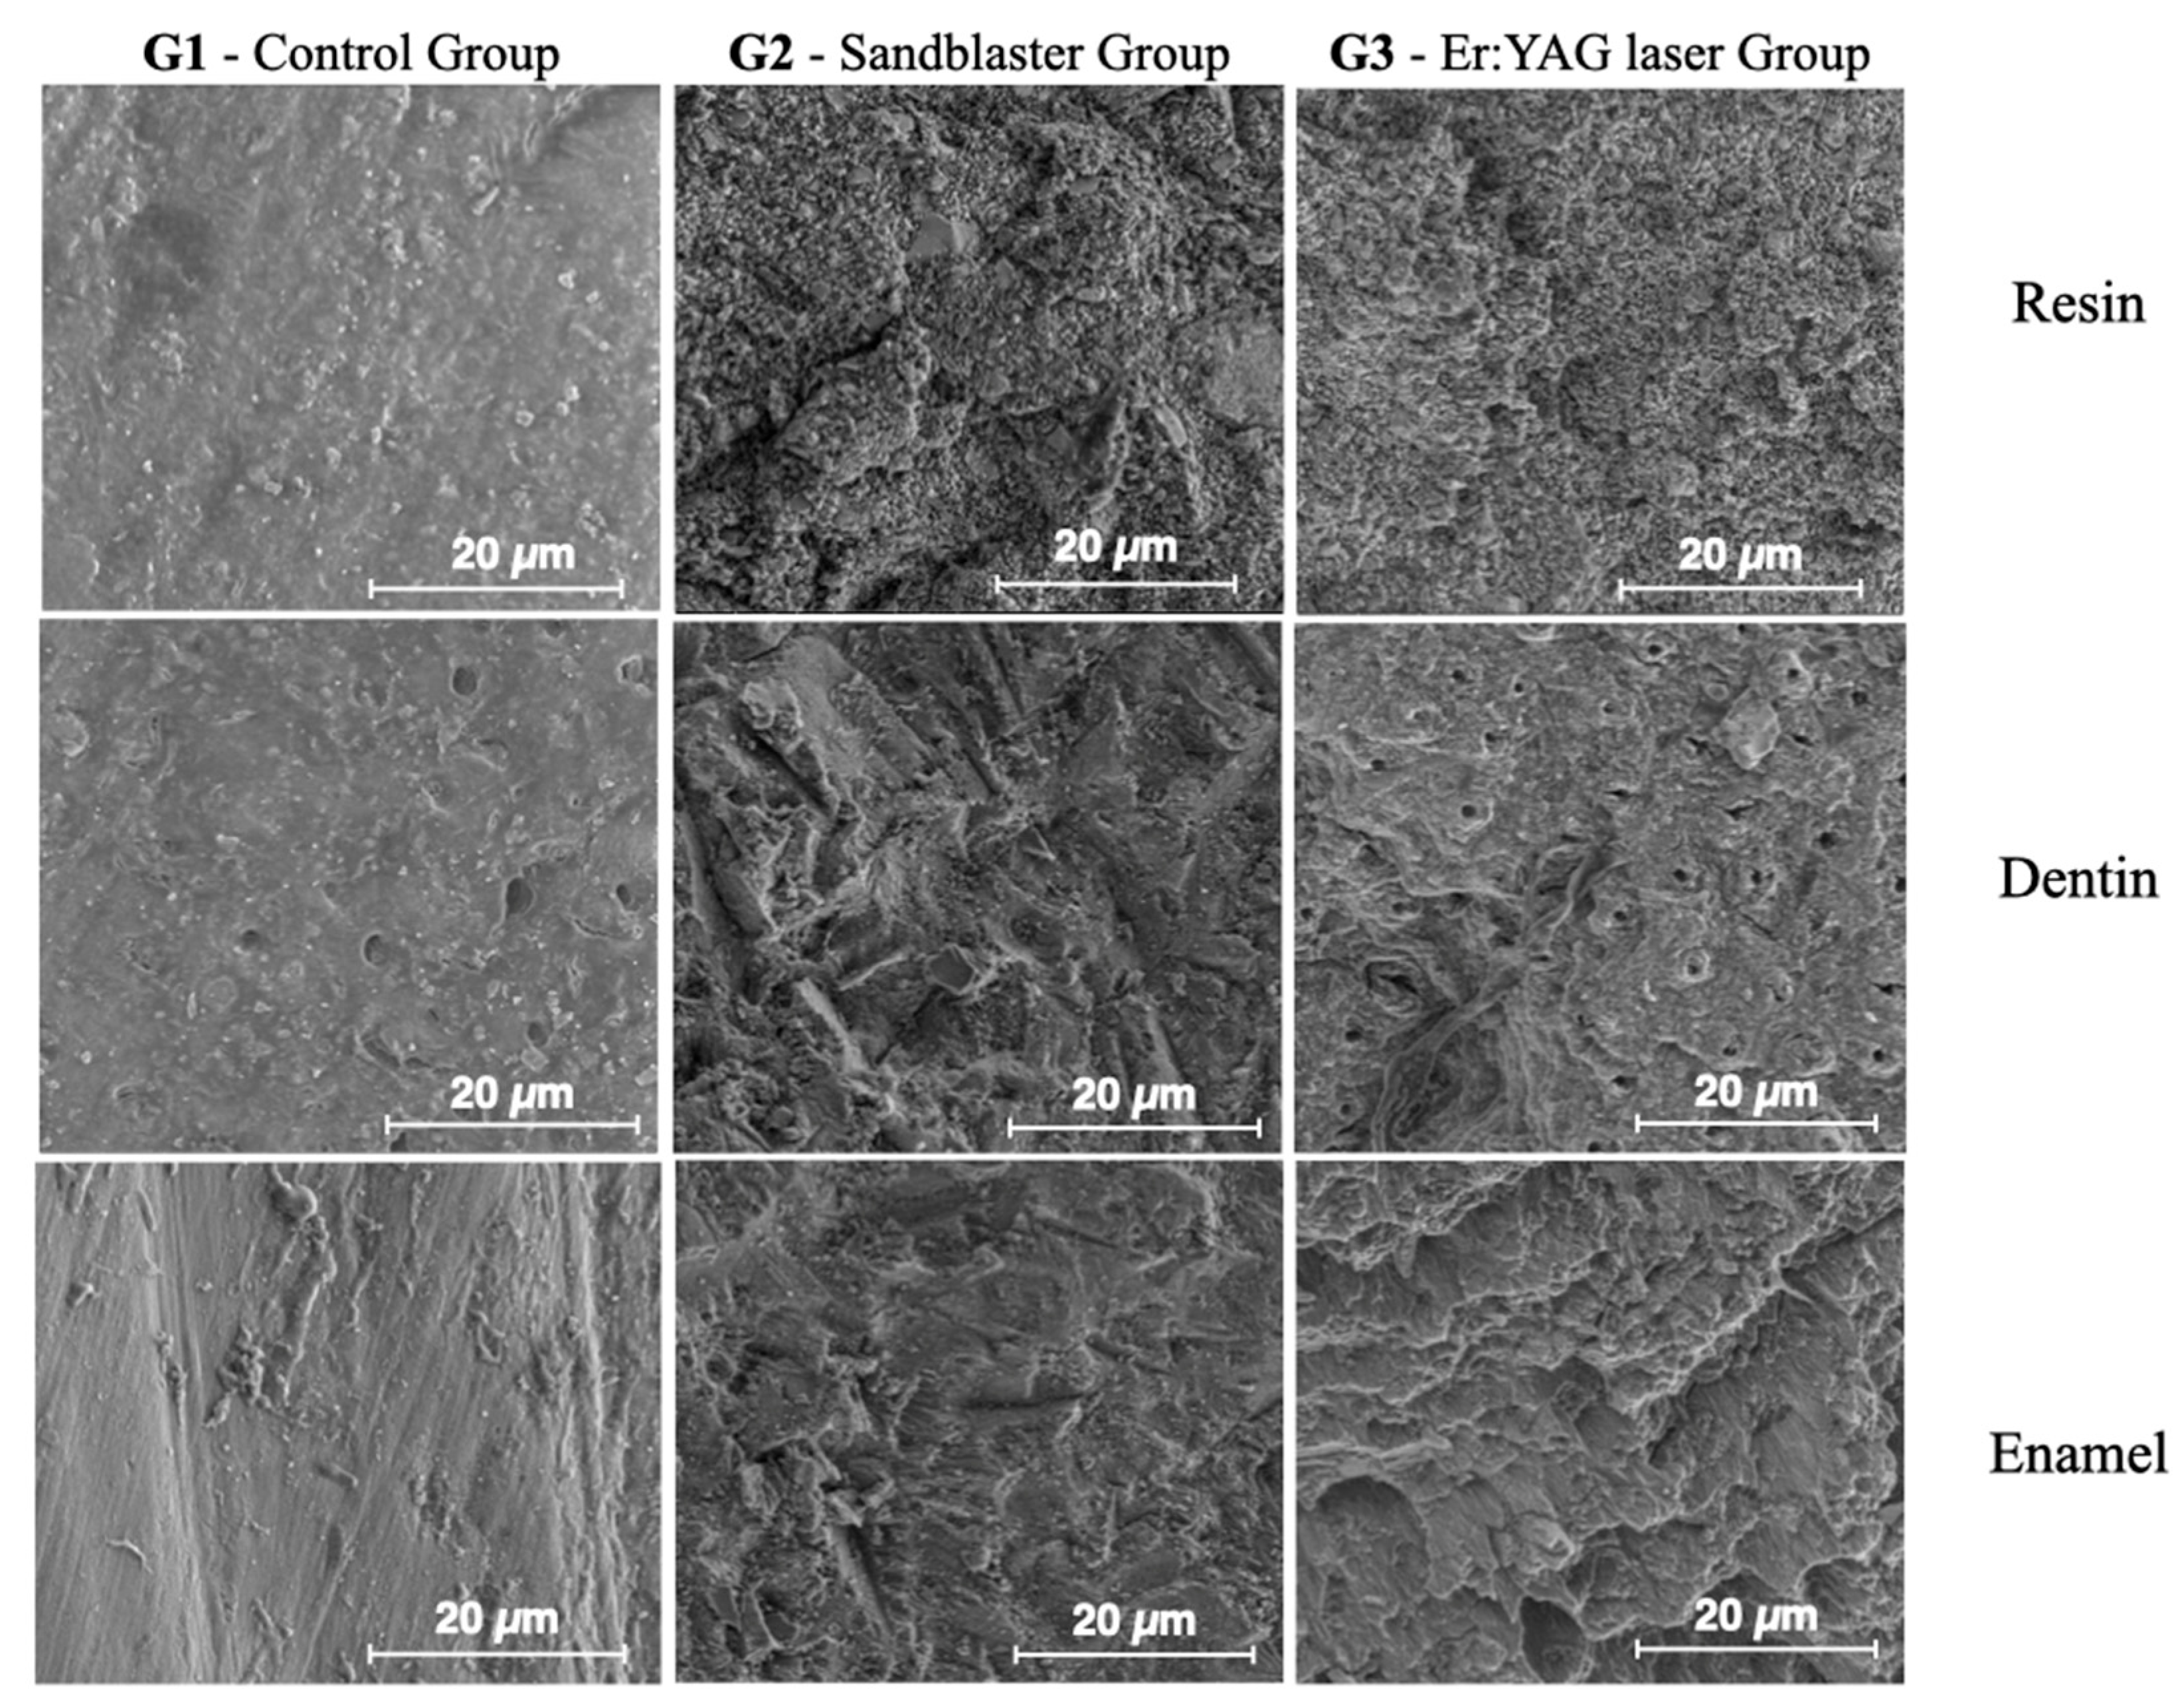
- Control group (G1): The samples were only prepared with burs and not sandblasted (Figure 1a).
- −
- Sandblaster group (G2): After preparation with burs, the surfaces were treated with an intraoral sandblaster (Microetcher CD, Kavo, Biberach, Germany), 2.5 bar pressure, approximately 10 mm from the surface—aluminum oxide (Al2O3, mean particle size 30 μm) powder—for 10 s (Figure 1b).
- −
- Er:YAG laser group (G3): After preparation with burs, the surfaces were treated with an Er:YAG laser (Fotona LighWalker®, Ljubljana, Slovenia), in QSP mode—power: 1 W; frequency: 10 Hz; energy: 100 mJ (Figure 1c).
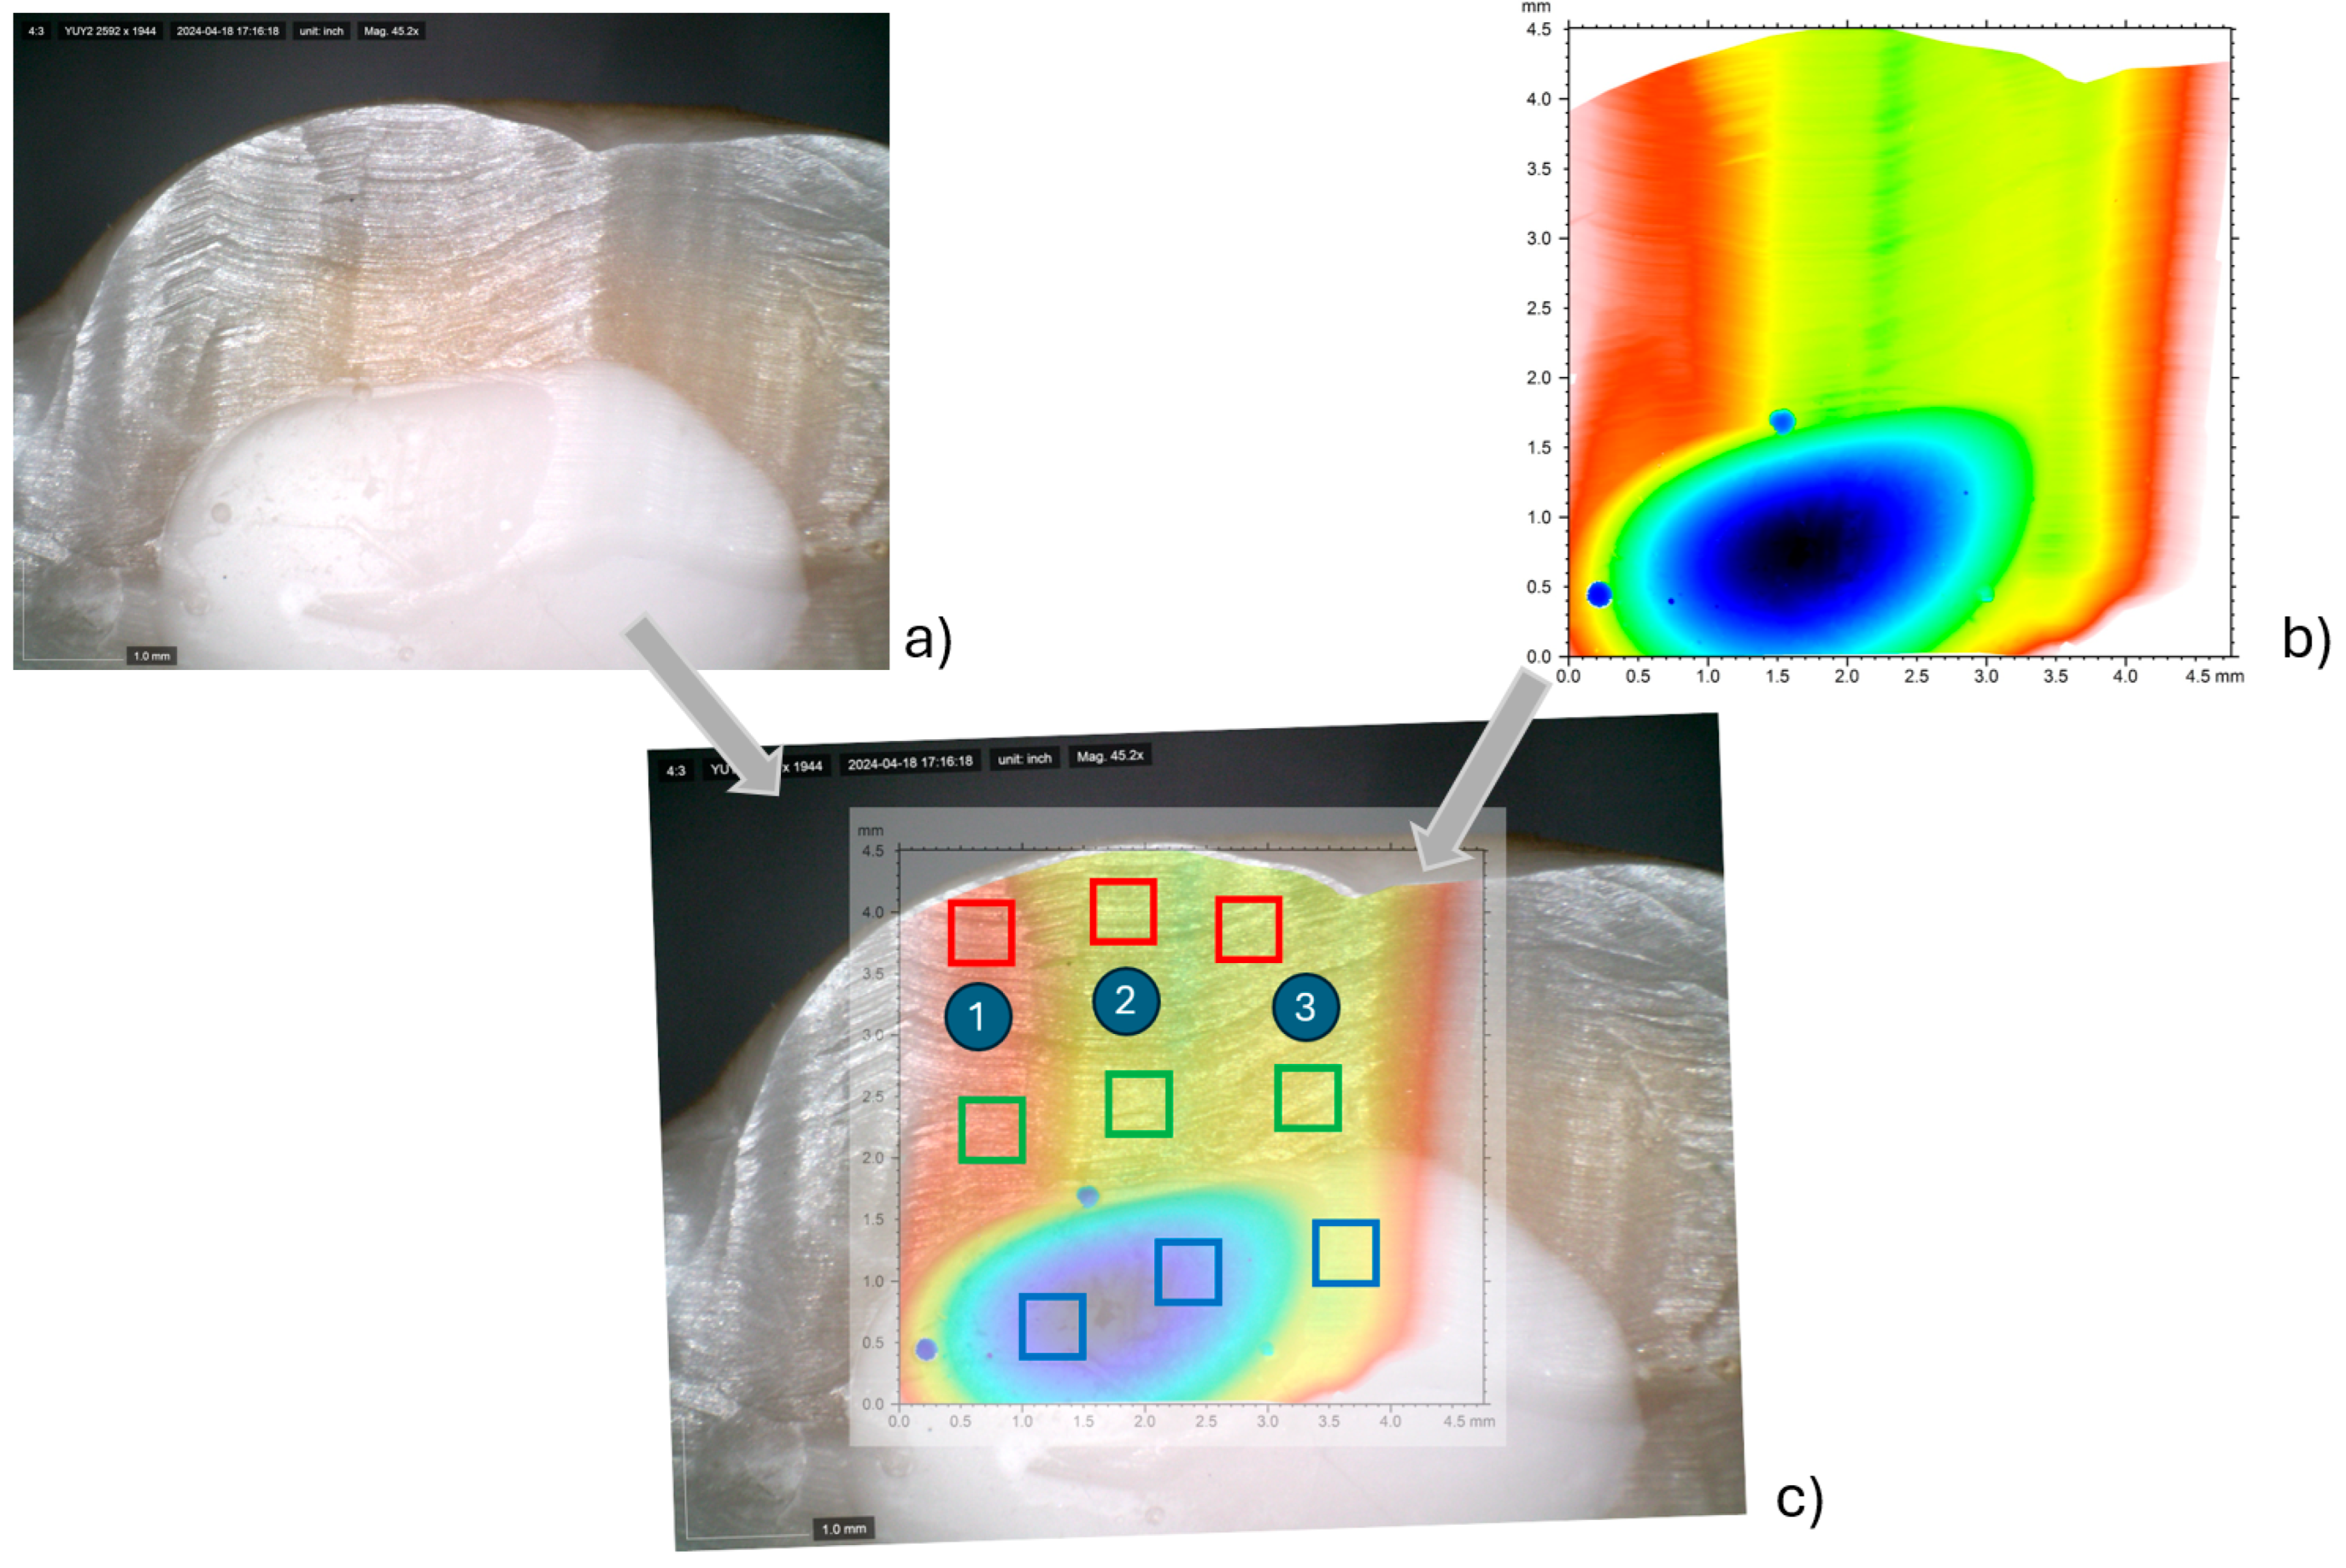
2.1. Surface Roughness Analysis
Statistical Evaluation
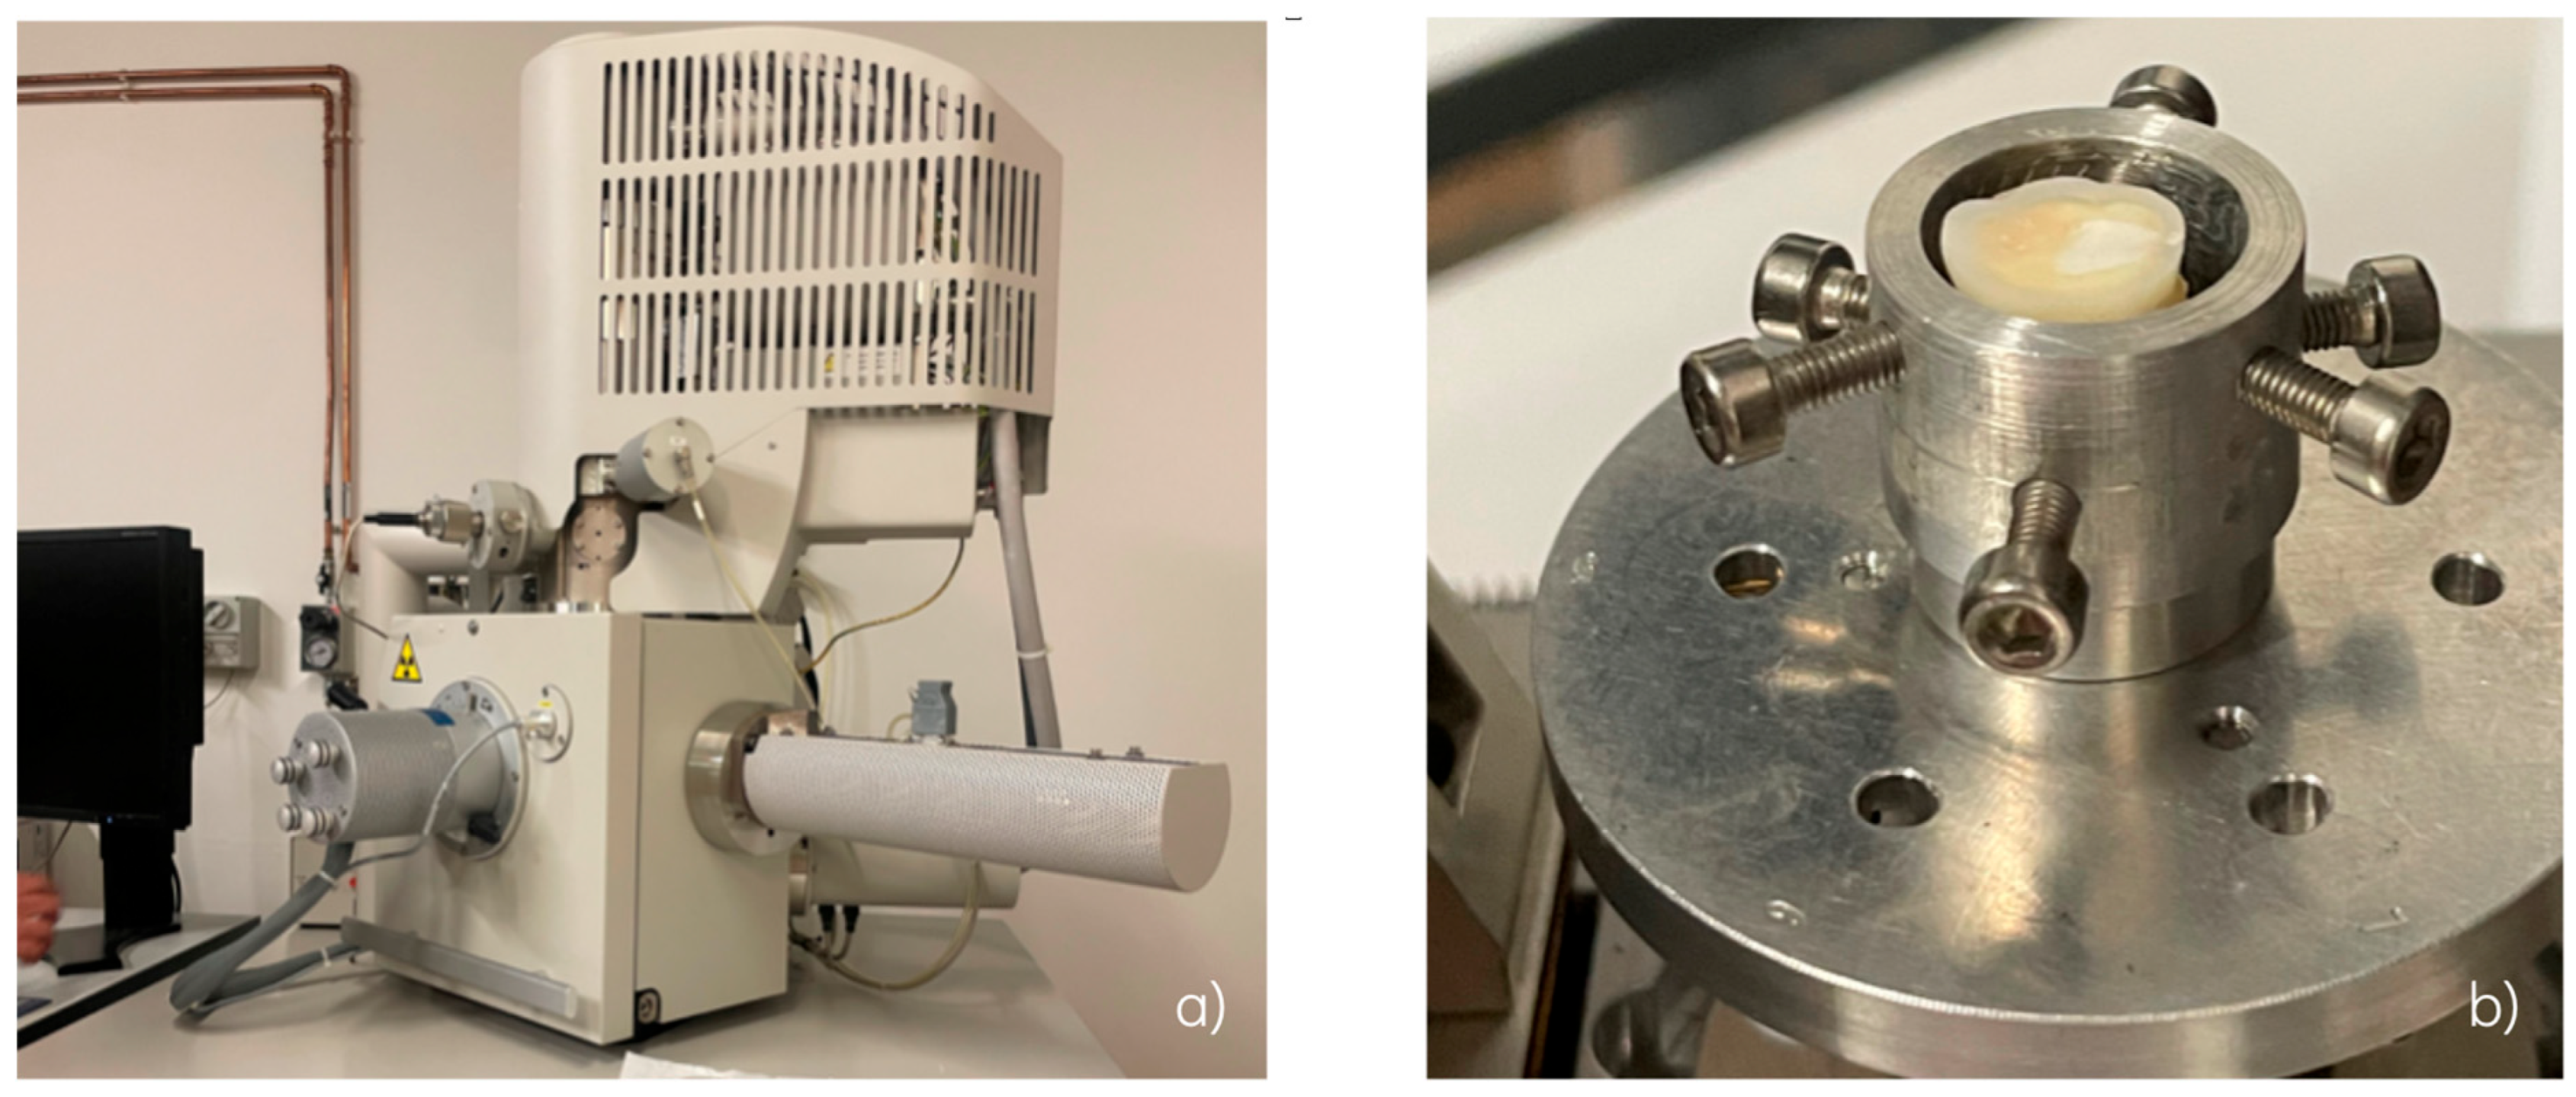
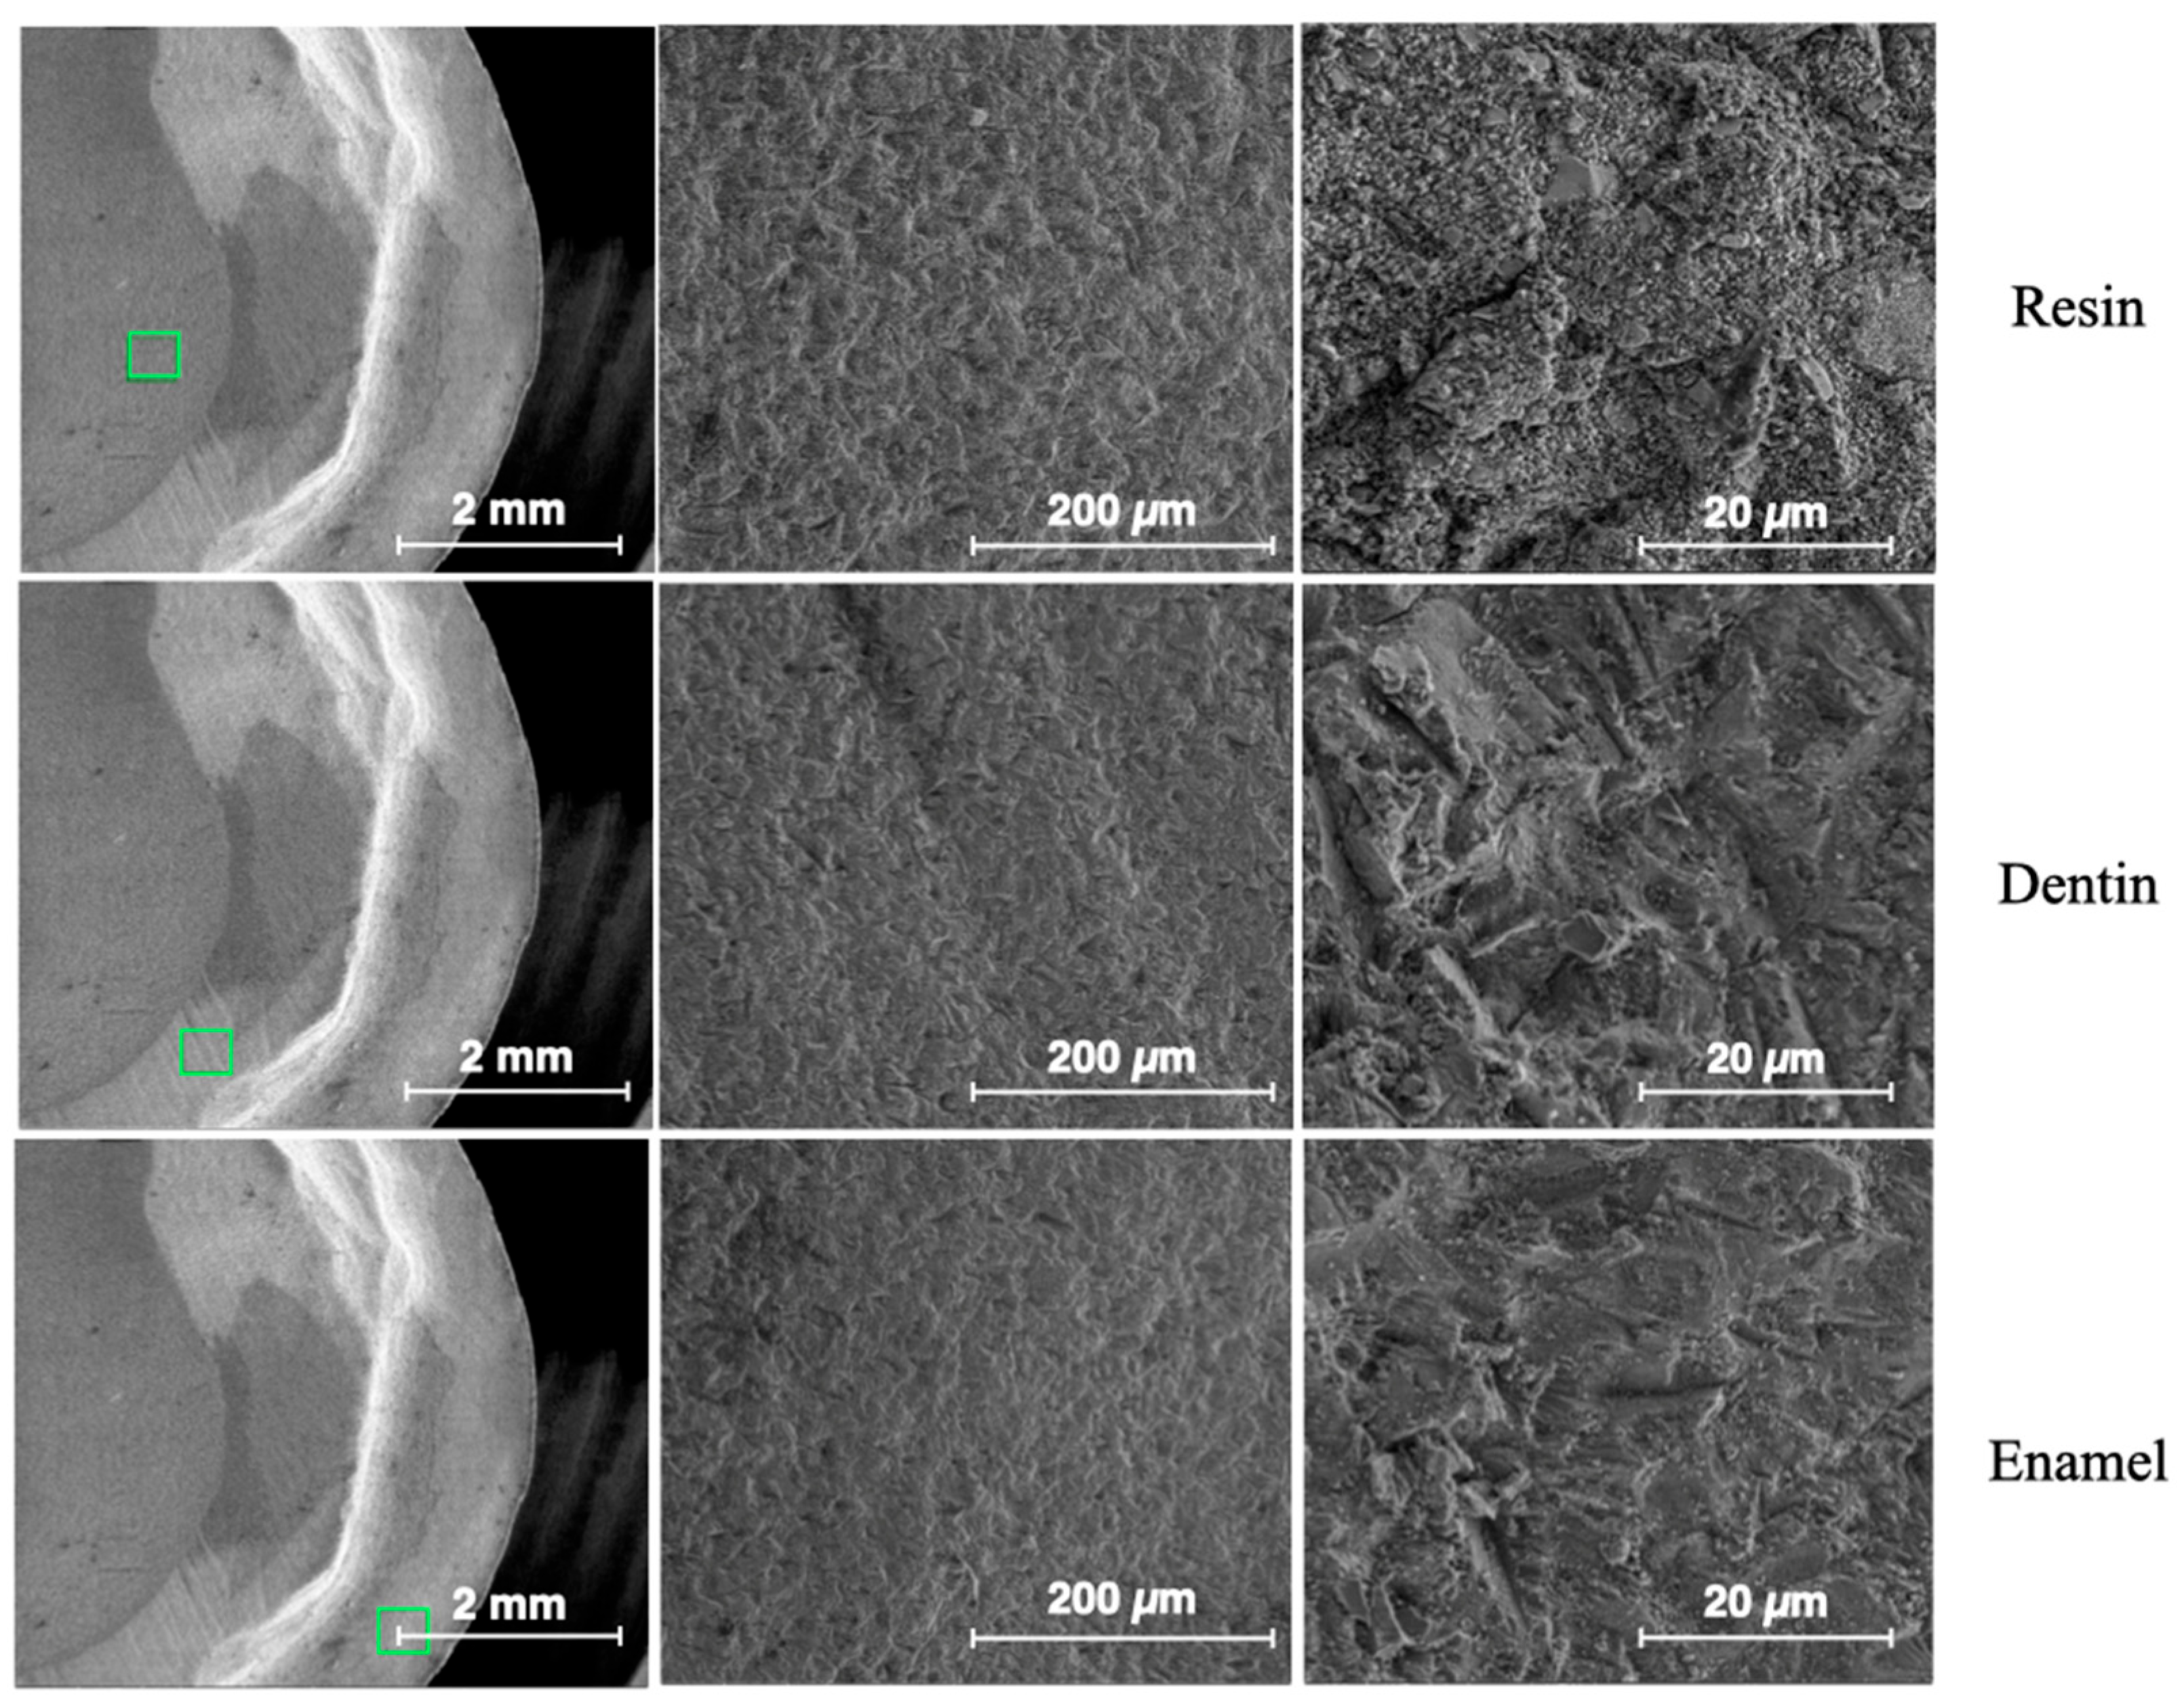
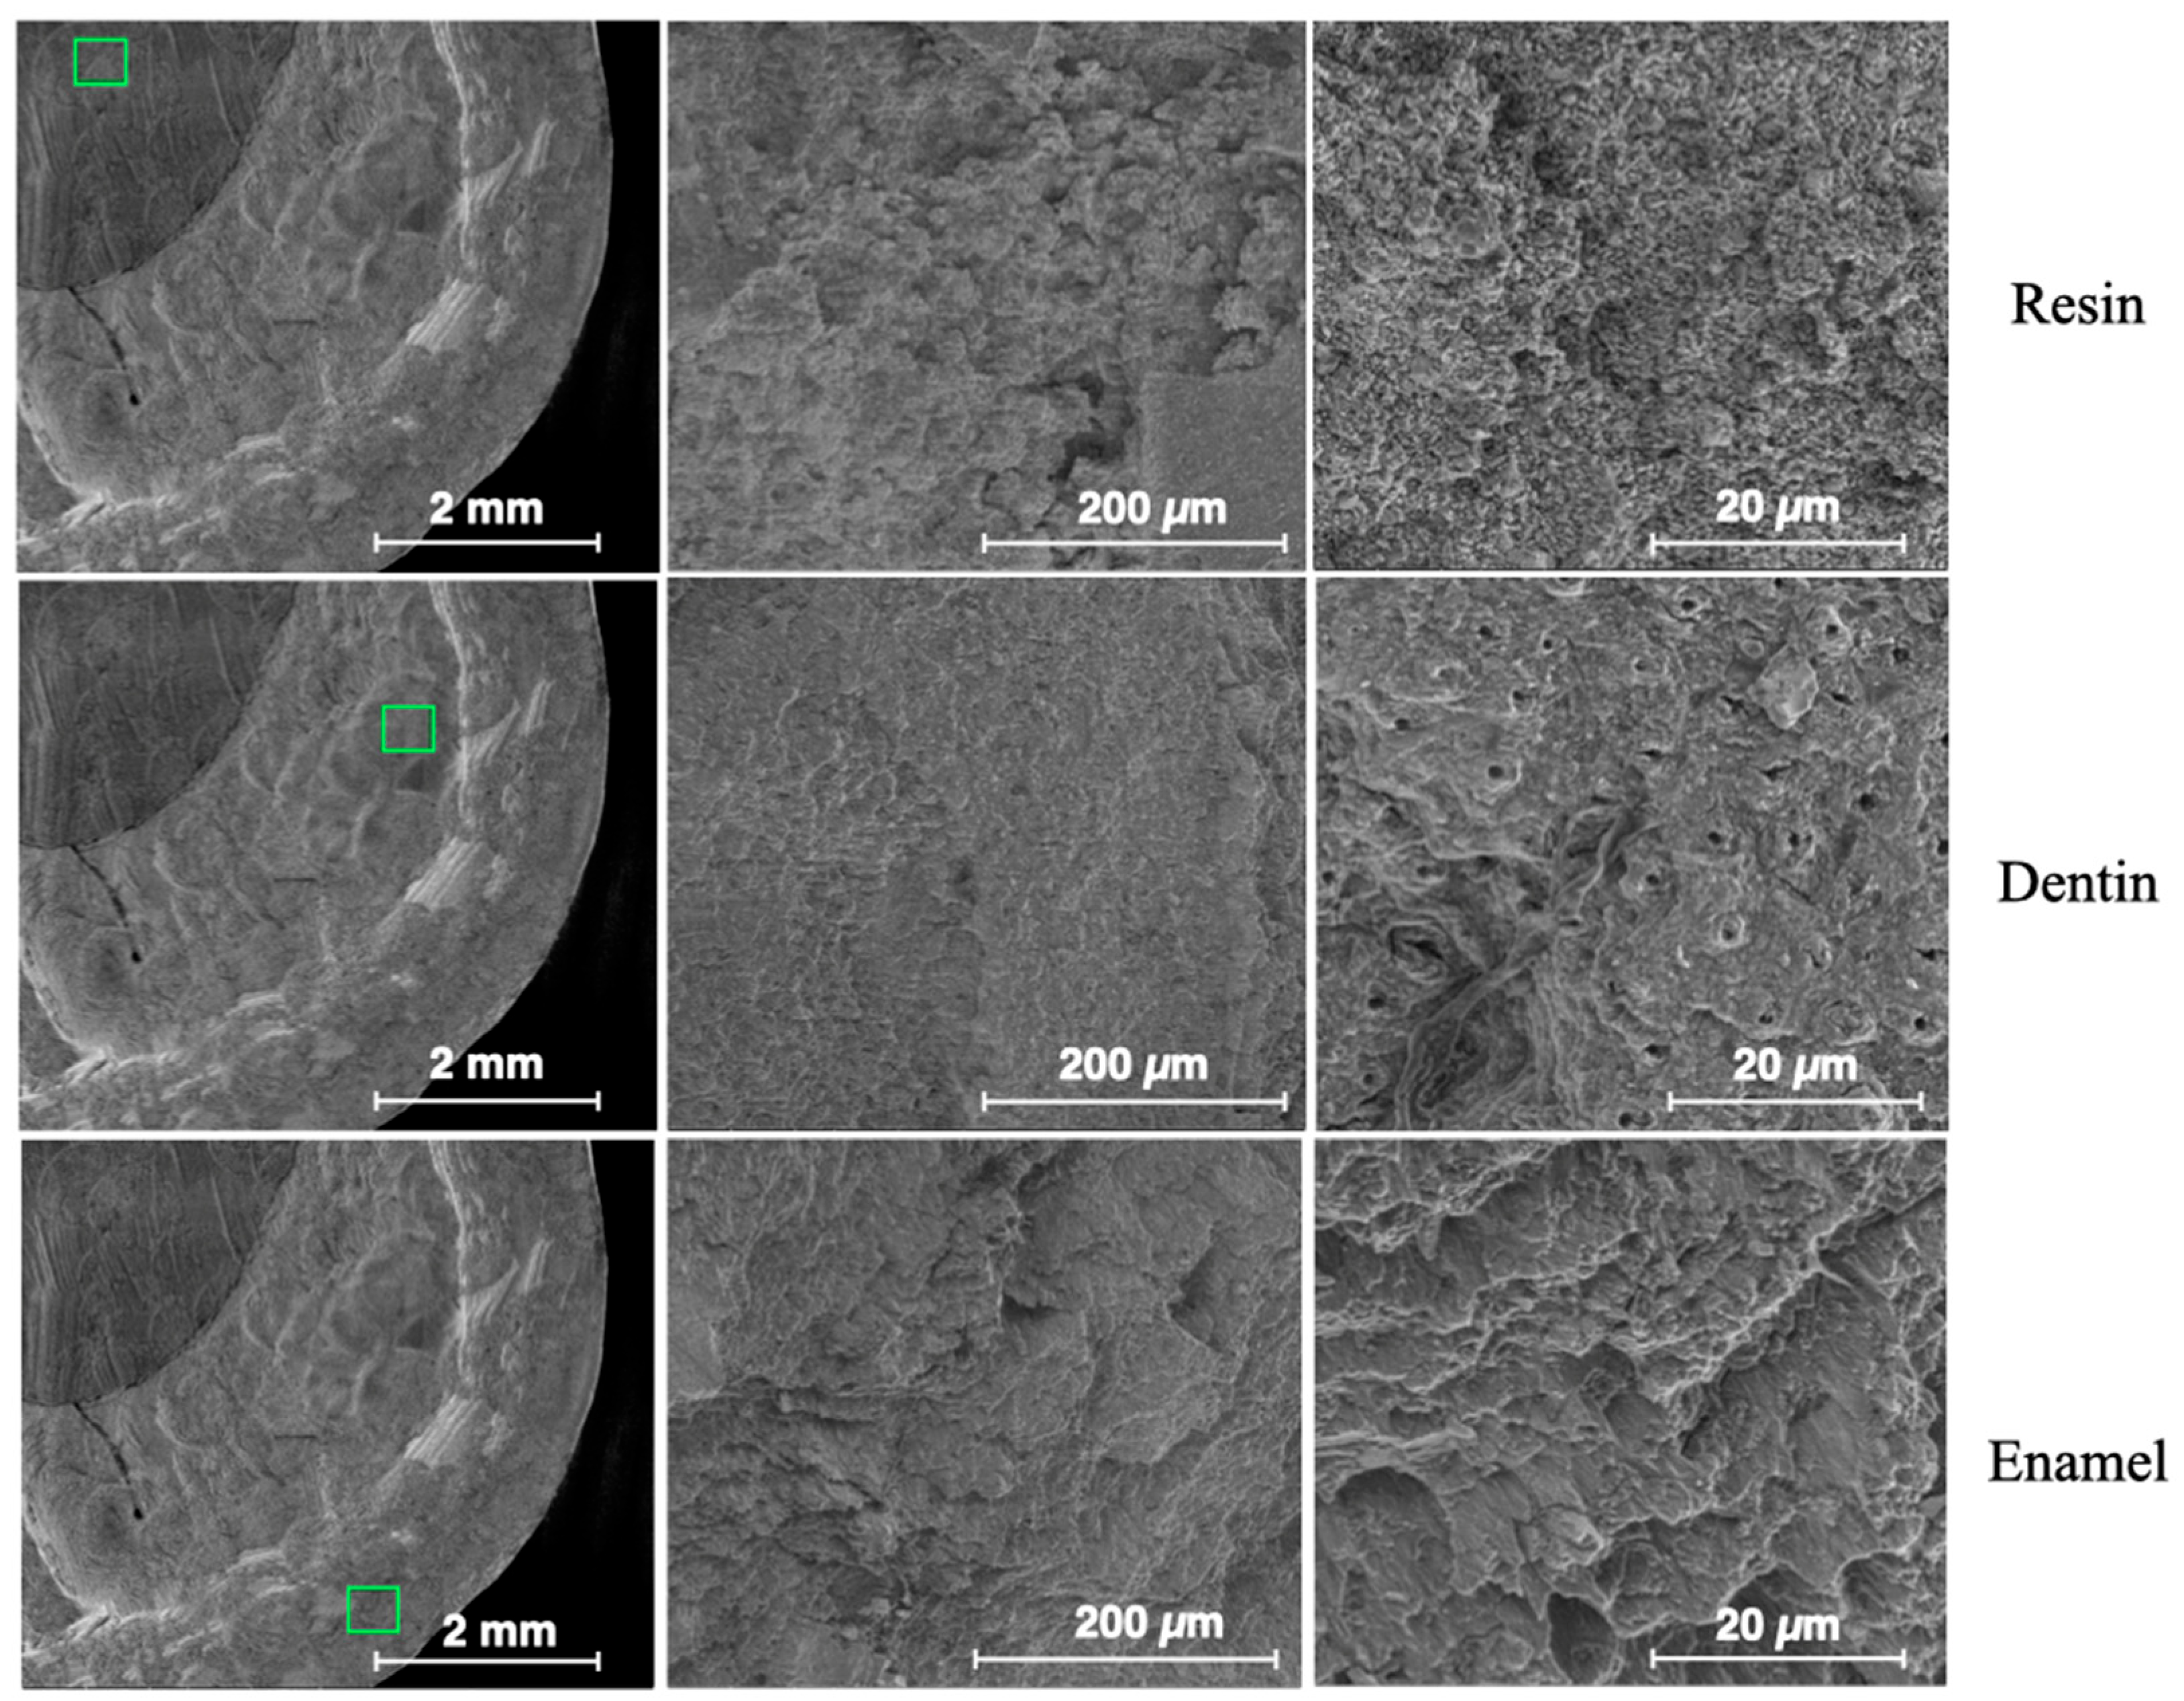
2.2. Surface Morphology Analysis by ESEM
3. Results
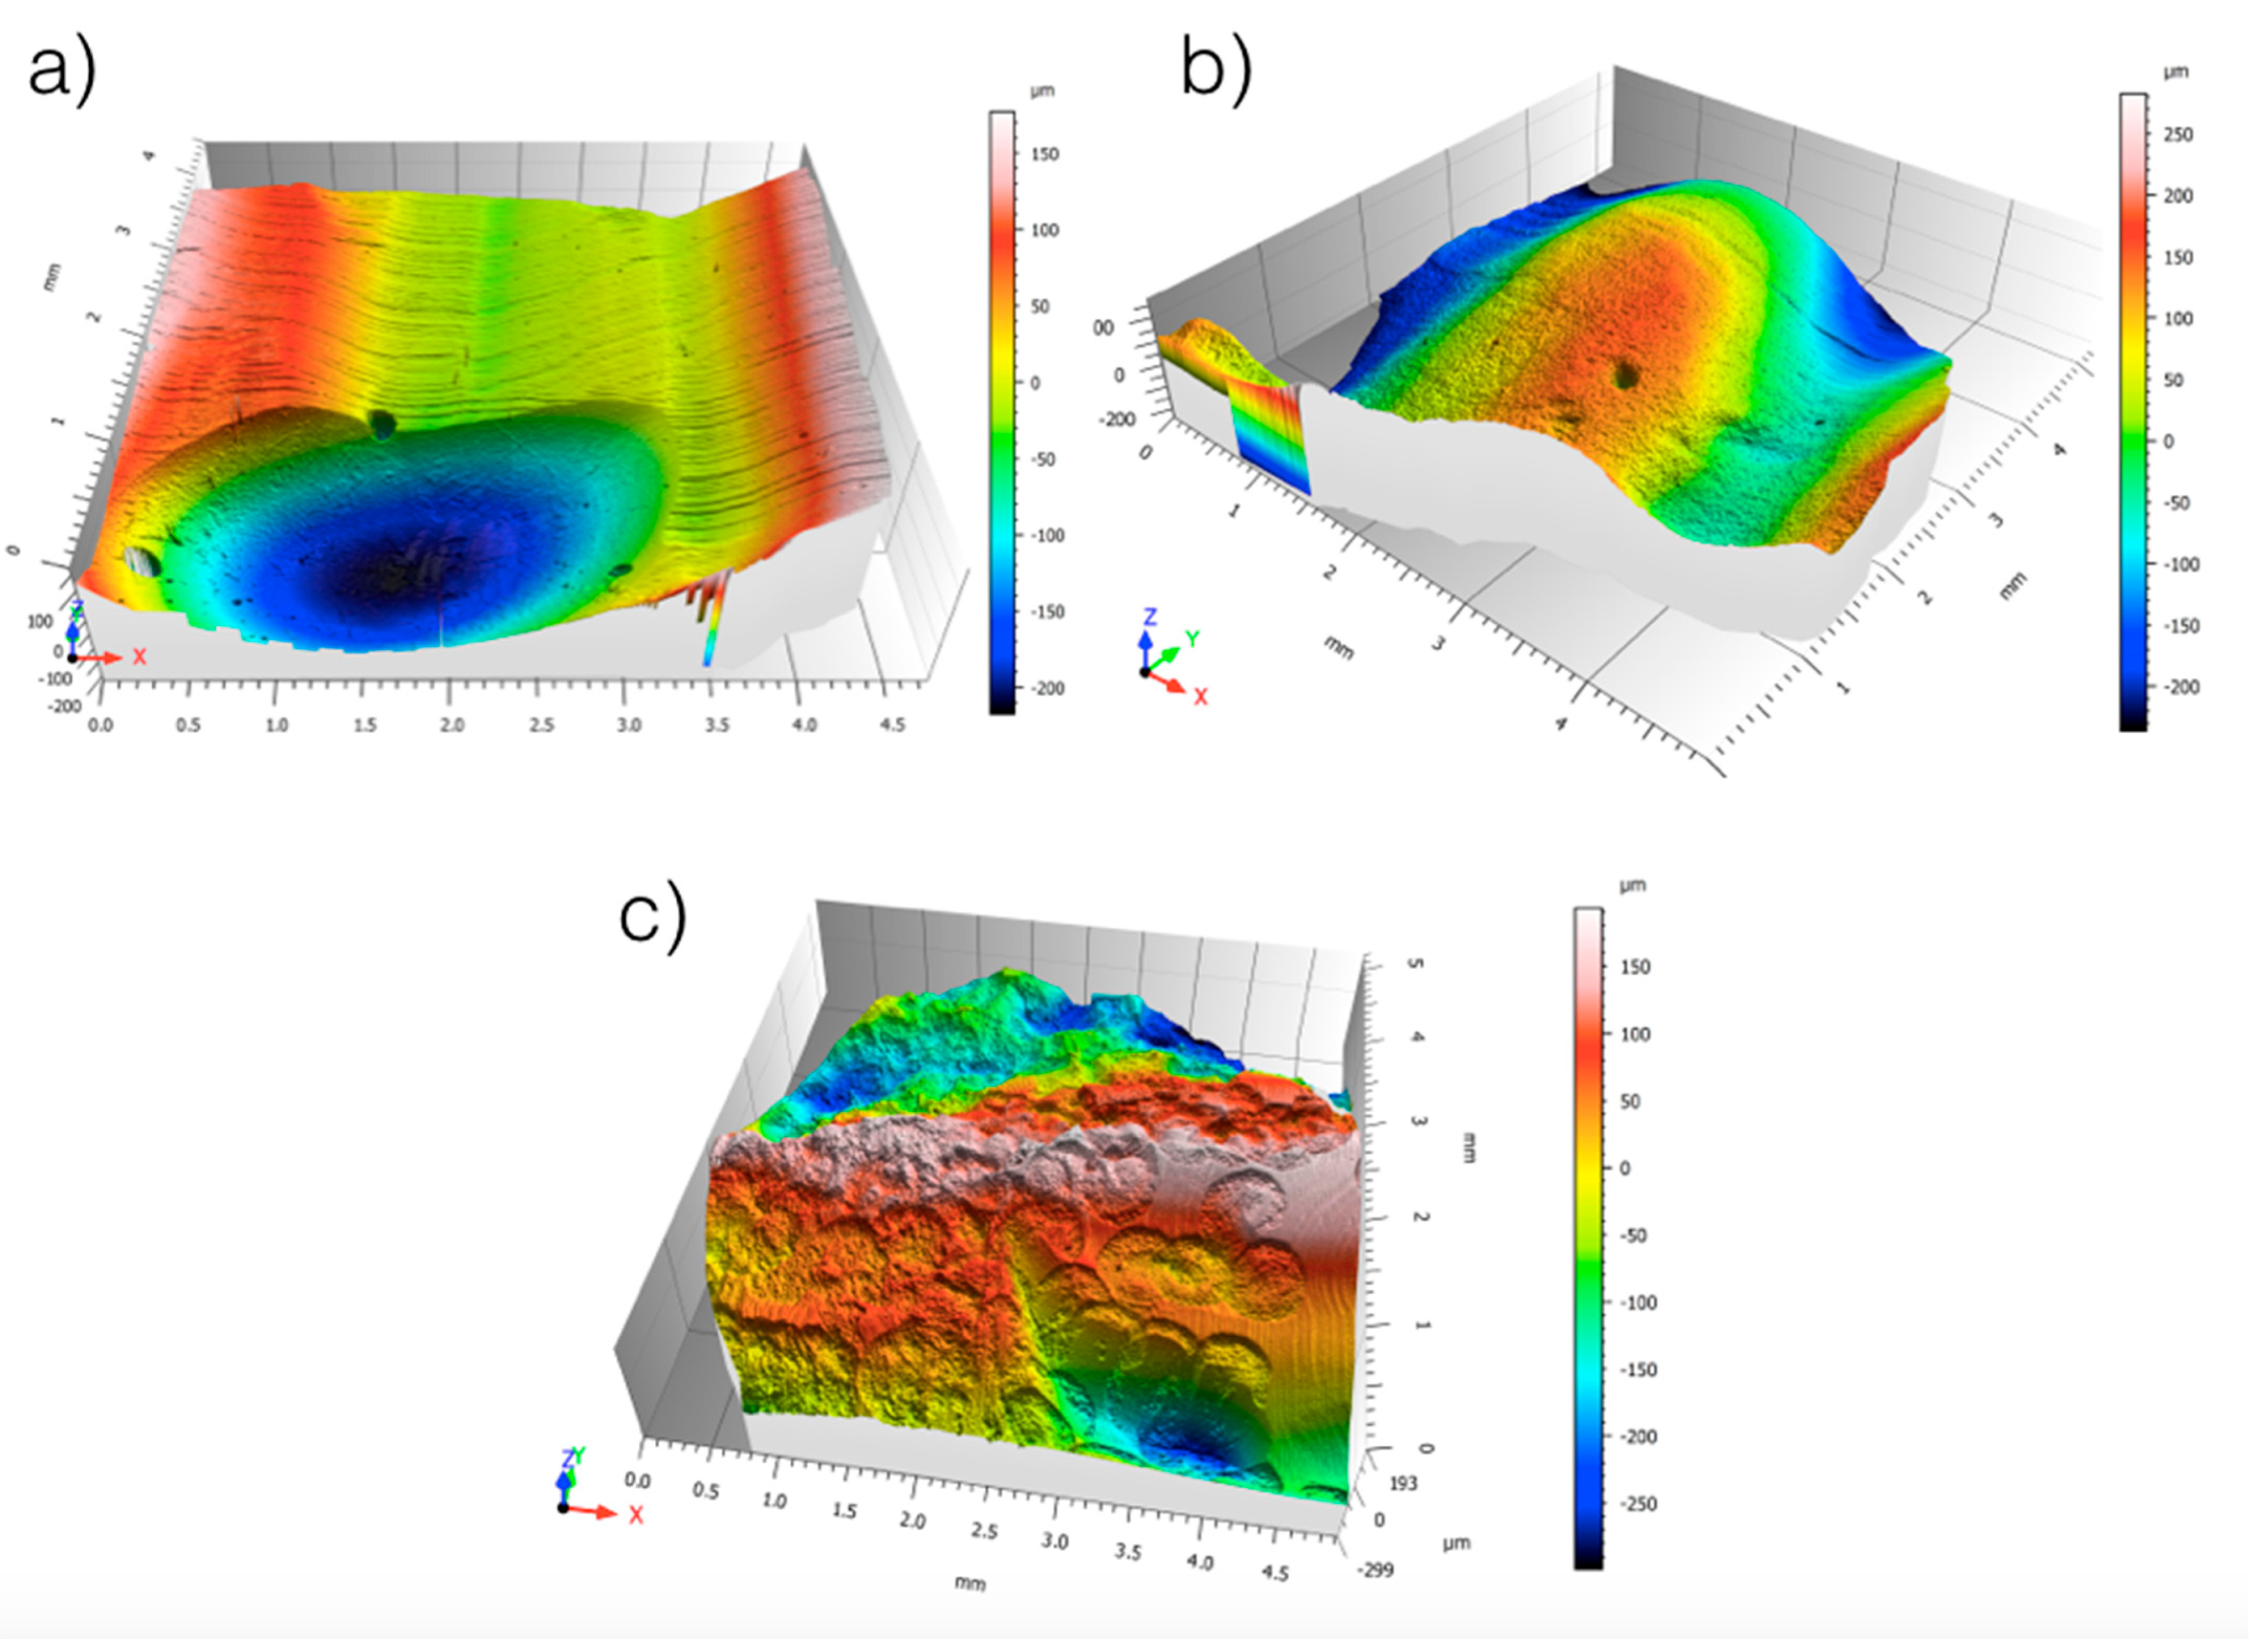
3.1. Results from Surface Roughness Analysis
3.2. Results from Surface Morphology Using ESEM
4. Discussion and Conclusions
Author Contributions
Funding
Institutional Review Board Statement
Informed Consent Statement
Data Availability Statement
Conflicts of Interest
Abbreviations
| QSP | Quantum square pulse |
| ESEM | Environmental scanning electron microscopy |
| Er:YAG | Erbium-doped: yttrium-aluminum-garnet |
| Er,Cr:YSSG | Erbium-chromium; yttrium-scandium-gallium-garnet |
| VSP | Variable Square Pulse |
| G1, G2, G3 | Groups 1, 2 and 3 |
| ANOVA | Analysis of variance |
| PLA | Pressure-Limiting Aperture |
| LFD | Large-Field Detector |
References
- Veneziani, M. Posterior indirect adhesive restorations: Updated indications and the Morphology Driven Preparation Technique. Int. J. Esthet. Dent. 2017, 12, 204–230. [Google Scholar] [PubMed]
- Ferraris, F. Posterior indirect adhesive restorations (PIAR): Preparation designs and adhesthetics clinical protocol. Int. J. Esthet. Dent. 2017, 12, 482–502. [Google Scholar] [PubMed]
- Edelhoff, D.; Sorensen, J.A. Tooth structure removal associated with various preparation designs for posterior teeth. Int. J. Periodontics Restor. Dent. 2002, 22, 241–249. [Google Scholar] [PubMed]
- Liebenberg, W.H. Posterior composite resin restorations: Operative innovations. Pract. Periodontics Aesthet. Dent. 1996, 8, 769–778. [Google Scholar] [PubMed]
- D’Arcangelo, C.; Vanini, L.; Casinelli, M.; Frascaria, M.; De Angelis, F.; Vadini, M.; D’Amario, M. Adhesive Cementation of Indirect Composite Inlays and Onlays: A Literature Review. Compend. Contin. Educ. Dent. 2015, 36, 570–577. [Google Scholar] [PubMed]
- D’Arcangelo, C.; Vanini, L. Effect of three surface treatments on the adhesive properties of indirect composite restorations. J. Adhes. Dent. 2007, 9, 319–326. [Google Scholar] [PubMed]
- Jiang, T.; Gong, Q.; Liu, Y.; Zhang, P.P.; Zhang, L. Effect of erbium family laser etching on shear bond strength of enamel surfaces: A meta-analysis-PRISMA. Medicine 2022, 101, e30990. [Google Scholar] [CrossRef] [PubMed] [PubMed Central]
- Gutknecht, N.; Lukac, M.; Marincek, M.; Perhavec, T.; Kazic, M. A Novel Quantum Square Pulse (QSP) Mode Erbium Dental Laser. LAHA (Online ed.), 2011 issue 1, str. 15–21. URN:NBN:SI:DOC-F4PMIHKQ. Available online: http://www.dlib.siLukac (accessed on 31 March 2025).
- Lukac, M.; Primc, N.; Pirnat, S. Quantum Square Pulse Er:YAG Lasers for Fast and Precise Hard Dental Tissue Preparation. LAHA—J. Laser Health Acad. 2012, 2012, 14–21. [Google Scholar]
- Labunet, A.; Tonea, A.; Kui, A.; Sava, S. The Use of Laser Energy for Etching Enamel Surfaces in Dentistry—A Scoping Review. Materials 2022, 15, 1988. [Google Scholar] [CrossRef] [PubMed] [PubMed Central]
- Wang, J.H.; Yang, K.; Zhang, B.Z.; Zhou, Z.F.; Wang, Z.R.; Ge, X.; Wang, L.L.; Chen, Y.J.; Wang, X.J. Effects of Er:YAG laser pre-treatment on dentin structure and bonding strength of primary teeth: An in vitro study. BMC Oral Health 2020, 20, 316. [Google Scholar] [CrossRef] [PubMed] [PubMed Central]
- ISO 25178-2:2012; Geometrical Product Specifications (GPS)—Surface Texture: Areal—Part 2: Terms, Definitions and Surface Texture Parameters. International Organization for Standardization: Geneva, Switzerland, 2012.
- Akhoundi, M.S.A.; Etemadi, A.; Nasiri, M.; Borujeni, E.S. Comparison of Enamel Morphologic Characteristics after Conditioning with Various Combinations of Acid Etchant and Er:YAG Laser in Bonding and Rebonding Procedures: A SEM Analysis. J. Dent. 2017, 14, 144–152. [Google Scholar] [PubMed] [PubMed Central]
- Franz, N.; Ahlers, M.O.; Abdullah, A.; Hohenberg, H. Material-specific contrast in the ESEM and its application in dentistry. J. Mater. Sci. 2006, 41, 4561–4567. [Google Scholar] [CrossRef]
- Mattarozzi, M.; Visioli, G.; Sanangelantoni, A.; Careri, M. ESEM-EDS: In vivo characterization of the Ni hyperaccumulator Noccaea caerulescens. Micron 2015, 75, 18–26. [Google Scholar] [CrossRef] [PubMed]
- Foresti, R.; Rossi, S.; Pinelli, S.; Alinovi, R.; Barozzi, M.; Sciancalepore, C.; Galetti, M.; Caffarra, C.; Lagonegro, P.; Scavia, G.; et al. Highly-defined bioprinting of long-term vascularized scaffolds with Bio-Trap: Complex geometry functionalization and process parameters with Computer Aided Tissue Engineering. Materialia 2019, 9, 100560. [Google Scholar] [CrossRef]
- Cowan, A.J.; Wilson, N.H.; Wilson, M.A.; Watts, D.C. The application of ESEM in dental materials research. J. Dent. 1996, 24, 375–377. [Google Scholar] [CrossRef] [PubMed]


| Descriptives | ||||||
|---|---|---|---|---|---|---|
| Treatment | Mean | Median | SD | Minimum | Maximum | |
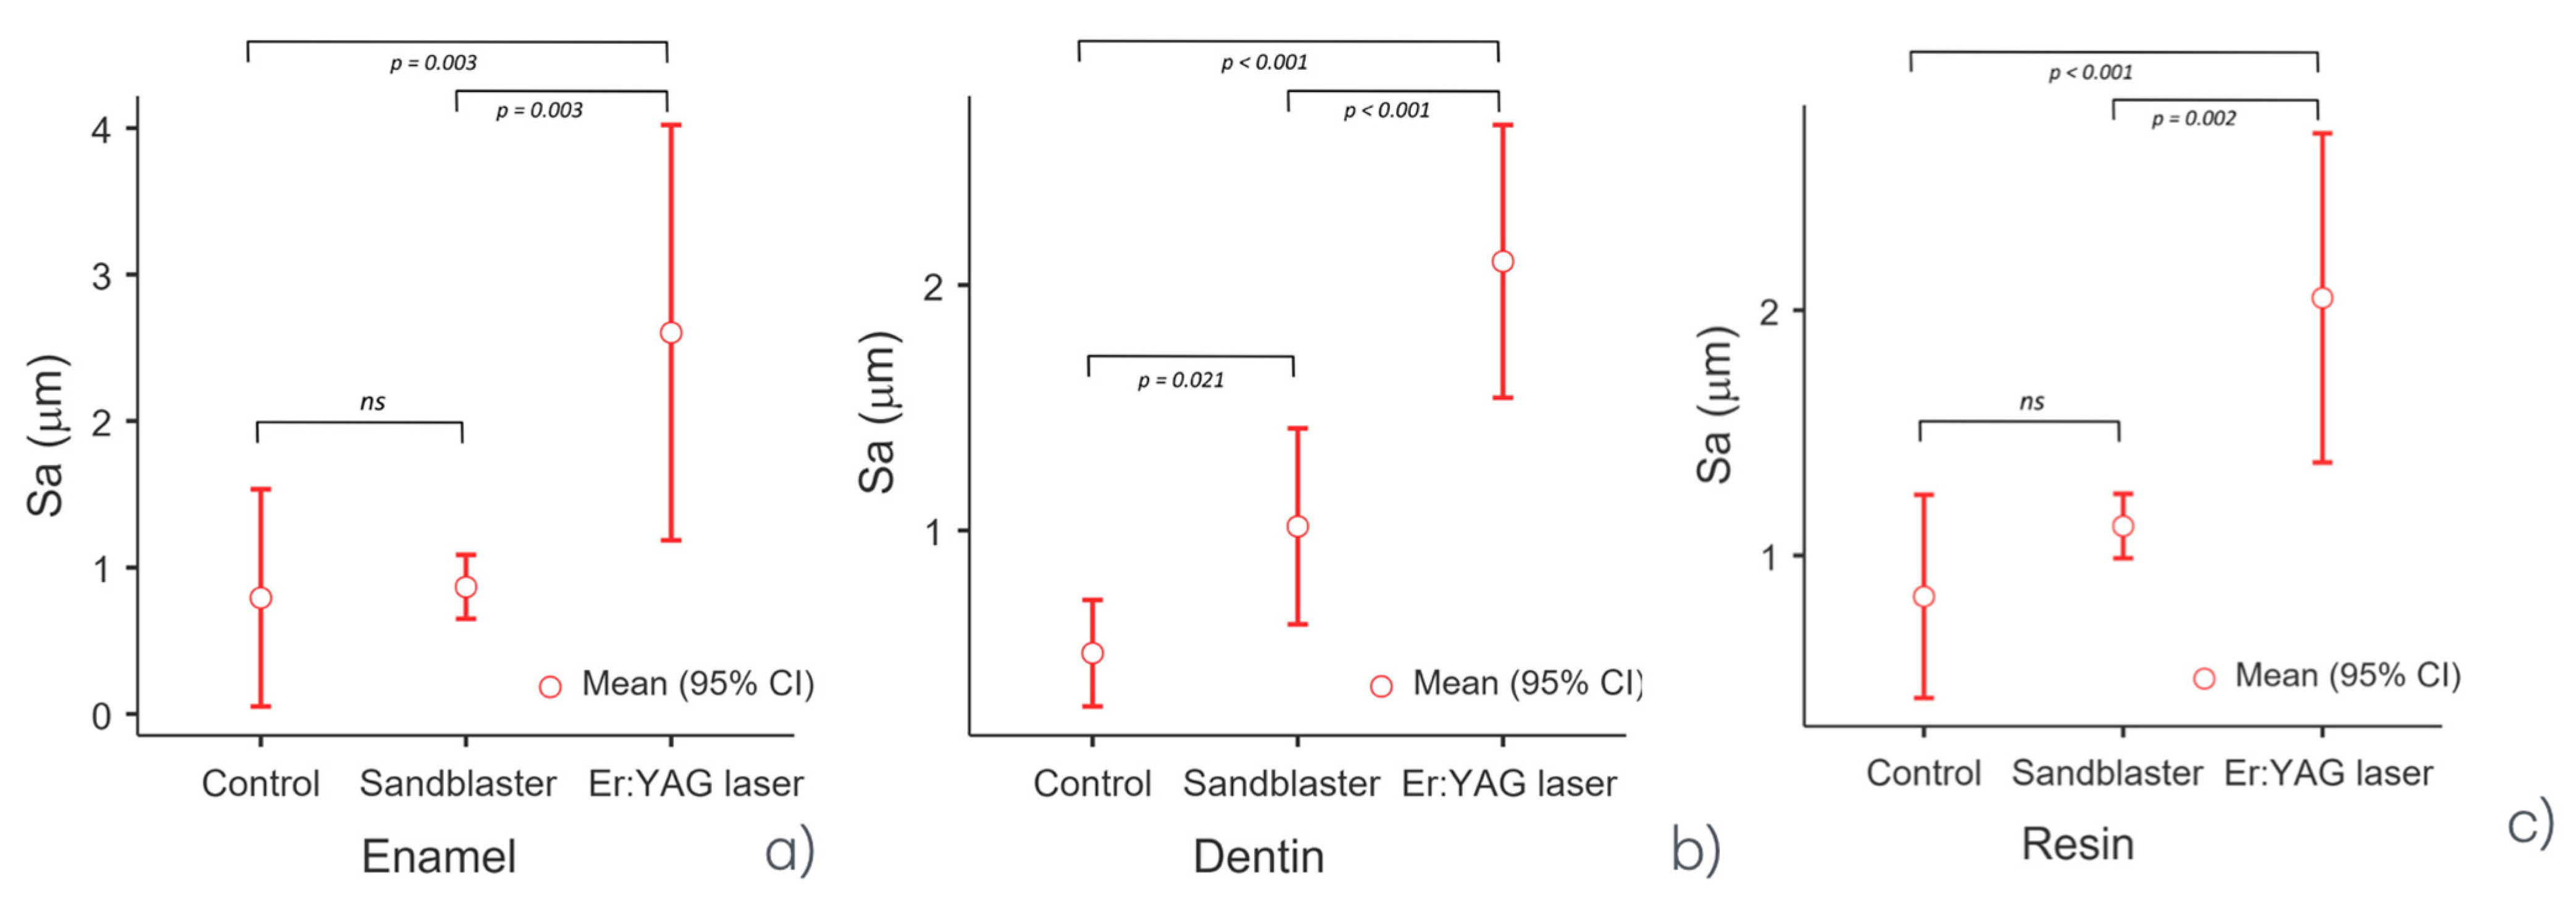
| Enamel | Control (G1) | 0.793 | 0.687 | 0.299 | 0.562 | 1.13 |
| Sandblaster (G2) | 0.868 | 0.840 | 0.088 | 0.797 | 0.966 | |
| Er:YAG laser (G3) | 2.603 | 2.390 | 0.571 | 2.17 | 3.25 | |
| Dentin | Control (G1) | 0.500 | 0.533 | 0.087 | 0.401 | 0.566 |
| Sandblaster (G2) | 1.017 | 0.950 | 0.161 | 0.9 | 1.2 | |
| Er:YAG laser (G3) | 2.097 | 2.050 | 0.224 | 1.9 | 2.34 | |
| Resin | Control (G1) | 0.833 | 0.887 | 0.167 | 0.646 | 0.966 |
| Sandblaster (G2) | 1.120 | 1.100 | 0.053 | 1.08 | 1.18 | |
| Er:YAG laser (G3) | 2.050 | 2.050 | 0.270 | 1.78 | 2.32 | |
| One-Way ANOVA | |||||
|---|---|---|---|---|---|
| F | df1 | df2 | ω² | p | |
| Enamel | 22.3 | 2 | 6 | 0.826 | 0.002 |
| Dentin | 71.6 | 2 | 6 | 0.94 | <0.001 |
| Resin | 35.2 | 2 | 6 | 0.884 | <0.001 |
| Tukey Post Hoc Test—Enamel | ||
|---|---|---|
| Control—sandblaster: | mean difference = −0.07 | p-value = 0.968 |
| Control—Er:YAG laser: | mean difference = −1.81 | p-value = 0.003 |
| Sandblaster—Er:YAG laser | mean difference = −1.74 | p-value = 0.003 |
| Tukey’s post hoc test—dentin | ||
| Control—sandblaster: | mean difference = −0.52 | p-value = 0.021 |
| Control—Er:YAG laser: | mean difference = −1.60 | p-value < 0.001 |
| Sandblaster—Er:YAG laser | mean difference = −1.08 | p-value < 0.001 |
| Tukey’s post hoc test—resin | ||
| Control—sandblaster: | mean difference = −0.29 | p-value = 0.221 |
| Control—Er:YAG laser: | mean difference = −1.60 | p-value < 0.001 |
| Sandblaster—Er:YAG laser | mean difference = −1.08 | p-value = 0.002 |
Disclaimer/Publisher’s Note: The statements, opinions and data contained in all publications are solely those of the individual author(s) and contributor(s) and not of MDPI and/or the editor(s). MDPI and/or the editor(s) disclaim responsibility for any injury to people or property resulting from any ideas, methods, instructions or products referred to in the content. |
© 2025 by the authors. Licensee MDPI, Basel, Switzerland. This article is an open access article distributed under the terms and conditions of the Creative Commons Attribution (CC BY) license (https://creativecommons.org/licenses/by/4.0/).
Share and Cite
Giovannacci, I.; Mattarozzi, M.; Moroni, F.; Pedrazzi, G.; Vescovi, P.; Careri, M. Er:YAG Laser in QSP Modality for Treatment of Indirect Adhesive Restoration Build-Up: Surface Roughness Analysis and Morphology Assessment by Environmental Scanning Electron Microscopy (ESEM). Dent. J. 2025, 13, 223. https://doi.org/10.3390/dj13050223
Giovannacci I, Mattarozzi M, Moroni F, Pedrazzi G, Vescovi P, Careri M. Er:YAG Laser in QSP Modality for Treatment of Indirect Adhesive Restoration Build-Up: Surface Roughness Analysis and Morphology Assessment by Environmental Scanning Electron Microscopy (ESEM). Dentistry Journal. 2025; 13(5):223. https://doi.org/10.3390/dj13050223
Chicago/Turabian StyleGiovannacci, Ilaria, Monica Mattarozzi, Fabrizio Moroni, Giuseppe Pedrazzi, Paolo Vescovi, and Maria Careri. 2025. "Er:YAG Laser in QSP Modality for Treatment of Indirect Adhesive Restoration Build-Up: Surface Roughness Analysis and Morphology Assessment by Environmental Scanning Electron Microscopy (ESEM)" Dentistry Journal 13, no. 5: 223. https://doi.org/10.3390/dj13050223
APA StyleGiovannacci, I., Mattarozzi, M., Moroni, F., Pedrazzi, G., Vescovi, P., & Careri, M. (2025). Er:YAG Laser in QSP Modality for Treatment of Indirect Adhesive Restoration Build-Up: Surface Roughness Analysis and Morphology Assessment by Environmental Scanning Electron Microscopy (ESEM). Dentistry Journal, 13(5), 223. https://doi.org/10.3390/dj13050223