1. Introduction
Recent years have seen revolutionary improvements in patient care and monitoring as a result of the convergence of technology and healthcare. The integration of the Internet of Things (IoT) into medical diagnostics has opened new and promising opportunities, particularly in the field of non-invasive blood analysis, as demonstrated by Choudhuri [
1] and Bhatia [
2]. Blood analysis has historically involved intrusive procedures that can be expensive, painful, and inconvenient for routine monitoring. But now that IoT-enabled devices are available, continuous, painless blood monitoring is becoming possible, providing real-time information on vital biomarkers and health metrics like oxygen saturation, RBC concentration, and glucose levels [
3,
4,
5]. Blood analysis is being revolutionized by the integration of Internet of Things (IoT) technology and optical devices, which enable improved diagnostic capabilities to be sent straight from the lab to patients [
6,
7].
Non-invasive optical techniques for measuring red blood cell concentrations by examining light absorption and scattering in whole blood constitutes a substantial field of study [
8]. Methods such as photonic sensing and near-infrared spectroscopy have demonstrated potential in measuring red blood cell counts and hemoglobin levels [
9,
10,
11]. These techniques involve directing a photon beam onto the skin, where it interacts with blood components and undergoes absorption, scattering, and reflection because of the special characteristics of hemoglobin and blood cells [
12,
13,
14]. Theoretical analysis of these interactions, based on concepts from physics and optics, plays a crucial role in understanding light–tissue interactions. Principles such as the Beer–Lambert Law for absorption, the Fresnel equations for reflection, and Mie scattering theory allow for accurate assessments of blood concentration and composition [
15,
16,
17]. Monte Carlo simulations are an additional method that aids in comprehending the complex intricate relationship between biological layers and photons. This technique replicates the trajectories of thousands or millions of photons as they enter the skin, dispersing and absorbing throughout various blood components [
18,
19,
20].
For a more comprehensive understanding, the Radiative Transfer Equation (RTE) can be used to simulate light attenuation in biological tissues. The RTE provides a comprehensive depiction of light transport by integrating absorption, scattering, and the phase function, which simulates the effects of directional scattering [
21]. However, it takes a lot of computing power to solve the RTE [
22]. For media where scattering predominates over absorption, the diffusion equation (DE), a condensed form of the RTE, is appropriate. Although it is less accurate in low-scattering media or close to light sources, the DE is computationally effective and frequently employed in tissue spectroscopy and diffuse optical tomography [
23,
24].
Fluence, defined as the energy per unit area delivered by a light source, is a commonly used term in optical physics and biomedical optics [
25]. It refers to the interaction of light with red blood cells (RBCs) under controlled experimental conditions, and its role in the verification process is discussed in detail in this paper. The term fluence is particularly relevant since much of the results and verification involve the study of how light interacts with RBCs to assess their light absorption. In this context, the diffusion equation (DE) is used to model the propagation of light through the tissue, where fluence quantifies the distribution of light energy that interacts with the RBCs. The DE provides an effective framework for studying how fluence varies as light diffuses through the scattering medium, such as the capillary, and how it is carried out to determine the behavior and dynamics of the RBCs in response to the light. Numerous numerical techniques are frequently used by researchers to solve the diffusion equation (DE) in complex situations.
Popular techniques such as the Finite Difference Method (FDM) are effective techniques for time-dependent diffusion problems because they use different equations on a grid to estimate derivatives. When dealing with complex geometries, the Finite Element Method (FEM) breaks the domain down into smaller components and applies appropriate basis functions. On the other hand, the Finite Volume Method (FVM) is perfect for guaranteeing mass conservation and accuracy in simulations involving diffusion. Additionally, spectral methods provide great accuracy for smooth situations by utilizing orthogonal basis functions [
26,
27].
Given its adaptability to complex geometries and biological layer-specific optical properties, the Finite Element Method (FEM) is the most appropriate approach for simulating light attenuation through various skin layers and evaluating the absorptivity of red blood cells [
28]. Additionally, for these simulations, solvers such as GMRES and PARDISO offer computational efficiency and scalability, especially in large, heterogeneous biological tissue models [
29]. To guarantee accuracy and dependability, these systems must be validated, especially before being integrated into real-time medical devices. When creating and testing embedded systems for optical diagnostics, methodologies such as Model-in-the-Loop (MIL), Software-in-the-Loop (SIL), Hardware-in-the-Loop (HIL), and Processor-in-the-Loop (PIL) are crucial [
30]. Through the integration of simulation, software, and hardware testing, these approaches guarantee the reliability of instruments intended for measuring RBC concentrations and other blood components.
While intravenous (IV) blood draws remain the gold standard for blood measurements, particularly in critical care settings like the Intensive Care Unit (ICU) where patients may already have a catheter in place, these procedures are invasive and can be uncomfortable. Current non-invasive methods are limited in accuracy and practicality. The proposed sensor design approach represents a promising stepping-stone towards more accessible, patient-friendly monitoring solutions, although it is not intended to replace existing methods immediately. Instead, it aims to provide an alternative for routine monitoring that could complement traditional methods as the technology evolves. In this context, this study builds on previous research demonstrating the potential of near-infrared (NIR) light transmission for non-invasive hemoglobin measurement. Researchers in [
31,
32] reported the effectiveness of using 660 nm, 770 nm, 810 nm, 850 nm, and 950 nm wavelengths for this purpose, highlighting their suitability for hemoglobin concentration analysis.
Even with major improvements, little is known about how RBCs absorb photon beams and interact with biofluids. This study aims to close this gap by concentrating on the non-invasive methods of tracking RBC mobility inside capillaries and quantifying RBC concentration by photon absorption by RBCs. Using the diffusion equation for light propagation and optical modeling in conjunction with COMSOL Multiphysics 6.0 simulations, this study seeks to give a sophisticated, non-invasive diagnostic tool for blood monitoring by shedding light on RBC dynamics.
This paper aims to introduce a numerical approach for RBC photon absorption and its mutual interaction with biofluid inside the capillary.
In fact, a two-dimensional geometric model of red blood cells (RBCs) is developed within the capillaries, where blood is viewed as fluid with laminar and incompressible flow interacting with one of its elements, RBCs.
The Arbitrary Lagrangian–Eulerian (ALE) formulation is used to describe the geometrical changes in the biofluid domain.
In addition, the measurement of the photon attenuation of the beam by the RBC is performed inside the microvessel to study its wavelength absorbance.
The rest of the paper is organized as follows.
Section 2 presents the proposed methodology for the design and implementation of a blood light absorption system based on the Finite Element Method (FEM), with a specific focus on the workflow developed using the S-Function builder.
Section 3 presents the results and discussion, covering the geometric model, computational fluid dynamics, mesh generation, and radiative beam absorption in the blood flow. It details the model’s design, evaluates the accuracy of the computed fluence values, and examines the interaction between the radiative beam and RBCs within the capillary. Additionally, this section analyzes absorptivity, discussing the absorption characteristics of RBCs across various wavelengths. The impact of different wavelengths on light absorption is explored, with particular emphasis on how RBC movement and blood flow influence light attenuation. Finally,
Section 4 concludes the paper, summarizing the key findings of the study and providing insights into future work. This section discusses potential improvements to the methodology, such as experimental verification of the model, and considers extending the model to study other biological phenomena, such as oxygen transport and cellular interactions within the microcirculation.
2. Proposed Methodology
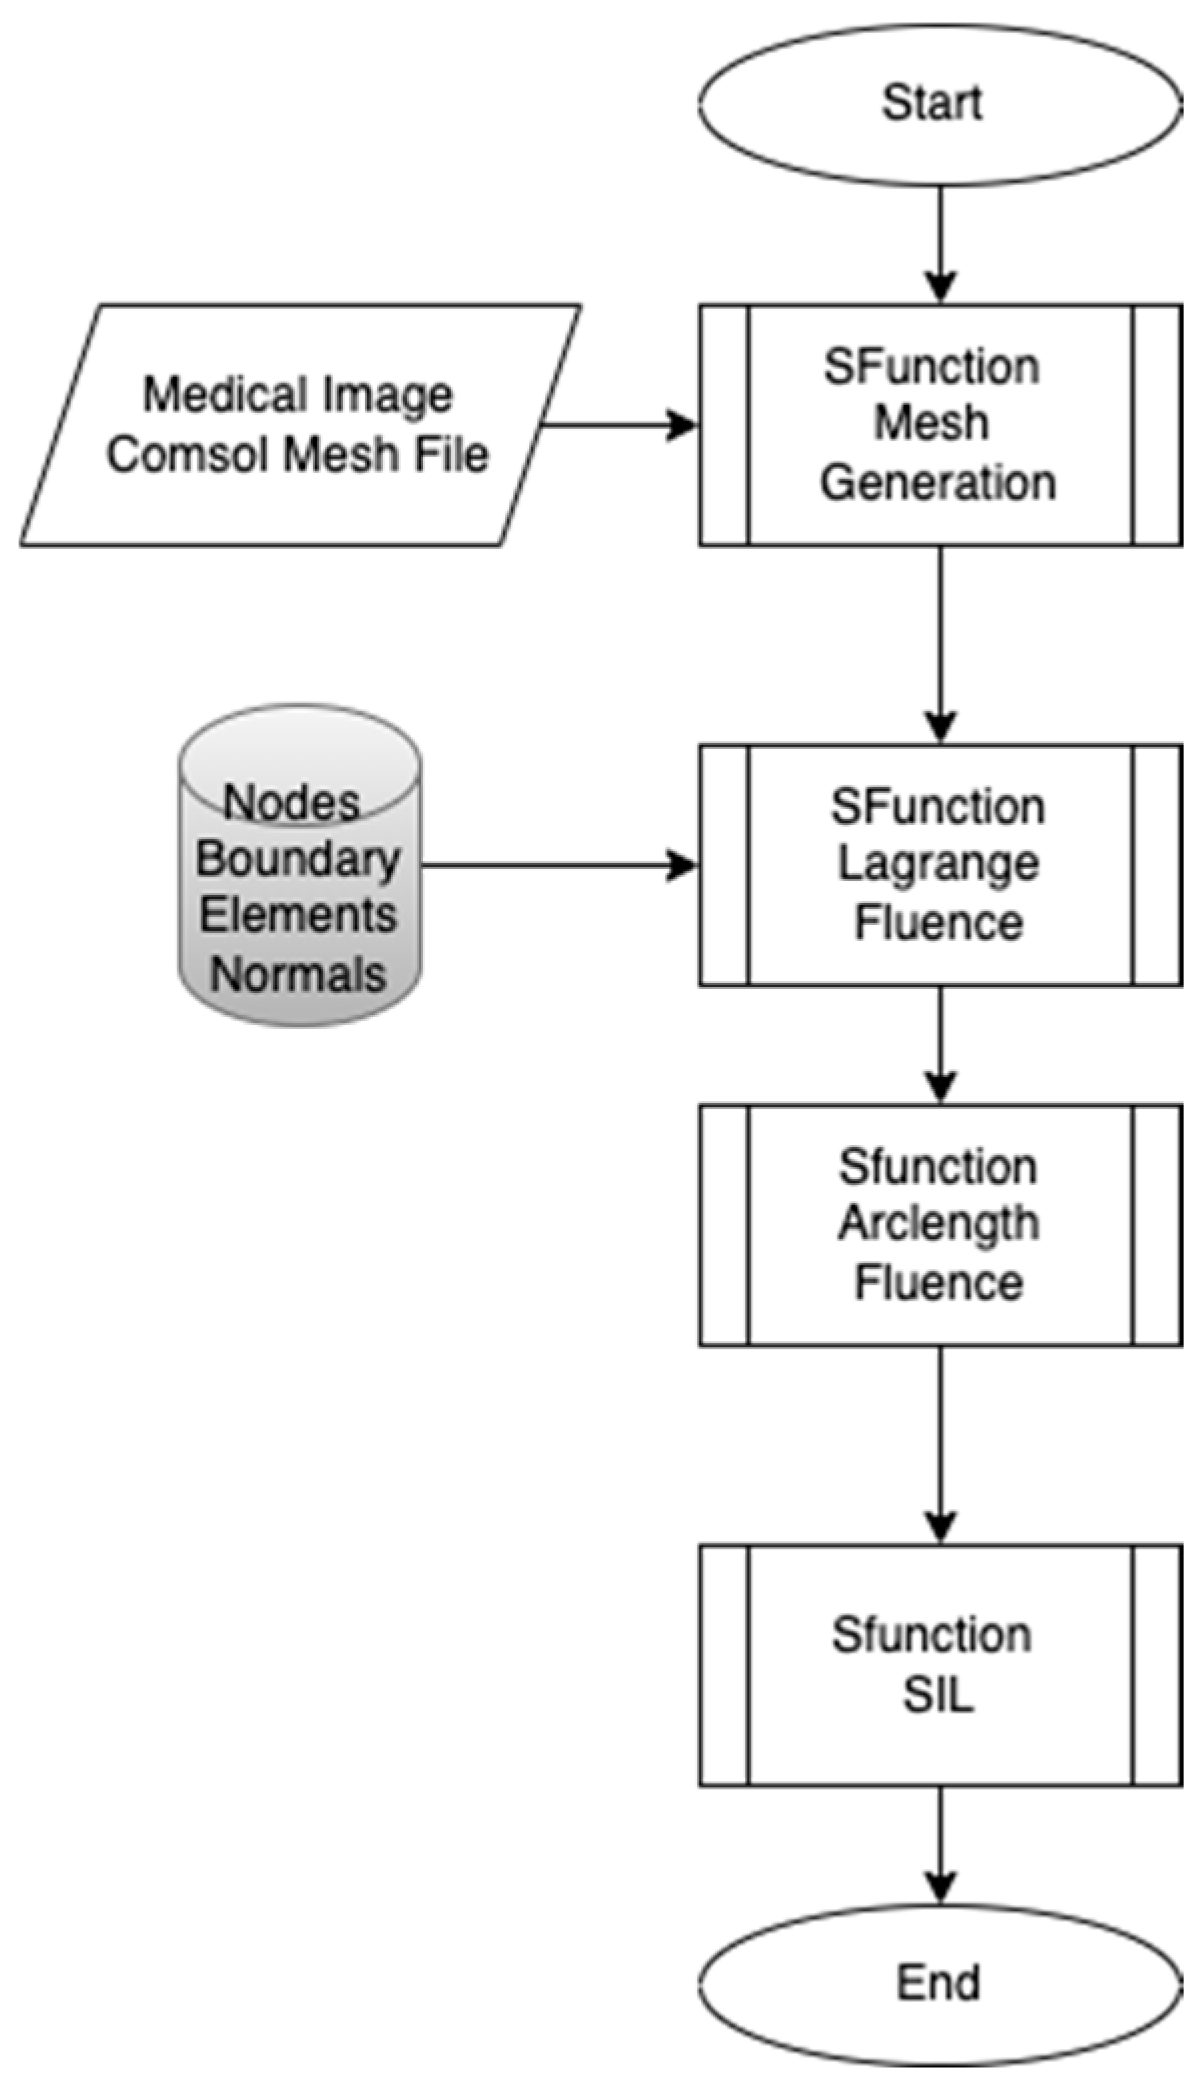
The proposed workflow presented in
Figure 1 aims to develop real-time embedded systems through a systematic approach, divided into three distinct phases, each developed using the S-Function Builder. The goal of this workflow is to accommodate the limited resource constraints of embedded systems while maintaining the computational accuracy necessary for simulations. This workflow includes three main S-Functions: the mesh generation S-Function, the fluence computing S-Function, and the Software-in-the-Loop (SIL) S-Function. The first S-Function is used to generate an adaptive mesh that meets the requirements of the target architecture. In this step, COMSOL Multiphysics is employed to design the geometric model and perform a temporal study to examine the fluid–structure interaction (FSI) between red blood cells (RBCs) and blood flow inside the capillary. This study allows for the development of a moving mesh, capturing the effects of RBC properties on their movement inside the capillary. The mesh generated in this phase serves as the input for the next S-Function. In the second S-Function, the Finite Element Method is used to compute the fluence versus arclength through the model. A point source placed around the RBC serves as the input, and the S-Function calculates light intensity attenuation throughout the entire model by solving the diffusion equation. The third part of the workflow involves implementing the code developed in the second step for real-time verification using the Software-in-the-Loop (SIL) technique. The SIL S-Function compares the fluence values computed in the second step with the real-time results, ensuring the methodology’s validity and consistency when implemented on the target system.
The first phase focuses on creating an adaptive mesh that aligns with the specific requirements of the target embedded system. Embedded systems are typically resource-constrained compared to conventional computers, making it essential to optimize the mesh generation process. The mesh is initially generated from COMSOL Multiphysics, or alternatively, from medical images that provide detailed geometric data. The adaptive mesh generator developed using the S-Function Builder ensures that the mesh can be adjusted dynamically based on the computational limitations and precision requirements of the embedded target.
In the second phase, the Finite Element Method (FEM) is applied to compute the fluence as a function of arclength throughout the model. The fluence computing S-Function is used to calculate light intensity attenuation across the domain. A point light source is positioned near the RBCs, and the interaction of light with blood and RBCs is examined by solving the diffusion equation. This step models how light is absorbed and scattered in the system, providing the fluence distribution.
In the second phase of the workflow, the primary focus is on computing the fluence distribution across the model, specifically in relation to the interaction of light with the blood and red blood cells (RBCs). This is achieved by applying the Finite Element Method (FEM), which provides a robust framework for solving complex diffusion equations and modeling how light intensity attenuates over arclength. The fluence computing S-Function is used to calculate light intensity attenuation across the domain. To begin, a point light source is positioned near the RBCs within the capillary model, simulating photon beam emission into the biofluid domain and the interaction of light with blood, and the RBCs are examined by solving the diffusion equation. This step models how light is absorbed and scattered in the system, providing the fluence distribution. The computational process in this phase involves solving the diffusion equation, which models the light’s behavior as it interacts with both the blood flow and the RBCs.
The fluence computing S-Function, developed in this phase, computes the attenuation of the light as it propagates through the capillary geometry, with specific focus on the absorption and scattering effects by RBCs. The mesh created in Phase 1 provides the spatial discretization for the computational domain, which is crucial for accurately solving the diffusion equation. This discretization helps model the local variations in optical properties, including absorption and scattering, across the tissue and blood flow.
The computational output from this phase yields fluency as a function of arclength, which provides detailed insights into how light is absorbed at different positions within the capillary and how it interacts with the RBCs. By considering multiple wavelengths (660 nm, 770 nm, 850 nm, 950 nm), this phase allows for a thorough analysis of wavelength-dependent absorption profiles, helping to understand how different wavelengths might impact therapeutic or diagnostic outcomes, such as phototherapy or optical imaging.
The third phase of the workflow focuses on implementing the code developed in the second phase for real-time verification of the proposed methodology. The Software-in-the-Loop (SIL) technique is used to integrate the developed code into the embedded system. This phase is critical as it bridges the gap between the computational model developed in Phase 2 and the real-time constraints of an embedded system. The results are compared with the fluence values obtained in the second phase to demonstrate the consistency and accuracy of the workflow while ensuring it meets real-time constraints.
The result of Phase 3 is a robust real-time embedded system capable of computing fluence values in real-time, with consistent accuracy compared to the simulation results from Phase 2. This phase confirms that the workflow, developed with the S-Function Builder, is not only computationally feasible but also practical for real-time applications, such as in medical diagnostics or therapeutic treatments involving light-based technologies.
2.1. Mesh Generation
The first step in the proposed workflow involves the generation of mesh data for the capillary model. These data, crucial for the subsequent processing and target system implementation, can be sourced from two primary inputs: COMSOL Multiphysics and medical imaging data. Both methods enable the creation of a mesh that represents the geometric and physical properties of the capillary and red blood cells (RBCs) within the bloodstream, providing the foundation for simulating the absorption of light by RBCs in the capillary.
2.1.1. Mesh Generation from COMSOL Multiphysics
COMSOL Multiphysics is a powerful finite element modeling tool that can be used to generate detailed mesh data from a geometric model. For this workflow, COMSOL serves as the first tool for designing the 2D capillary model. The process of mesh generation begins with the design of the capillary geometry, which includes defining the dimensions and structure of the vessel and the RBCs within it. The geometry is then discretized into smaller components using a triangular mesh, which is the preferred method for complex geometries such as the capillary.
Once the geometry is established, the mesh is created by dividing the region into triangular elements. Each element represents a small part of the domain that will be solved using Finite Element Methods. The mesh generation process in COMSOL allows for adaptive refinement, where the mesh can be densified in areas with high gradients or complex interactions (such as near the RBCs or the vessel walls) and coarser in less critical areas. This adaptive approach ensures an efficient balance between computational resources and accuracy.
Figure 2 presents the principle of mesh generating from COMSOL or medical image.
The output from COMSOL consists of four essential files:
Nodes file: Contains the coordinates of each node in the mesh. Each node represents a point in the geometric model where the solution is computed.
Elements file: Specifies the range of each triangular component of the mesh, detailing which nodes form each element.
Boundary conditions file: Lists all the nodes at the boundaries of the geometry, crucial for defining boundary conditions in the finite element analysis.
Normal file: Provides the normal vectors for each boundary element, necessary for applying boundary conditions such as flux and gradients.
These files are exported from COMSOL and are used by the S-Function Builder side Simulink/MATLAB software version 2024a. The S-Function Builder processes the mesh data and ensures it is compatible with the computational target’s architecture, considering limitations like memory capacity and processing speed.
2.1.2. Mesh Generation from Medical Image Data
The S-Function Builder integrates the image processing workflow into the proposed methodology to facilitate the generation of adaptive mesh data from medical images. The image processing consists of the following steps, which are automated and implemented in the S-Function Builder:
Figure 3 presents the flowchart of image processing.
Preprocessing the Medical Image
The preprocessing stage ensures the input medical image is optimized for segmentation. The operations are performed as follows:
Gaussian Filter: Smooths the image to reduce noise while preserving structural details.
Image Normalizer: Standardizes pixel intensities for consistent processing.
Grayscale Converter: Converts the image to grayscale to simplify subsequent operations.
Segmentation of the Capillary and Red Blood Cells (RBCs)
Segmentation isolates the regions of interest (capillary and RBCs) using the following:
Thresholding: Identifies regions of varying intensity corresponding to capillaries and RBCs.
Edge Detection: Detects boundaries using gradient-based operators.
Segmentation of Boundaries: Extracts the contours of capillaries and RBCs for further processing.
Mesh Generation
From the extracted contours, the S-Function Builder generates a structured mesh:
Discretize Contour: Breaks down the contour into discrete points.
Create 2D Triangular Elements: Generates triangular elements to form the mesh, ensuring compatibility with the computational model.
Integration with S-Function Builder
The final step integrates the image processing pipeline into the S-Function Builder:
Import Image Data: Loads medical image data for processing.
Segmentation and Mesh Generation: Executes the preprocessing, segmentation, contour extraction, and meshing steps.
Export Mesh Data: Generates files (nodes, elements, boundaries, and normal) for use in computational simulations.
2.1.3. Mesh Generation for Target System
After the mesh is generated using either COMSOL or medical image data, it is imported into the S-Function Builder, where it is further processed to ensure compatibility with the target system. The S-Function Builder’s role is to generate the four essential files that are required for the finite element analysis and to adapt the mesh to the specific requirements of the target architecture. This includes the following:
Optimizing mesh density: The S-Function adjusts the mesh density based on the computational constraints of the embedded target system.
Data structuring: The mesh data are structured into an efficient format that can be quickly accessed during runtime, ensuring that the target system can process the data in real-time.
Boundary condition assignment: Boundary conditions, including fluxes and gradients, are applied based on the mesh’s geometry and the model’s physical parameters.
These outputs serve as inputs for the next steps in the workflow, enabling the computation of fluence and the simulation of light absorption by the RBCs within the capillary.
2.2. Model Development
A 2D geometrical model is chosen for solving fluid–structure interactions (FSIs) and light propagation in this study due to its computational efficiency and ability to accurately capture key phenomena, such as RBC motion in capillaries. While 3D models provide more detail, they are computationally expensive and time-consuming. In contrast, the 2D model simplifies geometry while still effectively representing critical local interactions, such as RBC inter-interaction with plasma suspension and light absorption. This approach offers a balance between accuracy and resource efficiency, making it well suited for the study of RBC behavior and light-tissue interactions in biomedical applications [
25,
33]. Although capillaries are inherently three-dimensional, the 2D approach provides a practical balance between accuracy and resource efficiency, making it well suited for studying RBC behavior and light-tissue interactions in biomedical applications [
34].
The proposed model is composed of three main components: the vessel representing the region where the blood and its component (RBCs) inter-interact. It also focuses on microcirculation; the vessel has a diameter of fewer than 200 μm, and the blood is heterogenous, which is assumed to be a suspension of plasma with platelets neglecting the presence of white blood cells (due to its lower concentration) [
35].
Several diseases are related to the dysfunction of red blood cells (RBC). To mitigate risks, it is necessary to study their physical-mechanical characteristics. RBC behavior and capillary diameter are strongly correlated. If the diameter exceeds 200 μm, the blood is considered homogeneous; otherwise, it is considered heterogeneous, composed of particles in interaction.
This study introduces a numerical approach for RBC photon absorption and its mutual interaction with biofluid inside the capillary. A 2D geometric model of RBCs is developed within capillaries, where blood is viewed as a laminar and incompressible fluid interacting with RBCs.
2.2.1. The Geometry and Boundary Conditions
The proposed model consists of three main components: The vessel, representing the region where blood and its components (RBCs) interact. Focusing on microcirculation, the vessel has a diameter of less than 200 μm, making the blood heterogeneous. The vessel geometry, illustrated in
Figure 4, consists of a 2D model with a diameter of 10 μm and a bifurcation.
2.2.2. Microvessels and Blood Flow
The biofluid is modeled as a suspension consisting mainly of platelets and plasma. White blood cells are neglected due to their lower concentration. The effective viscosity and density of the suspension are determined using the following relations [
36]:
where
μbf is the basic fluid viscosity,
is the volume concentration,
is the density of the fluid, and
is the density of particles. At a temperature of 37 °C, the effective viscosity and density are as follows:
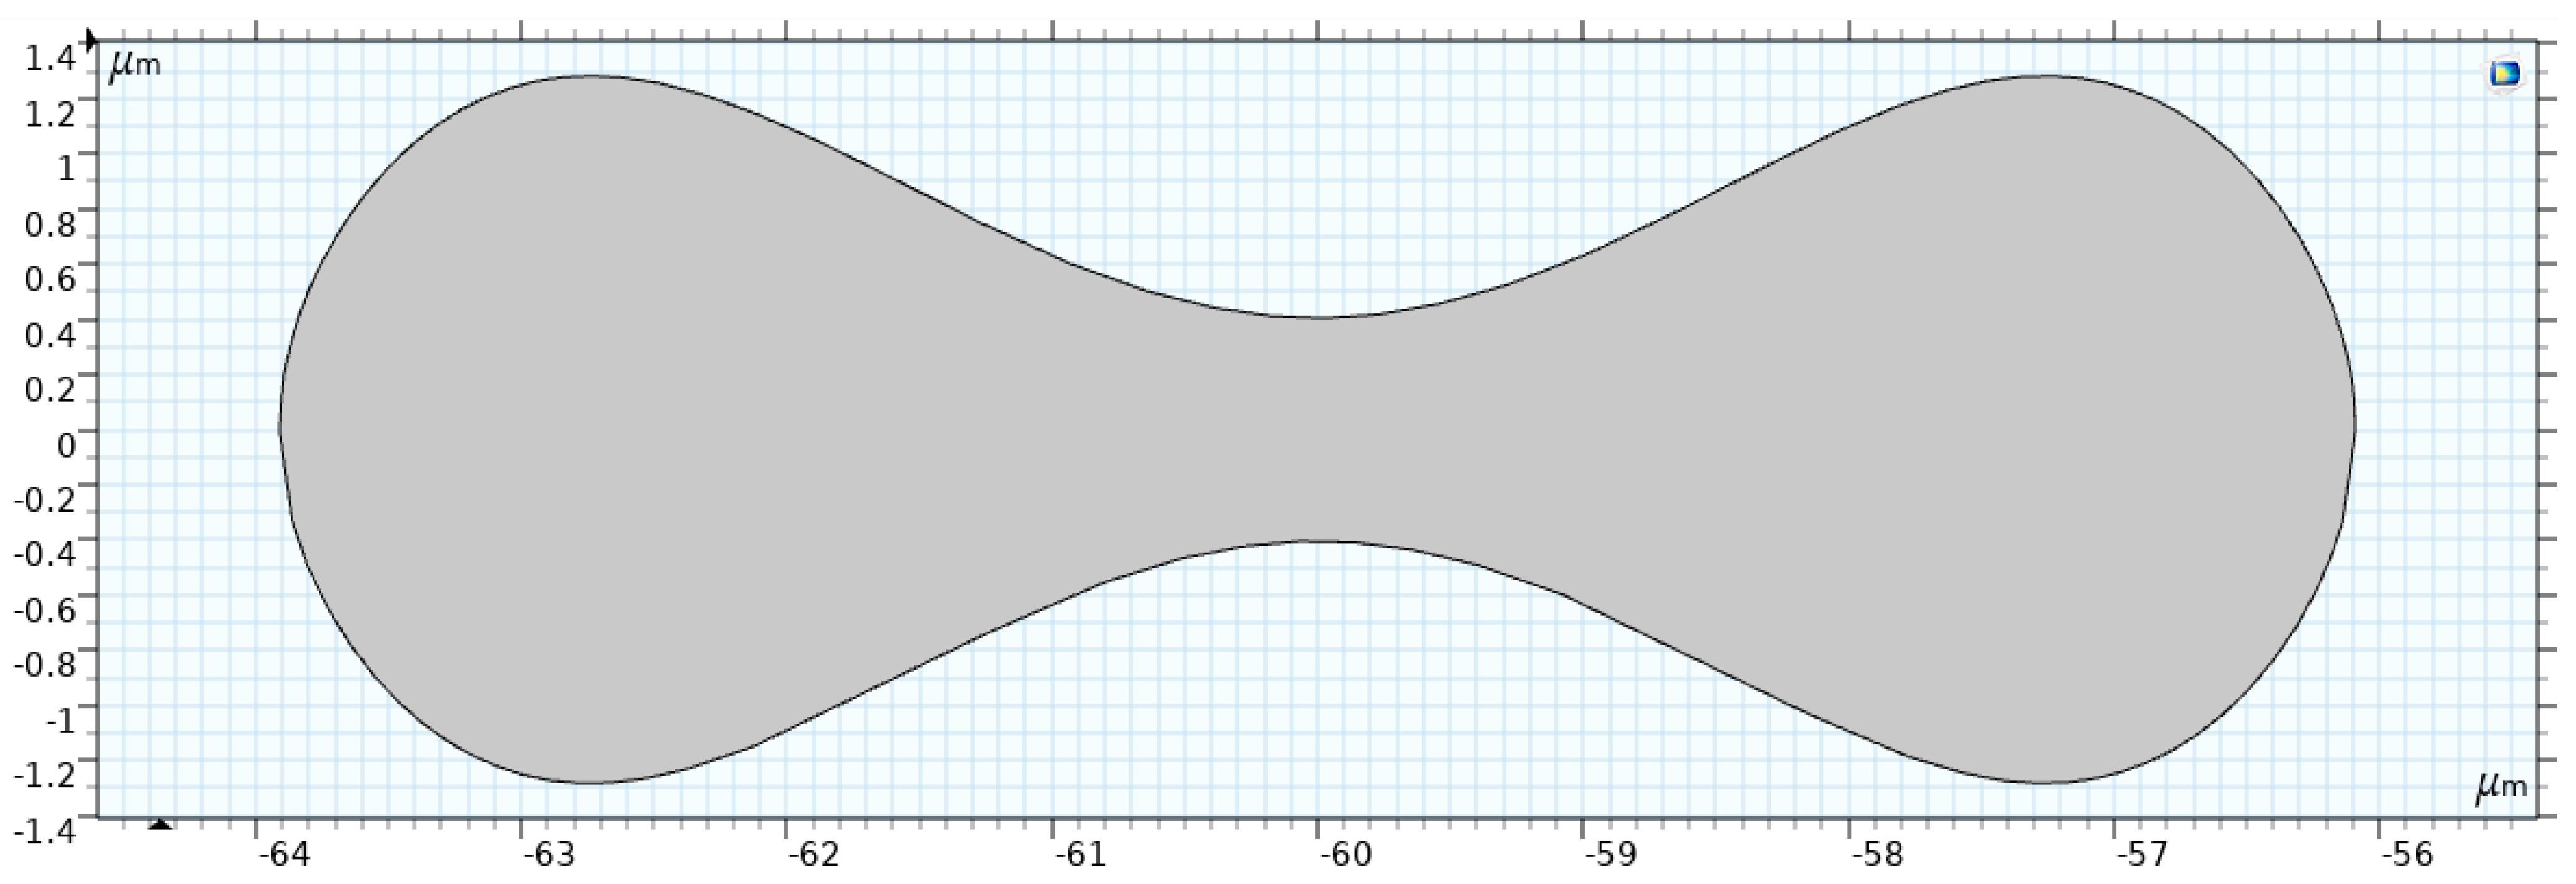
2.2.3. RBC Shape
Figure 5 shows the RBC shape under normal conditions, which is a biconcave discoid with a diameter of
. Evans and Fung [
37] proposed the following relation to describe the RBC shape.
where
x =
,
= 0.207,
= 2.002,
= −1.122, and
= 3.91 µm is the typical radius of a human RBC.
Geometric Interpretation
Equation (3) models the biconcave profile of the RBC, characterized by the following features:
Symmetry: The shape is symmetric about the -axis.
Biconcave Shape: The term accounts for the concave depression in the central region, which gives the RBC its characteristic double-dip structure.
Curvature: The polynomial in adjusts the depth and curvature of the concavity, controlled by the coefficients
The actual dimensions of the RBC can be obtained by multiplying the normalized coordinates
:
Applications in Blood Flow Modeling
This RBC shape representation is critical for various computational studies, including the following:
Optical Analysis: The biconcave shape significantly affects how RBCs scatter and absorb light, which is essential for light–tissue interaction studies.
Fluid–Structure Interaction (FSI): The geometry influences the RBC’s deformation under plasma flow stress. Its biconcave profile enhances flexibility, enabling the cell to navigate through narrow capillaries.
Hemodynamics: The RBC’s drag and lift forces during flow are determined by its shape, impacting overall blood rheology.
Fluid–Structure Interaction (FSI)
This section presents the mathematical formulation and boundary conditions necessary for resolving the bio-problem, including cell motion and photon absorption. The main equations include the blood flow model, the solid material model (RBC), and fluid–structure interaction equations. The absorption of photons by the RBC is modeled using the Helmholtz equation.
The interaction between the RBC and the blood flow is governed by the continuity of velocity and stress at the interface:
where
is the stress tensor, and
is the normal vector to the interface.
Boundary Conditions
In our simulation, the velocity at the inlet is considered uniform equal to
at the two outlets; we applied a pressure
and, at the walls, we used a no-slip boundary condition [
23]. Concerning the solid part of the system, the position of the RBC is randomly chosen; its initial value of displacement and velocity are both equal to zero. The boundary conditions for the simulation are as follows:
At the inlet, uniform velocity: .
At the outlets, pressure: .
At the walls, no-slip boundary condition.
For the solid part, the RBC position is randomly chosen, with initial displacement and velocity both equal to zero.
Bio-Fluid Model
The interaction between blood and RBC is modeled using the Navier–Stokes equations for an incompressible, laminar flow. The governing equations are as follows:
where
Solid Model (RBC)
The RBC is treated as a deformable solid governed by the equations of linear elasticity. The motion equation is as follows:
where
is the stress tensor, defined as follows:
Here:
: density of the RBC,
: displacement of the solid,
: external force acting on the solid.
2.3. Finite Element Method (FEM) for the Diffusion Equation
The Finite Element Method (FEM) is employed as a numerical solution to the diffusion equation, which models the transport of light within turbid biological tissues. The diffusion approximation simplifies the Radiative Transfer Equation (RTE) when scattering over absorption, a condition often met in biological tissues like skin or blood.
2.3.1. Governing Equation for Light Diffusion
The simplified diffusion equation in the absence of a source is expressed as follows:
where
is the light fluence rate (intensity) at position “,
is the diffusion coefficient, with as the reduced scattering coefficient,
is the absorption coefficient.
For cases where a light source
is present, the equation becomes
2.3.2. Matrix Formulation for the Diffusion Equation
The weak form of the diffusion equation is as follows:
where
diffusion coefficient,
: absorption coefficient,
S: source term,
: light fluence rate,
: test function.
Discretizing this weak form using FEM leads to the matrix equation:
where
K: Stiffness Matrix, representing diffusion,
M: Mass Matrix, accounting for absorption,
F: Source Vector, representing external light sources,
: Nodal coefficients of fluence.
2.3.3. Matrix Definitions
Stiffness Matrix ()
where
and
are basis functions.
Global System Assembly
The global matrix is assembled as follows:
and the resulting system of equations is as follows:
Numerical Solution
The solution proceeds as follows:
Domain Discretization: The geometric model is divided into triangles finite elements.
Matrix Computation: The stiffness matrix , mass matrix , and source vector are computed element-wise and assembled into the global matrix .
Linear System Solver: A numerical solver (GMRES or conjugate gradient method) is used to solve obtaining , the nodal fluence coefficients.
FEM was applied to a capillary geometry containing an RBC, where scattering and absorption were analyzed. Light fluence distributions were computed for multiple wavelengths, illustrating the impact of optical properties like on light propagation.
This approach demonstrates the efficacy of FEM in solving the diffusion equation, providing insights into light–tissue interactions and supporting the development of non-invasive diagnostic techniques.
2.4. SIL Verification with IoT Integration
The Software-in-the-Loop (SIL) verification process incorporates an IoT module to enable communication between the real-time embedded system and an external monitoring platform.
The IoT module serves as a bridge, allowing real-time data, such as fluence values and computational performance metrics, to be transmitted to a cloud or local server for monitoring and analysis. This integration ensures seamless verification and performance evaluation under real-world conditions.
2.4.1. Steps for IoT Integration
The SIL verification process with IoT integration involves the following steps:
IoT Module Initialization: The IoT module is configured to establish a secure and reliable connection using a communication protocol; MQTT is used. This setup ensures seamless data exchange between the embedded system and the monitoring platform.
Data Transmission: Key performance metrics, including fluence values and arclength values, are transmitted from the embedded system to the IoT platform. Efficient data compression and buffering mechanisms are employed to handle bandwidth constraints.
Real-Time Monitoring: The IoT platform continuously monitors and logs the transmitted data, providing real-time insights into system performance, verification results, and computational accuracy.
Integration with SIL: The IoT module integrates with the S-Function, enabling seamless data exchange during SIL simulations. This integration allows the verification of the system by comparing transmitted data with offline results and ensuring adherence to real-time constraints.
2.4.2. S-Function Builder Code for IoT Integration
Figure 6 presents the MATLAB S-Function Builder framework for integrating an IoT module into the system. The implementation uses the MQTT protocol for lightweight and efficient communication. First, the SIL S-Function allows the dataset of the fluence to be sent vis IoT broker. Next, the IoT S-Function prepares the dataset for the MQTT broker and sends it to web interface.
2.4.3. Features of the IoT-Integrated SIL Framework
MQTT Communication: The IoT module uses the MQTT protocol for lightweight and efficient communication. Data are published on a specified topic that can be subscribed to by monitoring tools or platforms.
Real-Time Data Transmission: Fluence values and simulation metadata are transmitted in real time to the IoT platform.
Scalable Monitoring: The system supports multiple clients for monitoring, such as cloud-based dashboards or local servers.
Verification and Analysis: The IoT platform logs the transmitted data for SIL verification by comparing real-time data with offline results, ensuring accuracy and performance consistency.
This IoT-enhanced SIL verification process ensures robust real-time performance monitoring and facilitates comprehensive system evaluation. In the Software-in-the-Loop (SIL) verification phase, the integration of an IoT module provides an efficient framework for monitoring, validating, and optimizing real-time computations performed on the embedded system. This approach ensures robust and scalable verification of the fluence computation workflow. Below is a detailed explanation of the IoT integration process for SIL verification.
2.5. Conceptual Architecture
2.5.1. Embedded System with SIL S-Function
The SIL S-Function executes the fluence computation in real-time, integrating directly with the IoT module.
The S-Function is responsible for solving the diffusion equation and transmitting the results to the IoT module.
2.5.2. IoT Module
Acts as a communication bridge between the embedded system and the cloud platform.
Captures critical parameters, such as fluence values, computation times, and system performance metrics.
Send data packets to the cloud for further analysis.
2.5.3. Cloud Platform
Aggregates and visualizes data in real-time dashboards,
Compares real-time results against reference values from Phase 2,
Triggers alerts if discrepancies or system inefficiencies are detected.
IoT integration into SIL verification enhances the overall robustness and scalability of the workflow, making it suitable for real-world applications. By leveraging real-time data monitoring and advanced analytics, the proposed system achieves both accuracy and efficiency.
3. Results and Discussion
This section examines the application of the proposed workflow, which integrates key stages for designing embedded systems aimed at analyzing blood light absorption. The workflow combines mesh generation for accurate tissue representation, fluence arc-length determination using the Finite Element Method (FEM), and Software-in-the-Loop (SIL) verification to ensure system reliability.
To evaluate the improvements introduced by the workflow, two distinct studies were conducted:
Time-Dependent Study: This study simulates blood laminar flow, solid mechanics, and moving mesh dynamics using Arbitrary Lagrangian–Eulerian (ALE) and fluid–structure interaction (FSI). It provides insights into the velocity and pressure profiles within the capillary and highlights the interaction between plasma suspension and red blood cells (RBCs). This study is crucial for understanding the dynamics of blood flow and RBC mobility in real-time.
Stationary Study: This study focuses on simulating the absorption and scattering of a photon beam by RBCs and blood within the capillary. The Helmholtz equation is employed to analyze light propagation and its interaction with the biological medium. This study offers a deeper understanding of the optical properties of blood and is fundamental to evaluating light–tissue interactions for non-invasive blood diagnostics.
These studies establish a comprehensive foundation for validating and refining the proposed workflow. The results from these studies demonstrate the workflow’s ability to model complex interactions in blood dynamics and light absorption with high accuracy. The discussion explores the improvements introduced by the workflow in terms of precision, computational efficiency, real-time performance, and system reliability, with a particular focus on its applicability in biomedical scenarios, especially for non-invasive blood monitoring and diagnostic applications.
3.1. Mesh Quality and Efficiency
The mesh of the models, as shown in
Figure 7, is generated by the first S-Function Builder in the proposed workflow, utilizing data from a model study conducted on the COMSOL Multiphysics platform. These files are optimized for use in the target architecture, ensuring that they meet the processing capabilities and resource constraints of the embedded system.
3.1.1. Meshing Strategy
The mesh for the developed capillary model, shown in
Figure 7, is generated using a triangular element-based approach. The mesh is structured to capture critical flow dynamics and RBC-plasma interactions, and it is designed with precision to conform to the physical model’s features. The triangular elements allow for flexibility in capturing the geometry’s nuances, especially near boundaries and bifurcations. The grid generation is carried out in a systematic manner to ensure that it aligns with the requirements of the target system. A uniform approach is adopted for the mesh throughout the entire domain, while ensuring that finer resolution is applied to regions where high gradients are expected, such as the interaction zones between RBCs and plasma. This mesh was generated by the S-Function Builder, optimized for the target system’s processing requirements. This mesh captures the capillary’s geometrical features, facilitating an accurate simulation of fluid dynamics.
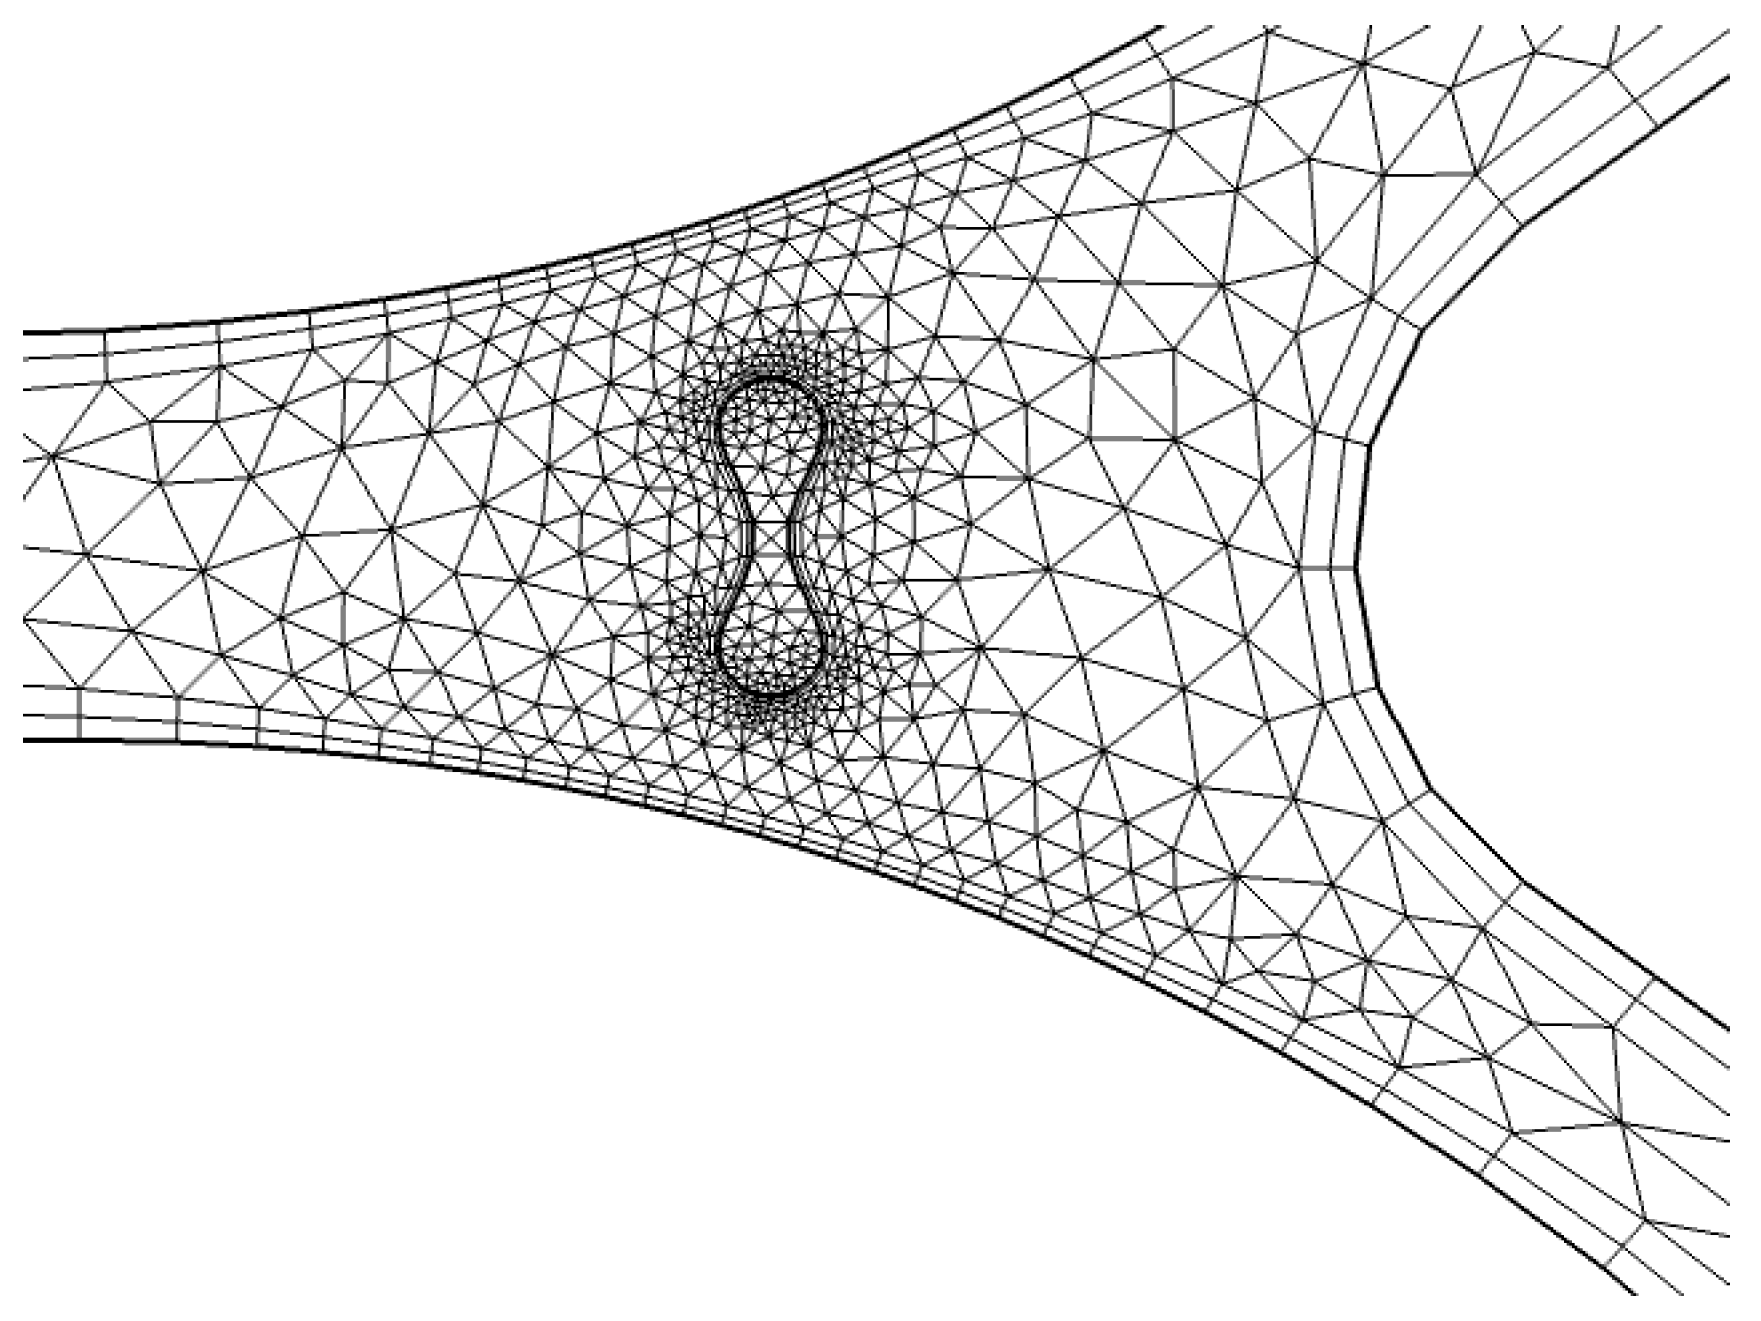
3.1.2. Mesh Details near Boundary and Capillary Wall
To refine the mesh around critical zones, particularly near the capillary wall, we apply a finer resolution. As shown in
Figure 8, triangular elements are used to discretize the geometry near the wall of the capillary. This region is particularly important for accurately modeling the interaction between the fluid (plasma) and RBCs, as well as capturing the shear forces that affect the blood flow. The finer mesh enables better resolution of the gradient in fluid velocities and the forces acting on the RBCs.
3.1.3. Global Mesh and Interaction Zones
A detailed representation of the entire system’s mesh, including the fluid domain and interaction regions, is shown in
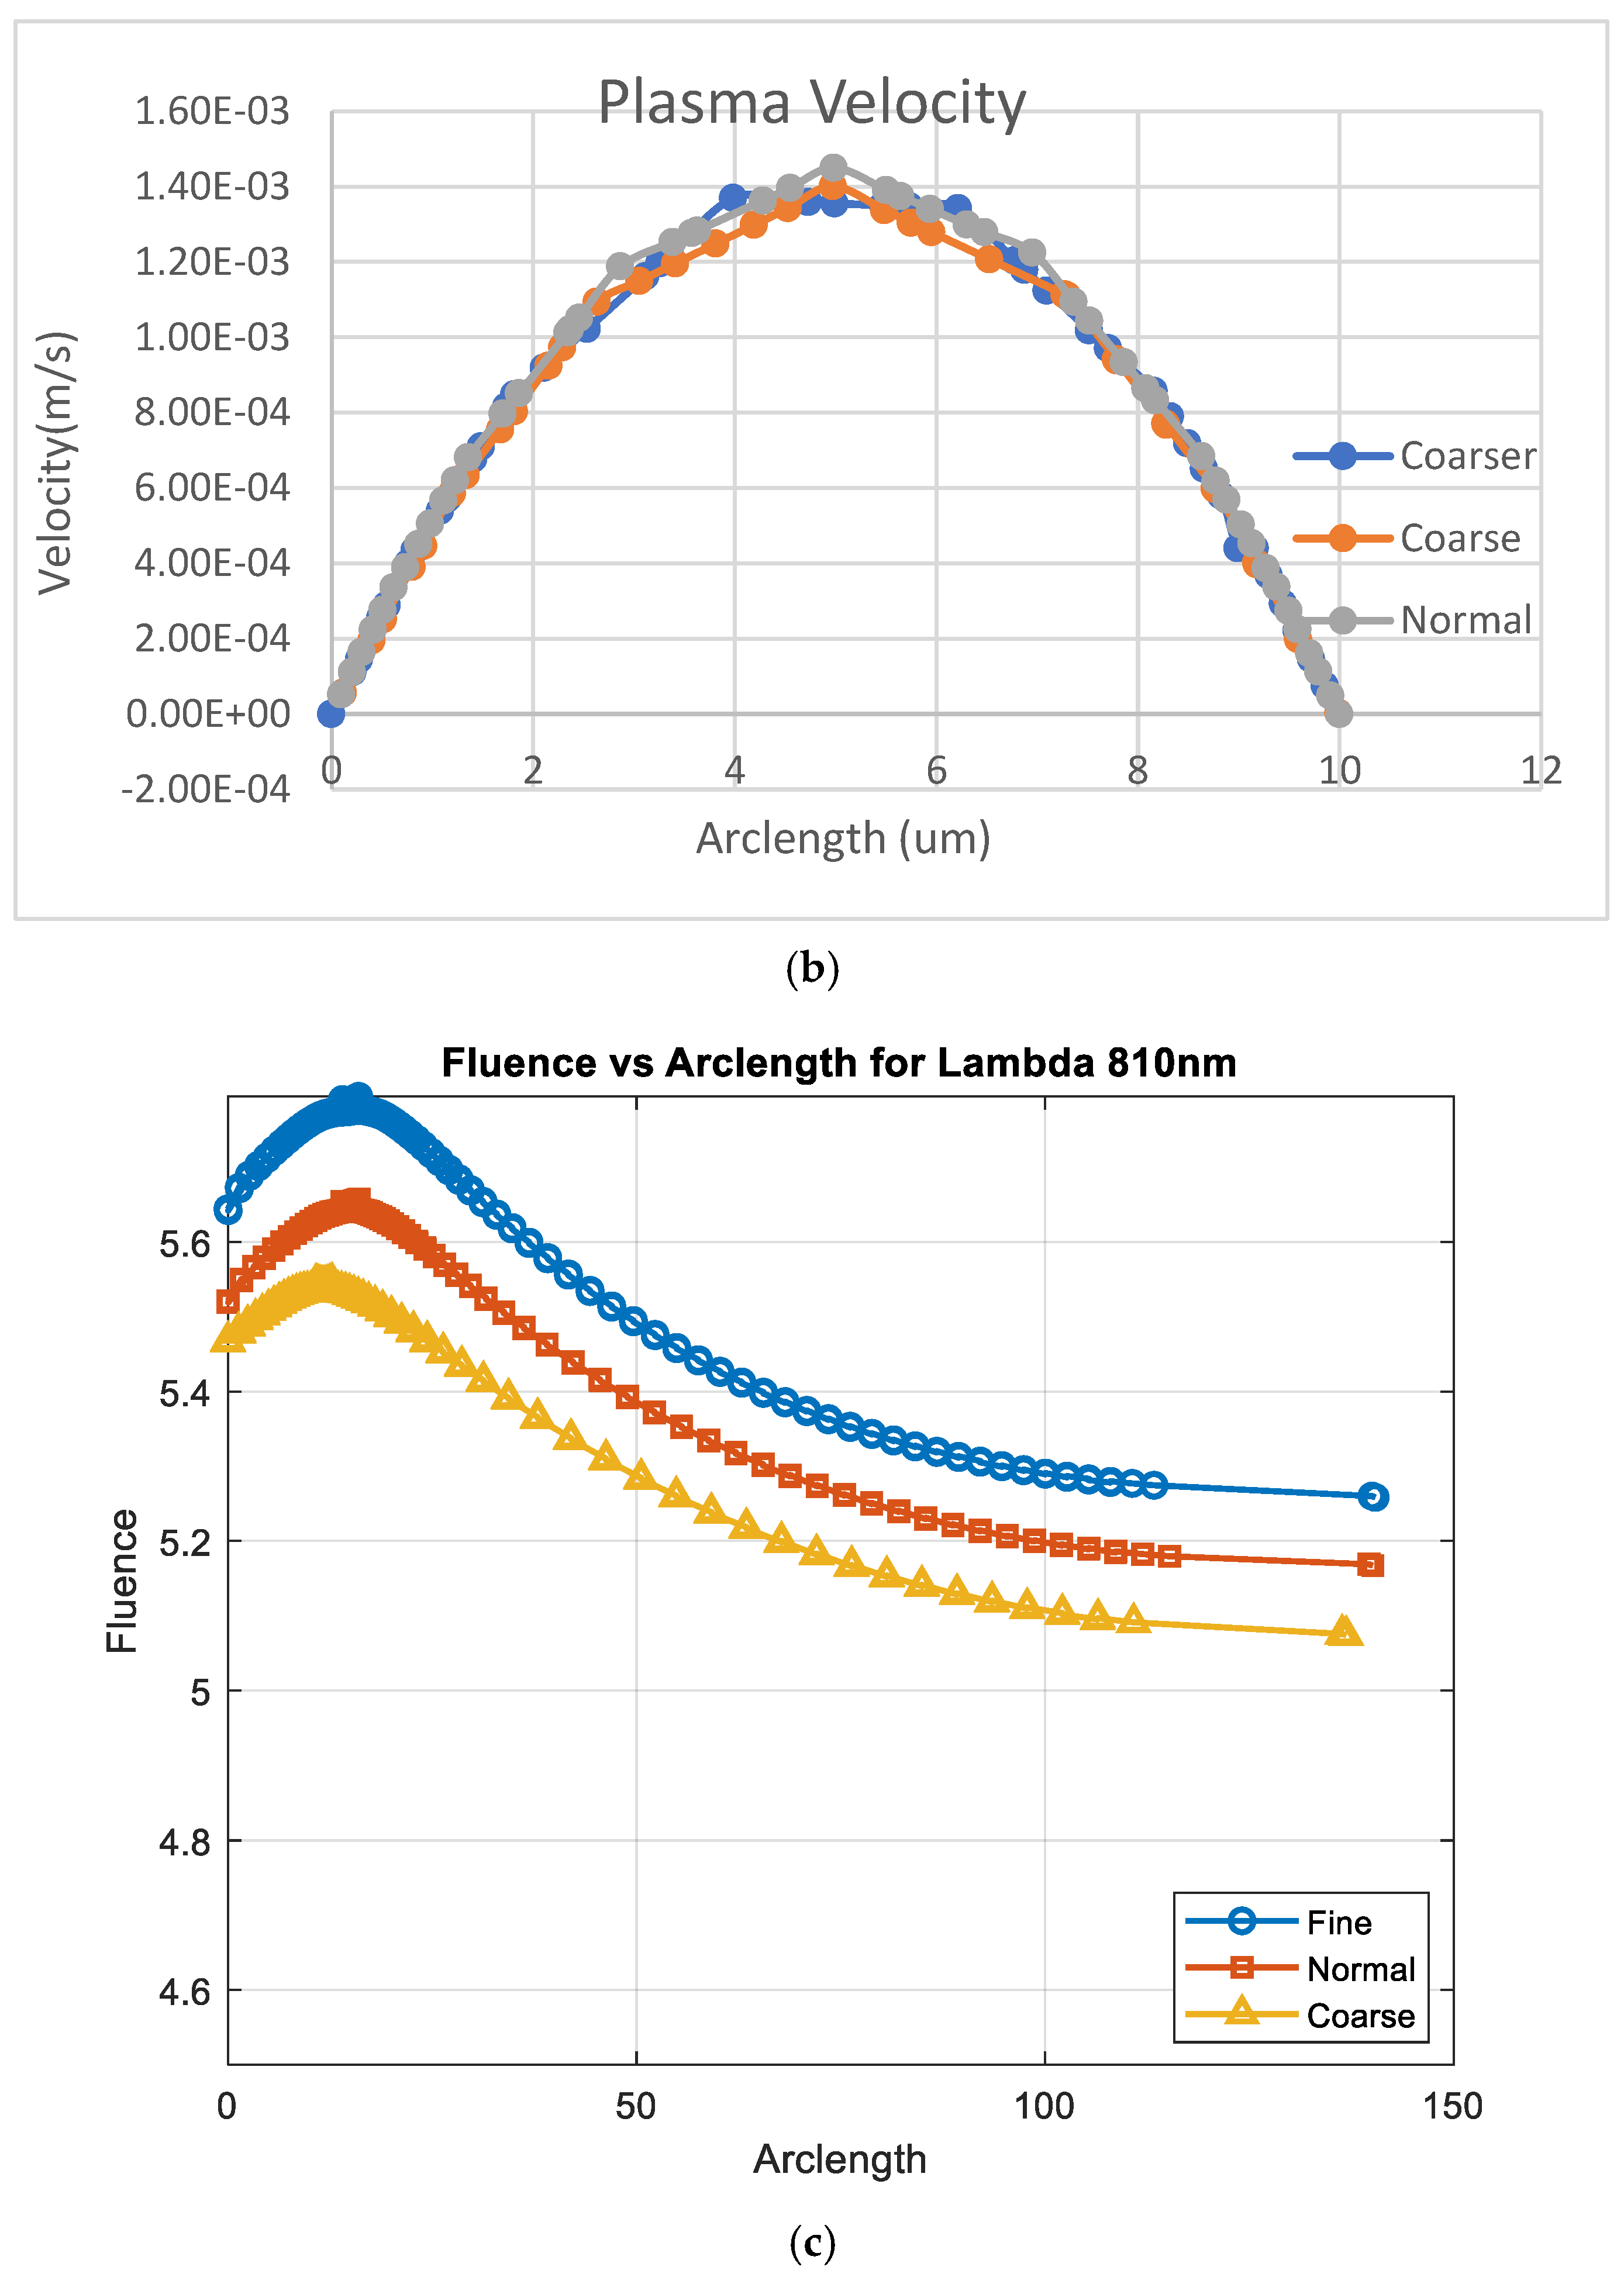
Figure 8. The generated mesh for the capillary model consists of 1780 domain elements and 248 boundary elements. The domain elements capture the interior of the capillary, while the boundary elements define the walls of the capillary and other key interfaces. A convergence test was also performed with three different numbers of mesh elements, as shown in
Appendix A.
In
Figure 8, a more refined mesh is shown near the interaction zone between the RBCs and plasma. This is a critical area where the biofluid properties, such as viscosity and density, change due to the presence of RBCs. The finer mesh in this zone improves the accuracy of simulations, especially in capturing the diffusion and absorption of light in the RBCs and the surrounding plasma. The detailed mesh ensures that the model can simulate the physical phenomena occurring at the capillary wall and within the interaction zone with high accuracy.
3.1.4. Mesh Quality Considerations
The quality of the mesh is paramount for the success of simulations, particularly when dealing with complex biological fluids like blood and its components. A well-constructed mesh ensures that the simulation results are accurate and reliable. In this study, the mesh is designed with a focus on minimizing element distortion and ensuring that geometry is accurately represented. The triangular elements, while simple, provide the necessary flexibility to adapt to the complex shape of the capillary, especially near the boundaries and at the bifurcations.
In addition, mesh efficiency is considered, with a focus on reducing computational costs while maintaining accuracy. The mesh generation process is optimized to work with the available resources of the target embedded system. By balancing the mesh resolution and the target architecture’s processing constraints, the generated mesh ensures that simulations can run in real-time or near-real-time for practical applications.
The mesh generation step plays a critical role in accurately simulating the complex behavior of RBCs and plasma within the capillary. The use of triangular elements in a structured grid allows for a precise representation of the system’s geometry, especially near critical interaction zones. The detailed mesh generation process ensures that the target architecture can efficiently handle the simulation tasks, providing accurate results for the study of blood flow and light absorption in capillaries.
3.1.5. Moving Mesh
In our simulation, the fluid domain undergoes a geometrical change, modeled using the Arbitrary Lagrangian–Eulerian (ALE) approach. To examine the blood laminar flow, we applied a deforming moving mesh where the Navier–Stokes equations are resolved. The Yeoh smoothing method is used to compute the deformation of the domain.
Figure 9 presents the moving mesh and illustrates the displacement of the RBCs in interactions with the physical properties of the plasma inside the capillary.
3.1.6. Velocity
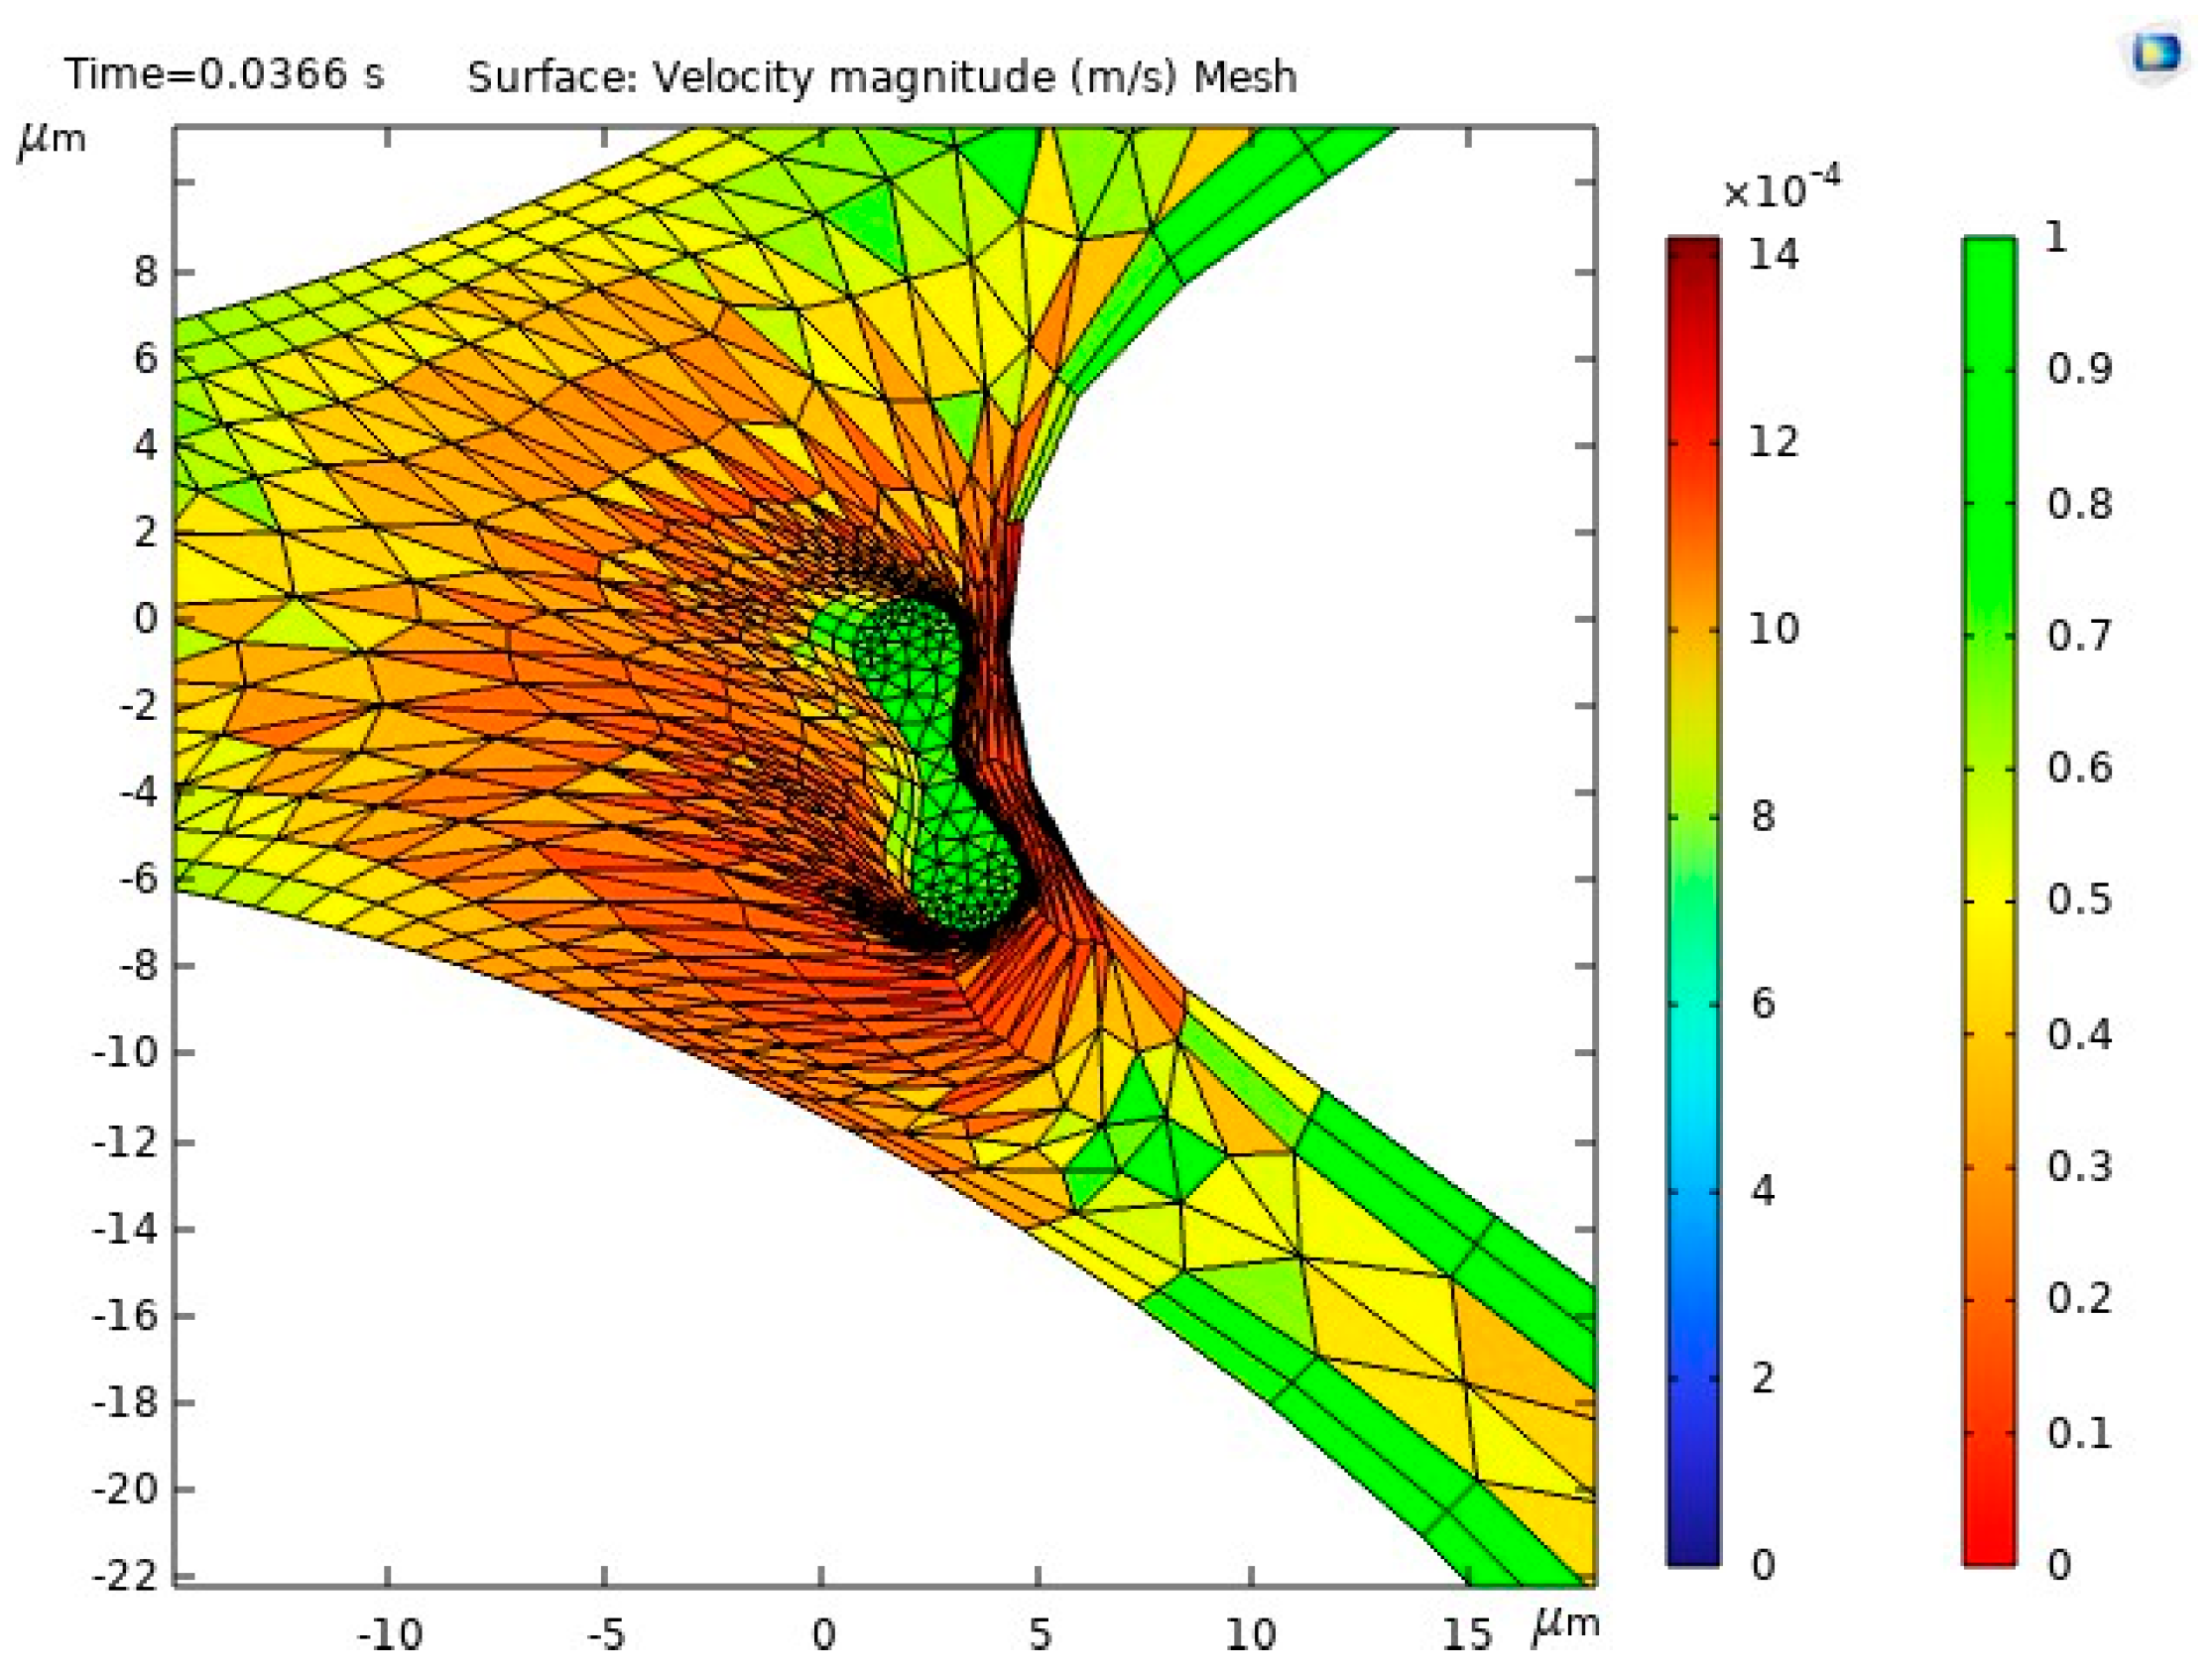
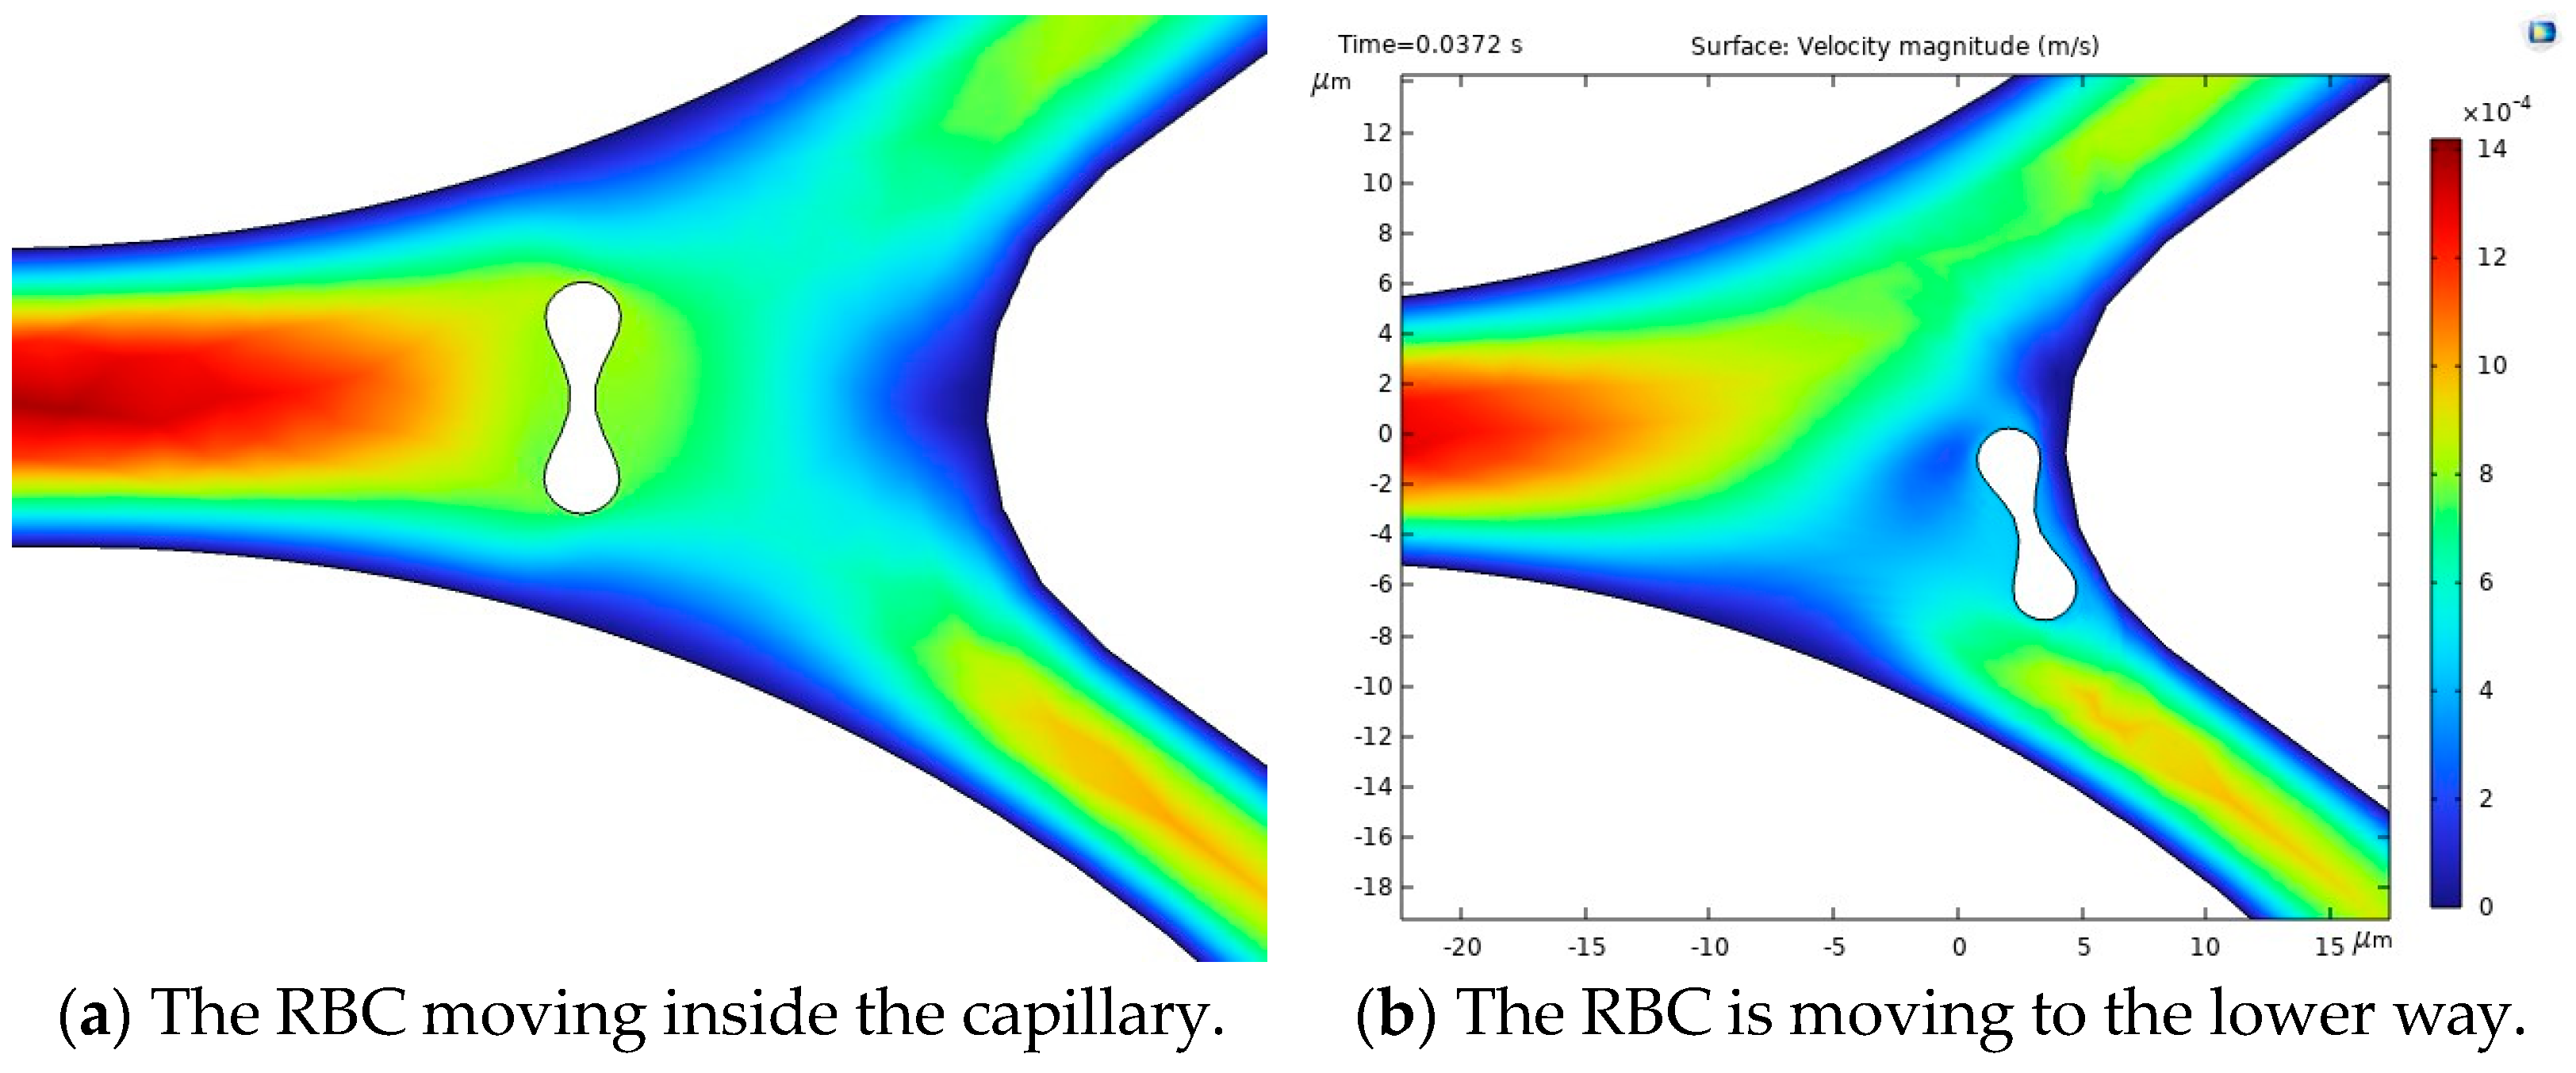
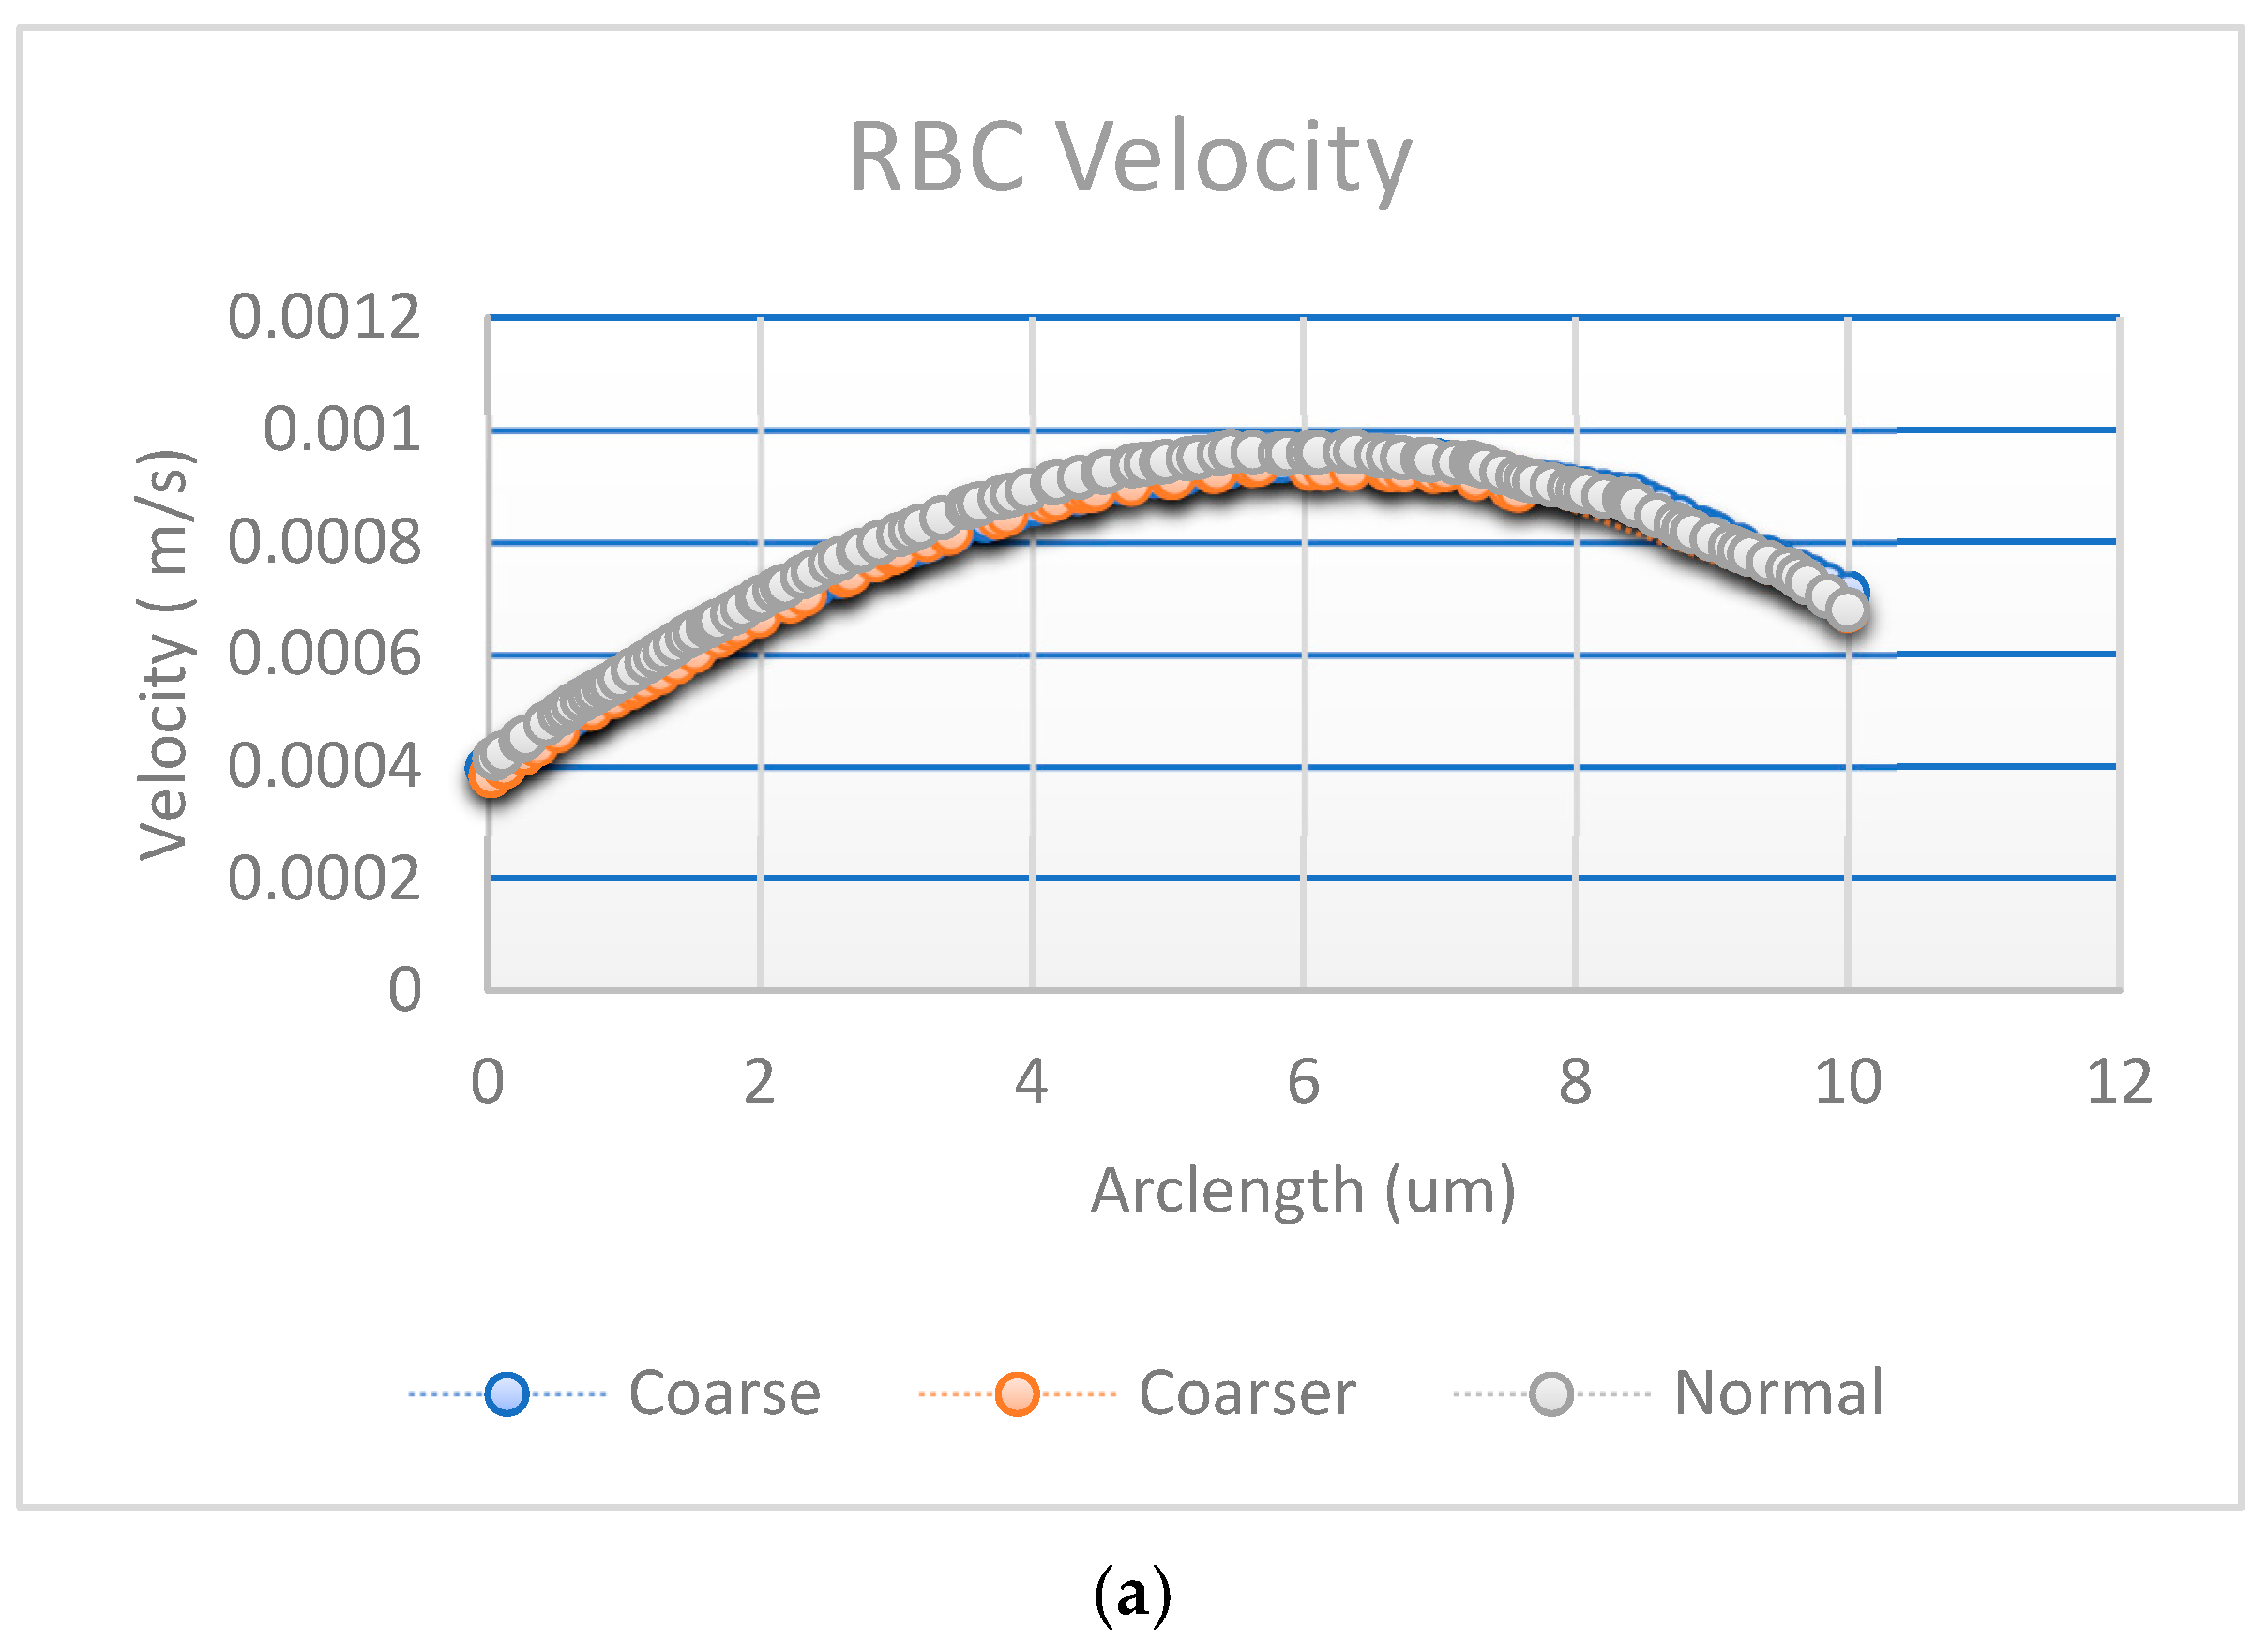
The results of the first study, including the motion of the RBC, velocity and behavior of RBC inside the capillary, are shown in
Figure 10.
Figure 10a illustrates the blood flow velocity field and the RBC motion inside the capillary.
Figure 10b shows the influence of flow force on the RBC, guiding it toward the lower pathway of the bifurcation.
The stress in the critical zone of the capillary is highlighted in red.
3.2. Fluence and Absorption Analysis
The absorption of a photon beam with a wavelength equal to 660 nm is discussed in this paragraph. The ALE method is used to illustrate the absorption and scattering inside a capillary, and the Helmholtz equation and Beer–Lambert law are examined. Two results are illustrated: Firstly, the dot source is located on the RBC, and we measure the light attenuation through the cell. Secondly, the dot source is placed above the RBC on the capillary and we measure the attenuation of light from the blood flow to the RBCs.
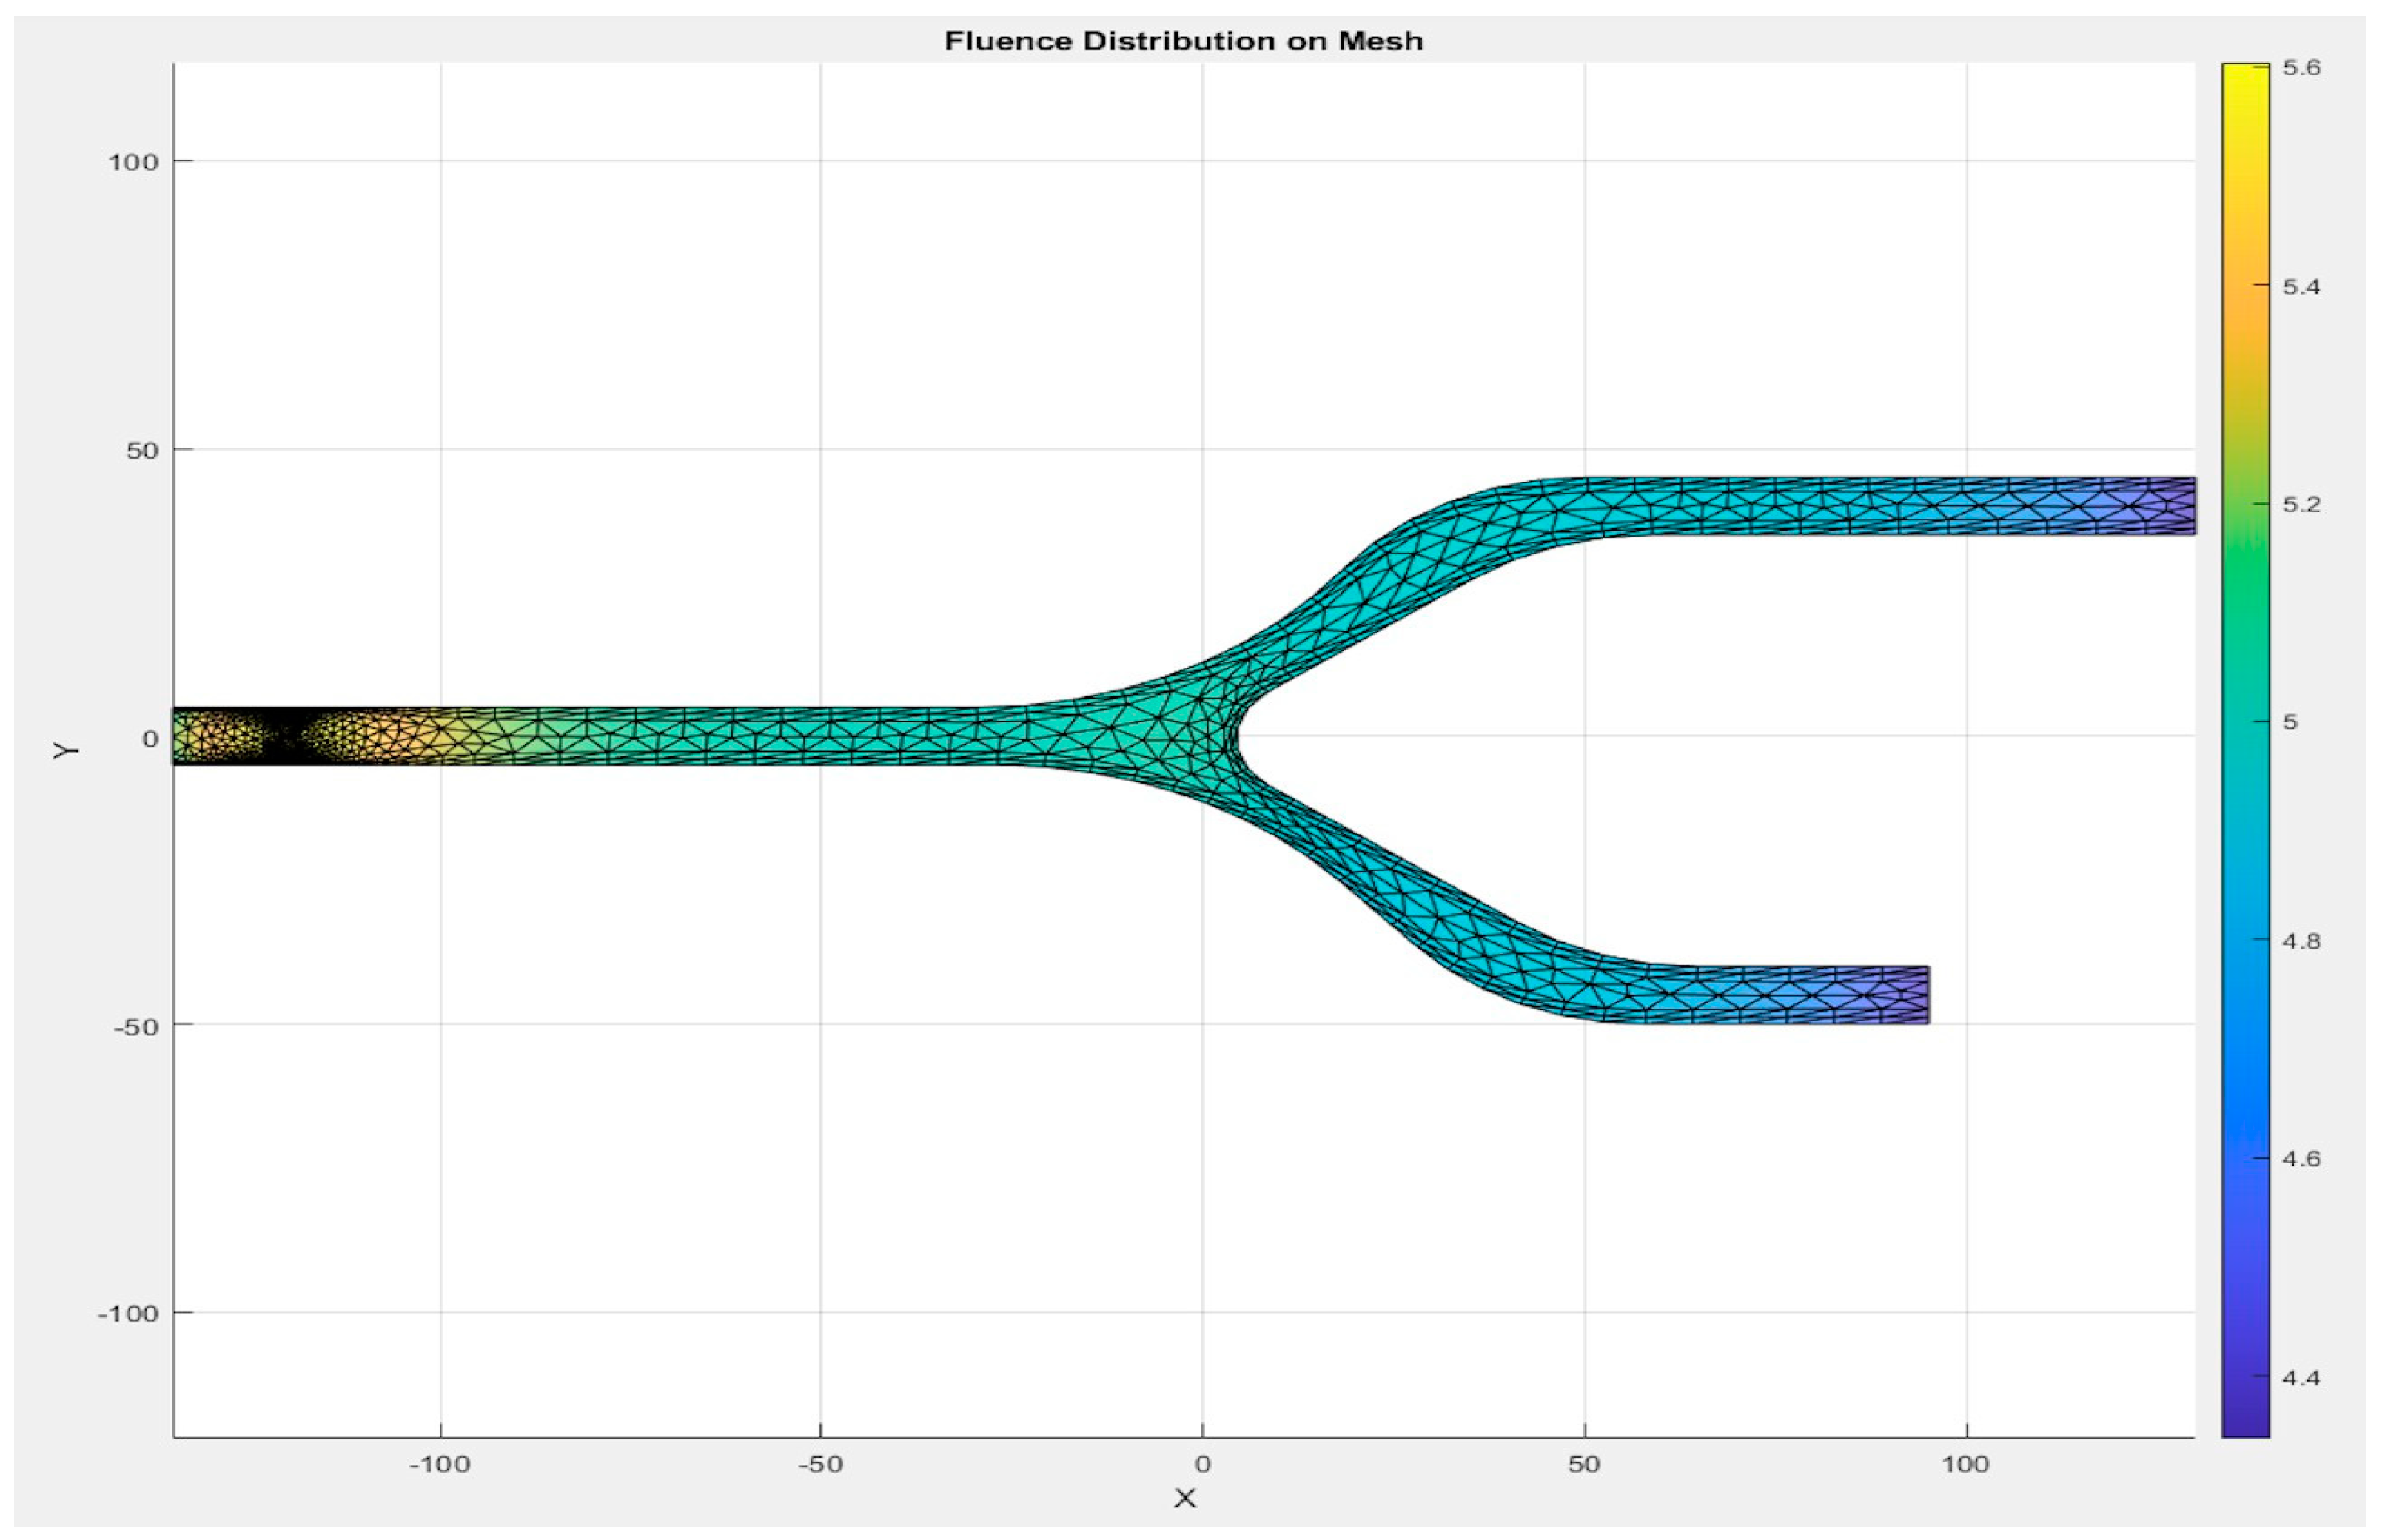
Figure 11 illustrates the intensity absorption by the model. As shown, the intensity is attenuated through the length of the bifurcation.
This section presents the results of fluence vs. arclength. A set of wavelengths as mentioned in
Table 1 gives the absorption and scattering properties of blood and
Table 2 presents optical properties of RBCs.
The determination of fluence is determined from data of RBC and blood optical properties.
3.3. Simulation Parameters
The blood properties used in the simulations are presented in
Table 3. The density, viscosity, and elasticity parameters are chosen based on experimental data.
The results from the second study, including the fluence vs. arclength for the absorption and scattering of the photon beam within the model, and the Software-in-the-Loop (SIL) verification for fluence values, highlight the influence of multi-wavelengths on the fluence distribution. Experimental results were obtained for a set of wavelengths: 660 nm, 770 nm, 850 nm, and 950 nm. The first result for
λ = 660 nm is shown in
Figure 12.
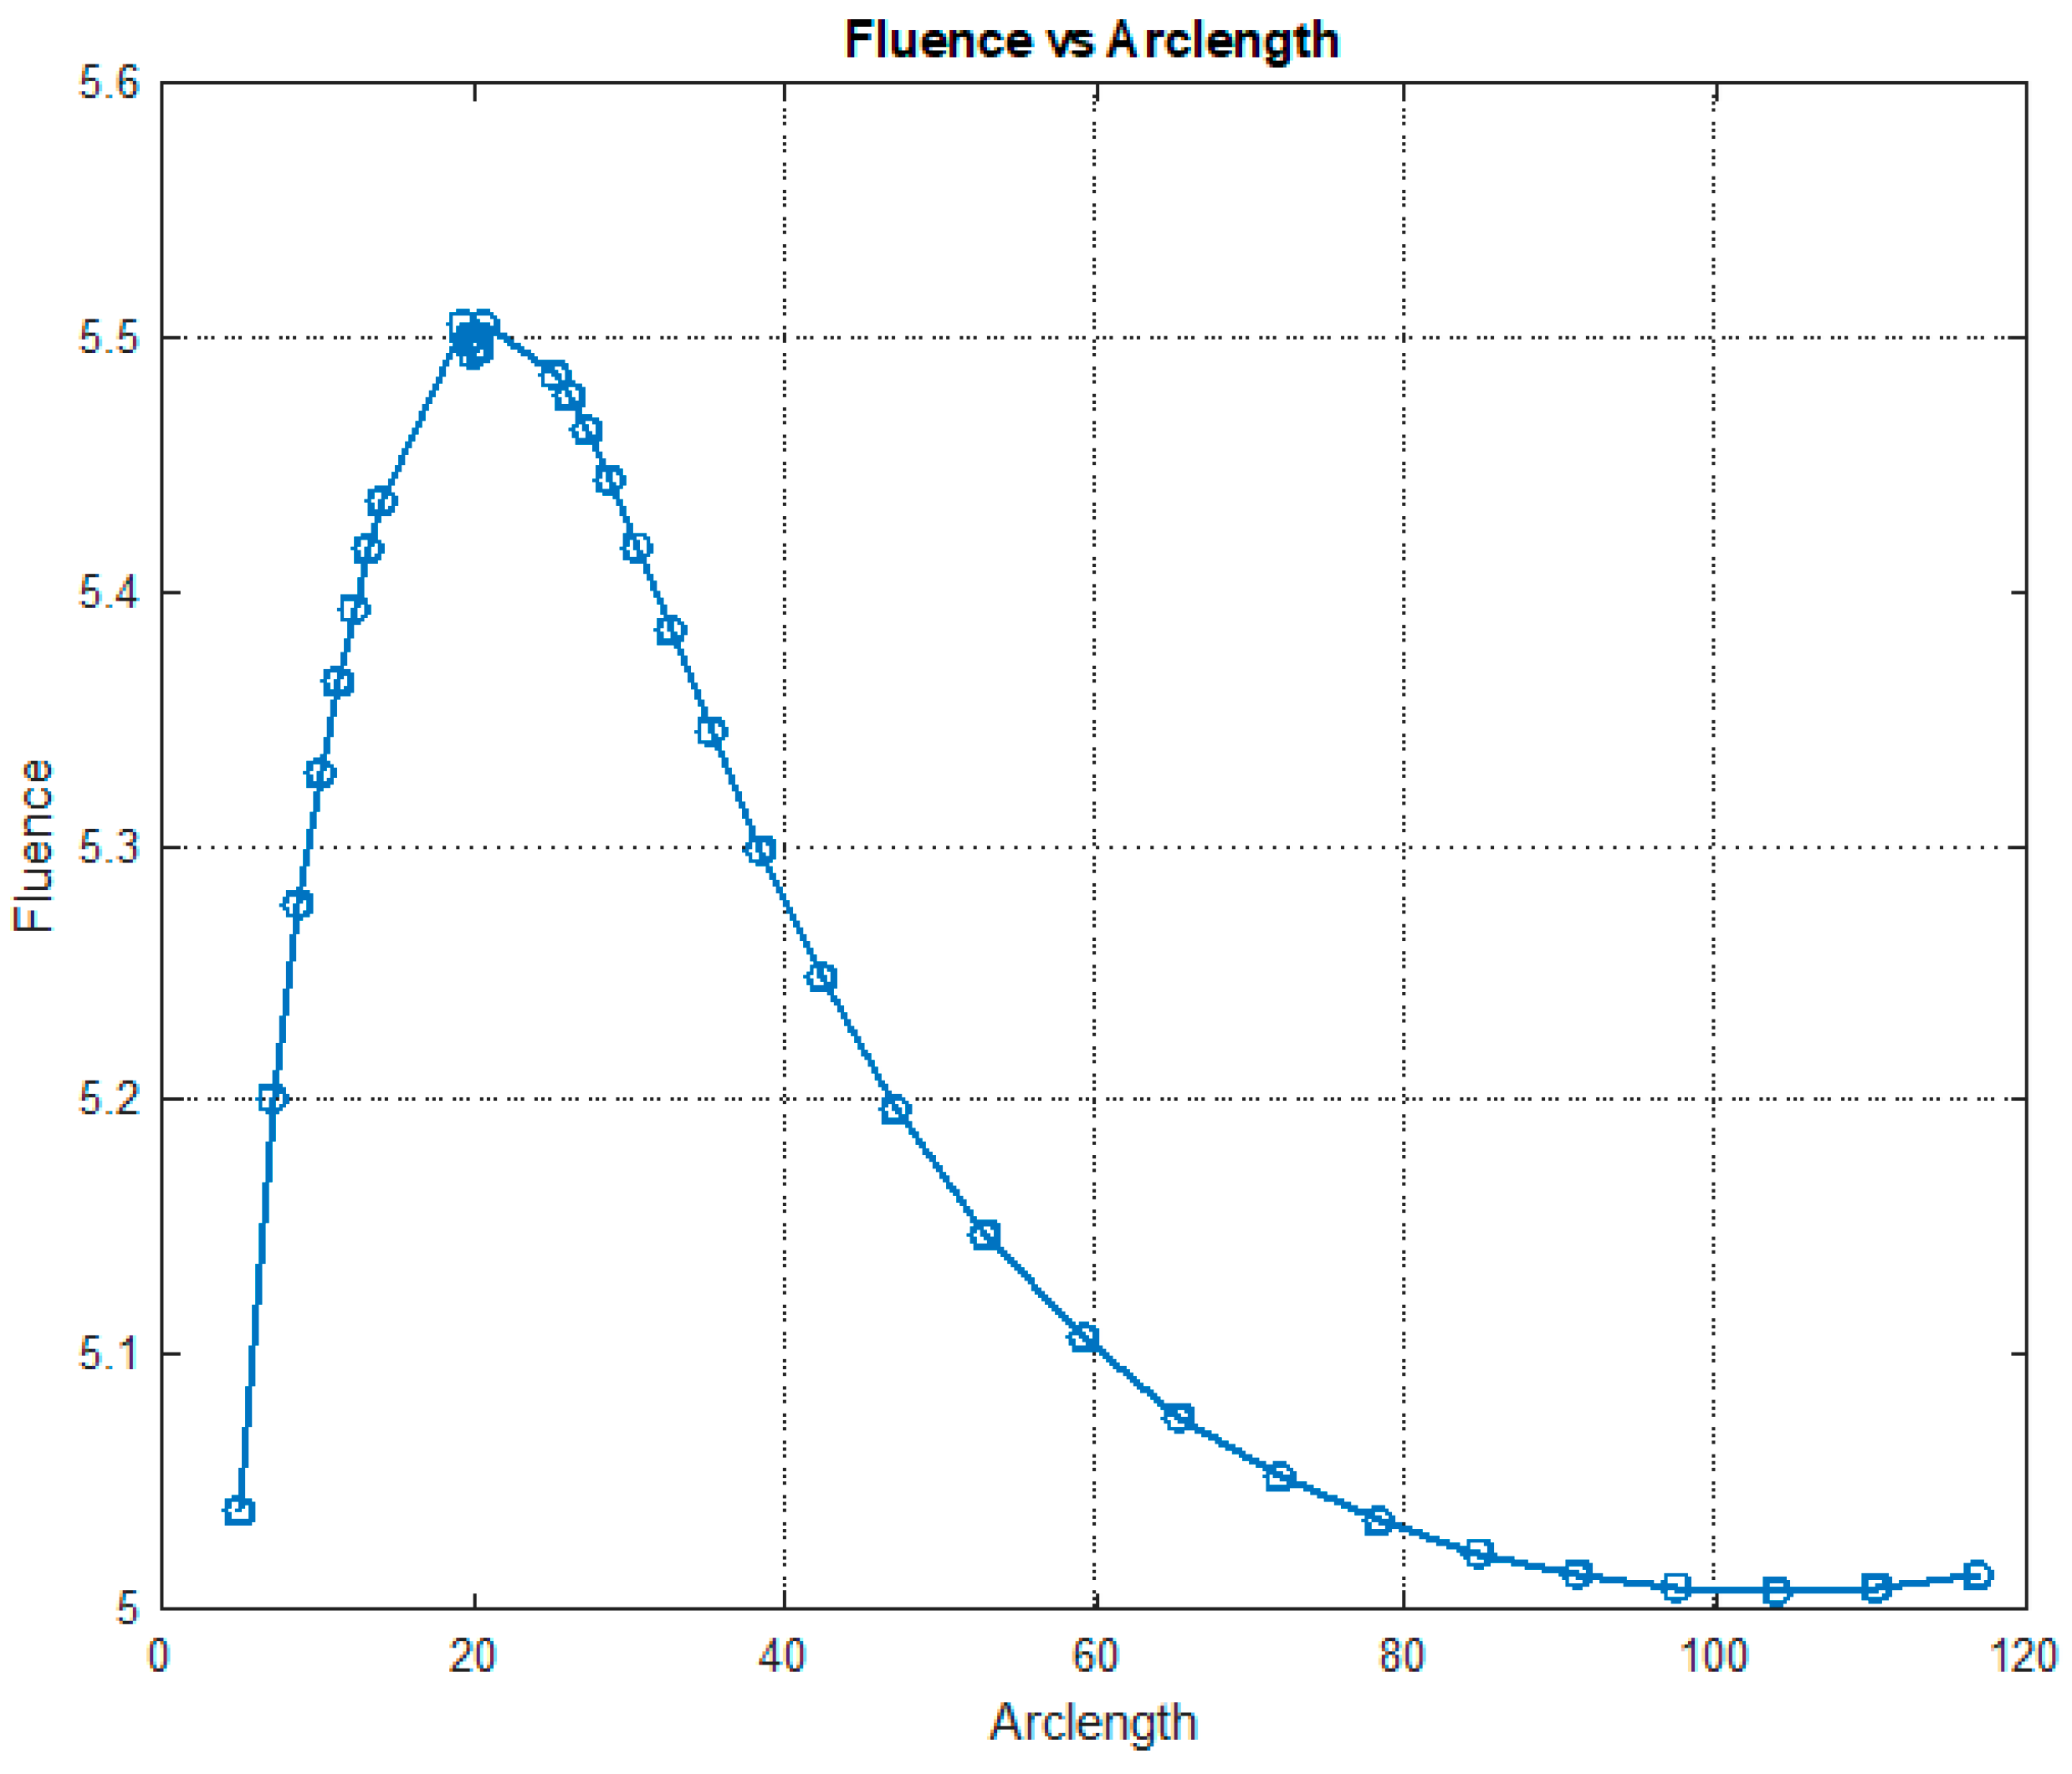
Figure 12 illustrates the variation in fluence along the arclength of the model. The behavior of the curve offers valuable insights into the attenuation of light intensity along the arclength, with the maximum at the light source and attenuation occurring on both sides.
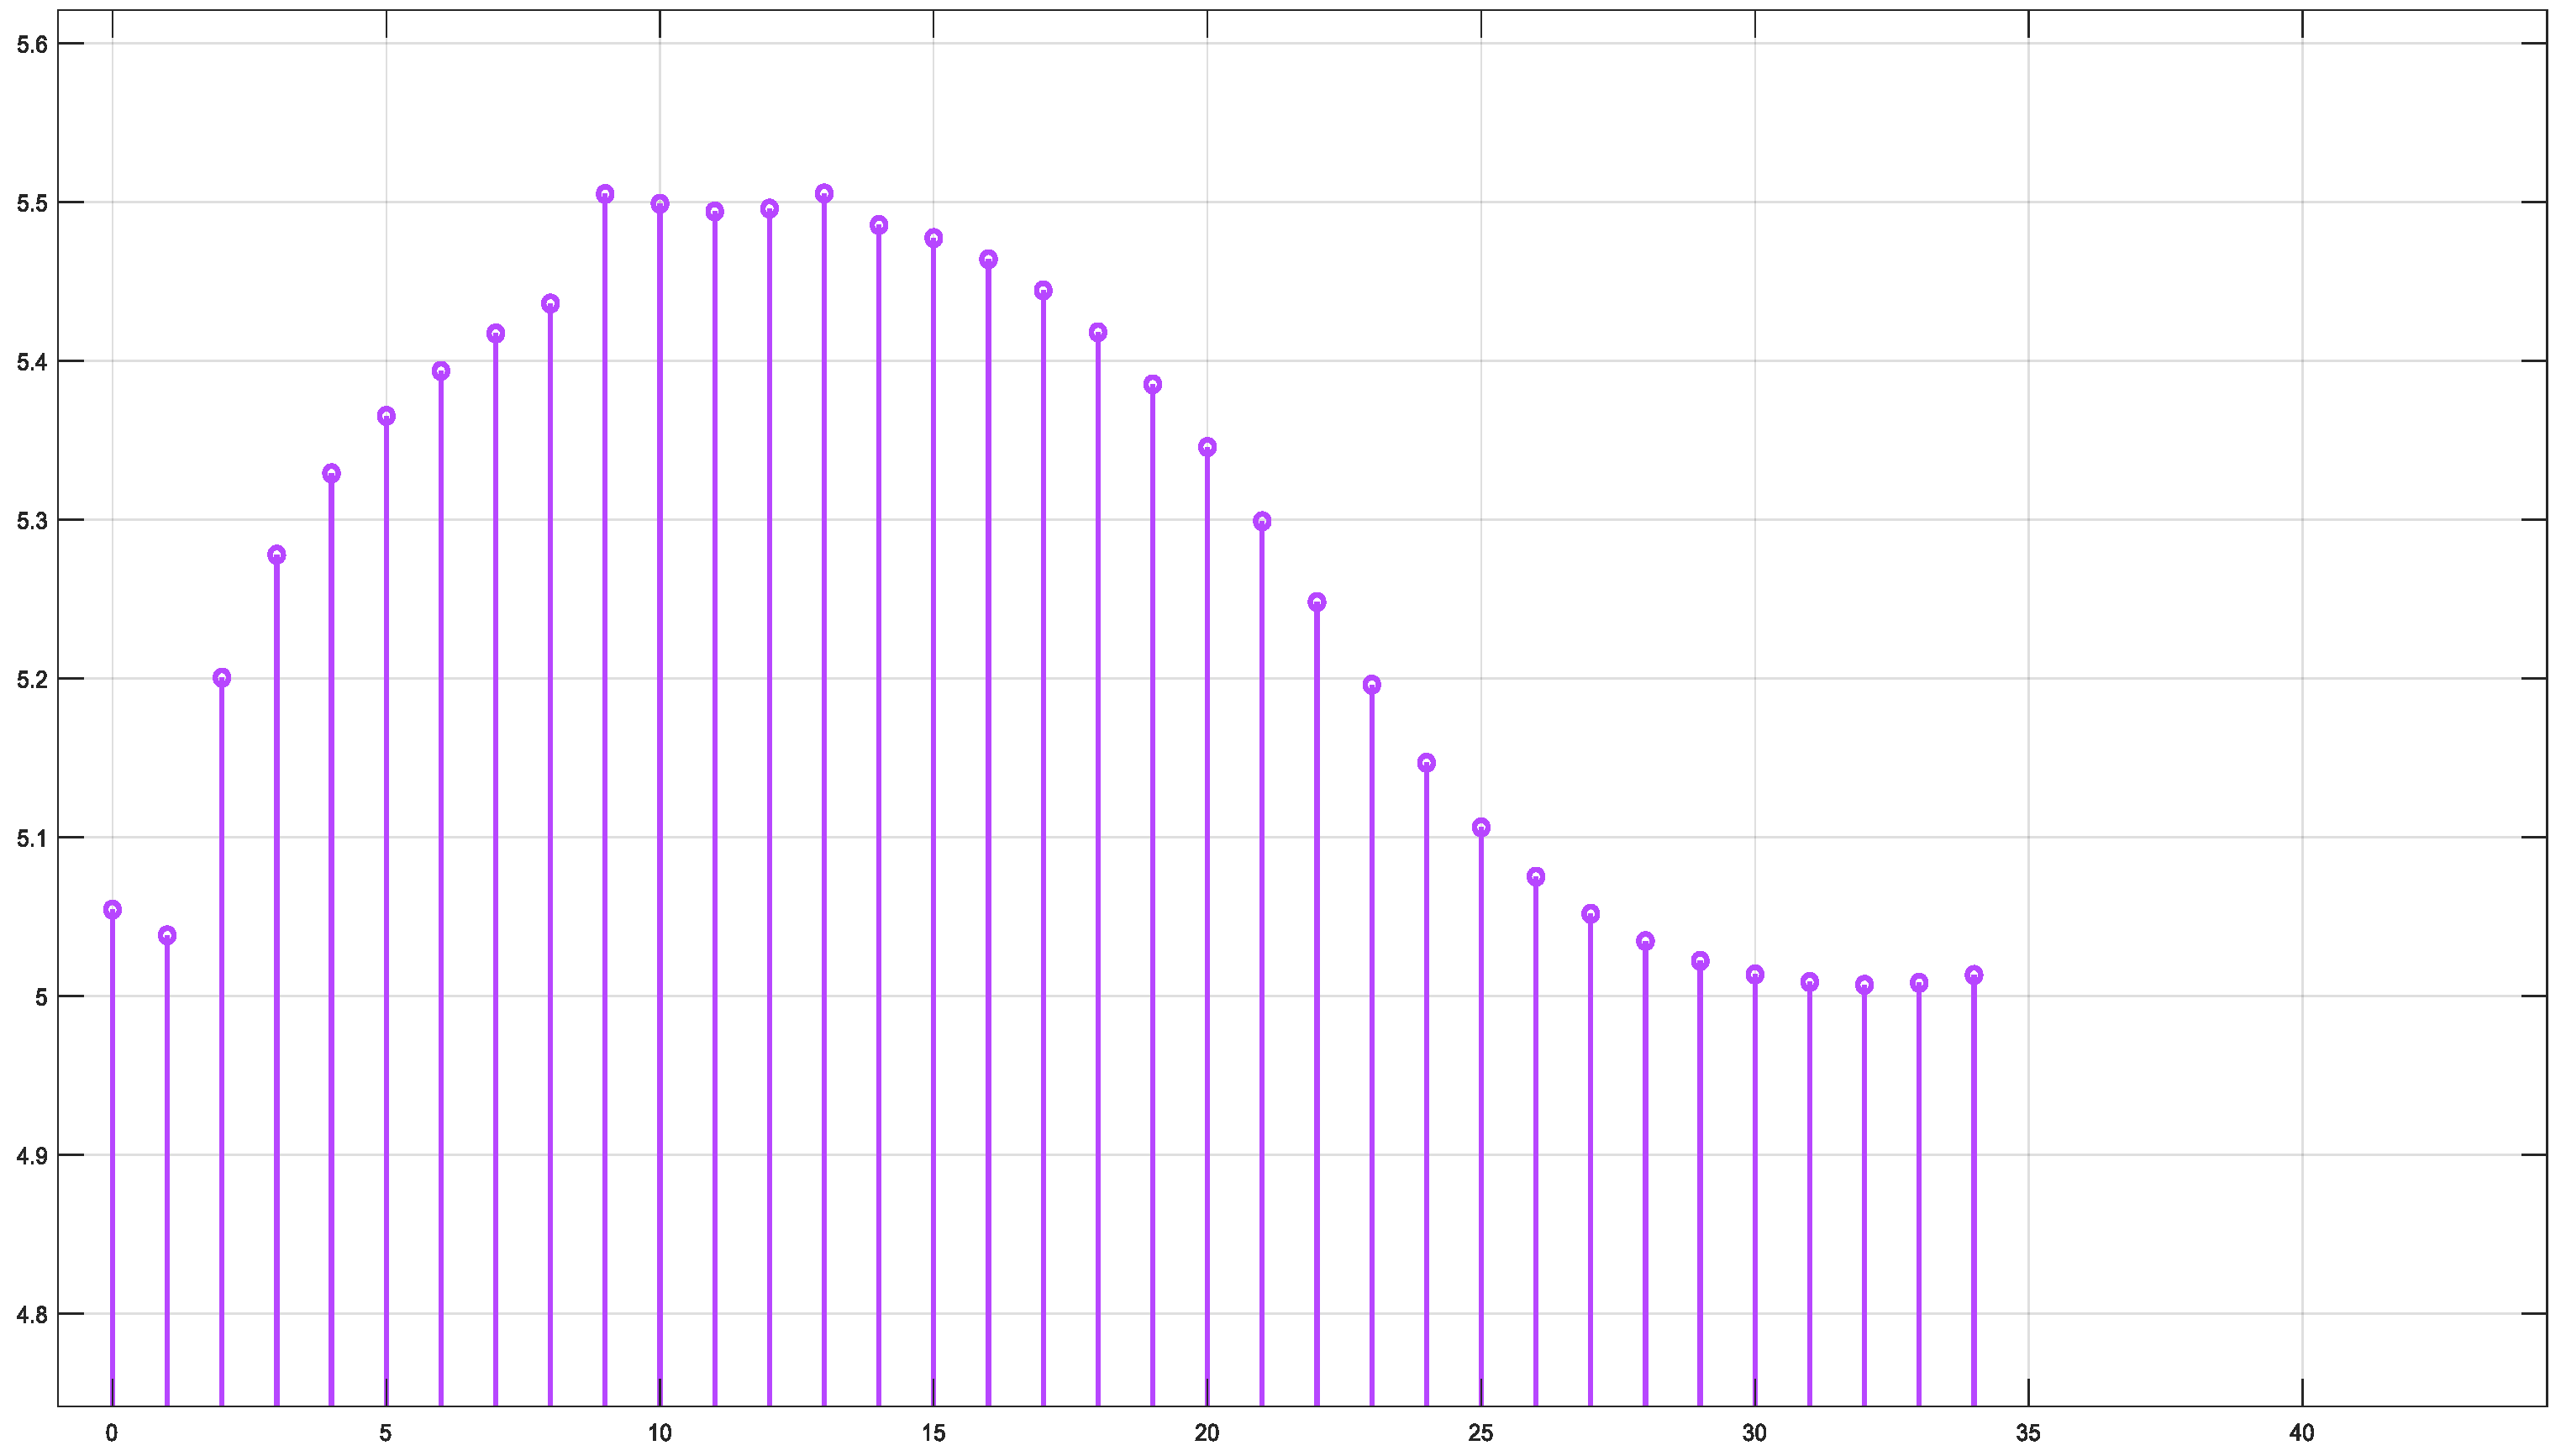
Figure 13 shows that fluency reaches a maximum value of approximately 5.5. Fluence increases sharply in this region, indicating significant energy deposition near the source. This behavior may represent the region of strong photon absorption and scattering near the origin. A slight fluctuation is observed at the peak due to the differences in absorption and scattering coefficients between the red blood cells (RBCs) and plasma. After the peak, the fluence decreases steadily, reflecting light attenuation due to absorption and scattering effects.
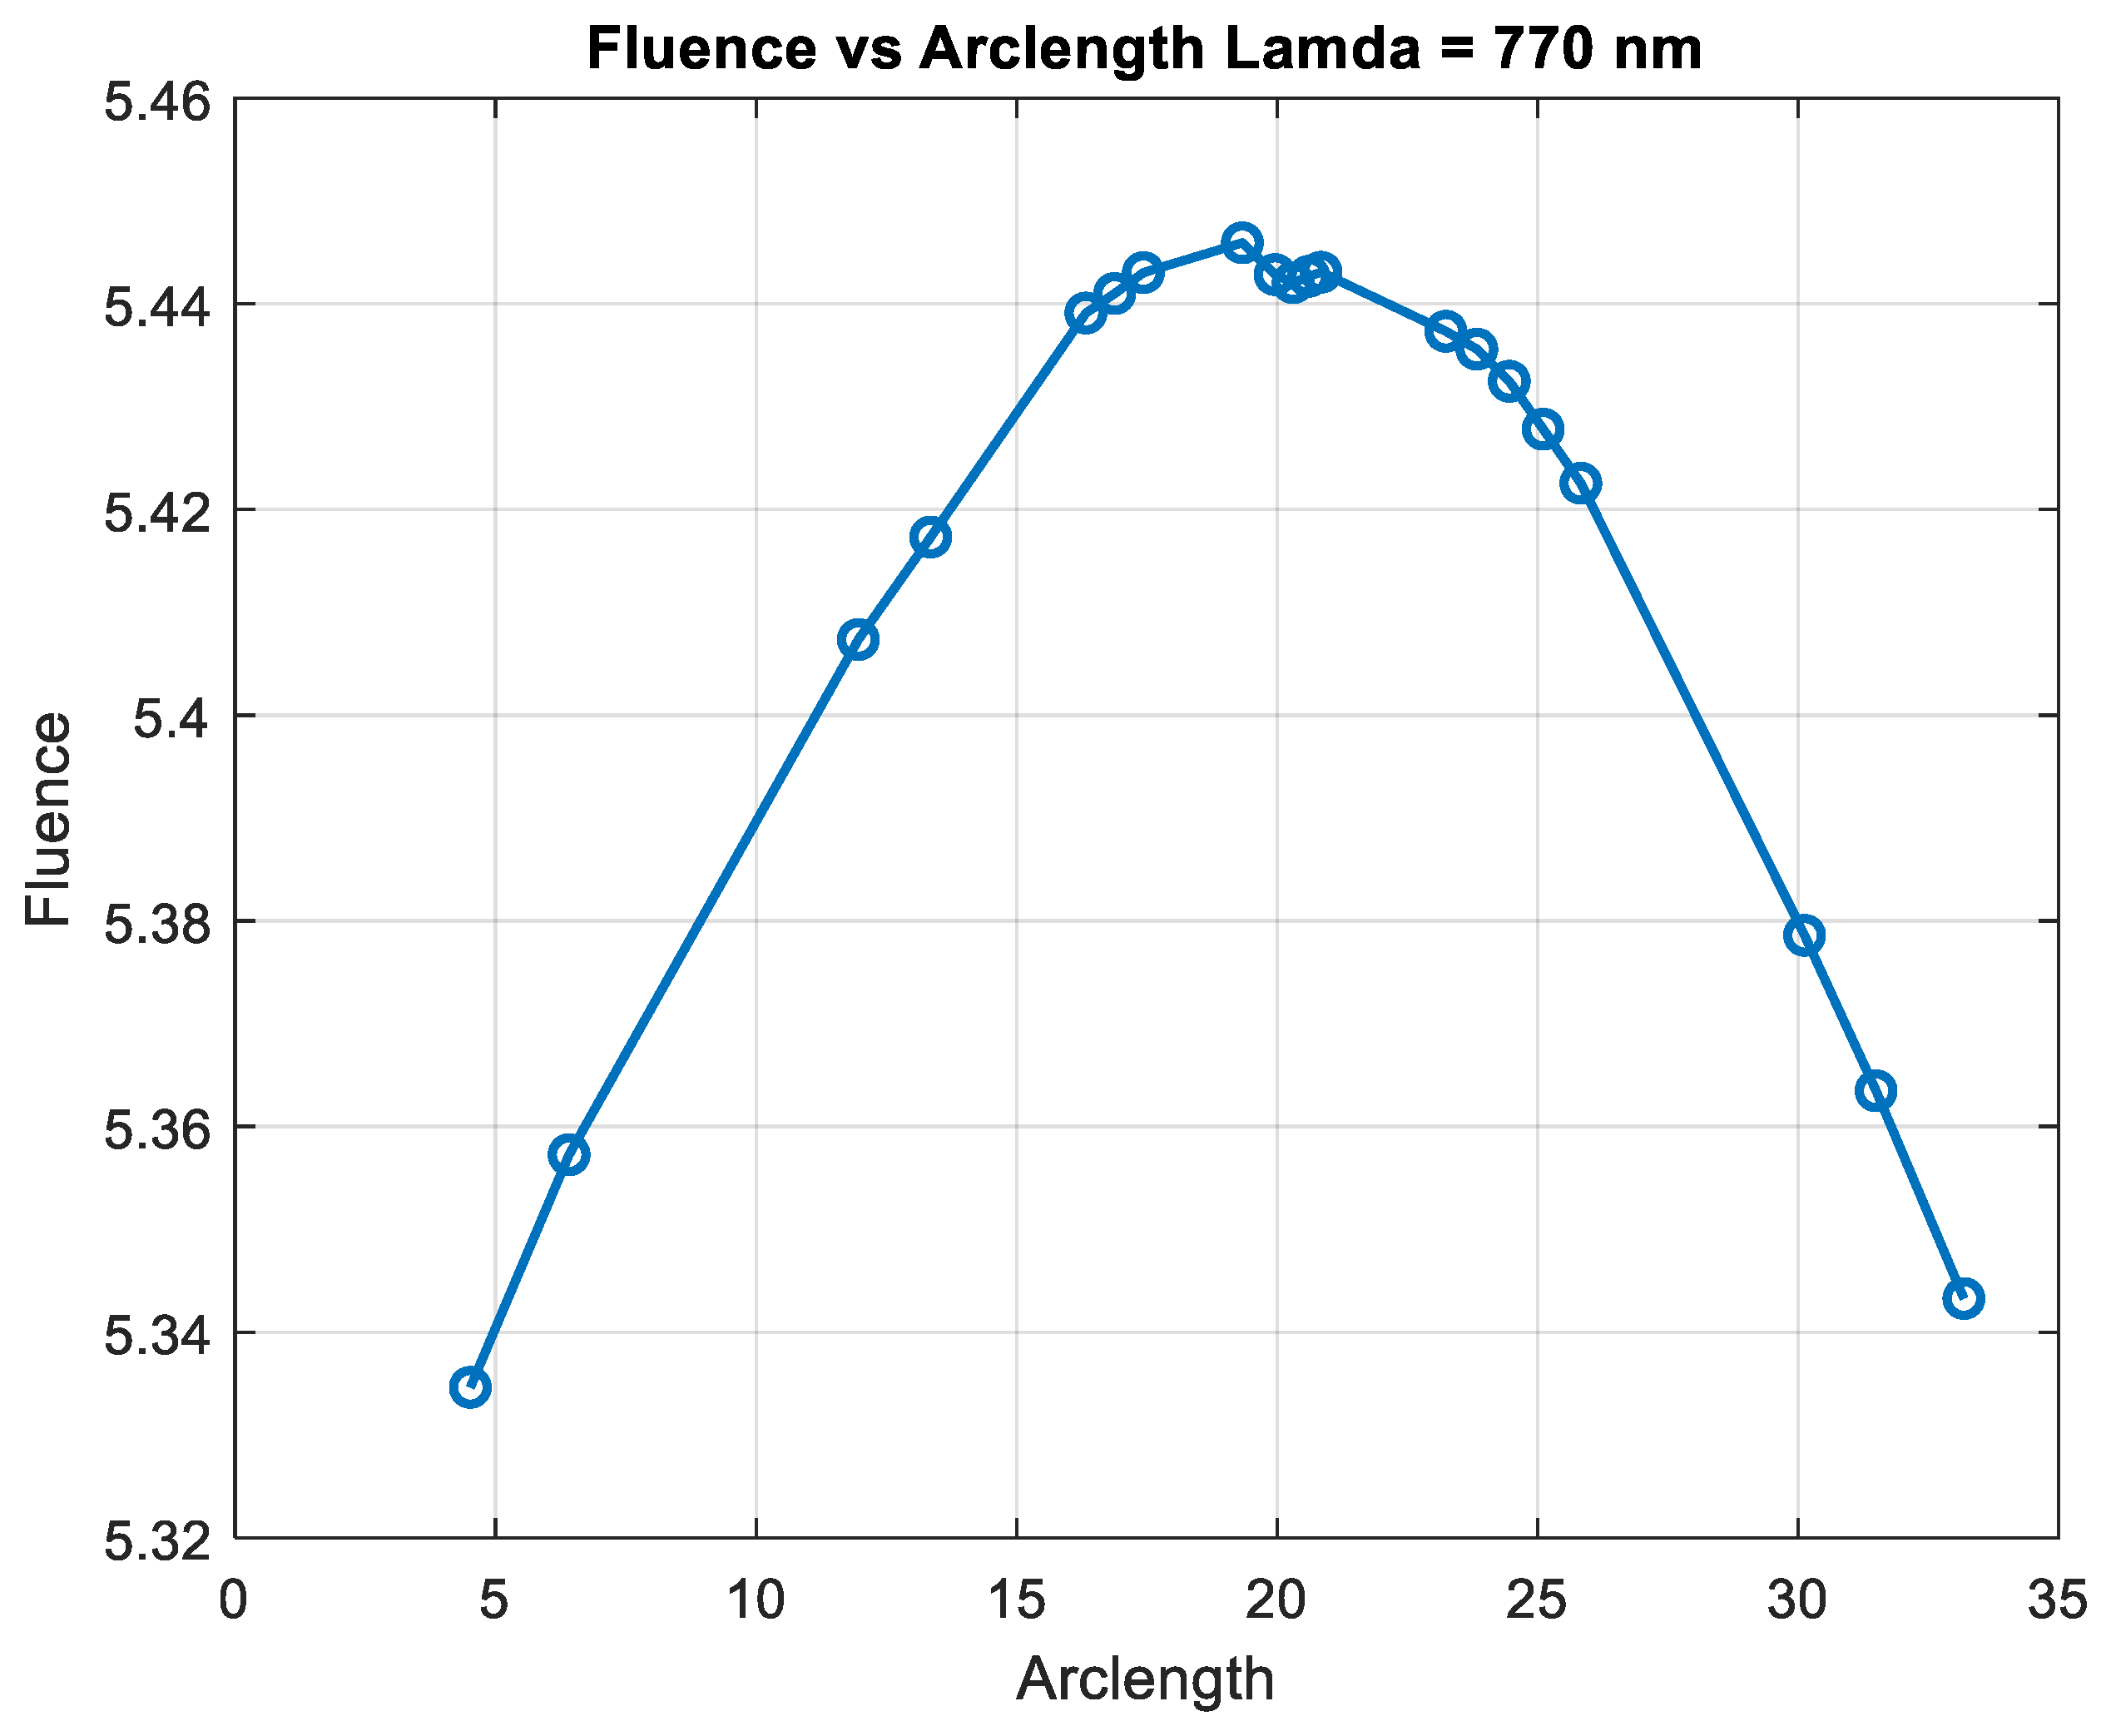
Figure 14 shows that fluency reaches a maximum value of approximately 5.45. Fluence increases sharply in this region, indicating significant energy deposition near the source. This behavior may represent the region of strong photon absorption and scattering near the origin. After the peak, the fluence decreases steadily, reflecting light attenuation due to absorption and scattering effects. The energy deposition diminishes as the photons travel further through the medium. Fluence stabilizes at a low value of around 5.05. This indicates that the light has been heavily attenuated, and energy interaction is minimal in this region.
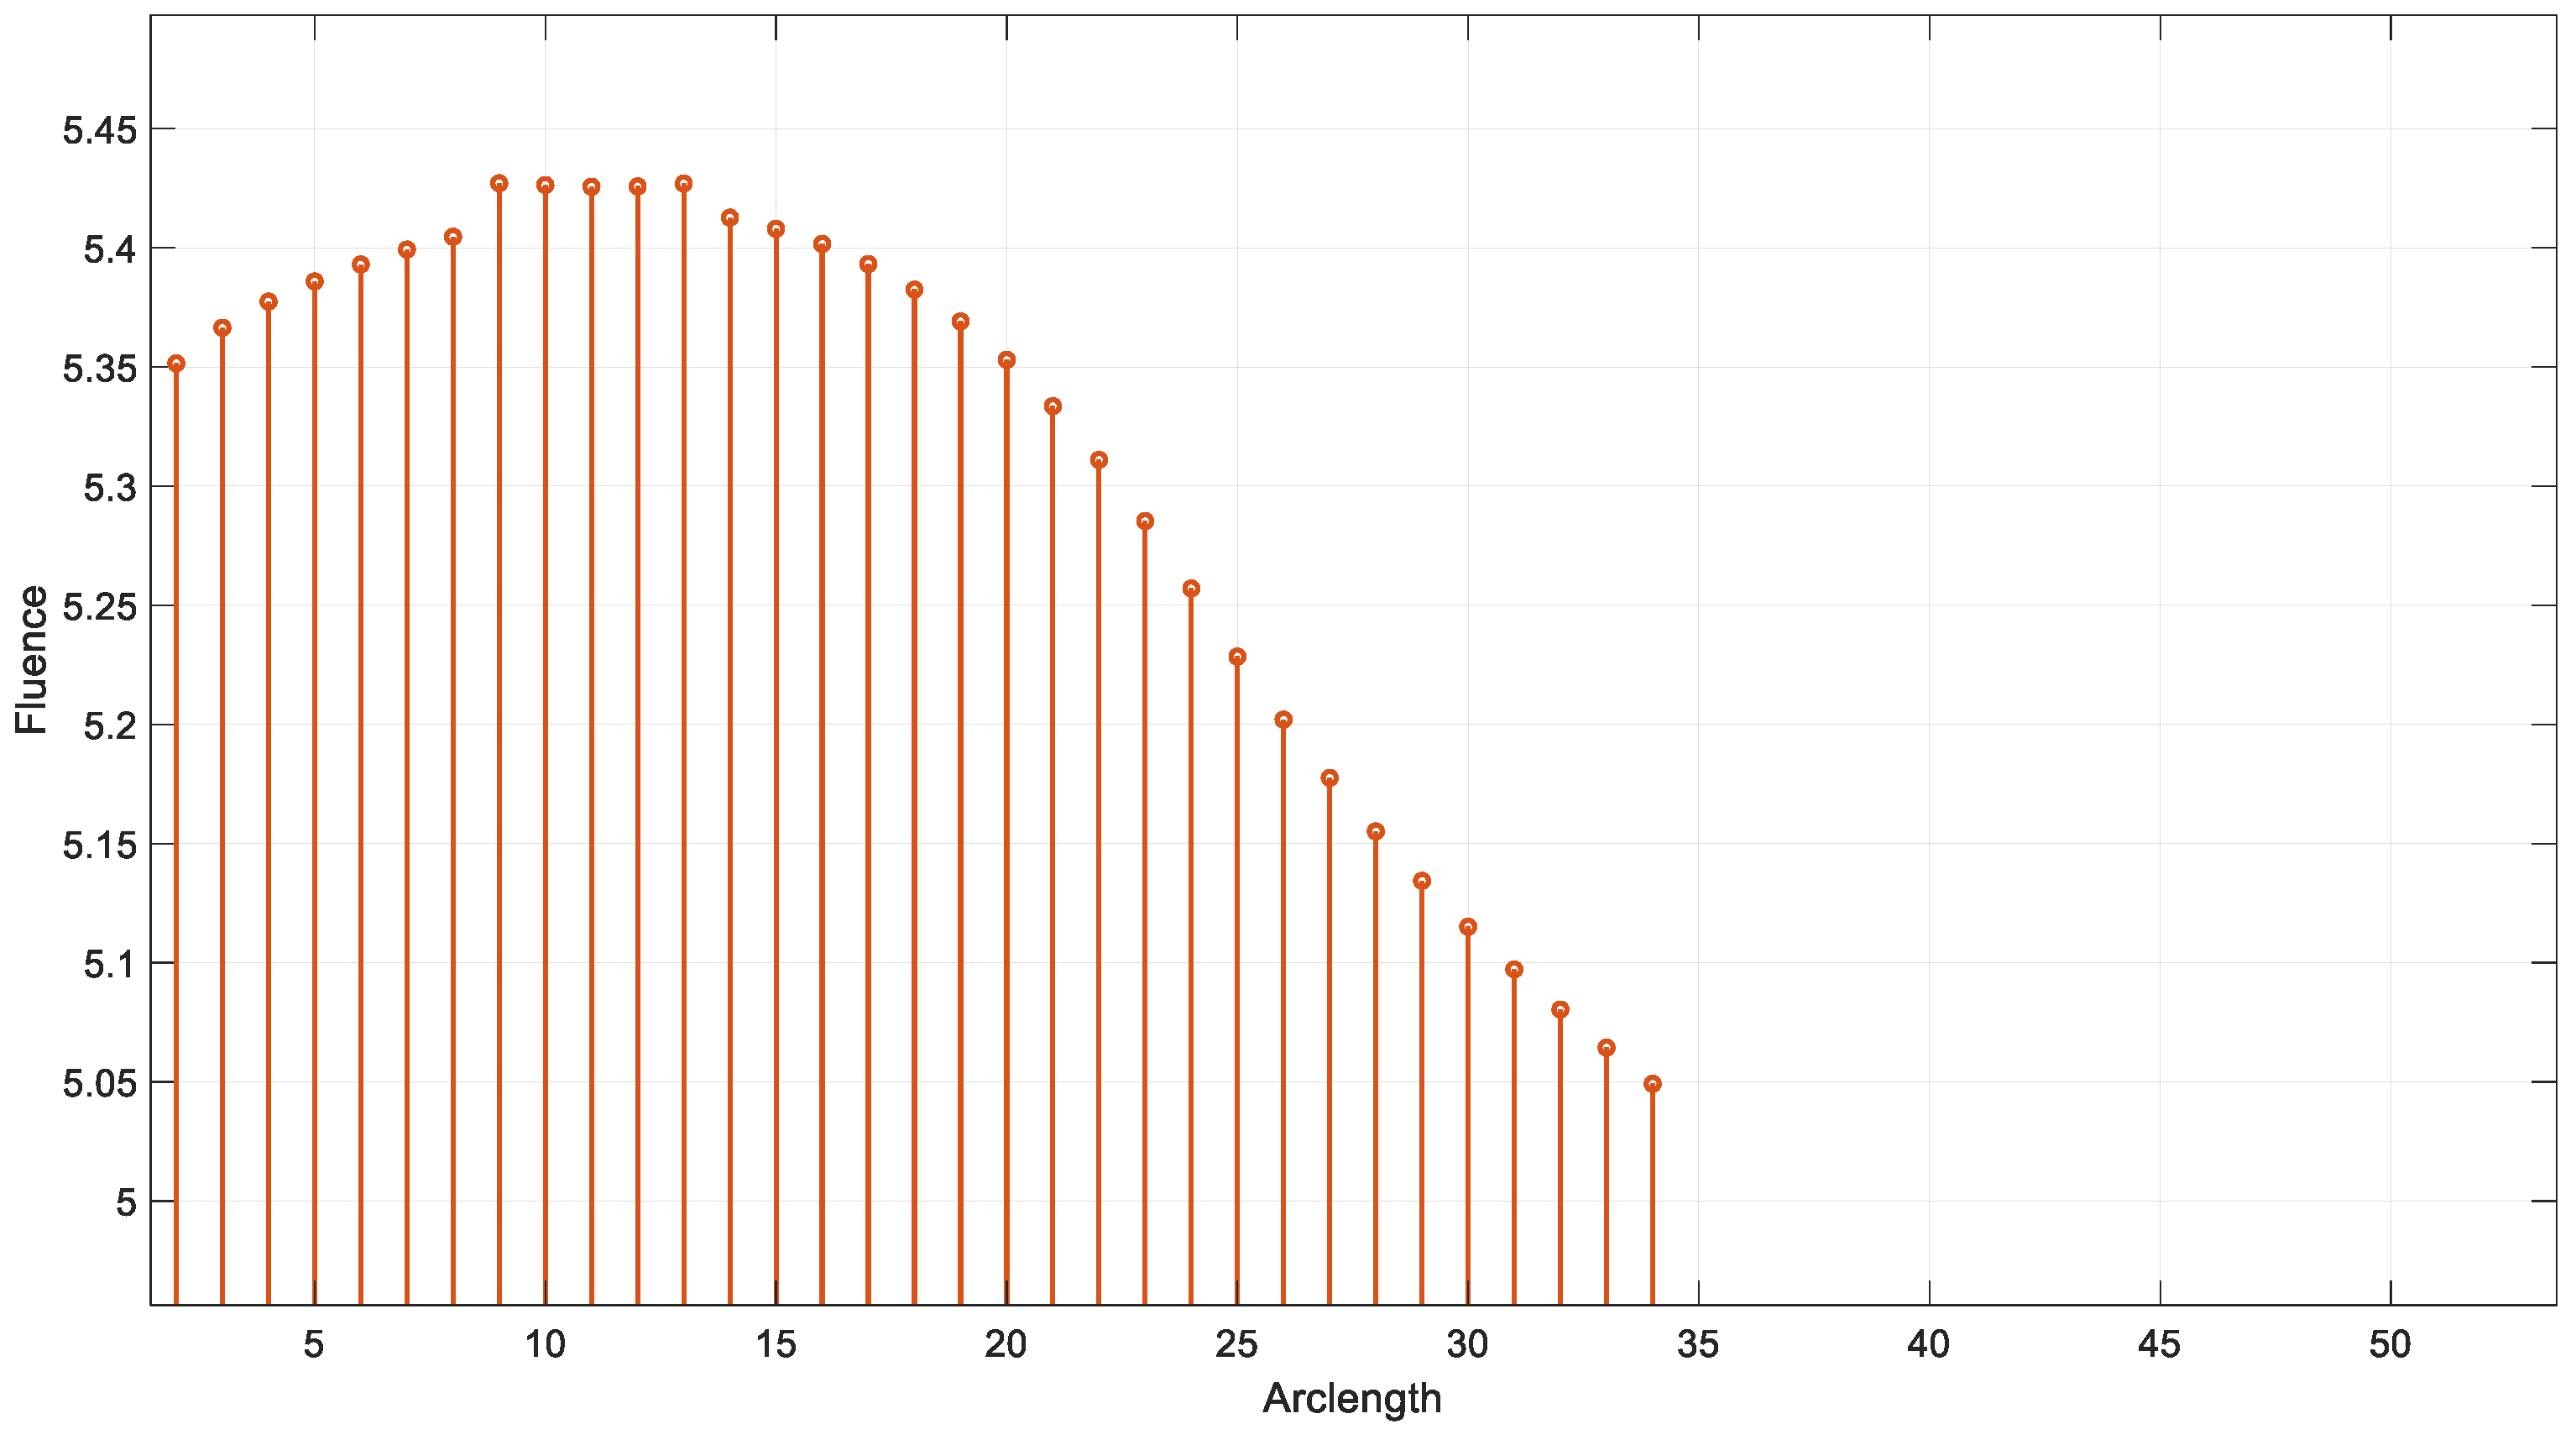
Figure 15 shows the variation in fluence along the arclength of the capillary. The behavior of the curve provides significant insights into the energy propagation and attenuation characteristics in the medium.
Fluence increases sharply in this region, indicating significant energy deposition near the source. This behavior may represent the region of strong photon absorption and scattering near the origin.
After the peak, the fluence decreases steadily, reflecting light attenuation due to absorption and scattering effects.
The energy deposition diminishes as the photons travel further through the medium. Fluence stabilizes at a low value of around 5.32. This indicates that the light has been heavily attenuated, and energy interaction is minimal in this region.
The fluence vs. arclength plot provides valuable insights into the optical and transport properties of the system.
Optical Properties: Absorption: The curve illustrates how different parts of the medium absorb light, depending on the material’s absorption coefficients. Scattering: The way light is scattered or redirected by particles in the medium (red blood cells and plasma) is also visible.
Transport Properties: The combined effects of scattering and absorption influence how light travels through the medium. This reflects the material’s ability to transport light energy over given distances.
In summary, by analyzing the shape and variations in the curve, one can infer how the medium affects the light, which is crucial for biomedical applications, such as imaging or diagnostics, where light interacts with biological tissues.
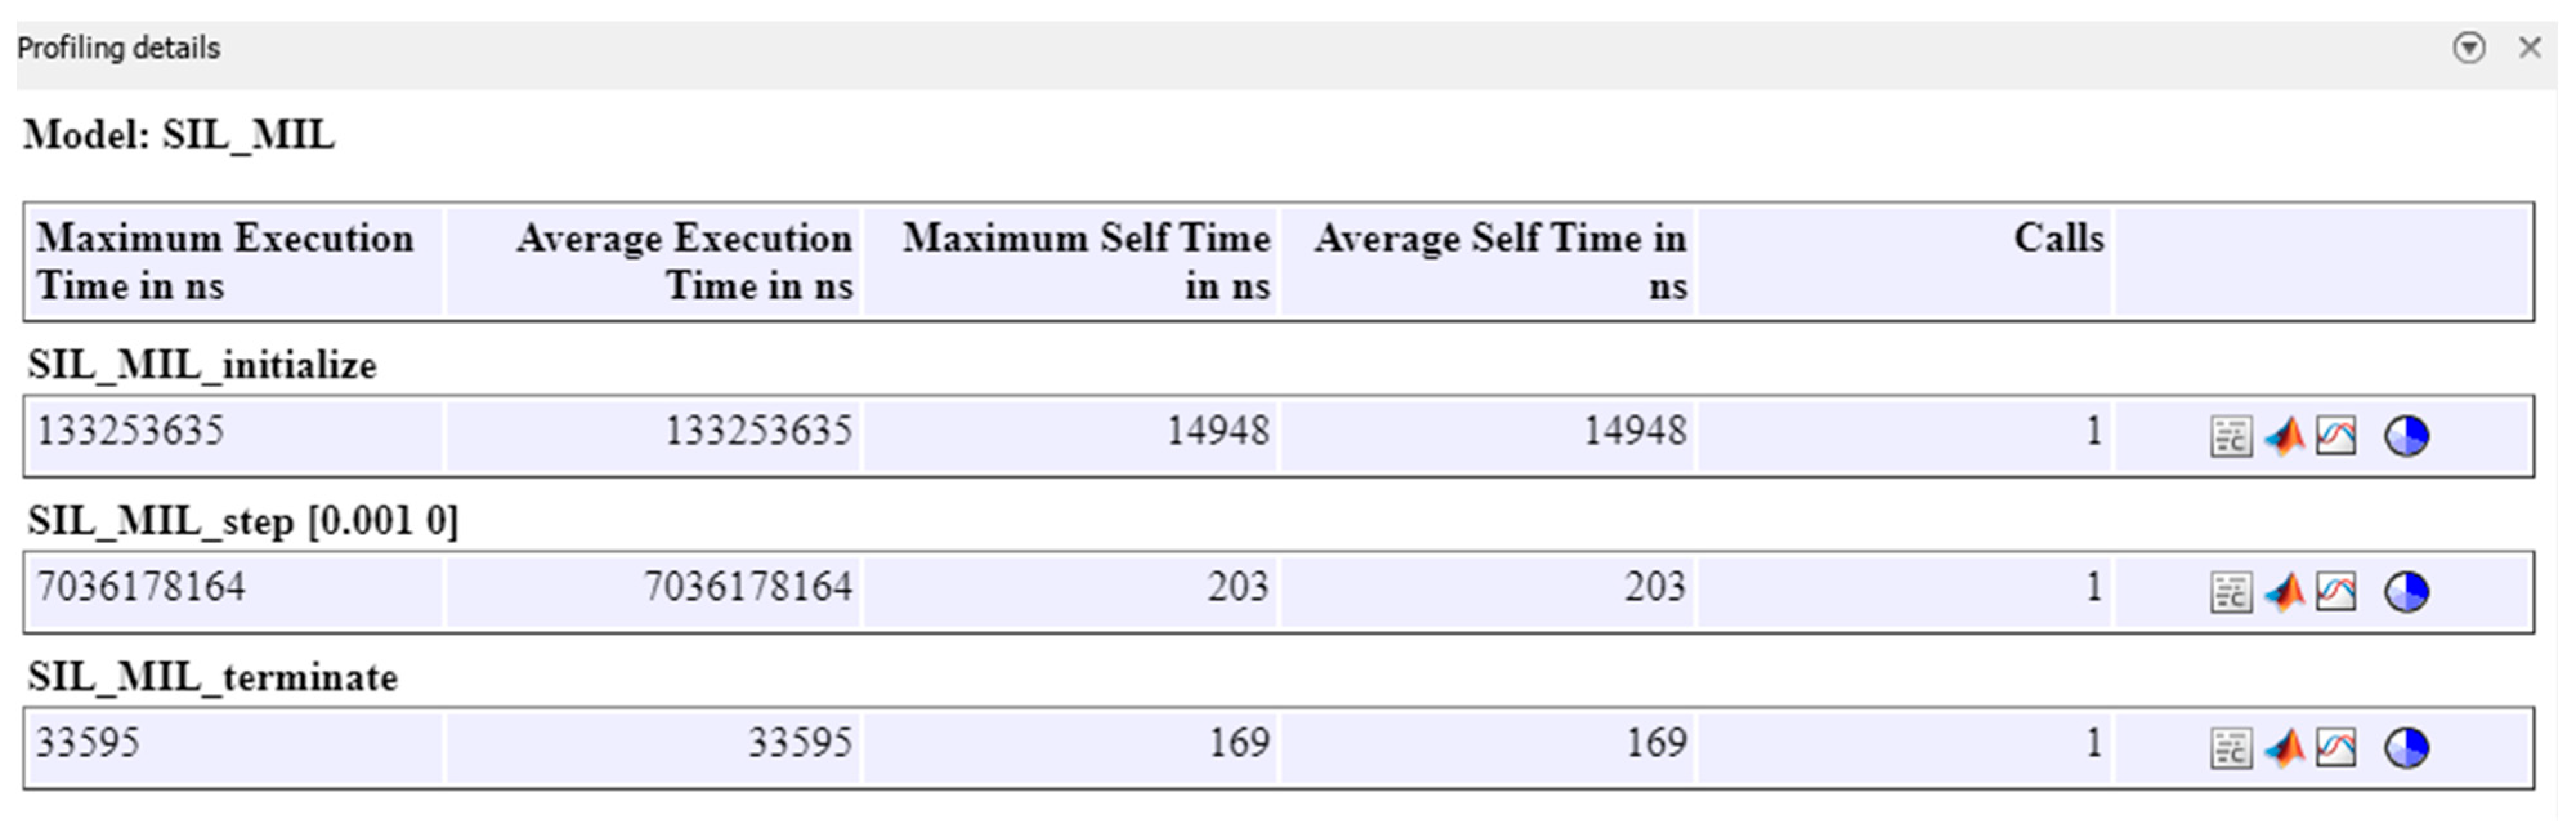
3.4. SIL Verification and IoT Functionality
This section presents the results of the SIL verification of the model as an introduced step to enable real-time implementation of the fluence inside the embedded target like an FPGA board. While the proposed system holds potential for real-time monitoring, it is important to acknowledge that the current computational steps, including mesh generation and fluence calculations, are not yet optimized for real-time processing. These processes, though feasible, require significant computational resources. However, with advancements in embedded software and the optimization of algorithms, real-time processing could become achievable in the future. This paper focuses on the feasibility of the technique and serves as a stepping-stone towards achieving real-time capabilities.
The SIL verification is examined through the Simulation Data Inspector (SDI) of the MATLAB/Simulink version 2024a. First, the fluence outputs from the S-Function Builder are loaded into the SDI tool. Next, the SIL process is carried out to generate code for implementation on the electronic target. Finally, a comparison is made between the fluence data obtained from the simulation and the fluence data generated for real-time implementation, as illustrated by the SDI tool, to validate the proposed workflow. A more detailed review of the results using the SIL approach is illustrated in
Appendix B.
The simulation of the fluence versus arclength was performed using the S-Function Builder, and the results were evaluated for four distinct wavelengths: 660 nm, 770 nm, 850 nm, and 950 nm. The fluence profiles were calculated for each wavelength across the specified mesh, which was generated using S-Function Builder.
Figure 16 illustrates the fluence data generated from the real-time code implemented by SIL for = 660 nm.
The fluence distribution showed a small variation with the change in wavelength, as expected due to the differing absorption and scattering properties of the tissue at each wavelength. For 660 nm, a higher absorption peak was observed closer to the source, resulting in a more rapid attenuation of fluence.
Figure 17 illustrates the fluence data generated from the real-time code implemented by SIL for =770 nm.
At 770 nm and 850 nm, the fluence was more evenly distributed along the arclength, indicating lower absorption.
At 950 nm, a gradual decrease in fluence was observed, suggesting that the tissue interactions at this wavelength are less pronounced, possibly due to a combination of scattering and reduced absorption.
Figure 18 illustrates the fluence data generated from the real-time code implemented by SIL for
λ = 850 nm.
Figure 19 illustrates the fluence data generated from the real-time code implemented by SIL for
λ = 950 nm.
The results demonstrate the wavelength dependence of the fluence distribution, which is critical for applications in biomedical imaging and therapy. The sharp drop in fluence at 660 nm suggests that this wavelength may be more suitable for applications that require stronger tissue penetration, while longer wavelengths such as 850 nm and 950 nm may provide deeper tissue penetration with a more gradual fluence attenuation.
This behavior is consistent with the known optical properties of tissue, where shorter wavelengths are more heavily absorbed, and longer wavelengths penetrate deeper with less energy loss. The simulation results underscore the importance of choosing the appropriate wavelength for specific therapeutic or diagnostic applications, as the fluence profile directly influences the effectiveness of light-based treatments. Further studies could investigate the impact of different tissue models or the inclusion of more complex geometries to refine these findings and enhance the accuracy of the fluence prediction.
However, a critical issue arises from the overlap of the absorption spectra of various components in the blood, such as hemoglobin, plasma proteins, and other blood constituents, which can significantly affect the accuracy of the measurements for red blood cells (RBCs). This overlap leads to uncertainty in isolating the specific contribution of RBCs to the overall absorption, as the other components may absorb light in the same or similar wavelength ranges. This overlap can reduce the precision of the measured values for RBCs, making it difficult to accurately determine their concentration or dynamics.
In this research, multi-wavelength analysis is employed to address the issue of the overlapping absorption spectra of various components in the blood, such as hemoglobin, plasma proteins, and other blood constituents, which can significantly affect the accuracy of the measurements for red blood cells (RBCs). By utilizing multiple wavelengths, we aim to better separate the contributions of RBCs from those of other blood components, enhancing the precision of RBC measurements.
This approach allows for more accurate determination of RBC concentration and dynamics, even in the presence of overlapping absorption from other components. Advanced algorithms, such as spectral unmixing and mathematical modeling, are also applied to extract the specific absorption characteristics of RBCs. These strategies improve the accuracy and reliability of non-invasive measurements, facilitating more precise monitoring of RBC dynamics in response to light.
4. Conclusions
This study presents a comprehensive simulation of the motion of red blood cells (RBCs) within a capillary and their interaction with photon beams at various wavelengths. By leveraging advanced computational techniques, including the Finite Element Method (FEM) and Arbitrary Lagrangian–Eulerian (ALE) formulation, we were able to model the dynamics of light-tissue interactions with high accuracy. The findings demonstrate how flow forces influence RBC motion, guiding them toward the lower pathway of bifurcation, and how these dynamics impact the distribution of light absorption and scattering within capillaries.
Through detailed analysis of fluence profiles across wavelengths from 660 nm to 950 nm, this study provides critical insights into the attenuation of light intensity as it traverses the capillary. Shorter wavelengths, such as 660 nm, exhibit rapid attenuation near the source, while longer wavelengths, such as 950 nm, penetrate deeper into tissues and show a more gradual decline in fluence. This wavelength-dependent behavior is consistent with the known optical properties of biological tissues and is essential for optimizing light delivery in applications like photodynamic therapy and optical imaging. The study was conducted using the S-Function Builder in MATLAB/Simulink, with the generated code validated through Software-in-the-Loop (SIL) testing approach.
The real-time implementation of the model, validated through Software-in-the-Loop (SIL) testing, highlights the potential for real-time fluence calculations, which could be further optimized for clinical use. This research contributes significantly to understanding light-tissue interactions and lays groundwork for the development of personalized light-based therapies. By demonstrating the feasibility of real-time monitoring, this study paves the way for the integration of these computational frameworks into advanced biomedical devices.
By demonstrating the feasibility of real-time monitoring, this study paves the way for the integration of these computational frameworks into advanced biomedical devices. However, real-time validation remains a future task. This study represents the first step in this direction. We have generated the code to be implemented on the target hardware for fluence calculation. The next steps include conducting a 3D study to represent the current work object, validating through Hardware-in-the-Loop (HIL) testing, and, finally, implementing the complete system with the sensors, information processing board, and an IoT module for cloud communication of the results.
While the study provides valuable insights and demonstrates the method’s feasibility under controlled conditions, further clinical validation is necessary to assess its real-world applicability. Additionally, future research may focus on refining the model for more complex biological environments and exploring the integration of multi-modal imaging techniques. These advancements will be essential for enhancing the accuracy and effectiveness of light-based diagnostic and therapeutic tools, marking a step forward in non-invasive medical treatments.


