Economic Peaks and Value-at-Risk Analysis: A Novel Approach Using the Laplace Distribution for House Prices
Abstract
1. Introduction
2. The New Odd Log-Logistic Standard Laplace Distribution
- i.
- For , we obtain the odd log-logistic standard Laplace distribution;
- ii.
- For , we obtain the standard Laplace distribution.
3. Main Properties
3.1. Asymptotics
3.2. Linear Combinations for the CDF and PDF
3.3. Moments and Incomplete Moments
3.4. The Moment Generating Function
3.5. Mean Deviation
3.6. Order Statistics
3.7. Quantiles and the Pseudo-Random Generator
4. Parameter Estimation
5. The Simulation Study
6. The Boston Dataset
- (i)
- To discriminate the distribution from the distribution, the null hypothesis is tested against the alternative hypothesis . The test statistic iswhere and are, respectively, the MLEs of the distribution and the distribution, and is the difference between the numbers of parameters.
- (ii)
- To discriminate the distribution from the distribution, the null hypothesis is tested against the alternative hypothesis . The test statistic iswhere and are, respectively, the MLEs of the distribution and the distribution, and is the difference between the numbers of parameters.
7. Risk Indicators
7.1. The VaR
7.2. The TVaR
7.3. The MOP Method
7.4. The PORT-VaR
- The selection of based on empirical data or expert judgment;
- Identify exceedances: Filter the dataset to isolate values that surpass the established threshold ;
- Count exceedances: Calculate the total number of exceedances that have been identified;
- Estimate the empirical CDF for the identified exceedances;
- Calculate the VaR: Use the empirical distribution of the exceedances to ascertain the VaR at the specified quantile q.
8. MOP Analysis for the Median Values of Boston House Price Data
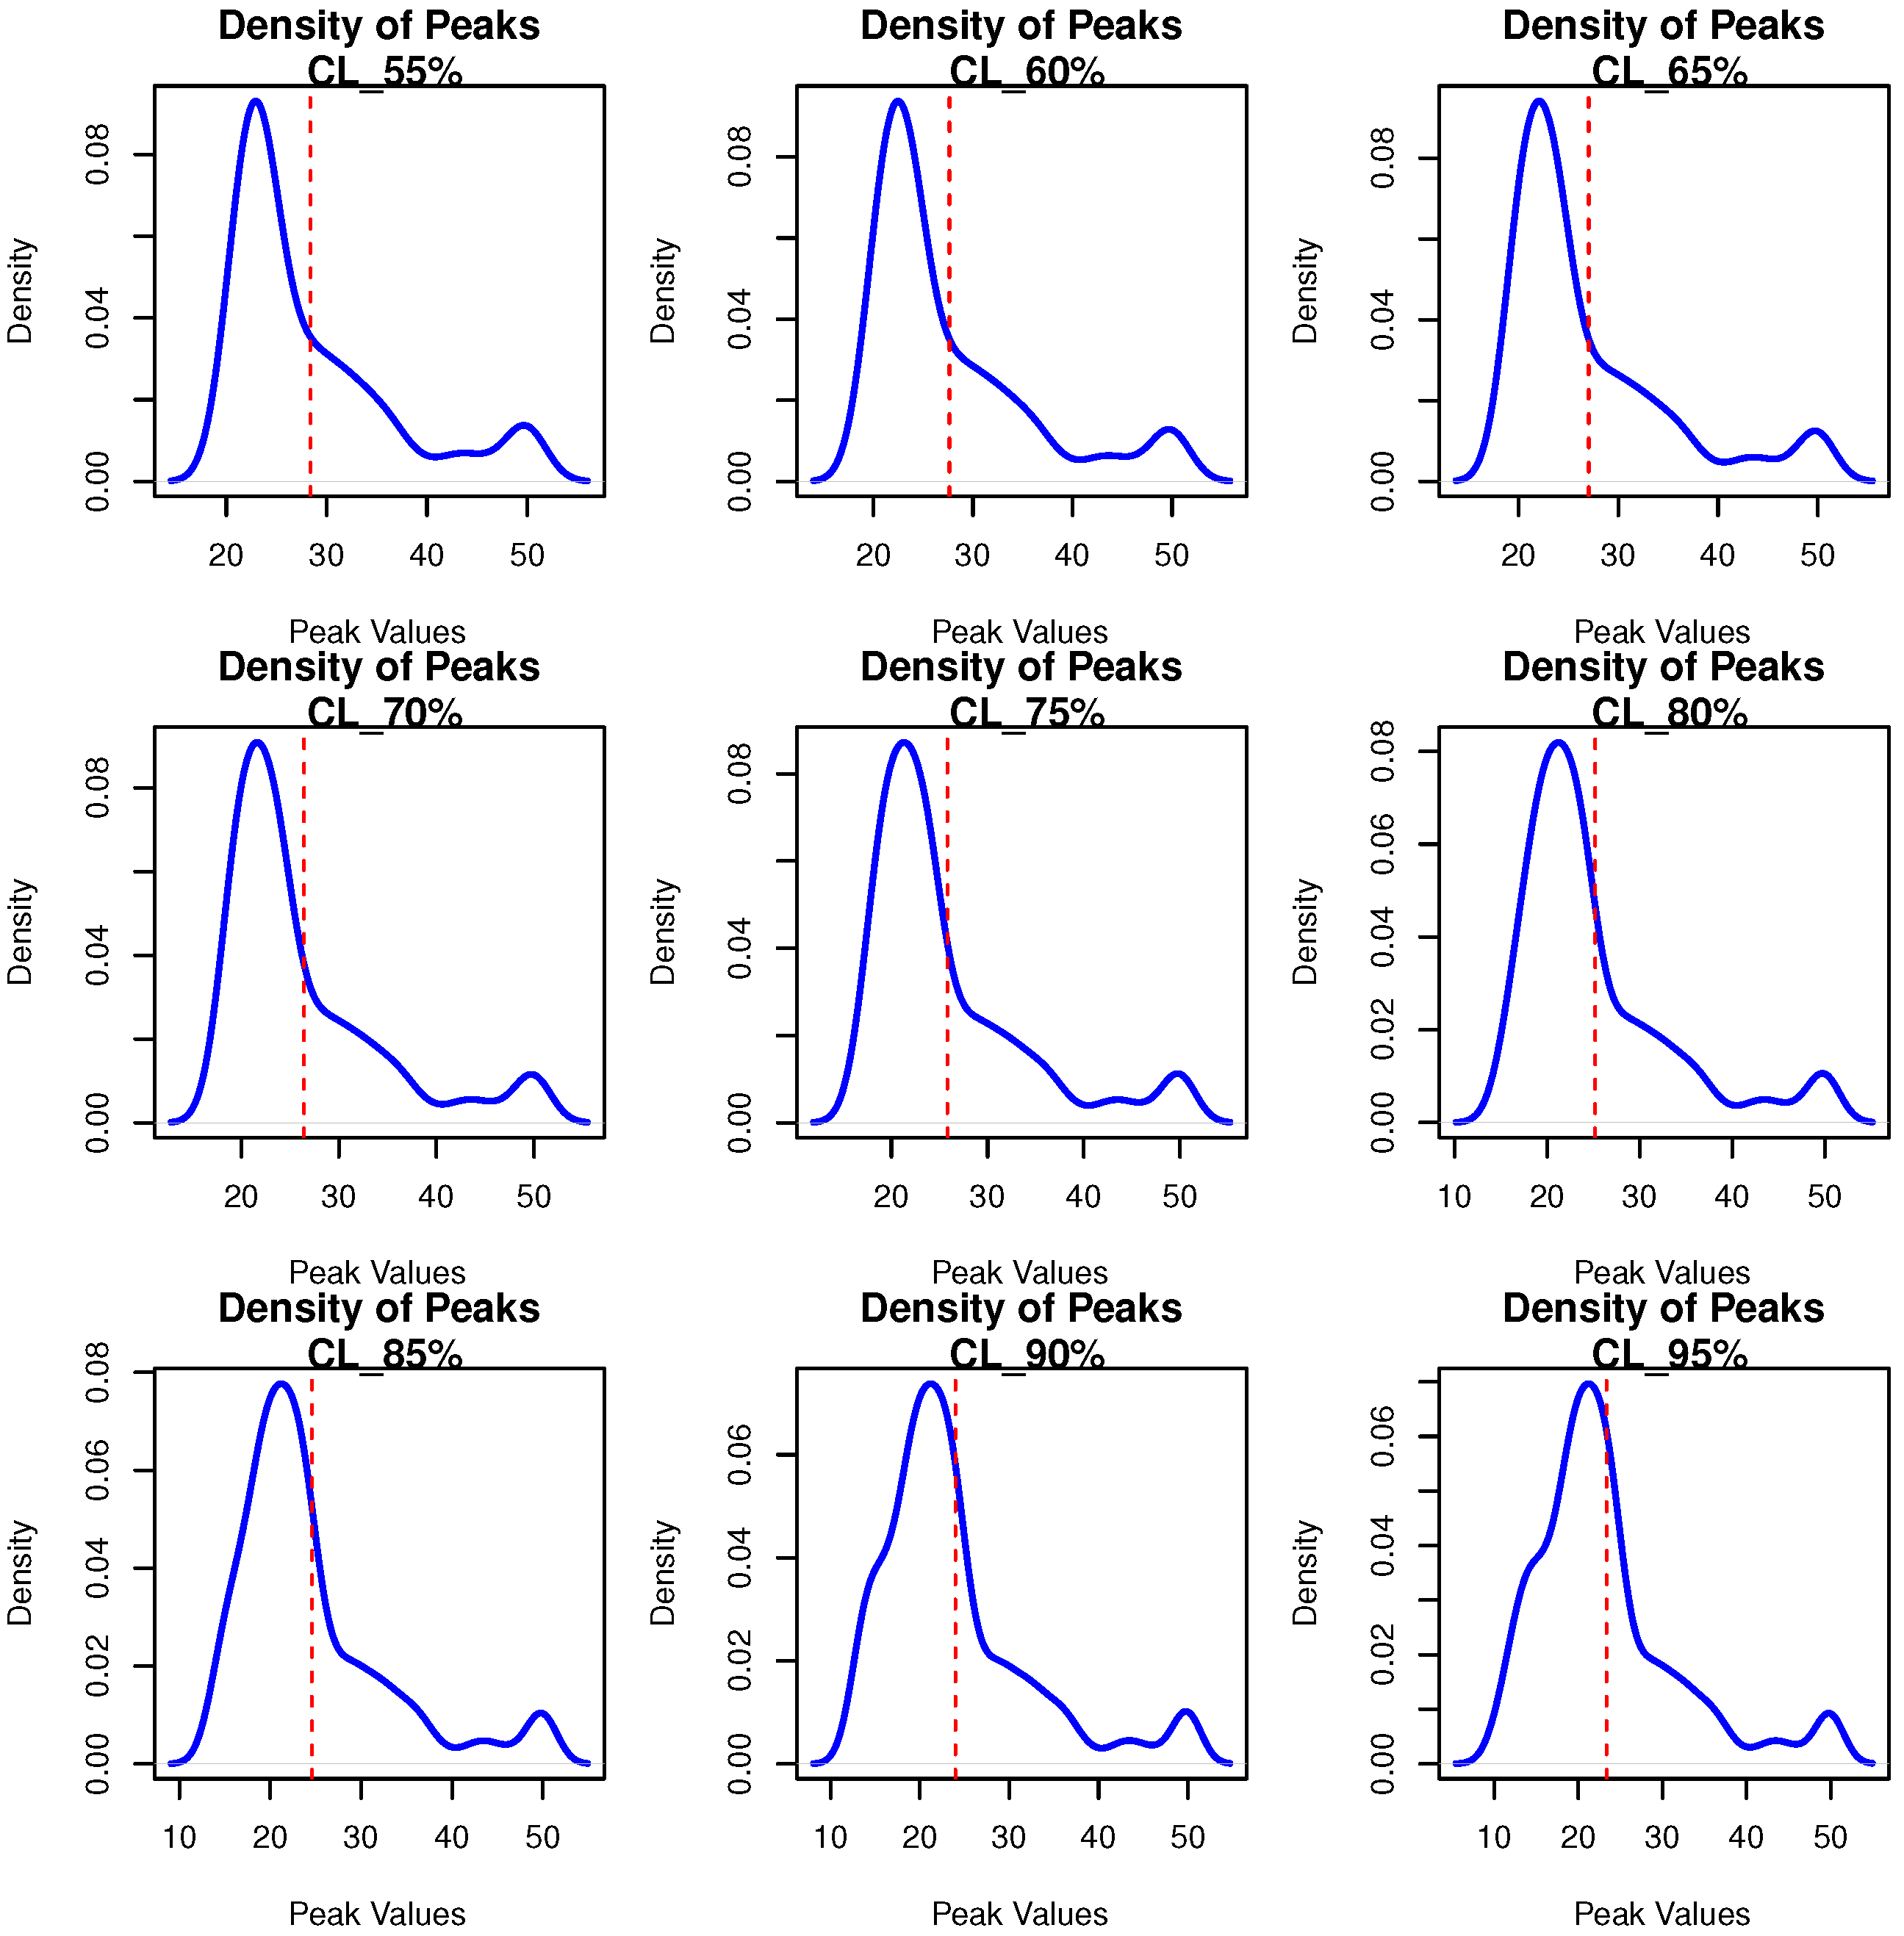
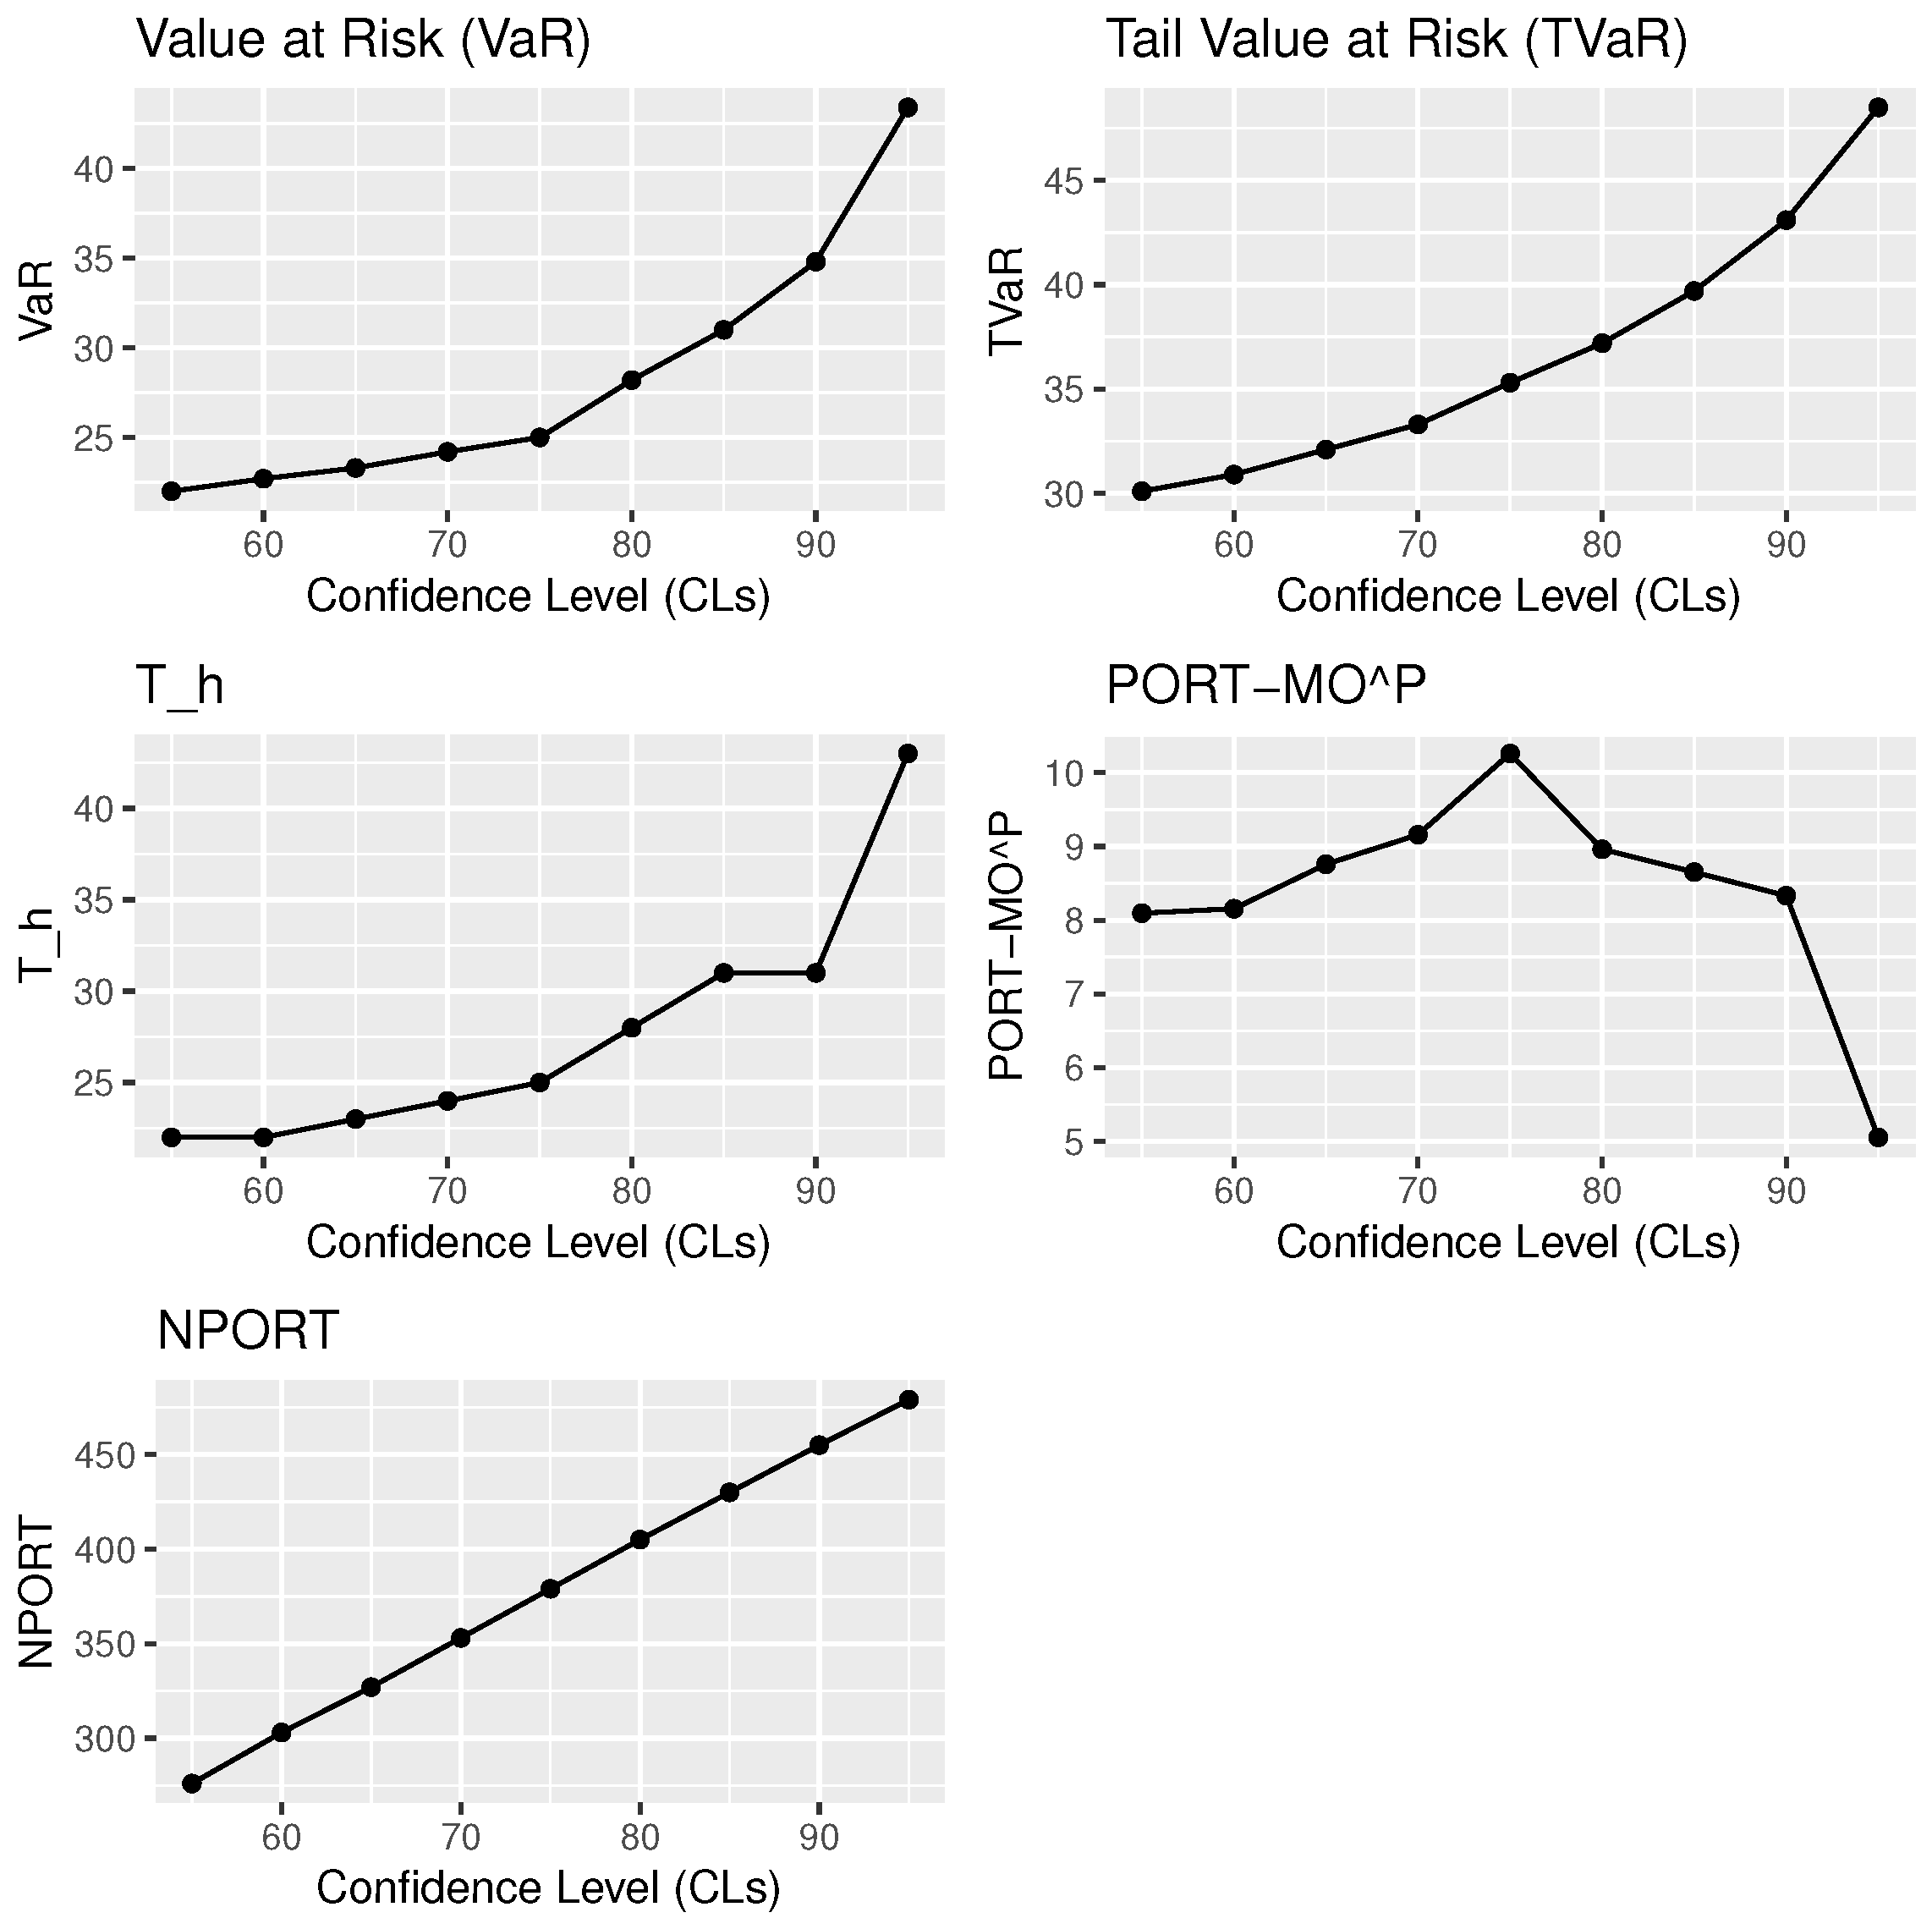
9. The PORT-VaR Estimator for the Median Values in Boston House Price Data
- Financial institutions and investors should integrate these metrics into their risk assessment frameworks to understand potential losses and volatility in the housing market better. By using the VaR and TVaR metrics, stakeholders can develop more robust models for predicting extreme market movements, which can help in formulating strategies to mitigate the risks associated with housing investments.
- Policymakers should consider implementing measures aimed at stabilizing housing prices, especially when the NPORT values indicate increased occurrences of significant price peaks. Policies such as enhancing support for affordable housing, adjusting interest rates, or providing incentives for first-time homebuyers can help maintain market stability, preventing drastic price fluctuations that could harm the economy.
- Educational programs should be developed to inform consumers about the risks associated with housing investments and market volatility, particularly in light of rising TVaR and NPORT values. Educating potential buyers about the implications of fluctuating housing prices can help them make informed decisions, reducing the likelihood of panic selling during market downturns, which could exacerbate economic instability.
- Investors should adopt diversification strategies in their portfolios to mitigate the risks associated with extreme fluctuations in the housing market. By spreading their investments across various asset classes, investors can reduce their exposure to housing market volatility, thereby stabilizing their returns and enhancing their overall portfolio’s resilience.
10. Conclusions
Author Contributions
Funding
Data Availability Statement
Conflicts of Interest
References
- Sanyal, S.; Biswas, S.K.; Das, D.; Chakraborty, M.; Purkayastha, B. Boston house price prediction using regression models. In Proceedings of the 2022 2nd International Conference on Intelligent Technologies (CONIT), Hubli, India, 24–26 June 2022; IEEE: Piscataway, NJ, USA, 2022; pp. 1–6. [Google Scholar]
- Metwane, M.K.; Maposa, D. Extreme Value Theory Modelling of the Behaviour of Johannesburg Stock Exchange Financial Market Data. Int. J. Financ. Stud. 2023, 11, 130. [Google Scholar] [CrossRef]
- Idrovo-Aguirre, B.J.; Contreras-Reyes, J.E. Monetary fiscal contributions to households and pension fund withdrawals during the COVID-19 pandemic: An approximation of their impact on construction labor supply in Chile. Soc. Sci. 2021, 10, 417. [Google Scholar] [CrossRef]
- Idrovo-Aguirre, B.J.; Contreras-Reyes, J.E. The response of housing construction to a copper price shock in Chile (2009–2020). Economies 2021, 9, 98. [Google Scholar] [CrossRef]
- Idrovo-Aguirre, B.J.; Lozano, F.J.; Contreras-Reyes, J.E. Prosperity or real estate bubble? Exuberance probability index of real housing prices in Chile. Int. J. Financ. Stud. 2021, 9, 51. [Google Scholar] [CrossRef]
- Longin, F. The threshold effect in expected utility and mean-variance analysis: Results from a medium-term asset allocation. J. Bank. Financ. 2005, 29, 509–532. [Google Scholar]
- Furman, E.; Landsman, Z. Tail variance premium with applications for elliptical portfolio of risks. ASTIN Bull. J. IAA 2006, 36, 433–462. [Google Scholar] [CrossRef]
- Landsman, Z. On the tail mean–variance optimal portfolio selection. Insur. Math. Econ. 2010, 46, 547–553. [Google Scholar] [CrossRef]
- Taylor, J.W. Estimating value at risk and expected shortfall using expectiles. J. Financ. Econ. 2008, 6, 231–252. [Google Scholar] [CrossRef]
- Klugman, S.A.; Panjer, H.H.; Willmot, G.E. Loss Models: From Data to Decisions; John Wiley & Sons: Hoboken, NJ, USA, 2012; Volume 715. [Google Scholar]
- Embrechts, P.; Klüppelberg, C.; Mikosch, T. Modelling Extremal Events: For Insurance and Finance; Springer Science & Business Media: Berlin/Heidelberg, Germany, 2013; Volume 33. [Google Scholar]
- Kessels, R.; Waldmann, K.H. The relationship between confidence levels and risk measures in quantitative risk analysis. J. Risk Financ. Manag. 2016, 9, 7. [Google Scholar]
- Korkmaz, M.C.; Altun, E.; Yousof, H.M.; Afify, A.Z.; Nadarajah, S. The Burr X Pareto Distribution: Properties, Applications and VaR Estimation. J. Risk Financ. Manag. 2018, 11, 1. [Google Scholar] [CrossRef]
- Szubzda, F.; Chlebus, M. Comparison of Block Maxima and Peaks Over Threshold Value-at-Risk models for market risk in various economic conditions. Cent. Eur. Econ. J. 2019, 6, 70–85. [Google Scholar] [CrossRef]
- de Fondeville, R.; Davison, A.C. Functional peaks-over-threshold analysis. J. R. Stat. Soc. Ser. Stat. Methodol. 2022, 84, 1392–1422. [Google Scholar] [CrossRef]
- Alizadeh, M.; Afshari, M.; Ranjbar, V.; Merovci, F.; Yousof, H.M. A novel XGamma extension: Applications and actuarial risk analysis under the reinsurance data. São Paulo J. Math. Sci. 2023, 1, 1–31. [Google Scholar] [CrossRef]
- Ibrahim, M.; Emam, W.; Tashkandy, Y.; Ali, M.M.; Yousof, H.M. Bayesian and Non-Bayesian Risk Analysis and Assessment under Left-Skewed Insurance Data and a Novel Compound Reciprocal Rayleigh Extension. Mathematics 2023, 11, 1593. [Google Scholar] [CrossRef]
- Alizadeh, M.; Afshari, M.; Contreras-Reyes, J.E.; Mazarei, D.; Yousof, H.M. The Extended Gompertz Model: Applications, Mean of Order P Assessment and Statistical Threshold Risk Analysis Based on Extreme Stresses Data. IEEE Trans. Reliab. 2024. [Google Scholar] [CrossRef]
- Elbatal, I.; Diab, L.S.; Ghorbal, A.B.; Yousof, H.M.; Elgarhy, M.; Ali, E.I. A new losses (revenues) probability model with entropy analysis, applications and case studies for value-at-risk modeling and mean of order-P analysis. AIMS Math. 2024, 9, 7169–7211. [Google Scholar] [CrossRef]
- Hald, A. Laplace’s theory of inverse probability, 1774–1786. In A History of Parametric Statistical Inference from Bernoulli to Fisher, 1713–1935; Springer: Berlin/Heidelberg, Germany, 2007; pp. 33–46. [Google Scholar]
- Aryal, G.R. Study of Laplace and Related Probability Distributions and Their Applications. Ph.D. Thesis, University of Nebraska-Lincoln, Lincoln, NA, USA, 2006. [Google Scholar]
- Azzalini, A. A class of distributions which includes the normal ones. Scand. J. Stat. 1985, 12, 171–178. [Google Scholar]
- Harandi, S.S.; Alamatsaz, M. Alpha–skew–Laplace distribution. Stat. Probab. Lett. 2013, 83, 774–782. [Google Scholar] [CrossRef]
- Shah, S.; Hazarika, P.J.; Chakraborty, S.; Alizadeh, M. The Balakrishnan-Alpha-Beta-Skew-Laplace Distribution: Properties and Applications. Stat. Optim. Inf. Comput. 2023, 11, 755–772. [Google Scholar] [CrossRef]
- Chakraborty, S.; Hazarika, P.J.; Ali, M.M. A multimodal Skew Laplace distribution. Pak. J. Stat. 2014, 30, 253–264. [Google Scholar]
- Gleaton, J.; Lynch, J. Properties of generalized log-logistic families of lifetime distributions. J. Probab. Stat. Sci. 2006, 4, 51–64. [Google Scholar]
- Cordeiro, G.M.; Alizadeh, M.; Ozel, G.; Hosseini, B.; Ortega, E.M.M.; Altun, E. The generalized odd log-logistic family of distributions: Properties, regression models and applications. J. Stat. Comput. Simul. 2017, 87, 908–932. [Google Scholar] [CrossRef]
- da Braga, A.S.; Cordeiro, G.M.; Ortega, E.M.; da Cruz, J.N. The odd log-logistic normal distribution: Theory and applications in analysis of experiments. J. Stat. Theory Pract. 2016, 10, 311–335. [Google Scholar] [CrossRef]
- Ozel, G.; Altun, E.; Alizadeh, M.; Mozafari, M. The odd log-logistic log-normal distribution with theory and applications. Adv. Data Sci. Adapt. Anal. 2018, 10, 1850009. [Google Scholar] [CrossRef]
- da Silva Braga, A.; Cordeiro, G.M.; Ortega, E.M.; Silva, G.O. The odd log-logistic student t distribution: Theory and applications. J. Agric. Biol. Environ. Stat. 2017, 22, 615–639. [Google Scholar] [CrossRef]
- Alizadeh, M.; Emadi, M.; Doostparast, M.; Cordeiro, G.M.; Ortega, E.M.; Pescim, R.R. A new family of distributions: The Kumaraswamy odd log-logistic, properties and applications. Hacet. J. Math. Stat. 2015, 44, 1491–1512. [Google Scholar] [CrossRef]
- Alizadeh, M.; MirMostafee, S.; Ortega, E.M.; Ramires, T.G.; Cordeiro, G.M. The odd log-logistic logarithmic generated family of distributions with applications in different areas. J. Stat. Distrib. Appl. 2017, 4, 1–25. [Google Scholar] [CrossRef][Green Version]
- Alizadeh, M.; Tahmasebi, S.; Haghbin, H. The exponentiated odd log-logistic family of distributions: Properties and applications. J. Stat. Model. Theory Appl. 2020, 1, 29–52. [Google Scholar]
- Afify, A.Z.; Alizadeh, M.; Zayed, M.; Ramires, T.G.; Louzada, F. The odd log-logistic exponentiated Weibull distribution: Regression modeling, properties, and applications. Iran. J. Sci. Technol. Trans. Sci. 2018, 42, 2273–2288. [Google Scholar] [CrossRef]
- Alizadeh, M.; K MirMostafaee, S.; Altun, E.; Ozel, G.; Khan Ahmadi, M. The odd log-logistic Marshall-Olkin power Lindley Distribution: Properties and applications. J. Stat. Manag. Syst. 2017, 20, 1065–1093. [Google Scholar] [CrossRef]
- Altun, E.; Alizadeh, M.; Ozel, G.; Yousof, H.M. New Odd Log-Logistic Family of Distributions: Properties, Regression Models and Applications. In G Families of Probability Distributions; CRC Press: Boca Raton, FL, USA, 2023; pp. 80–93. [Google Scholar]
- Alzaatreh, A.; Lee, C.; Famoye, F. A new method for generating families of continuous distributions. Metron 2013, 71, 63–79. [Google Scholar] [CrossRef]
- van der Lecq, M.; van Vuuren, G. Estimating Value at Risk and Expected Shortfall: A Kalman Filter Approach. Int. J. Econ. Financ. Issues 2024, 14, 1–14. [Google Scholar]
- Seyfi, S.M.S.; Sharifi, A.; Arian, H. Portfolio Value-at-Risk and Expected Shortfall Using an Efficient Simulation Approach Based on Gaussian Mixture Model. Math. Comput. Simul. 2021, 190, 1056–1079. [Google Scholar] [CrossRef]
- Wahed, A.; Ali, M.M. The skew-logistic distribution. J. Statist. Res. 2001, 35, 71–80. [Google Scholar]
- Aryal, G.; Nadarajah, S. On the skew Laplace distribution. J. Inf. Optim. Sci. 2005, 26, 205–217. [Google Scholar] [CrossRef]
- Charpentier, A.; Flachaire, E.; Ly, A. Econometrics and machine learning. Econ. Stat. 2018, 505, 147–169. [Google Scholar] [CrossRef]
- Salem, M.; Emam, W.; Tashkandy, Y.; Ibrahim, M.; Ali, M.M.; Goual, H.; Yousof, H.M. A new Lomax extension: Properties, risk analysis, censored and complete goodness-of-fit validation testing under left-skewed insurance, reliability and medical data. Symmetry 2023, 15, 1356. [Google Scholar] [CrossRef]
- Aljadani, A.; Mansour, M.M.; Yousof, H.M. A Novel Model for Finance and Reliability Applications: Theory, Practices and Financial Peaks Over a Random Threshold Value-at-Risk Analysis. Pak. J. Stat. Oper. Res. 2024, 20, 489–515. [Google Scholar] [CrossRef]
- Yousof, H.M.; Aljadani, A.; Mansour, M.M.; Abd Elrazik, E.M. A New Pareto Model: Risk Application, Reliability MOOP and PORT Value-at-Risk Analysis. Pak. J. Stat. Oper. Res. 2024, 20, 383–407. [Google Scholar] [CrossRef]
- Figueiredo, F.; Gomes, M.I.; Henriques-Rodrigues, L. Value-at-risk estimation and the PORT mean-of-order-p methodology. REVSTAT-Stat. J. 2017, 15, 187–204. [Google Scholar]



| , | ||||||||||
|---|---|---|---|---|---|---|---|---|---|---|
| Bias | MSE | Bias | MSE | Bias | MSE | Bias | MSE | |||
| 2 | 0.5 | 100 | −0.1338 | 0.0221 | −0.8765 | 0.6754 | −0.8698 | 0.7692 | −0.4389 | 0.2500 |
| 300 | 0.1301 | 0.0211 | −0.6219 | 0.5192 | 0.8110 | 0.5109 | 0.3142 | 0.2399 | ||
| 500 | −0.1270 | 0.0122 | −0.6192 | 0.5000 | −0.7132 | 0.5021 | −0.3001 | 0.2222 | ||
| 1.5 | 100 | 0.1120 | 0.3190 | 0.3172 | 0.6310 | 0.2310 | 0.0831 | 0.3333 | 0.3810 | |
| 300 | 0.1042 | 0.3200 | −0.2810 | 0.6009 | 0.2210 | 0.0722 | 0.3199 | 0.3511 | ||
| 500 | 0.0810 | 0.2910 | −0.2263 | 0.5183 | 0.2165 | 0.0701 | 0.2811 | 0.2319 | ||
| 2.5 | 100 | 0.2889 | 0.3354 | −0.6110 | 0.4519 | 0.7310 | 0.3317 | −0.4188 | 0.2001 | |
| 300 | 0.2801 | 0.3311 | 0.5996 | 0.4102 | 0.6932 | 0.3180 | −0.3777 | 0.0988 | ||
| 500 | 0.2675 | 0.3112 | 0.4980 | 0.3711 | 0.6151 | 0.2900 | −0.3510 | 0.0888 | ||
| 3.5 | 100 | −0.1991 | 0.0800 | −0.8311 | 0.6107 | −0.4229 | 0.3889 | −0.5192 | 0.2739 | |
| 300 | −0.1821 | 0.0810 | 0.7301 | 0.5868 | −0.3981 | 0.3312 | 0.4913 | 0.2677 | ||
| 500 | 0.1809 | 0.0721 | 0.7009 | 0.4722 | 0.3706 | 0.2221 | 0.4660 | 0.2449 | ||
| 4.5 | 100 | 0.1504 | 0.0329 | −0.4301 | 0.2198 | 0.2005 | 0.0870 | 0.5599 | 0.3490 | |
| 300 | −0.0341 | 0.0301 | 0.4160 | 0.1998 | −0.0669 | 0.0611 | −0.6957 | 0.2198 | ||
| 500 | 0.0288 | 0.0241 | −0.3300 | 0.1997 | 0.666 | 0.0399 | 0.4141 | 0.1765 | ||
| , | ||||||||||
|---|---|---|---|---|---|---|---|---|---|---|
| Bias | MSE | Bias | MSE | Bias | MSE | Bias | MSE | |||
| 4 | 0.5 | 100 | 0.3219 | 0.2291 | −0.4199 | 0.3199 | 0.4991 | 0.3298 | 0.3100 | 0.4184 |
| 300 | 0.2182 | 0.2166 | 0.3999 | 0.2901 | 0.4712 | 0.3100 | −0.2990 | 0.4000 | ||
| 500 | −0.2011 | 0.1981 | 0.3811 | 0.2811 | −0.3614 | 0.2766 | 0.2900 | 0.3911 | ||
| 1.5 | 100 | 0.1845 | 0.3618 | −0.2814 | 0.4185 | 0.2615 | −0.8621 | −0.3318 | 0.0921 | |
| 300 | −0.1719 | 0.3172 | 0.2617 | 0.4210 | 0.2510 | 0.7514 | 0.2341 | 0.0715 | ||
| 500 | 0.1710 | 0.2001 | −0.2221 | 0.3871 | −0.2511 | 0.6199 | 0.2301 | 0.0702 | ||
| 2.5 | 100 | 0.1765 | 0.0861 | −0.6414 | 0.4119 | 0.2661 | 0.1761 | −0.0418 | 0.1111 | |
| 300 | 0.1542 | 0.0513 | 0.6199 | 0.3978 | 0.2659 | 0.1600 | −0.0403 | 0.0833 | ||
| 500 | −0.1523 | 0.0416 | 0.5815 | 0.3666 | 0.2551 | 0.1598 | 0.3881 | 0.0815 | ||
| 3.5 | 100 | 0.2991 | 0.0881 | 0.2771 | 0.0661 | −0.3991 | 0.0915 | 0.3561 | 0.1771 | |
| 300 | 0.2714 | 0.0806 | 0.2609 | 0.0581 | 0.2981 | 0.0900 | 0.3414 | 0.1513 | ||
| 500 | −0.2599 | 0.0771 | 0.2510 | 0.0506 | 0.2881 | 0.0716 | 0.3110 | 0.1333 | ||
| 4.5 | 100 | 0.3771 | 0.2741 | −0.2890 | 0.3441 | 0.1651 | 0.2441 | 0.1442 | 0.0317 | |
| 300 | −0.3199 | 0.2699 | −0.2714 | 0.3201 | 0.1715 | 0.2211 | 0.1312 | 0.0300 | ||
| 500 | 0.3001 | 0.2500 | 0.2699 | 0.3187 | 0.1700 | 0.1851 | 0.0954 | 0.0217 | ||
| Distributions | a | b | ||||||
|---|---|---|---|---|---|---|---|---|
| N | 22.532 | 9.188 | – | – | — | −1840.24 | 3684.48 | 3692.93 |
| L | 21.592 | 4.829 | — | — | — | −1820.07 | 3644.13 | 3652.58 |
| 21.200 | 6.530 | — | — | — | −1806.26 | 3616.52 | 3624.97 | |
| 9.941 | 15.587 | — | — | 6.397 | −1812.39 | 3630.78 | 3643.45 | |
| 13.887 | 6.828 | — | — | 2.259 | −1792.76 | 3591.52 | 3604.20 | |
| 19.400 | 6.740 | — | — | 0.334 | −1794.58 | 3595.16 | 3607.83 | |
| 21.200 | 6.794 | 1.034 | — | — | −1806.25 | 3618.150 | 3631.189 | |
| 20.100 | 4.245 | 0.960 | 0.539 | — | −1789.61 | 3587.22 | 3604.13 |
| Hypothesis | LRT Statistic | d.f. | Critical Values at 5% |
|---|---|---|---|
| vs. | 33.300 | 2 | 5.991 |
| vs. | 33.280 | 1 | 3.841 |
| TMV | 22.53281 |
| MOP | 5, 5, 5.2, 5.475, 5.78 |
| MSE | 307.3993, 307.3993, 300.4262, 290.9688, 280.6565 |
| Bias | 17.53281, 17.53281, 17.33281, 17.05781, 16.75281 |
| MOP | 5.983333, 6.157143, 6.2875, 6.388889, 6.49 |
| MSE | 273.88510, 268.16240, 263.91, 260.6261, 257.3716 |
| Bias | 16.54947, 16.37566, 16.24531, 16.14392, 16.04281 |
| MOP | 6.581818, 6.708333, 6.830769, 6.935714, 7.033333 |
| MSE | 254.4340, 250.4139, 246.554, 243.2693, 240.2337 |
| Bias | 15.95099, 15.82447, 15.70204, 15.59709, 15.49947 |
| CLs↓ | VaR | TVaR | PORT-MOP | NPORT | Min.; 1st Qu.; Med; ExV; 3rd Qu.; Max. | |
|---|---|---|---|---|---|---|
| 55% | 22.0 | 30.1 | 22 | 8.0950 | 276 | 20.50 22.60 24.70 28.37 31.77 50.00 |
| 60% | 22.7 | 30.9 | 22 | 8.1550 | 303 | 19.80 22.00 24.20 27.64 31.05 50.00 |
| 65% | 23.3 | 32.1 | 23 | 8.7583 | 327 | 19.20 21.45 23.80 27.04 30.10 50.00 |
| 70% | 24.2 | 33.3 | 24 | 9.1586 | 353 | 18.30 20.80 23.30 26.42 29.60 50.00 |
| 75% | 25.0 | 35.3 | 25 | 10.2590 | 379 | 17.10 20.25 23.10 25.82 28.70 50.00 |
| 80% | 28.2 | 37.2 | 28 | 8.9614 | 405 | 15.30 19.70 22.70 25.20 28.20 50.00 |
| 85% | 31.0 | 39.7 | 31 | 8.6513 | 430 | 14.00 19.30 22.30 24.58 27.50 50.00 |
| 90% | 34.8 | 43.1 | 31 | 8.3314 | 455 | 12.80 18.70 22.00 23.97 26.65 50.00 |
| 95% | 43.4 | 48.5 | 43 | 5.0538 | 479 | 10.40 17.85 21.70 23.35 26.30 50.00 |
Disclaimer/Publisher’s Note: The statements, opinions and data contained in all publications are solely those of the individual author(s) and contributor(s) and not of MDPI and/or the editor(s). MDPI and/or the editor(s) disclaim responsibility for any injury to people or property resulting from any ideas, methods, instructions or products referred to in the content. |
© 2025 by the authors. Licensee MDPI, Basel, Switzerland. This article is an open access article distributed under the terms and conditions of the Creative Commons Attribution (CC BY) license (https://creativecommons.org/licenses/by/4.0/).
Share and Cite
Das, J.; Hazarika, P.J.; Alizadeh, M.; Contreras-Reyes, J.E.; Mohammad, H.H.; Yousof, H.M. Economic Peaks and Value-at-Risk Analysis: A Novel Approach Using the Laplace Distribution for House Prices. Math. Comput. Appl. 2025, 30, 4. https://doi.org/10.3390/mca30010004
Das J, Hazarika PJ, Alizadeh M, Contreras-Reyes JE, Mohammad HH, Yousof HM. Economic Peaks and Value-at-Risk Analysis: A Novel Approach Using the Laplace Distribution for House Prices. Mathematical and Computational Applications. 2025; 30(1):4. https://doi.org/10.3390/mca30010004
Chicago/Turabian StyleDas, Jondeep, Partha Jyoti Hazarika, Morad Alizadeh, Javier E. Contreras-Reyes, Hebatallah H. Mohammad, and Haitham M. Yousof. 2025. "Economic Peaks and Value-at-Risk Analysis: A Novel Approach Using the Laplace Distribution for House Prices" Mathematical and Computational Applications 30, no. 1: 4. https://doi.org/10.3390/mca30010004
APA StyleDas, J., Hazarika, P. J., Alizadeh, M., Contreras-Reyes, J. E., Mohammad, H. H., & Yousof, H. M. (2025). Economic Peaks and Value-at-Risk Analysis: A Novel Approach Using the Laplace Distribution for House Prices. Mathematical and Computational Applications, 30(1), 4. https://doi.org/10.3390/mca30010004


