Article

A Novel Method of Optimal Capacitor Placement in the Presence of Harmonics for Power Distribution Network Using NSGA-II Multi-Objective Genetic Optimization Algorithm

by
Majid Ebrahimi Moghadam
1,
Hamid Falaghi
1,* and
Mahdi Farhadi
2,*
1
Electric and Computer Engineering Department, University of Birjand, Birjand, Iran
2
Computer and Industries Department, Birjand University of Technology, Birjand, Iran
*
Authors to whom correspondence should be addressed.
Math. Comput. Appl. 2020, 25(1), 17; https://doi.org/10.3390/mca25010017
Submission received: 6 January 2020 / Revised: 16 March 2020 / Accepted: 16 March 2020 / Published: 19 March 2020
(This article belongs to the Special Issue Numerical and Evolutionary Optimization 2019)

Abstract

:
One of the effective ways of reducing power system losses is local compensation of part of the reactive power consumption by deploying shunt capacitor banks. Since the capacitor’s impedance is frequency-dependent and it is possible to generate resonances at harmonic frequencies, it is important to provide an efficient method for the placement of capacitor banks in the presence of nonlinear loads which are the main cause of harmonic generation. This paper proposes a solution for a multi-objective optimization problem to address the optimal placement of capacitor banks in the presence of nonlinear loads, and it establishes a reasonable reconciliation between costs, along with improvement of harmonic distortion and a voltage index. In this paper, while using the harmonic power flow method to calculate the electrical quantities of the grid in terms of harmonic effects, the non-dominated sorting genetic (NSGA)-II multi-objective genetic optimization algorithm was used to obtain a set of solutions named the Pareto front for the problem. To evaluate the effectiveness of the proposed method, the problem was tested for an IEEE 18-bus system. The results were compared with the methods used in eight other studies. The simulation results show the considerable efficiency and superiority of the proposed flexible method over other methods.

1. Introduction

The response to electricity consumption growth with maximum economic efficiency, which is the main goal in the design and development of electric power distribution networks, must fully comply with the system’s limitations. The large numbers of decision variables in distribution grids, which are caused by the presence of many components in the grid, create serious problems for the design and development of these grids. The steady increase in economic risk caused by the high volume of investment and the rising cost of energy and equipment, especially in restructured grids, encouraged distribution network designers to adopt more precise and appropriate design approaches.
In recent decades, the issue of independent reactive power services, including the optimal placement of capacitors in the grid due to the restructuring of the electricity industry and the creation of a competitive electricity market, received attention from related companies [1]. Shunt capacitor placement was proposed for distribution grids to compensate for reactive power, to adjust and improve voltage profile, to modify power factor, and to reduce power and energy losses [2].
In the case of capacitor placement, the place and the size of capacitor banks should be determined in such a way to maximize all benefits and design objectives while satisfying all the constraints [3].
Utilizing renewable energy in today’s advanced power system requires the extensive use of nonlinear elements including semiconductors and electronic power converters, which lead to undesirable effects such as the generation of voltage distortions and the injection of current and voltage harmonics into the power system. This can cause significant operating losses, which can even be considered as a serious threat to the operation of the power system [4,5].
The lifetime reduction of devices, torque fluctuations, the increase in losses, and the severe distortion of voltage waveforms at the joint connection are among the problems caused by harmonic currents due to nonlinear loads in power systems [6]. Even semiconductor-based equipment, which is the main cause of the low power quality of the grid used in modern technologies, such as advanced information technology and microelectronics, needs high-quality power [7].
The place and the size determinations of capacitor banks play an important role in reducing losses and improving total harmonic distortion (THD). On one hand, neglecting harmonics in the capacitor placement problem causes errors in the calculation. On the other hand, lack of proper modeling of nonlinear loads and inappropriate selection of the place and size of capacitor banks can cause more problems in the power quality of the power system by generating resonances at harmonic frequencies between capacitors and multiple inductors installed in the system [2,8,9,10].
Despite the importance of proper capacitor bank placement in the presence of voltage and current harmonics, this issue receives little attention.
There are serious conflicts between the objectives of reducing investment costs associated with the construction of capacitor banks and improving the quality of system capacity, such that improving one objective can weaken another. In this article, we try to find a suitable solution to this problem.
So far, extensive studies were done to locate the capacitor and determine its optimum type and capacity without harmonics [11,12,13].
In addition to the various studies conducted without harmonics, studies on the placement of capacitor banks in the last decade were carried out considering the effect of harmonics on the power distribution networks, as outlined below.
Masoum et al. proposed a fuzzy logic-based approach to determine the optimum location and size of capacitive banks in radial distribution networks taking into account the effect of harmonics. In this method, the objective functions were the costs of power losses, energy losses, and capacitive banks. In addition, the limits on the voltage, number, size, and location of installed capacitors and power quality limits were also met in accordance with IEEE-519 [14].
In another paper presented by Eajal et al., the harmonics in the unbalanced power distribution network were considered, using a combination of two particle swarm optimization (PSO) algorithms and radial distribution power flow (RDPF) by minimizing the total cost of real power losses while providing operation constraints and power quality. The results showed the necessity of the consideration of harmonics in the problem of optimal capacitor placement [2].
Farag et al. proposed a new algorithm for optimal capacitor placement in multi micro-grid systems considering the island operational mode. The proposed method, which considered probabilistic models of sources of distributed generation (DG), used the genetic algorithm (GA) to solve the model optimization problem [15].
An algorithm including an improved method of reconfiguration and capacitor placement was proposed by Farahani et al. using two methods of discrete genetic algorithm optimization and simulated annealing (SA) [3].
In another paper, Chang et al. used a method based on the combination of fuzzy logic and an immune algorithm to locate and determine the optimum size of shunt capacitor banks; they demonstrated the advantage of this hybrid method compared to the other two methods based on fuzzy and genetic algorithms [16].
In addition to the above studies, a new optimization method called plant growth-based optimization was used by Huang et al. for the placement problem and determining the optimal capacitor size [17].
One of the most noteworthy points in the evaluated references regarding the optimal capacitor placement is that each article has a different perspective on problem solving. In Reference [14], for example, the purpose was to reduce the cost of capacitor placement and power and energy losses, whereas, in Reference [2], only the reduction of the total cost of real power loss in the grid was investigated. However, in all of these studies, special attention was paid to solving the problem in the presence of nonlinear loads that cause harmonics.
This paper presents a new method for the problem of optimal location of capacitive banks in the presence of harmonics caused by nonlinear loads. This method was developed in the form of a multi-objective optimization problem, with application of the non-dominated sorting genetic (NSGA)-II algorithm. In the proposed method, the three objectives were to reduce the annual cost of loss and capacitance (cost, total harmonic distortion (THD), and voltage index (VI)). These provide a reasonable compromise among the objectives of the problem. Finally, the efficiency of the proposed model was tested in the 18-bus distribution grid of the IEEE standard and compared with the methods used in eight other studies. The superiority of the Pareto front solutions of the proposed model compared to the other references indicates the efficiency of the proposed algorithm. Since this model offers a Pareto front as a problem solution set, the system designer can select any of the proposed solutions according to the grid properties. Therefore, the proposed model is much more flexible than other single-objective optimization methods.
According to the structure of the present paper, Section 2 presents the system modeling at harmonic frequencies, Section 3 presents the problem of optimal capacitor placement in the presence of harmonics by defining the objective functions and limitations governing the system, and Section 4 presents the proposed NSGA-II multi-objective optimization method. Section 5 deals with the selection method of the ultimate solution. Case studies on the IEEE 18-bus standard grid are presented, along with the results of other studies, in Section 6, where the valuable benefits of the proposed new method are compared with six studies. Finally, in Section 7, the results are presented.

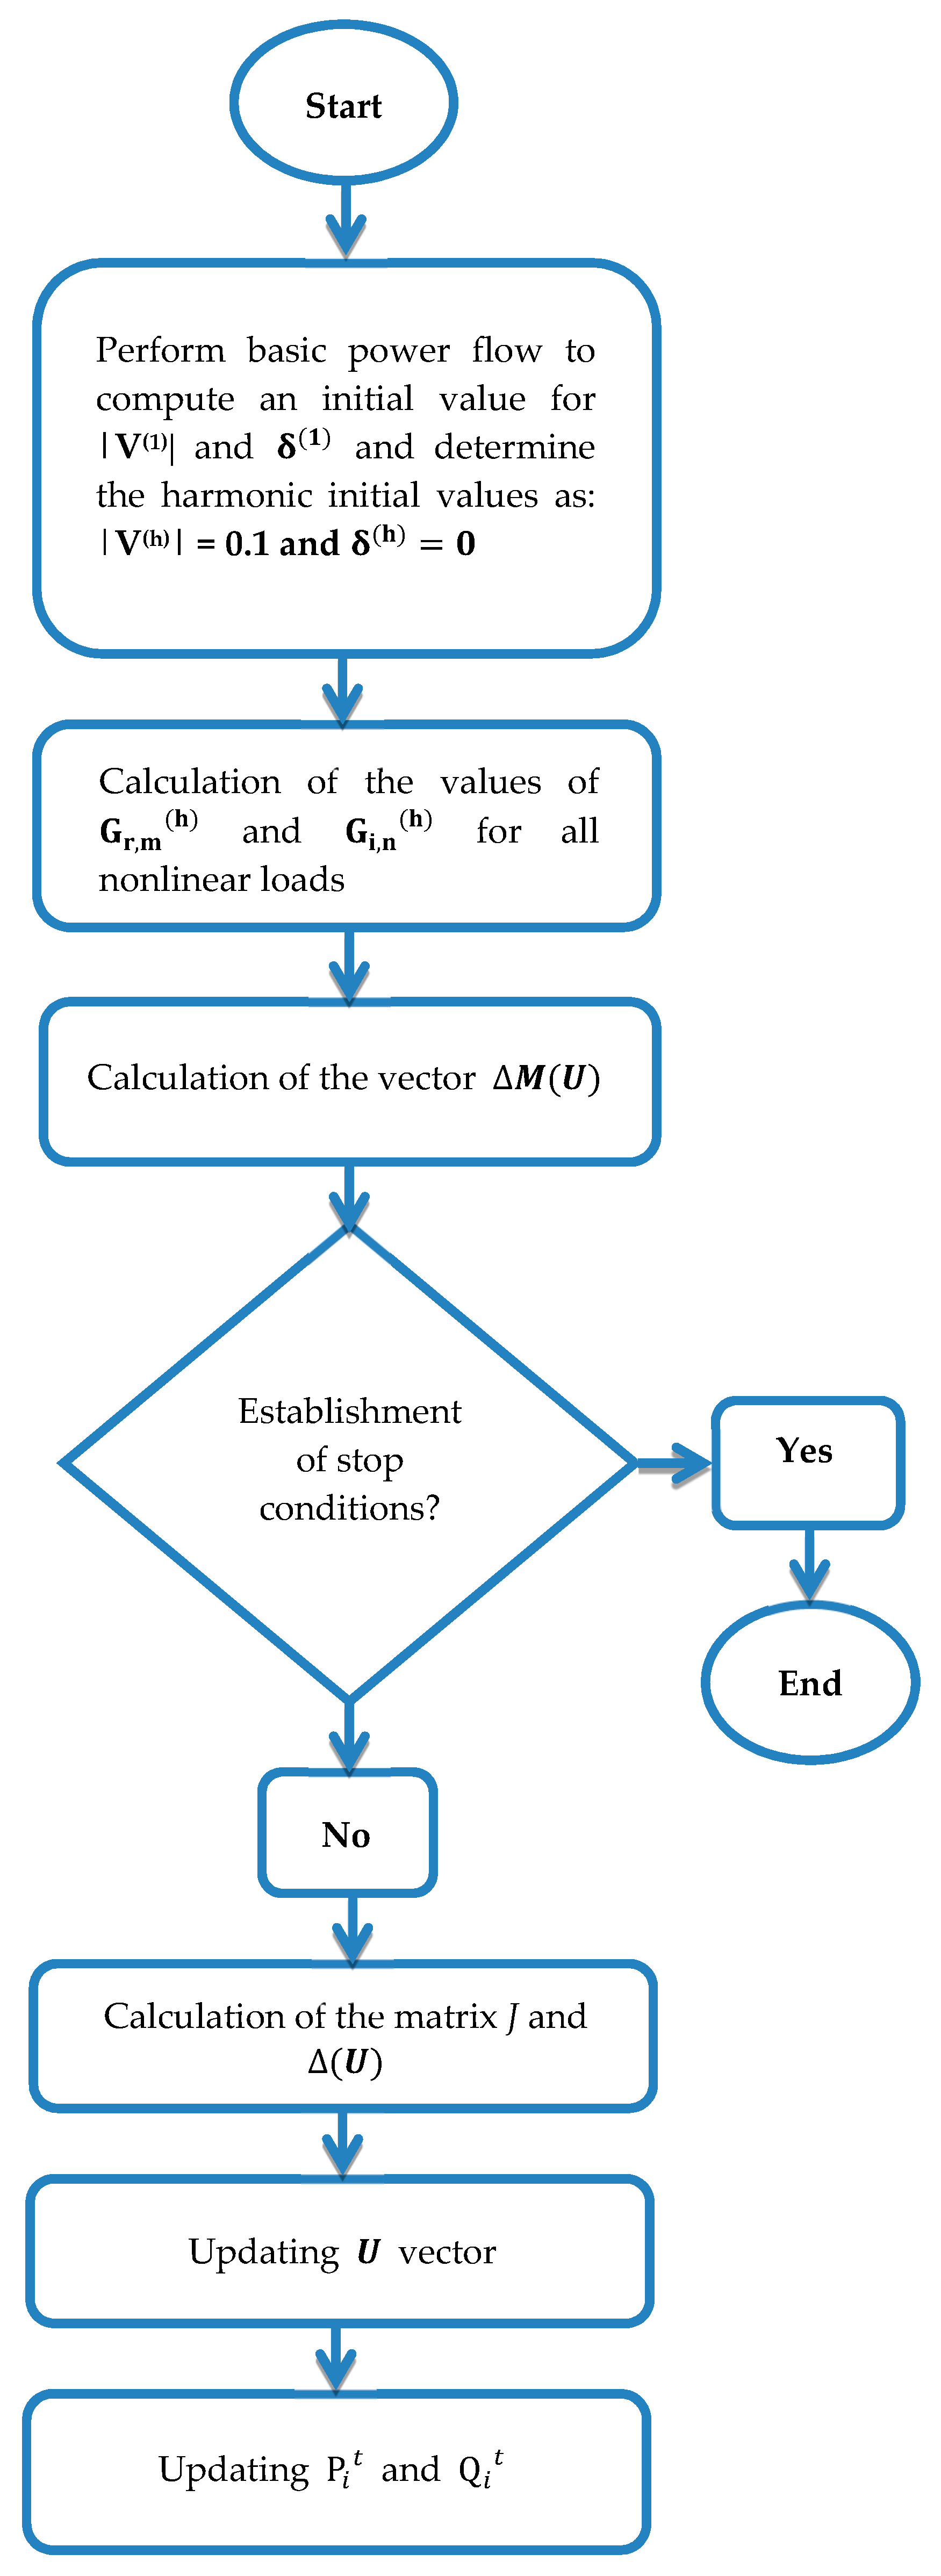
2. System Modeling at Harmonic Frequencies

The formulations of References [18,19,20,21] were used to model a distribution system at the basic and harmonic frequencies. The system was solved using the forward backward sweep power flow method.
The nature of buses for a system consisting of n buses was defined as follows:
  • Bus 1 as the slack bus with values determined for voltage | V 1 | and phase angle δ 1 ;
  • Buses 2 to m − 1 as ordinary linear buses (PQ or PV);
  • Buses m to n as non-linear buses.
The nonlinear load model is shown in the frequency domain. This model describes the relationship between the voltages and the harmonic currents of V ( h ) and I ( h ) . The semiconductor-controlled rectifier (SCR) model is available as an example of nonlinear loads [22].
The basic sweep power flow method was used to calculate the grid electrical parameters [23].
According to the harmonic power flow algorithm used in the article, we show in Equation (1) the maximum harmonic order of L.
Δ M = J Δ U ,
where ΔM and ΔU vectors are shown in Equations (2) and (3).
Δ M = [ Δ W ¯ Δ I ¯ ( 5 ) Δ I ¯ ( 7 ) Δ I ¯ ( L ) Δ I ¯ ( 1 ) ] ,
Δ U = [ Δ V ¯ ( 1 ) Δ V ¯ ( 5 ) Δ V ¯ ( 7 ) Δ V ¯ ( L ) Δ ] .
The Jacobean matrix (J) is shown in Equation (4).
J = [ J ( 1 ) J ( 5 ) J ( L ) 0 Y G ( 5 , 1 ) Y G ( 5 , 5 ) Y G ( 5 , l ) H ( 5 ) Y G ( 7 , 1 ) Y G ( 7 , 5 ) Y G ( 7 , L ) H ( 7 ) Y G ( L , 1 ) Y G ( L , 5 ) Y G ( L , L ) H ( L ) Y G ( 1 , 1 ) Y G ( 1 , 5 ) Y G ( 1 , L ) H ( 1 ) ]
The elements of vectors and sub-matrices were defined in References [18,19,20,21]. In the harmonic power flow, the capacitors were considered as fixed capacitor banks and the capacitor placement was performed for the MC buses. MC is the set of buses in which the capacitor is located. Furthermore, the equations in Reference [24] were used for the admittance of linear loads at harmonic frequencies.
y j ( h ) = ( P j ( 1 ) j Q j ( 1 ) ) / h | V j ( 1 ) | 2   f o r   j = 2 , ,   m 1 .
The coefficient j before Q j ( 1 ) represents the imaginary operator ( 1 ) .
The harmonic power flow algorithm calculates the bus voltage vector U for a given system with linear and nonlinear loads.
The flowchart of the seven-step Newton–Raphson harmonic power flow algorithm used is shown in Figure 1.
In the proposed flowchart, | V ( h ) | and δ ( h ) are the values of the amplitude and phase angle of the voltage vector of the system buses, respectively. G r m ( h ) and G i m ( h ) are the vectors of non-linear injective active and reactive currents corresponding to the bus m for harmonic h, respectively. P j t and Q j t are the sum of the fundamental and harmonic components of the nonlinear active and reactive loads in bus j, respectively.
The method of solving the harmonic power flow algorithm is fully described in Appendix B via Equations (A1)–(A22).

3. Optimal Capacitor Placement in the Presence of Harmonics

In this paper, capacitors are assumed with constant and selectable values of Cf, and the grid is considered as three-phase balanced with the presence of linear and non-linear loads.
The problem of capacitor placement considering the effect of harmonics in the form of two parts (objective functions and system constraints) is presented below.

3.1. Objective Functions

In order to find the optimal capacitor placement and size in this paper, the objective function is defined as minimizing the three variables of cost, total harmonic distortion (THD), and voltage index (VI).
min(Cost, THD, VI).
The cost considered in the capacitor placement problem includes the cost of the capacitors, the cost of energy losses, and the cost of power losses according to Equation (5).
Cos t = K E TP loss ( V ( 1 ) , ,   V ( L ) , C ) + i MC K cfp C fi + K A P loss ( V ( 1 ) , , V ( L ) , C ) ,
where KE denotes the energy loss coefficient [25,26], T is the load duration, Ploss is the total system loss, V(h) represents the bus voltage vector at harmonic h, C is the capacitance of the connected capacitor, Kcfp denotes the cost per unit of constant capacitor [26,27], Cfi is the capacity of the installed capacitor in bus i, and KA is the energy cost savings per megawatt to reduce losses.
In general, losses due to non-compensation of the reactive power grid, for two reasons, increase electricity grid costs, as shown in Equation (7). These reasons are the cost of energy losses (Floss) and the cost of power losses (Fcapacity).
Energy losses due to the inadequate compensation of reactive power at all times of the day, including during peak hours of electricity consumption, lead to increased fuel costs and, consequently, to increased grid costs. This loss phrase is specified by the expression “ K E TP loss ( V ( 1 ) , ,   V ( L ) , C ) ” in Equation (7), where TP loss is expressed by the energy type in MWh, and the coefficient KE is expressed by the $/MWh. The cost of energy losses is a type of operating cost that is incurred at all hours of the day, including during peak hours.
In addition, the inadequate compensation of reactive power during peak hours can increase the cost of occupying the capacity of all upstream network equipment including lines, substations, power plants, etc. This cost is called the cost of power losses. The cost of power losses, which is a type of investment cost and is measured in $, is shown by the expression “ K A P loss ( V ( 1 ) , , V ( L ) , C ) ” in Equation (7).
Total harmonic distortion is one of the important factors in harmonic exposure, where the maximum total harmonic distortion in the grid is considered as the objective function of THD in Equation (6). In this function, the maximum is on i, and the h numbers of the L-th harmonic are considered.
THD = max [ ( [ h 1 ( V i ( h ) ) 2 ] / V i ( 1 ) ) .100   f o r   i = 1 , , n ] .
In addition, the maximum voltage index in the grid is considered as the objective function (VI) in Equation (9).
VI = m a x [ { V i V m a x i f   V i > V m a x 0 i f   V m i n   V i V m a x V m i n V i i f   V i < V m i n ] ,
where V i is the i-th bus voltage, V m i n and V m a x are the minimum and maximum voltage values of each bus, and the maximum is on i. The total losses can be calculated using the harmonic power flow output as follows:
P l o s s = h = 1 L [ i = 1 n j = 1 n V i ( h ) V j ( h ) y i j ( h ) c o s ( θ i ( h ) θ j ( h ) δ i j ( h ) ) ] ,
where V i ( h ) and θ i ( h ) are respectively the magnitude and phase angle of the h-th harmonic voltage at bus i, and y i j ( h ) and δ i j ( h ) are respectively the magnitude and angle of the phase of the line admittance of the h-th harmonic between the buses i and j.

3.2. Limitations

System limitations based on the IEEE-519 standard should be taken into account in the model [28].
1. Voltage limitation
V m i n h ( V i ( h ) ) 2   V m a x   f o r   i = 1 , , n .
2. Voltage distortion
T H D v , i = ( [   h 1 ( V i ( h ) ) 2   ] / V i ( 1 ) ) .100 % T H D v m a x   f o r   i = 1 , , n .
3. Permitted numbers of capacitor units
u = u f i u m a x   f o r   i MC ,
where u f i denotes the constant number of capacitor banks in bus i, and MC is the set of buses in which the capacitor is located. Capacitors must be selected from specified and standard values according to References [26,27]. V max and V min are 1.10 Vrated and 0.9 Vrated, respectively, in Equation (11).

4. Proposed Multi-Objective Optimization NSGA-II Method

The mathematical model presented for the capacitor placement problem has a complex and nonlinear nature. In this model, the optimal location and capacitance of capacitors in distribution networks are considered. The objectives of the model optimization include the simultaneous minimization of loss and capacitance costs, harmonic distortion reduction, and voltage index.
The new NSGA-II multi-objective optimization algorithm was used to solve the proposed model. This algorithm is based on References [29,30,31] (described in detail in Reference [32]), and it performs far better than the NSGA algorithm, in which non-dominated fronts, called the Pareto fronts, are obtained for the problem of locating the capacitors in the presence of harmonics for various objectives. Figure 2 shows the flow of the NSGA-II algorithm [32].

5. Selection the Ultimate Solution
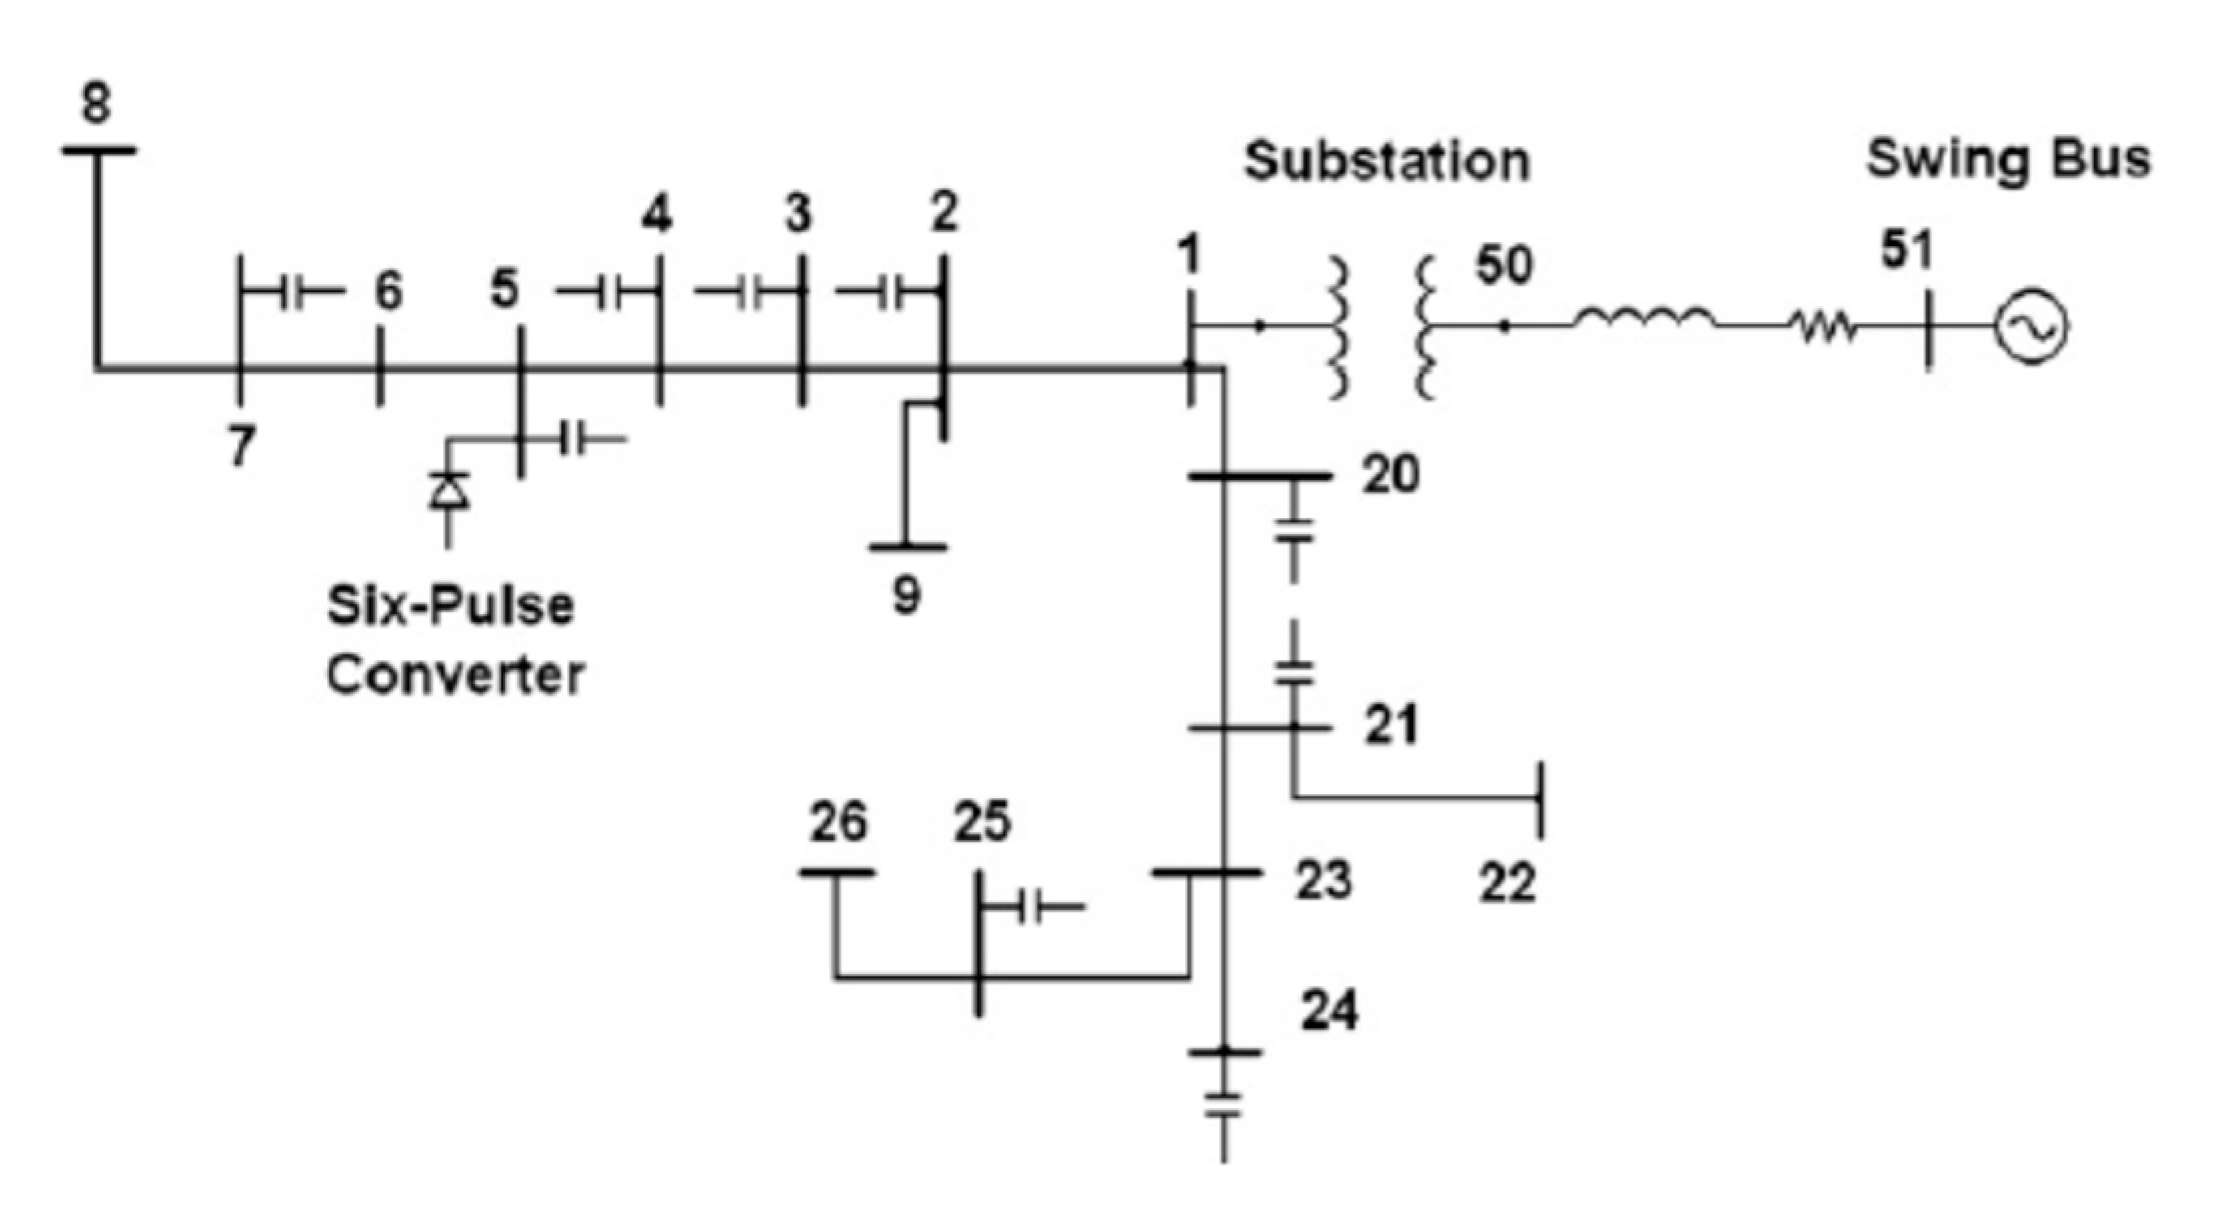
The choice of the ultimate multi-objective solution is up to power system planners. This is done by analyzing the set of Pareto optimal solutions, taking into account the most satisfying values of the three objectives and taking into account the professional experience and perspective of the planner.
In the present paper, a maximum–minimum approach was used to select the best (final) multi-objective solution. Each solution in the Pareto optimal solution set had a related vector (cost, THD, VI). The normalized values of the vector elements of each solution k were calculated using Equations (14)–(16).
C o s t k n = C o s t M a x C o s t ( k ) C o s t M a x C o s t m i n ,
T H D k n = T H D M a x T H D ( k ) T H D M a x T H D m i n ,
V I k n = V I M a x V I ( k ) V I M a x V I m i n ,
where C o s t M a x , T H D M a x , and V I M a x are the maximum values obtained for the objective functions C o s t ( k ) , T H D ( k ) , and V I ( k ) , respectively, while C o s t m i n , T H D m i n , and V I m i n are the minimum values obtained for the objective functions C o s t ( k ) , T H D ( k ) , and V I ( k ) , respectively.
It is worth noting that the result of this normalization shows the degree of satisfaction of each objective function. Finally, a maximum–minimum method was used to select the best (final) multipurpose replacement solution according to Equation (17) [33,34,35].
M a x { min k { C o s t k n , T H D k n , V I k n } } .

6. Case Studies

In the studied grid, which is an 18-bus IEEE distribution network in the presence of a typical nonlinear load, consisting of a six-pulse converter with 3 MW active power and 2.26 MVar reactive power in bus number 5, the voltage range was between 0.95 and 1.05 and the system loads were of commercial, residential, and office types. It was also possible to install capacitors on all buses. Line and bus information from Reference [36], as well as the constant annual capacitor costs and harmonic current, was extracted as a percentage of the basic current for the six-pulse converter from References [26,37].
The IEEE standard 18-bus network information obtained from Reference [36] is provided in Appendix A.
Using the information provided above, the grid was tested and the results were compared with the following previously presented methods: genetic algorithm method (GA) [26], maximum sensitivities selection method (MSS) [37], maximum sensitivities selection local variations method (MSS-LV) [38], fuzzy method [14], genetic algorithm–fuzzy logic method (GA–FL) [39], and particle swarm optimization method (PSO) [34].
As can be seen in Figure 3 and Figure 4, the front obtained was in the form of a curve for the three objectives of cost, THD, and VI.
To illustrate the capability of the proposed method and to compare the responses with other methods, the magnification of Figure 3 is presented in Figure 4.
In addition to plotting the main and magnified curves of the Pareto front for all three objectives, separate magnification curves for the two objectives of the above-mentioned triple objectives are presented in Figure 5, Figure 6 and Figure 7.
As can be seen in Figure 5, Figure 6 and Figure 7, there were solutions for all the Pareto fronts that dominated the results of the other references, demonstrating the efficiency of the proposed method.
In addition to the figures shown, the results of the best solutions are presented below; Table 1 provides the results associated with the lowest cost, lowest THD, and lowest VI, along with the capacitor placements.

7. Results

In this paper, the problem of optimal placement of capacitor banks in the presence of nonlinear load harmonics was modeled in the form of a multi-objective problem with the aim of reducing the annual cost of losses and capacitor placement, reducing total harmonic distortion, and reducing the voltage index, such that a reasonable compromise could be reached among the objectives of the problem. Then, the efficiency of the proposed model was tested in the IEEE 18-bus power distribution network.
As shown in Figure 3, Figure 4, Figure 5, Figure 6 and Figure 7, using the new NSGA-II approach, the system designer can select any of the Pareto front solutions based on the grid needs and opinions of the power system operators. If cost reduction is prioritized, the solutions with more profit and lower harmonic distortion improvement can be selected and, if the reduction of THD is more important, the solutions close to the solution with the lowest THD can be selected.
Since this model provides a Pareto front as a problem solution set, the system designer can select any of the proposed solutions according to the grid properties. Therefore, the proposed new model is much more flexible than the single-objective methods compared. Moreover, the superiority of the Pareto front solutions of the proposed model with respect to the solutions of previous methods indicates the efficiency of the proposed algorithm.
The valuable results of the proposed method indicate that the following:
  • The place and the capacity of capacitor banks play an important role in reducing losses and improving the total harmonic distortion (THD), whereas neglecting harmonics in the capacitor placement problem causes errors in the calculation.
  • Lack of proper placement and size of capacitor banks, as well as inadequate modeling of nonlinear loads, not only removes capacitor banks from the optimal placement and size, but also causes further problems in power system quality.
  • The use of capacitor banks solely in order to reduce THD is not recommended, due to the high cost it applies to the grid and the effects it has on the grid.

Author Contributions

Conceptualization, H.F.; data curation, M.E.M.; formal analysis, M.E.M. and H.F.; investigation, H.F.; methodology, M.E.M. and H.F.; project administration, H.F.; resources, M.E.M., H.F., and M.F.; software, M.E.M.; supervision, H.F.; validation, M.E.M. and H.F.; visualization, H.F.; writing—original draft, M.F.; writing—review and editing, M.F. All authors have read and agreed to the published version of the manuscript.

Conflicts of Interest

The authors declare no conflicts of interest.

Appendix A

The IEEE standard 18-bus network information obtained from Reference [36] is provided below.
Figure A1 shows the IEEE standard 18-bus grid.
Figure A1. IEEE 18-bus network [21,36].
Mca 25 00017 g0a1
The grid line information of the IEEE standard 18-bus network is shown in Table A1.
Table A1. The IEEE standard 18-bus system line information.
From BusTo BusR (%)X (%)Line Charge (%)Length (miles)Base Impedance (Ω)Harmonic Only
120.4311.2040.00350.31815.6250
230.6011.6770.00490.44315.6250
340.3160.8820.00260.23315.6250
450.8962.5020.00730.66115.6250
560.2950.8240.00240.21815.6250
671.7202.1200.00460.45515.6250
784.0703.0530.00510.56815.6250
291.7062.2090.00430.45115.6250
1202.9103.7680.00740.76915.6250
20212.2222.8770.00560.58715.6250
21224.8036.2180.01221.26915.6250
21233.9855.1600.01011.05315.625 0
23242.9103.7680.00740.76915.625 0
23253.7274.5930.01000.98515.625 0
25262.2082.7200.00590.58315.6250
5010.3126.7530000
50510.0500.3440000
In this network, a typical non-linear load (six-pulse converter) with 3 MW of active power and 2.26 MVar of reactive power is located at bus number 5 and the voltage range is between 0.95 pu and 1.05 pu.
The system loads are commercial, residential, and office. It is possible to install capacitors on all buses.
The bus information for the 18-bus IEEE standard network is shown in Table A2.
Table A3 shows the harmonic current size as a percentage of the basic current for the six-pulse converter.
Table A2. Bus information for the 18-bus IEEE standard network.
Bus NumBus TypePGen (%)QGen (%)S(VA) (%)PLoad (%)QLoad (%)Bus Volt (%) Shunt Load (%)
130000000
2300021.20−10.5
3300042.50−6
43000159.30−6
5230003022.60−18
630008500
7300021.20−6
83000106.200
9300053.100
203000106.20−6
21300031.90−12
22300021.200
2330008500
24300053.10−15
253000106.20−9
26300021.200
503000000−12
511000001050
Table A3. The harmonic current size as a percentage of the basic current for the six-pulse converter.
Harmonic NumberAmplitude (%)Harmonic NumberAmplitude (%)Harmonic NumberAmplitude (%)
1100192.4370.5
519.1231.2410.5
713.1250.8430.5
117.2290.2470.4
135.6310.2490.4
173.3350.4

Appendix B

The flowchart of Newton–Raphson’s harmonic power flow is shown in Figure 1.
The harmonic power flow algorithm calculates the bus voltage vector U for a given system with linear and nonlinear loads. The method of solving the harmonic power flow algorithm is shown below via Equations (A1)–(A22).
Step 1: At first, all nonlinear loads are considered as linear loads. Using one of the basic power flow methods, we calculate the approximate initial value and phase angle for the base voltage of the bus. An initial guess for the size and phase angle of the harmonic voltage of the buses is considered, for example, 0.1 pu and 0 radian.
Step 2: The currents of nonlinear devices G r , m ( h ) and G i , m ( h ) for nonlinear loads are calculated.
{ R e a l ( I i n j e c t e d ( h ) ) = g r , m ( h )   ( V m ( 1 ) , V m ( 5 ) , V m ( 7 ) , , V m ( L ) , α m , β m ) I m a g ( I i n j e c t e d ( h ) ) = g i , m ( h )   ( V m ( 1 ) , V m ( 5 ) , V m ( 7 ) , , V m ( L ) , α m , β m ) .
Step 3: ∆M is calculated using the following equations. If they are small enough, we stop the process.
Δ M ¯ = [ Δ W ¯ , Δ I ¯ ( 5 ) , , Δ I ¯ ( L ) , Δ I ¯ ( 1 ) ] t ,
Δ W ¯ = [ P 2 ( 1 ) + F r , 2 ( 1 ) , Q 2 ( 1 ) + F i , 2 ( 1 ) , ,   P m 1 ( 1 ) + F r , m 1 ( 1 )   ,   Q m 1 ( 1 ) + F i , m 1 ( 1 ) , Δ P m n o n l i n e a r , Δ Q m n o n l i n e a r , ,   Δ P n n o n l i n e a r , Δ Q n n o n l i n e a r ] ,
[ I r , m ( 1 ) I i , m ( 1 ) I r , n ( 1 ) I i , n ( 1 ) ] = [ g r , m ( 1 ) ( V m ( 1 ) , V m ( 5 ) , V m ( 7 ) , , V m ( L ) , α m , β m ) g i , m ( 1 ) ( V m ( 1 ) , V m ( 5 ) , V m ( 7 ) , , V m ( L ) , α m , β m ) g r , n ( 1 ) ( V n ( 1 ) , V n ( 5 ) , V n ( 7 ) , , V n ( L ) , α n , β n ) g i , n ( 1 ) ( V n ( 1 ) , V n ( 5 ) , V n ( 7 ) , , V n ( L ) , α n , β n ) ] ,
Δ I r , i ( h ) = I r , i ( h ) + G r , i ( h ) = j = 1 n y i j ( h ) | V ˜ j ( h ) | c o s ( θ i , j ( h ) + δ j ( h ) ) + G r , i ( h ) ,
Δ I i , i ( h ) = I i , i ( h ) + G i , i ( h ) = j = 1 n y i j ( h ) | V ˜ j ( h ) | s i n ( θ i , j ( h ) + δ j ( h ) ) + G i , i ( h ) .
Step 4: The Jacobean matrix J is calculated using the following equations, and then Δ U ¯ is calculated using its inverse.
Δ U ¯ γ = J ¯ 1 Δ M ¯ ( U ¯ γ ) ,
Δ U ¯ = [ J ¯ ( 1 ) J ¯ ( 5 ) J ¯ ( L ) 0 Y G ¯ ( 5 , 1 ) Y G ¯ ( 5 , 5 ) Y G ¯ ( 5 , l ) H ¯ ( 5 ) Y G ¯ ( 7 , 1 ) Y G ¯ ( 7 , 5 ) Y G ¯ ( 7 , L ) H ¯ ( 7 ) Y G ¯ ( L , 1 ) Y G ¯ ( L , 5 ) Y G ¯ ( L , L ) H ¯ ( L ) Y G ¯ ( 1 , 1 ) Y G ¯ ( 1 , 5 ) Y G ¯ ( 1 , L ) H ¯ ( 1 ) ] [ Δ W ¯ Δ I ¯ ( 5 ) Δ I ¯ ( 7 ) Δ I ¯ ( L ) Δ I ¯ ( 1 ) ] ,
J ¯ ( h ) = [ O ¯ 2 ( m 2 ) × 2 n ( z e r o   e n t r i e s   f o r   l i n e a r   b u s e s ) p a r t i a l   d e r i v a t i v e s   o f   t h e   h t h   h a r m o n i c m i s m a t c h   ( t o t a l )   P   a n d   Q   a t   n o n l i n e a r b u s e s   w i t h   r e s p e c t   t o   V ( h )   a n d   δ ( h ) ] ,
Y G ¯ ( h , j ) = { Y ¯ ( h , h ) + G ¯ ( h , h ) f o r   h = j O ¯ + G ¯ ( h , j ) f o r   h j ,
Y G ¯ ( h , j ) = [ Y ¯ ( h , h ) G ¯ ( h , h )   Y ¯ ( h , j ) = 0 G ¯ ( h , j ) ] ,
G ¯ ( h , j ) = [ A B C D ] ,
A = O ¯ 2 ( m 1 ) × 2 ( m 1 ) ,
B = O ¯ 2 ( m 1 ) × 2 ( n m 1 ) ,
C = O ¯ 2 ( n m 1 ) × 2 ( m 1 ) ,
D = [ G r , m ( h ) δ m ( j ) G i , m ( h ) δ m ( j ) G r , m ( h ) V m ( j ) G i , m ( h ) V m ( j ) 0 0 0 0 0 0 0 0 G r , m ( h ) δ m ( j ) G i , m ( h ) δ m ( j ) G r , m ( h ) V m ( j ) G i , m ( h ) V m ( j ) ]
Y ¯ ( h , h ) = [ I r , 1 ( h ) δ 1 ( h ) I i , 1 ( h ) δ 1 ( h ) I r , 1 ( h ) V 1 ( h ) I i , 1 ( h ) V 1 ( h ) I r , 1 ( h ) δ n ( h ) I i , 1 ( h ) δ n ( h ) I r , 1 ( h ) V n ( h ) I i , 1 ( h ) V n ( h ) I r , n ( h ) δ 1 ( h ) I i , n ( h ) δ 1 ( h ) I r , n ( h ) V 1 ( h ) I i , n ( h ) V 1 ( h ) I r , n ( h ) δ n ( h ) I i , 1 ( h ) δ n ( h ) I r , n ( h ) V n ( h ) I i , n ( h ) V n ( h ) ]
H ¯ ( h ) = [ G r , m ( h ) α m G i , m ( h ) α m G r , m ( h ) β m G i , m ( h ) β m 0 0 0 0 0 0 0 0 G r , n ( h ) α n G i , n ( h ) α n G r , n ( h ) β n G i , n ( h ) β n ]
Step 5: The U value is updated.
U ¯ ( γ + 1 ) = U ¯ ( γ ) Δ U ¯ ( γ ) .
Step 6: The total power (fundamental and harmonic) in non-linear buses ( P j t , Q j t ) is updated, and the total apparent power is specified.
S j 2 = ( P j t ) 2 + ( Q j t ) 2 + D j 2 ,
Δ P j n o n l i n e a r = P j t + h F r , j ( h ) ,
Δ Q j n o n l i n e a r = Q j t + h F r , j ( h ) .
Step 7: Return to Step 2 [18,19].

References

  1. Seyed Shenava, S.J.; Ghasemi, A. Planning and Distribution of Reactive Power Using the Parabolic HBMO Multi-Objective Method Based on Fuzzy Logic. Iran. Electr. Ind. J. Qual. Product. 2012, 1, 2. [Google Scholar]
  2. Eajal, A.A.; El-Hawary, M.E. Optimal Capacitor Placement and Sizing in Unbalanced Distribution Systems with Harmonics Consideration Using Particle Swarm Optimization. IEEE Trans. Power Deliv. 2010, 25, 173–1744. [Google Scholar] [CrossRef]
  3. Farahani, V.; Vahidi, B.; Abyaneh, H.A. Reconfiguration and Capacitor Placement Simultaneously for Energy Loss Reduction Based on an Improved Reconfiguration Method. IEEE Trans. Power Syst. 2012, 27, 587–595. [Google Scholar] [CrossRef]
  4. Tiwari, V.K.; Jain, S.K. Hardware Implementation of Poly Phase Decomposition-Based Wavelet Filters for Power System Harmonics Estimation. IEEE Trans. Instrum. Meas. 2016, 65, 1585–1595. [Google Scholar] [CrossRef]
  5. Sun, X.; Han, R.; Shen, H.; Wang, B.; Lu, Z.; Chen, Z. A Double-Resistive Active Power Filter System to Attenuate Harmonic Voltages of a Radial Power Distribution Feeder. IEEE Trans. Power Electron. 2016, 31, 6203–6216. [Google Scholar] [CrossRef]
  6. Kiani Moghaddam, M.; Salamnia, A.; Shivai, M.; Ameli, M.T. A New Multi-Objective Approach for Scheduling Active Power Filters Using Melody Search Algorithm and Fuzzy Satisfaction Method. Iran. Electr. Ind. J. Qual. Product. 2012, 9, 31–47. [Google Scholar]
  7. Li, D.; Zhu, Z.Q.; Qin, Y. A Novel Variable Reactor and Its Application to Shunt Power Quality Controller. IEEE Trans. Power Electron. 2016, 31, 4148–4159. [Google Scholar] [CrossRef]
  8. Mohammadi, M. Probabilistic harmonic load flow using fast point estimate method. IET Gener. Transm. Distrib. 2015, 9, 1790–1799. [Google Scholar] [CrossRef]
  9. Romero, A.A.; Zini, H.C.; Ratta, G. Modeling input parameter interactions in the possibilistic harmonic load flow. IET Gener. Transm. Distrib. 2012, 6, 528–538. [Google Scholar] [CrossRef]
  10. Romero, A.; Zini, H.C.; Ratta, G.; Dib, R. Harmonic load-flow approach based on the possibility theory. IET Gener. Transm. Distrib. 2011, 5, 393–404. [Google Scholar] [CrossRef]
  11. Khaboot, N.; Srithapon, C.; Siritaratiwat, A.; Khunkitti, P. Increasing Benefits in High PV Penetration Distribution System by Using Battery Energy Storage and Capacitor Placement Based on Salp Swarm Algorithm. Energies 2019, 12, 4817. [Google Scholar] [CrossRef] [Green Version]
  12. Lee, W.T.; Horng, S.C.; Lin, C.F. Application of Ordinal Optimization to Reactive Volt-Ampere Sources Planning Problems. Energies 2019, 12, 2746. [Google Scholar] [CrossRef] [Green Version]
  13. Kishore, C.; Ghosh, S.; Karar, V. Symmetric Fuzzy Logic and IBFOA Solutions for Optimal Position and Rating of Capacitors Allocated to Radial Distribution Networks. Energies 2018, 11, 766. [Google Scholar] [CrossRef] [Green Version]
  14. Masoum, M.A.; Jafarian, A.; Lajevardi, M.; Fuchs, E.F.; Grady, W.M. Fuzzy Approach for Optimal Placement and Sizing of Capacitor Banks in the Presence of Harmonics. IEEE Trans. Power Deliv. 2004, 19, 822–831. [Google Scholar] [CrossRef]
  15. Farag, H.E.Z.; El Saadany, E.F. Optimum Shunt Capacitor Placement in Multi Microgrid Systems with Consideration of Islanded Mode of Operation. IEEE Trans. Sustain. Energy 2015, 6, 1435–1446. [Google Scholar] [CrossRef]
  16. Chang, G.W.; Chang, W.C.; Chuang, C.S.; Shih, D.Y. Fuzzy Logic and Immune-Based Algorithm for Placement and Sizing of Shunt Capacitor Banks in a Distorted Power Network. IEEE Trans. Power Deliv. 2011, 26, 2145–2153. [Google Scholar] [CrossRef]
  17. Huang, S.J.; Liu, X.Z. A Plant Growth-Based Optimization Approach Applied to Capacitor Placement in Power Systems. IEEE Trans. Power Syst. 2012, 27, 2138–2147. [Google Scholar] [CrossRef]
  18. Xia, D.; Heydt, G.T. Harmonic power flow studies—part I formulation and solution. IEEE Trans. Power Appar. Syst. 1982, 101, 1257–1265. [Google Scholar] [CrossRef]
  19. Xia, D.; Heydt, G.T. Harmonic power flow studies—part II implementation and practical application. IEEE Trans. Power Appar. Syst. 1982, 101, 1266–1270. [Google Scholar] [CrossRef]
  20. Masoum, M.A.; Fuchs, E.F. Transformer magnetizing current and iron core losses in harmonic power flow. IEEE Trans. Power Deliv. 1994, 9, 10–20. [Google Scholar] [CrossRef]
  21. Taher, S.A.; Karimian, A.; Hasani, M. A new method for optimal location and sizing of capacitors in distorted distribution networks using PSO algorithm. Simul. Model. Pract. Theory 2011, 19, 662–672. [Google Scholar] [CrossRef]
  22. Fuchs, E.; Masoum, M.A. Power Quality in Power Systems and Electrical Machines; Elsevier: New York, NY, USA, 2008; pp. 261–300. [Google Scholar]
  23. Shirmohamad, D.; Hong, H.W.; Semlyen, A. A compensation-based power flow method for weakly meshed distribution and transmission networks. IEEE Trans. Power Syst. 1988, 3, 753–762. [Google Scholar] [CrossRef]
  24. Baghzouz, Y. Effects of nonlinear loads on optimal capacitor placement in radial feeders. IEEE Trans. Power Deliv. 1991, 6, 245–251. [Google Scholar] [CrossRef]
  25. Wu, Z.Q.; Lo, K. Optimal choice of fixed and switched capacitors in radial distributions with distorted substation voltage. IEE Proc. Gener. Transm. Distrib. 1995, 142, 24–28. [Google Scholar] [CrossRef]
  26. Masoum, M.A.; Lajevardi, M.; Jafarian, M.; Fuchs, E.F. Optimal placement, replacement and sizing of capacitor banks in distorted distribution networks by genetic algorithms. IEEE Trans. Power Deliv. 2004, 19, 4. [Google Scholar] [CrossRef]
  27. Gou, B.; Abur, A. Optimal capacitor placement for improving power quality. In Proceedings of the IEEE Power Engineering Society Summer Meeting, Edmonton, AB, Canada, 18–22 July 1999; pp. 488–492. [Google Scholar]
  28. IEEE Recommended Practices and Requirements for Harmonic Control in Electric Power Systems. IEEE standard 519-1992. Available online: http://www.coe.ufrj.br/~richard/Acionamentos/IEEE519.pdf (accessed on 19 March 2020).
  29. Srinivas, N.; Deb, K. Multi Objective Optimization Using Non Dominated Sorting in Genetic Algorithms. Evol. Comput. 1994, 3, 221–248. [Google Scholar] [CrossRef]
  30. Deb, K.; Pratap, A.; Agarwal, S.; Meyarivan, T. A Fast Elitist Multi Objective Genetic Algorithm: NSGA-II. IEEE Trans. Evol. Comput. 2002, 2, 182–197. [Google Scholar] [CrossRef] [Green Version]
  31. Zhou, J.; Wang, C.; Zhu, J. Multi-Objective Optimization of a Spring Diaphragm Clutch on an Automobile Based on the Non-Dominated Sorting Genetic Algorithm (NSGA-II). Math. Comput. Appl. 2016, 21, 47. [Google Scholar] [CrossRef] [Green Version]
  32. Chang, Y.; Bouzarkouna, Z.; Devegowda, Z. Multi-objective optimization for rapid and robust optimal oilfield development under geological uncertainty. Comput. Geosci. 2015, 19, 933–950. [Google Scholar] [CrossRef]
  33. Haghifam, M.-R.; Falaghi, H.; Malik, O.P. Risk-based distributed generation placement. IET Gener. Transm. Distrib. 2008, 2, 252–260. [Google Scholar] [CrossRef]
  34. Ramirez-Rosado, J.; Domigez-Navaro, J.A. Possibilistic model based on fuzzy sets for the multi objective optimal planning of electric power distribution networks. IEEE Trans. Power Syst. 2004, 19, 1801–1810. [Google Scholar] [CrossRef]
  35. Lai, Y.L.; Hwang, C.L. Fuzzy Mathematical Programming; Springer-Verlag: Berlin, Germany, 1992. [Google Scholar]
  36. Grady, W.M.; Samotyj, M.J.; Noyola, A.H. The application of network objective functions for actively minimizing the impact of voltage harmonics in power systems. IEEE Trans. Power Deliv. 1992, 7, 1379–1386. [Google Scholar] [CrossRef]
  37. Masoum, M.A.; Lajevardi, M.; Fuchs, E.F.; Grady, W.M. Optimal placement and sizing of fixed and switched capacitor banks under nonsinusoidal operating conditions. In Proceedings of the IEEE Summer Power Meeting, Chicago, IL, USA, 21–25 July 2002; pp. 807–813. [Google Scholar]
  38. Masoum, M.A.; Lajevardi, M.; Fuchs, E.F.; Grady, W.M. Application of local variations and maximum sensitivities selections for optimal placement of shunt capacitor banks under nonsinusoidal operating conditions. Int. J. Electr. Power Energy Syst. 2004, 26, 761–769. [Google Scholar] [CrossRef]
  39. Lajevardi, M.; Masoum, M.A. Genetically optimized fuzzy placement and sizing of capacitor banks in distorted distribution networks. IEEE Trans. Power Deliv. 2008, 23, 449–456. [Google Scholar] [CrossRef]
Figure 1. Flowchart of Newton–Raphson harmonic power flow algorithm [18,19].
Mca 25 00017 g001
Figure 2. Non-dominated sorting genetic algorithm (NSGA)-II [32].
Mca 25 00017 g002
Figure 3. Curve of the proposed method with three objectives: cost, total harmonic distortion (THD) and voltage index (VI).
Mca 25 00017 g003
Figure 4. Magnification of Figure 3 showing the capability of the proposed method, along with a comparison of responses using other methods.
Mca 25 00017 g004
Figure 5. Magnification of the results of the proposed method with the two objectives of cost and THD, along with comparisons with other methods.
Mca 25 00017 g005
Figure 6. Magnification of the results of the proposed method with the two objectives of cost and VI, along with comparison with other methods.
Mca 25 00017 g006
Figure 7. Magnification of the results of the proposed method with the two objectives of THD and VI, along with other methods.
Mca 25 00017 g007
Table 1. Results for the solutions with the lowest cost, the lowest THD, and the most appropriate response.
GoalMinimum CostMinimum THDV maxMinimum VI
Capacitor Banks (pu)Q1000
Q2000
Q30.9600.3590.070
Q400.319
Q50.16000.159
Q60.3590.6380.319
Q70.47800.558
Q80.1190.9970.239
Q900.2790
Q100.159 00.159
Q110.079 00.039
Q120.2390.3190.279
Q130.03900.039
Q140.11900.159
Q150.03900
Q16000
Q170.07900
Q18000
Maximum THDV (%)7.6523362.4912665.578439
Maximum Voltage (pu)1.0697891.082021.064749
Minimum Voltage (pu)1.0289221.0205611.018906
Loss (kw)2.36 × 1052.79 × 1052.41 × 105
Total Cost($/year)1.34 × 1051.57 × 1051.36 × 105

