
A Weakly Pareto Compliant Quality Indicator


Abstract
:1. Introduction
- minimize the APF distance from the POF;
- obtain a good (usually uniform) distribution of the solutions found;
- maximize the APF extension i.e., for each objective the non-dominated solutions should cover a wide range of values (best case: the global optimum of each objective function must be found);
- maximize the APF density, i.e., high cardinality for the approximation set is desirable.
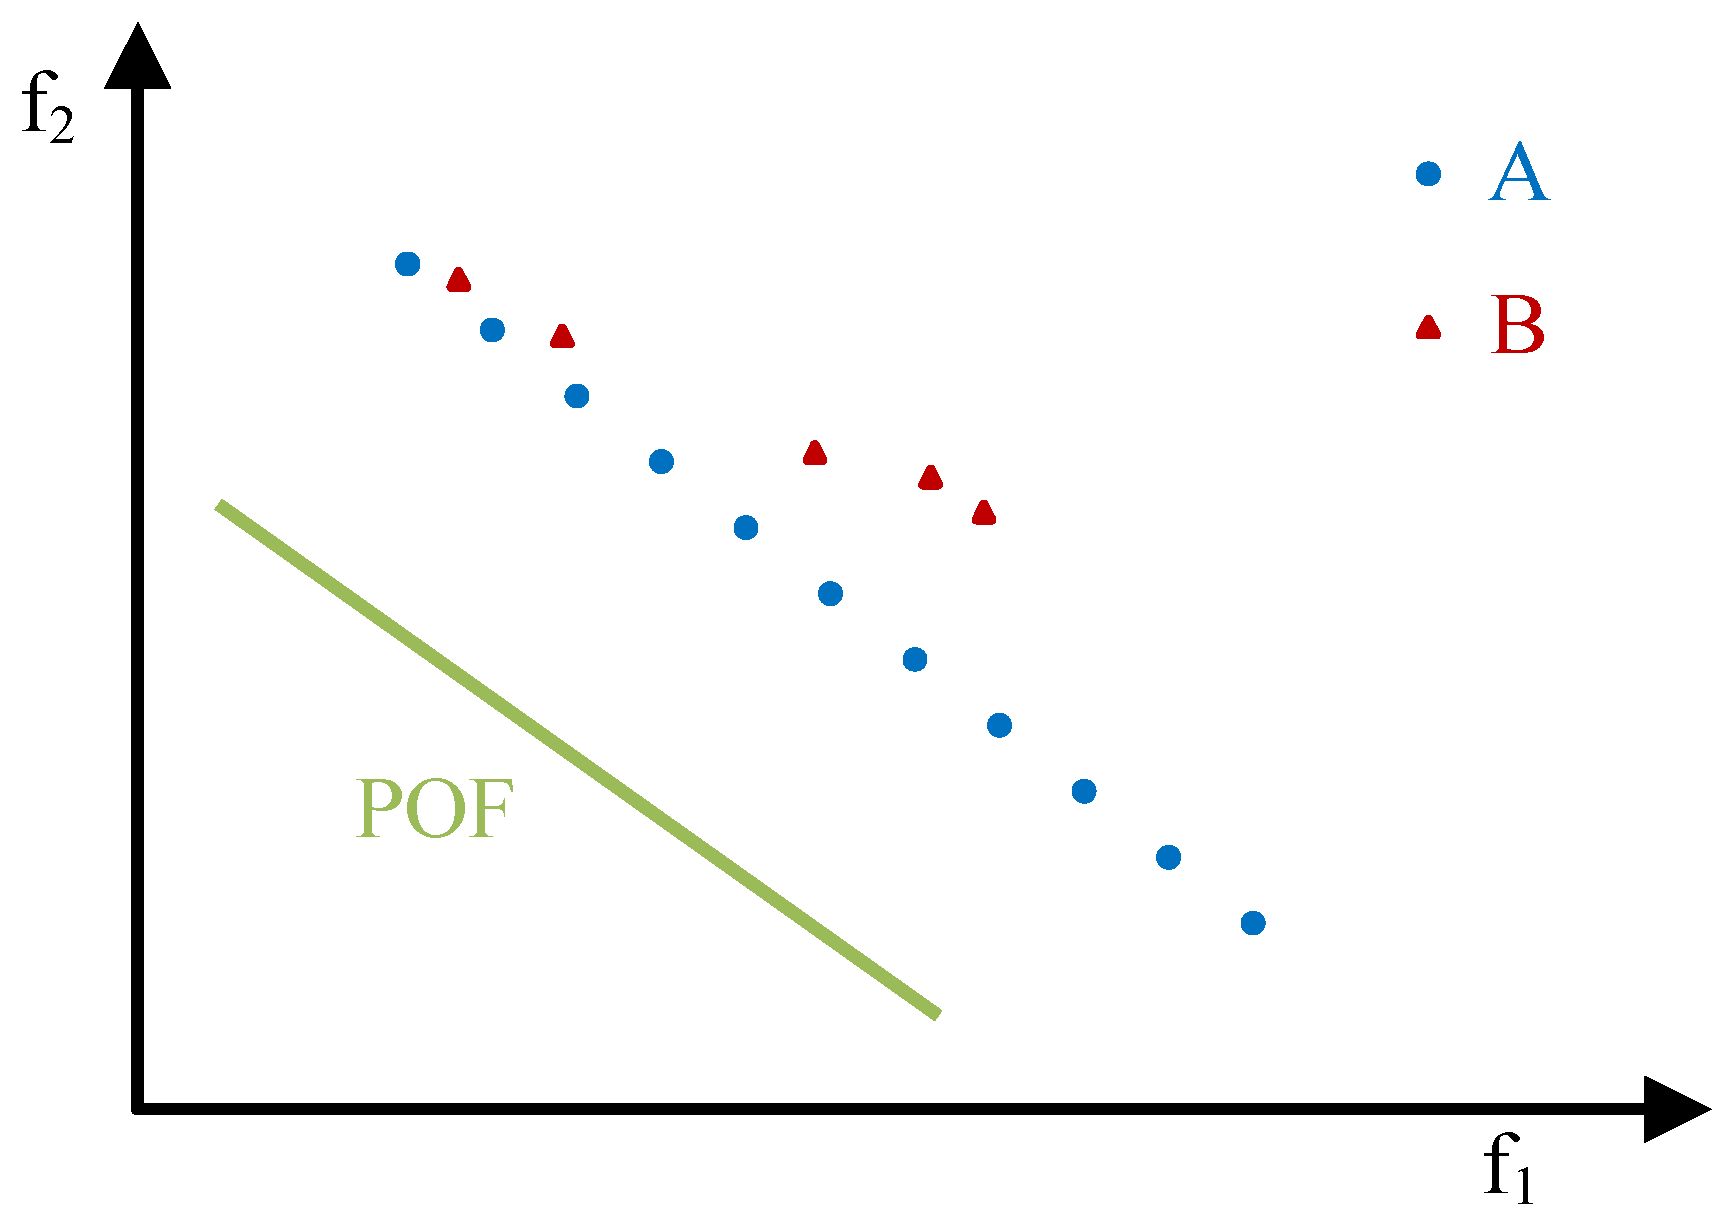
- A is closer to the POF than B;
- the solutions in A are better distributed than the ones in B;
- A is more extended than B;
- the size of A is greater than the size of B,
2. Definitions and Terminology
2.1. Multi- and Many-Objective Optimization Problem
2.2. Pareto Dominance
3. Quality Indicator
3.1. Definitions
3.2. Comparison Methods
3.3. Compatibility and Completeness
- A is better than B (A⊲B);
- A and B are incomparable and A outperforms B with respect to closeness, distribution, extension and cardinality.
3.4. Closeness, Distribution, Extension, and Cardinality
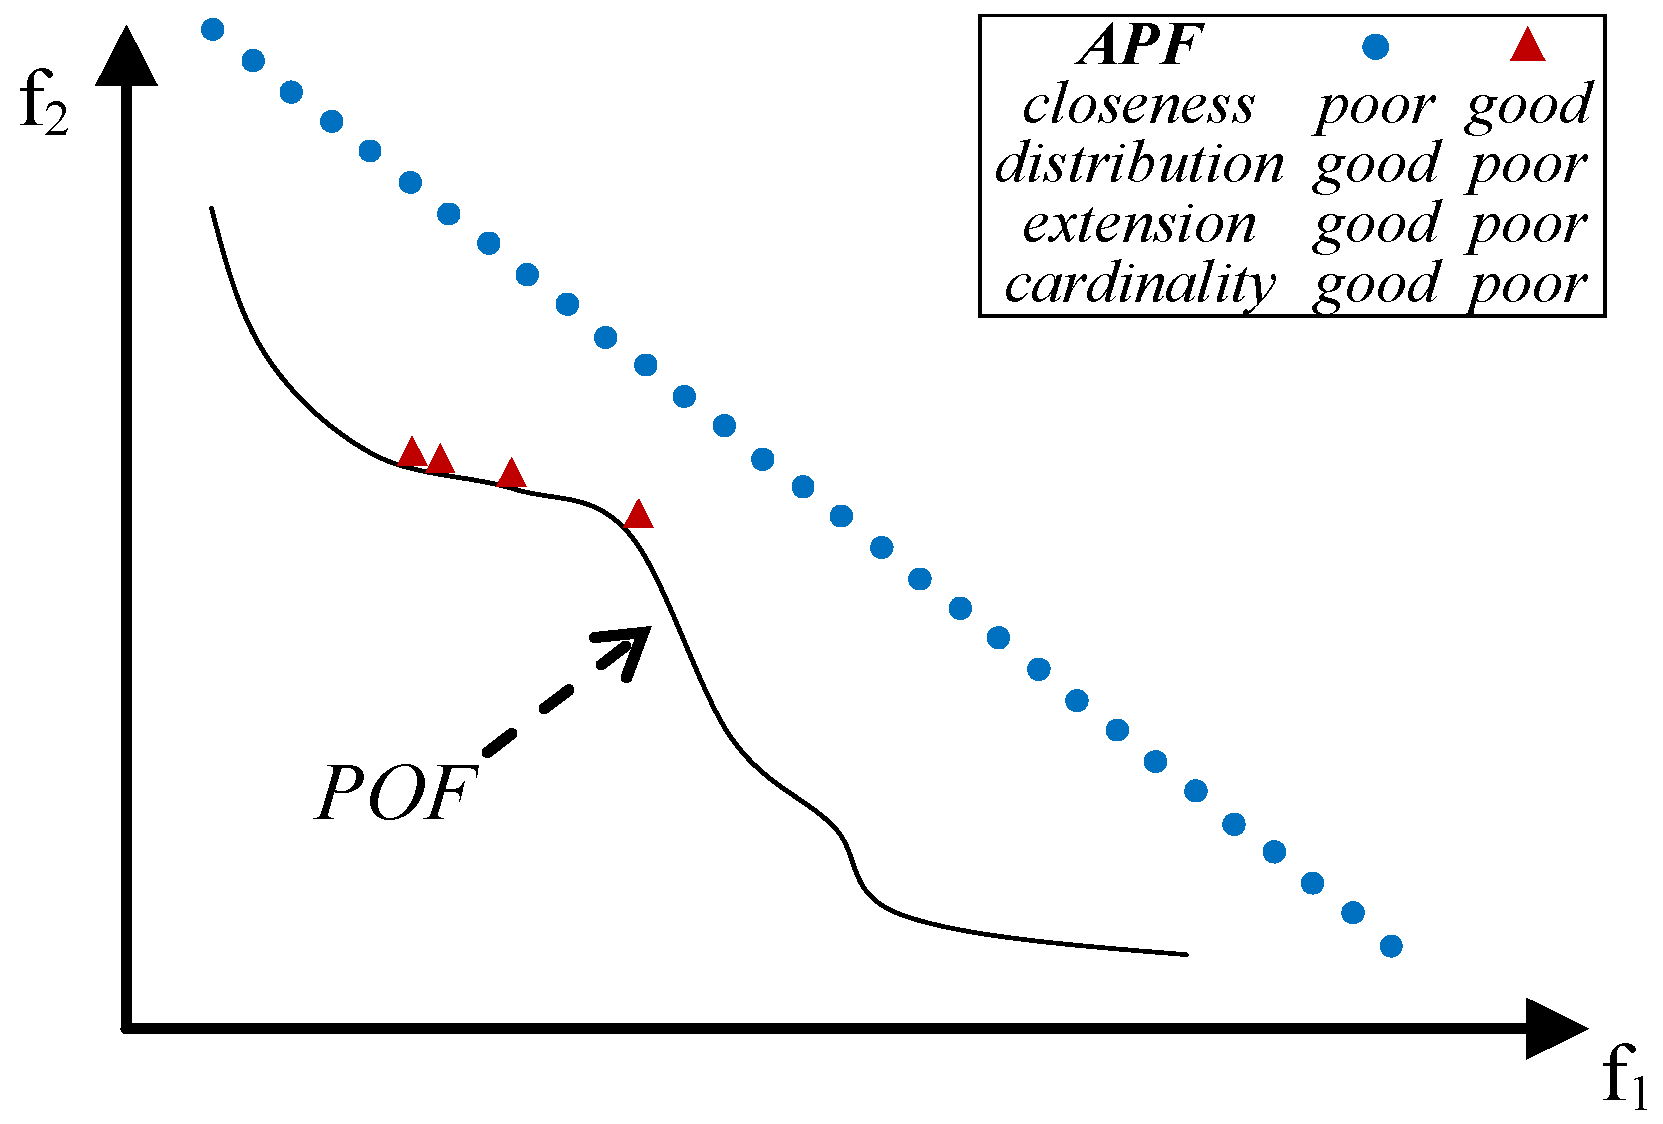
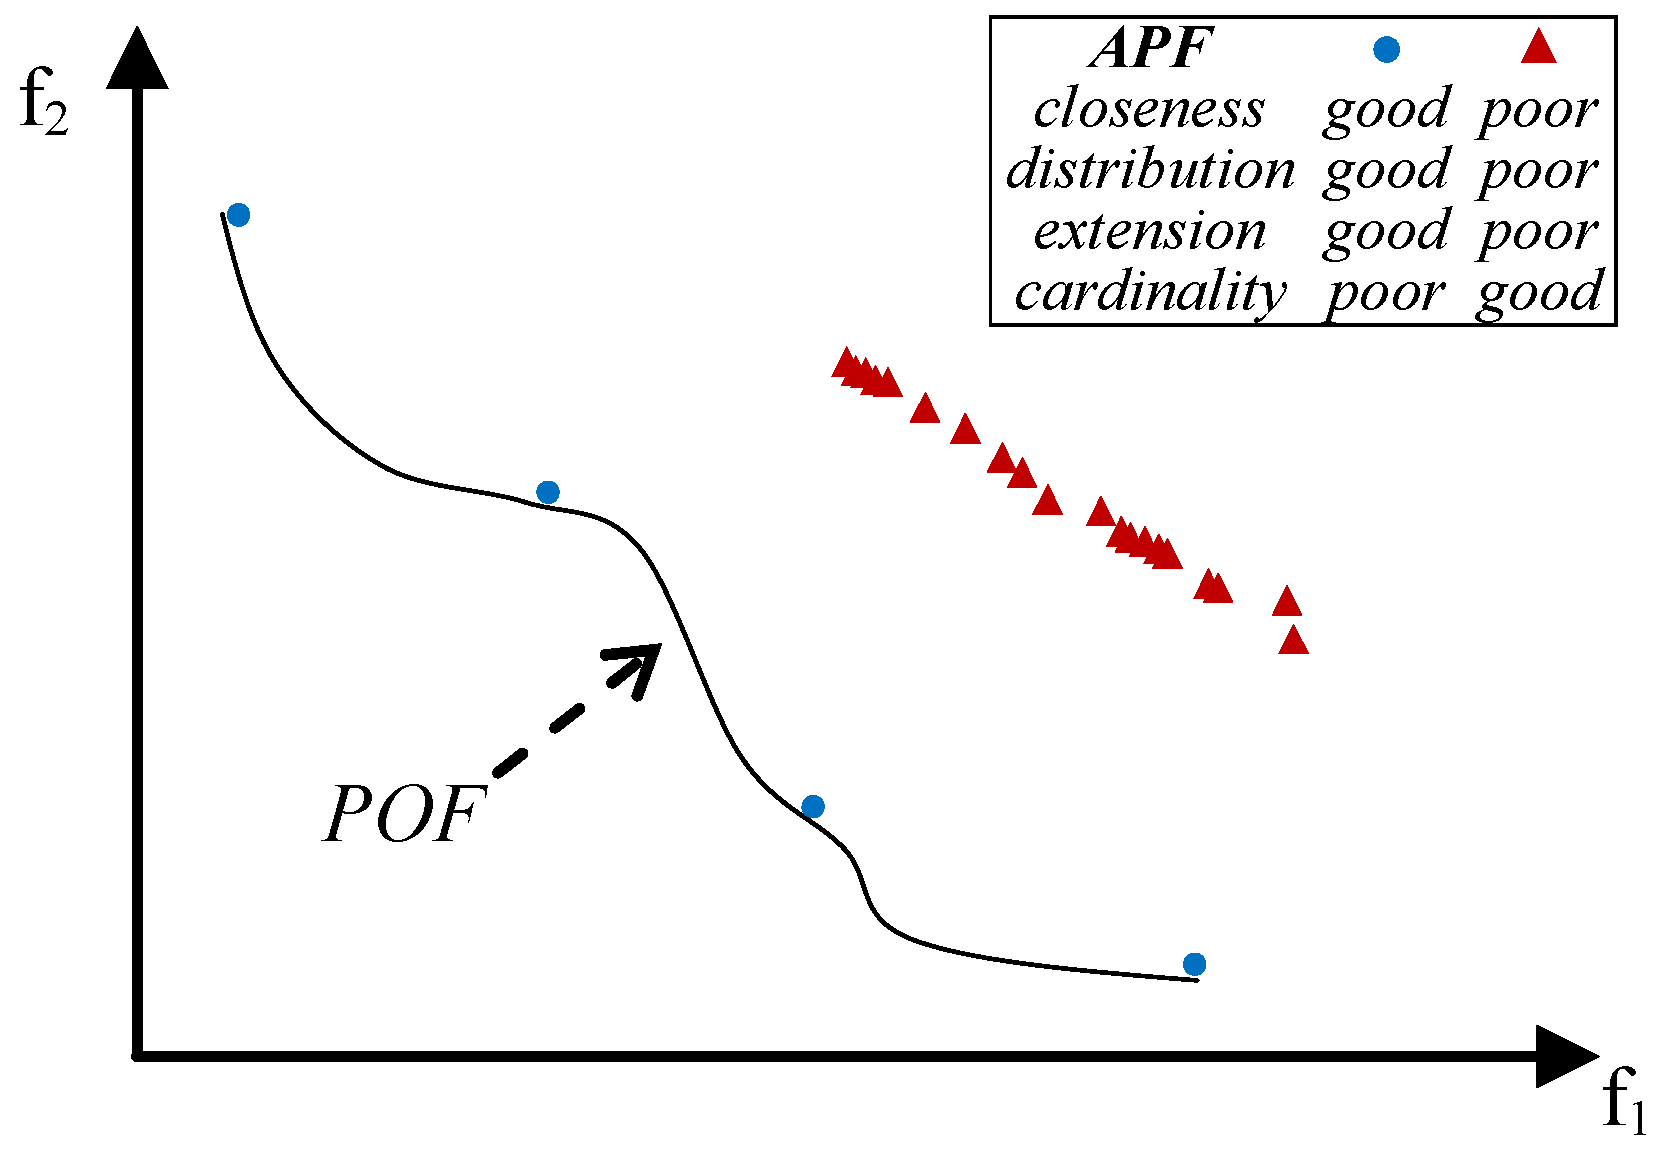
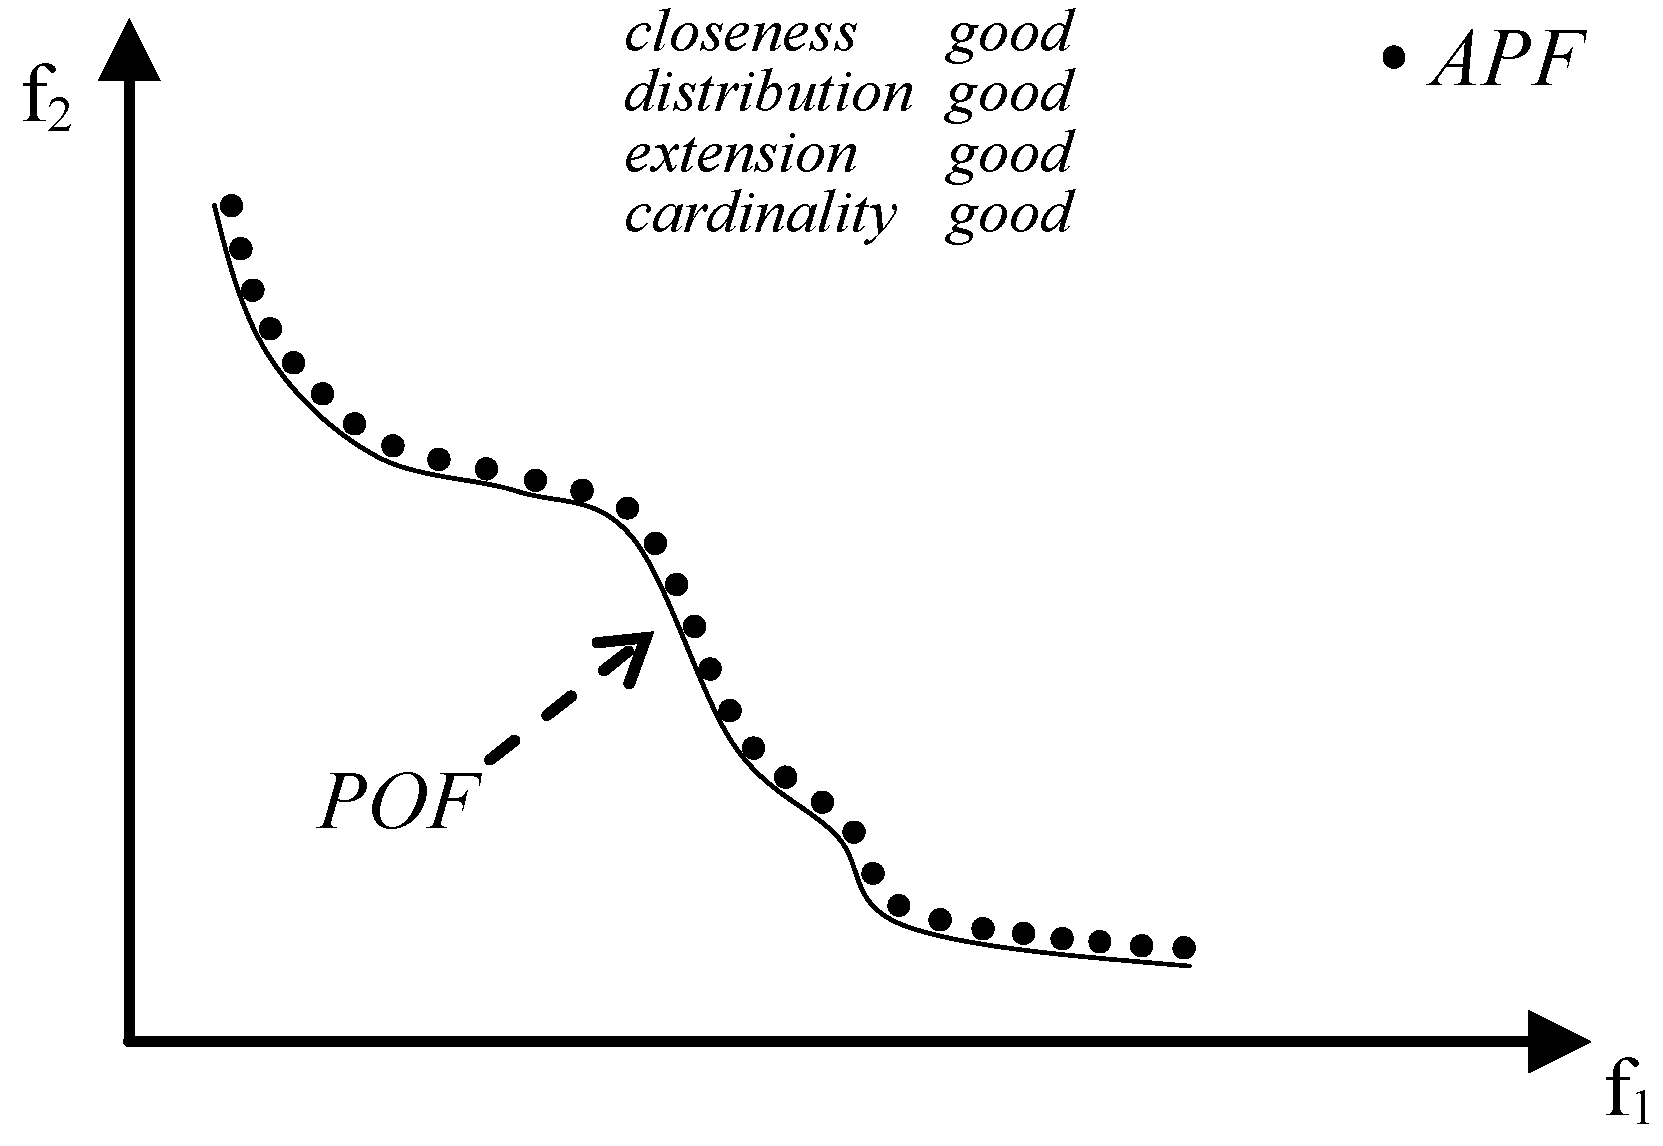
- close to the POF; Figure 3 represents the extreme cases: an APF exhibiting good closeness only, and an APF with all good features but not close to the POF;
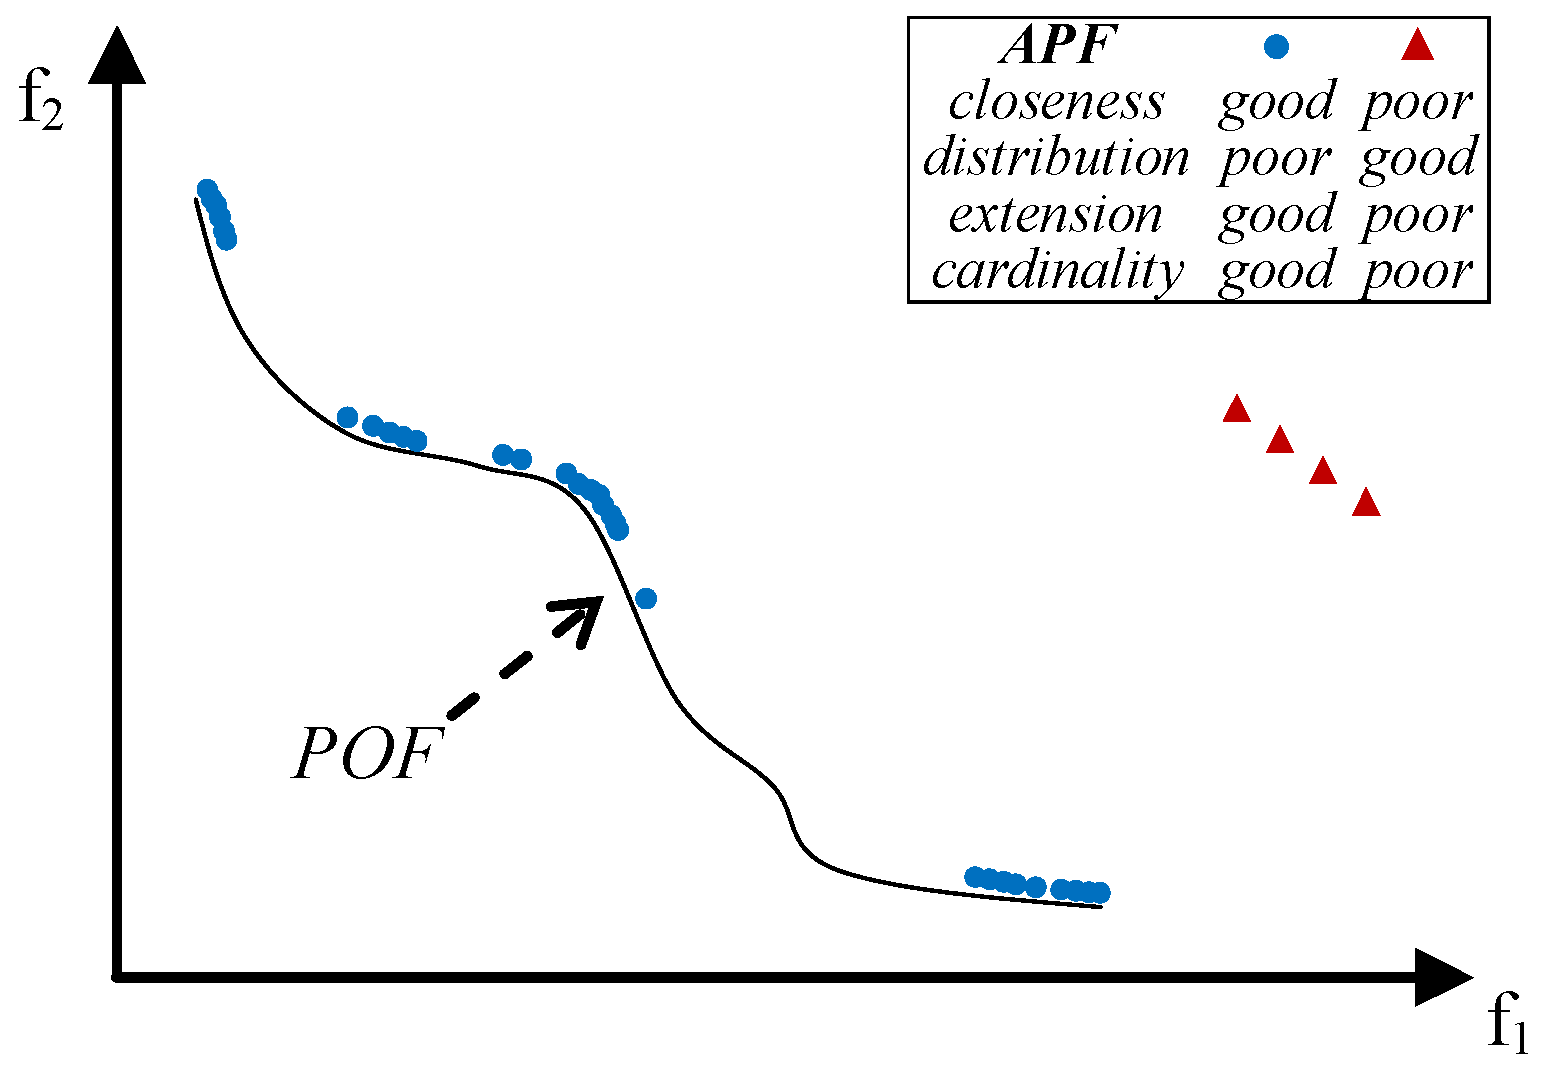
- well distributed (usually uniform); Figure 4 shows an APF exhibiting a uniform distribution only and an APF with all good features but not uniformly distributed;
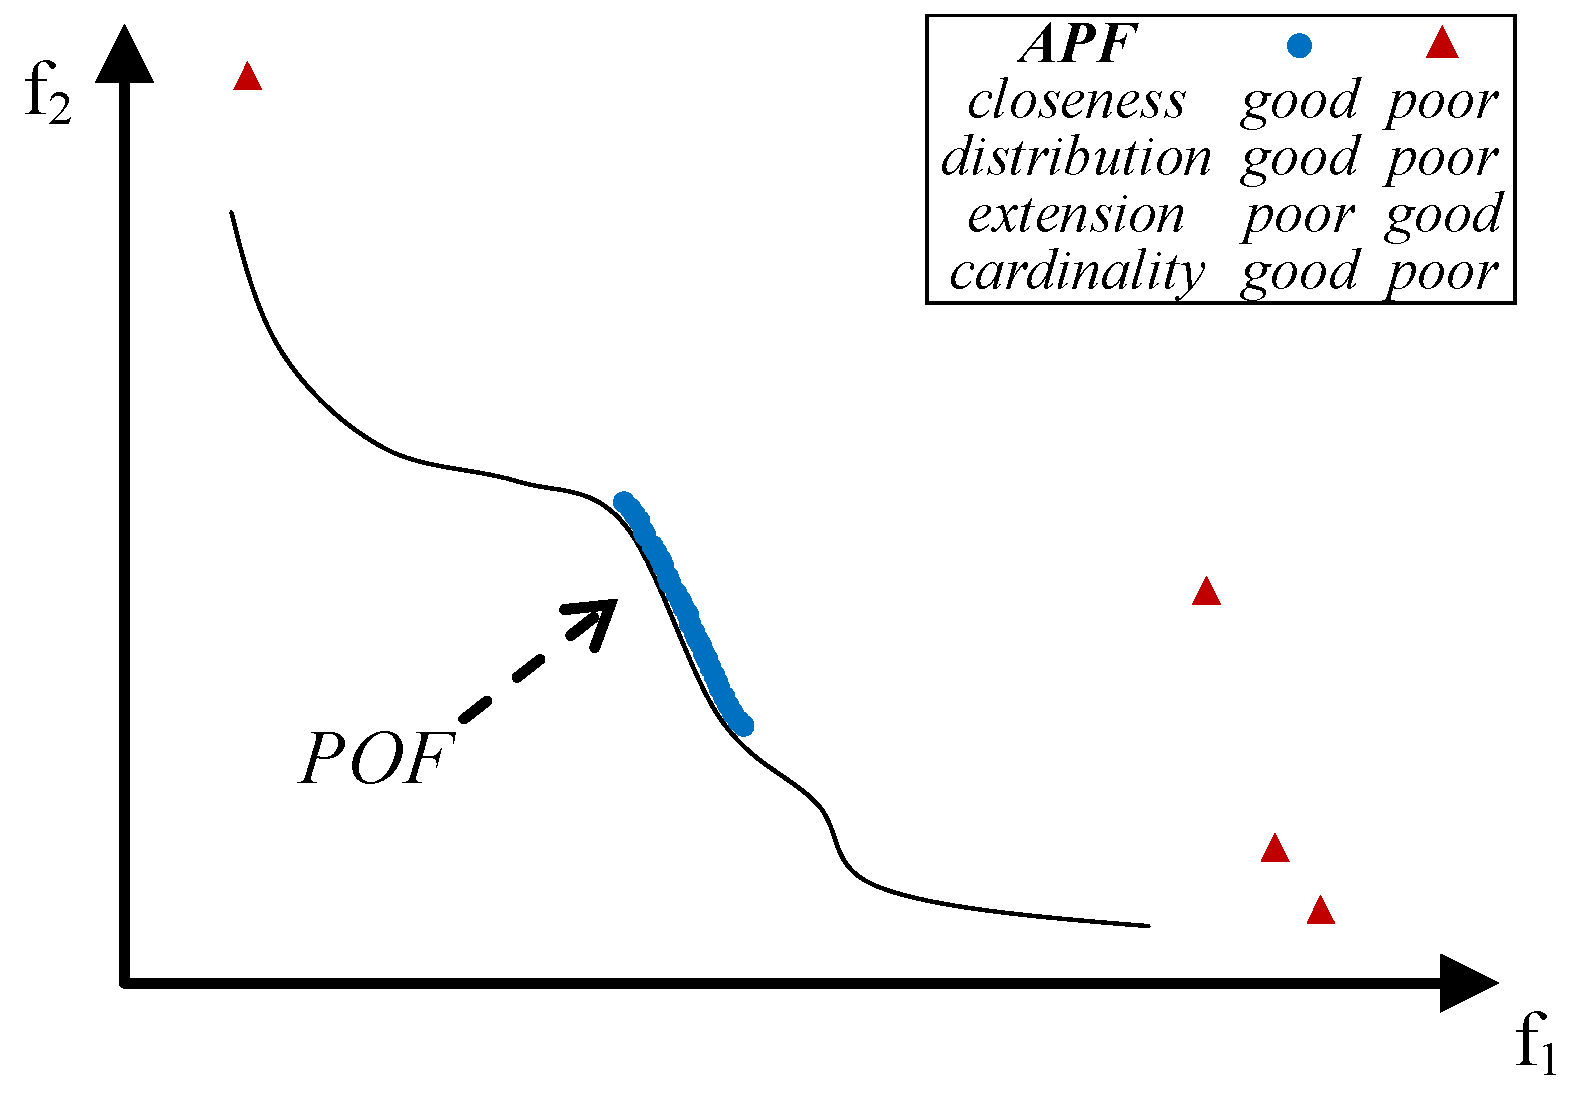
- very extended (in the best case the global optimum of each objective function belongs to the APF); Figure 5 shows an APF with only a good extension and one with all good features but not extended;
- of high cardinality; Figure 6 shows an APF with good cardinality only and an APF with all good features but poor cardinality.
 or totally ⚫ affects the value of some UQIs. A heuristic approach has been applied to determine whether a feature (closeness, distribution, extension, cardinality) affects the QI value. In particular, an APF B obtained by improving a given feature of another APF A is expected to have an indicator value better than that of A when the indicator is sensitive to this feature. For example, if an APF is gradually moved towards the POF and the indicator increasingly improves, then the indicator is influenced by the closeness feature. An indicator is partially affected by a feature when it sometimes improves and other times does not change.
4. The Weakly Pareto Compliant Quality Indicator
- n
- number of objective functions,
- fk,a
- value of k-th objective function of the approximated solution a,
- fk,i
- value of k-th objective function of optimal solution i.
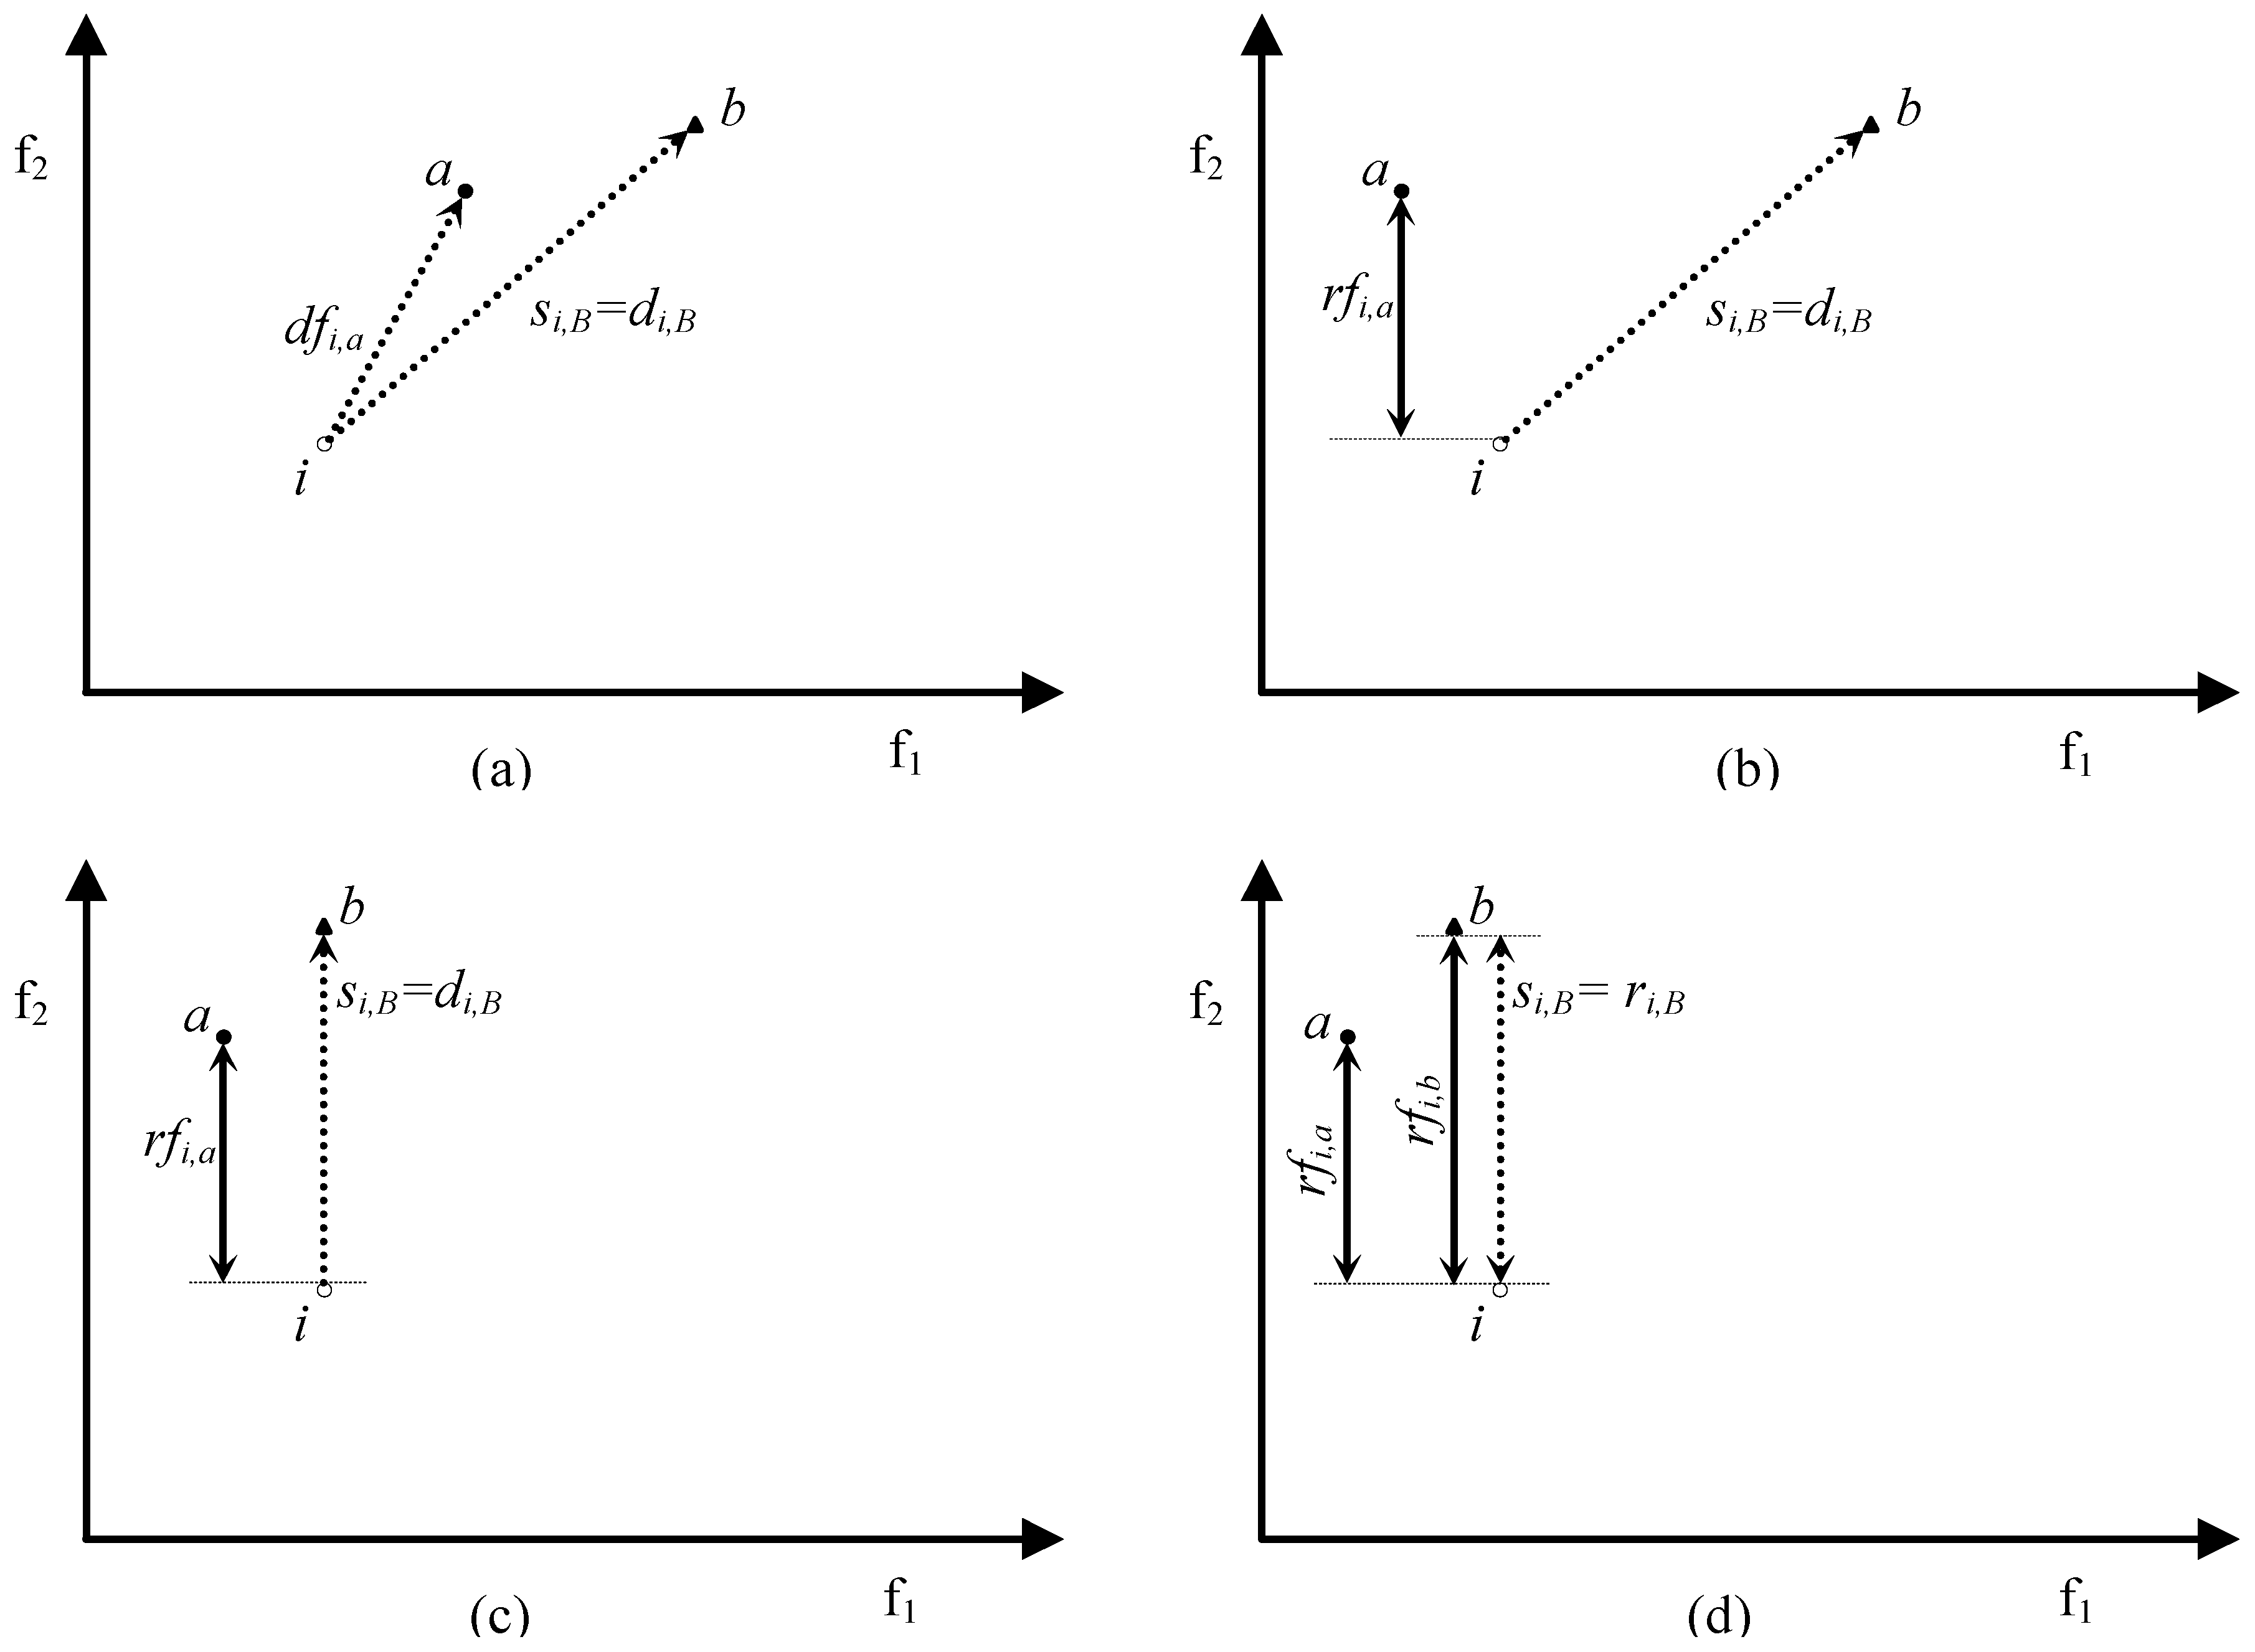
5. ≻≻-Completeness
- ifsi,A < si,B ∀ i ∊ POF,
- then
- A1. i≺≺b Λ i≼a
- B1. i≺≺b Λ i||a
- C1. i≺b Λ i||a
- D1. i||b Λ i||a
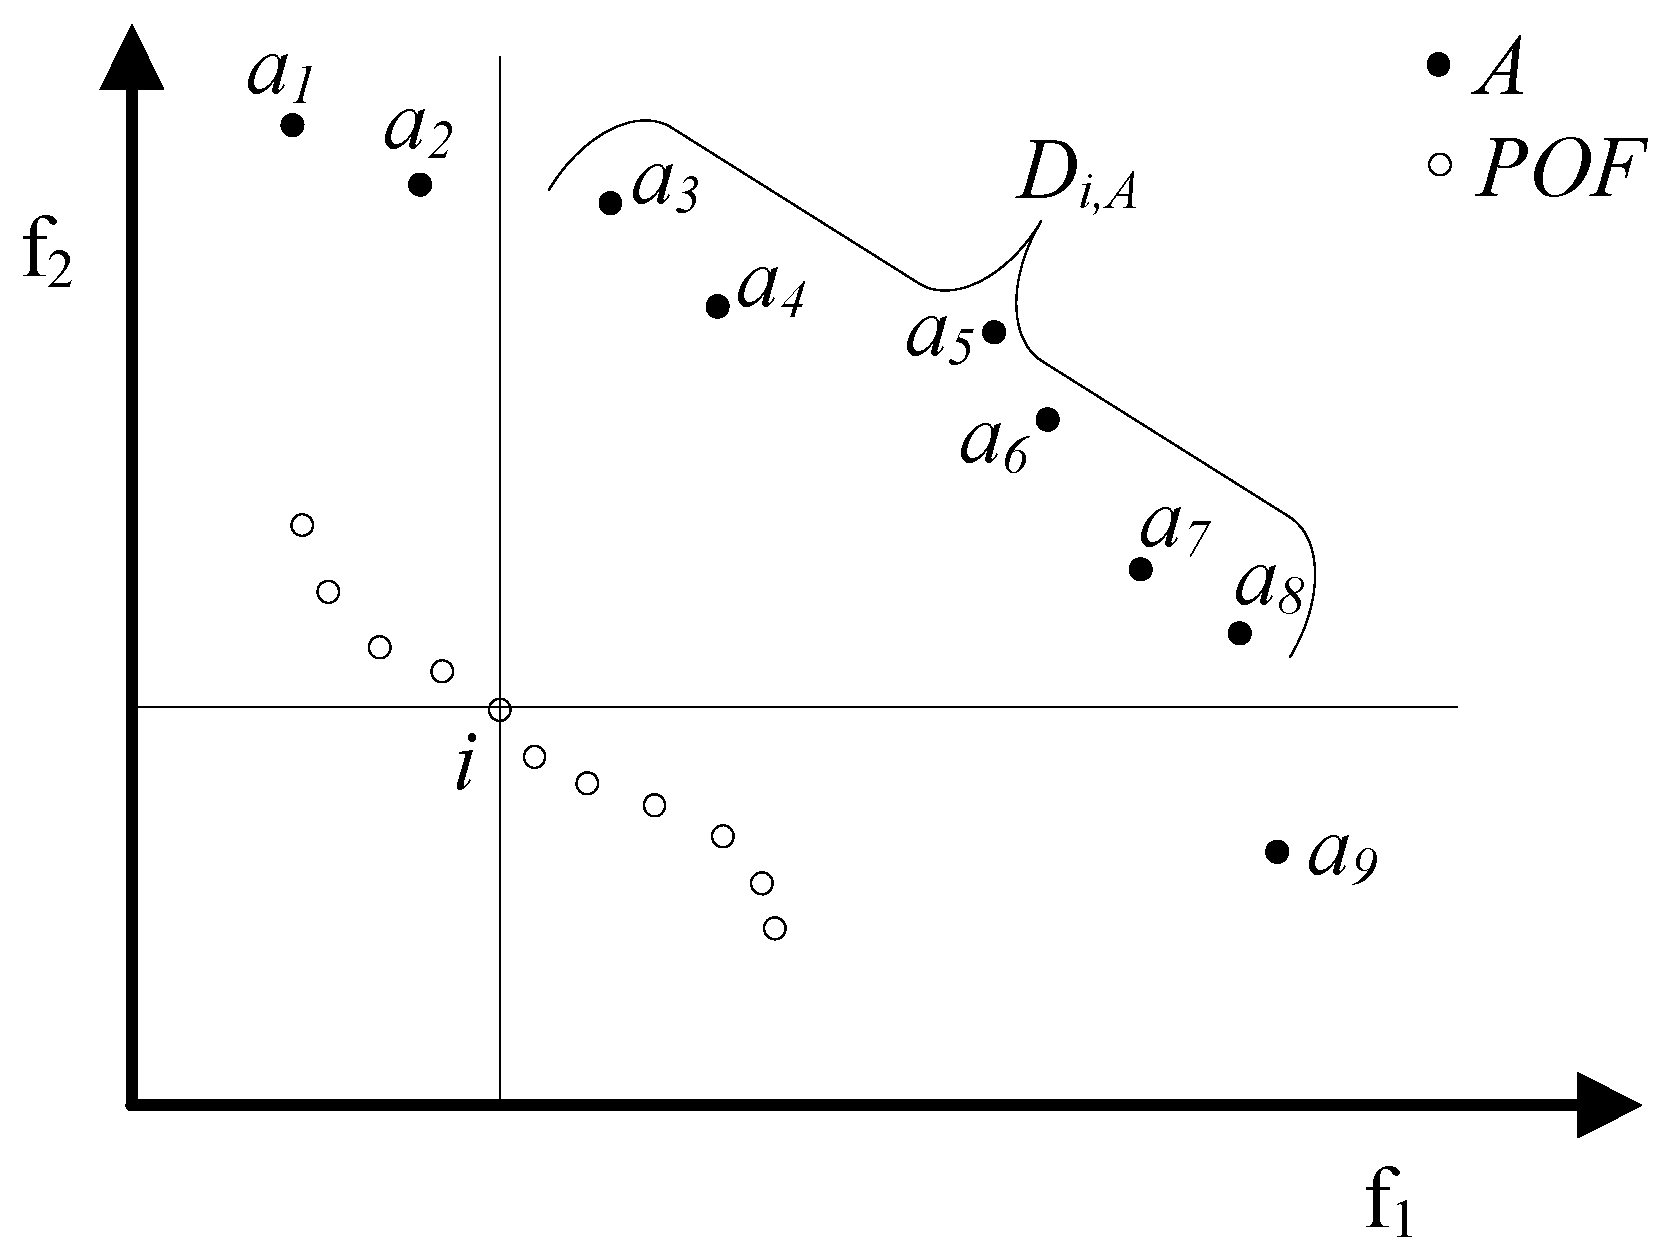
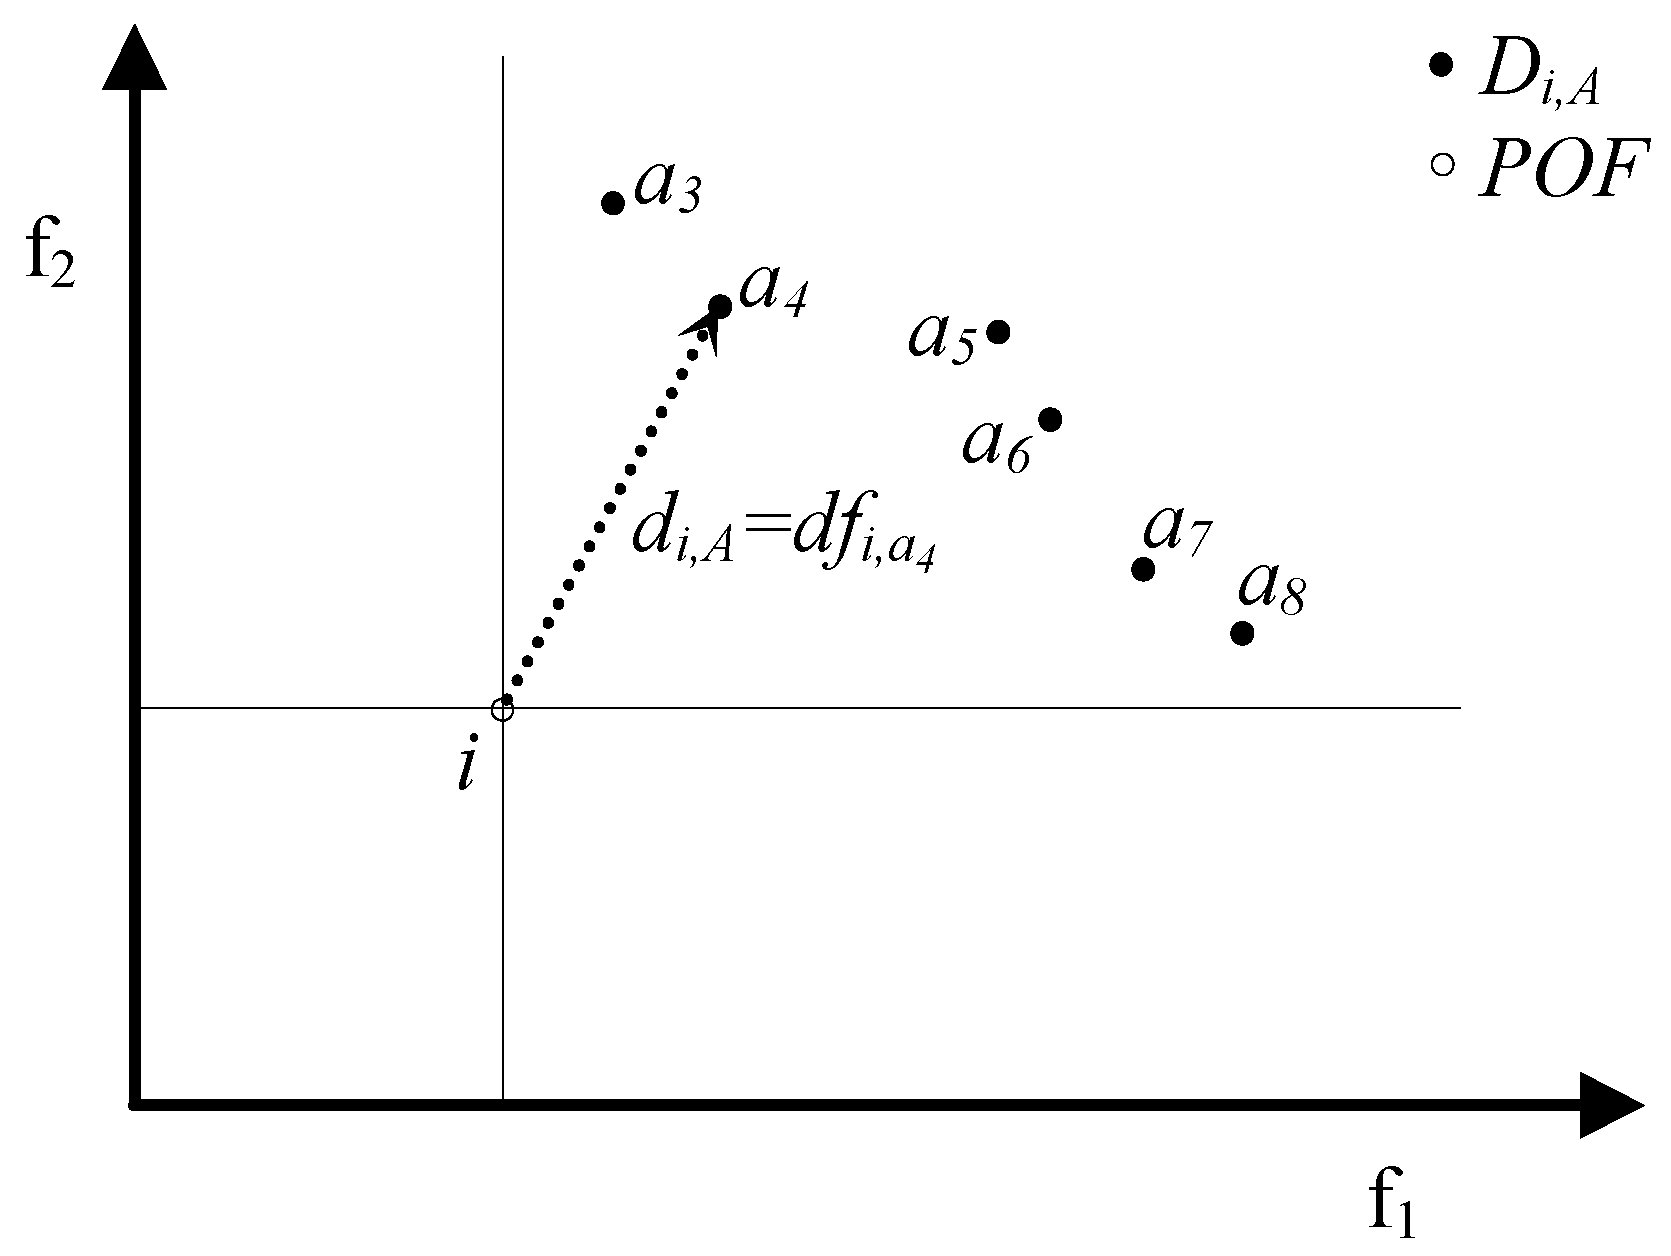
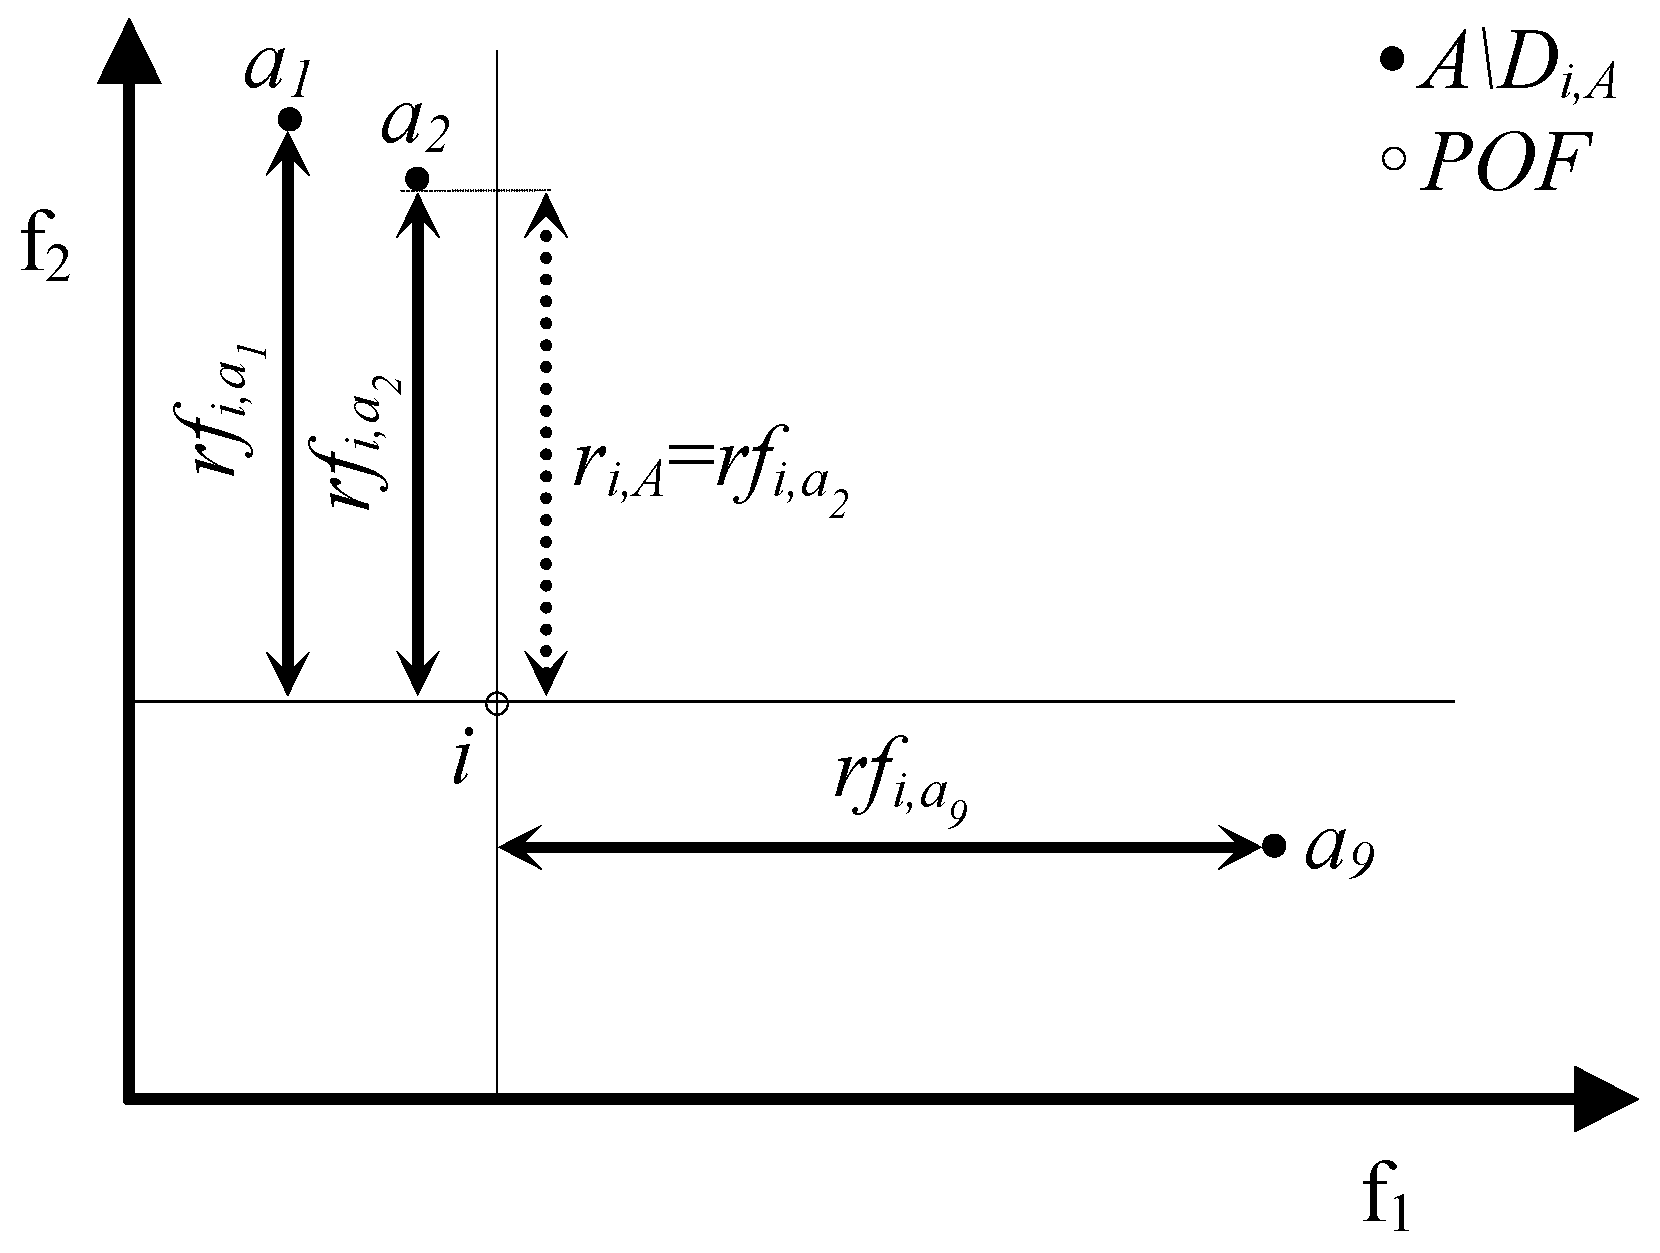
- si,A = dfi,a iff si,A = di,A Λ di,A = dfi,a;
- si,A < dfi,a either if si,A = di,A Λ di,A = dfi,a* < dfi,a (where a*∊A and a*≠a) or if si,A = ri,A (this implies that ri,A < di,A ≤ dfi,a).
- si,A = rfi,a iff si,A = ri,A Λ ri,A = rfi,a;
- si,A < rfi,a either if si,A = ri,A Λ ri,A = rfi,a* < rfi,a (where a*∊A and a*≠a) or if si,A = di,A (this implies that di,A < ri,A ≤ rfi,a).
5.1. A1. i≺≺b Λ i≼a
- i≼a ⇒
- fk,i ≤ fk,a, ∀ k = 1,…, n
- a≺≺b ⇒
- fk,a < fk,b, ∀ k = 1,…, n
5.2. B1. i≺≺b Λ i||a
5.3. C1. i≺b Λ i||a
- i||a ⇒
- fk,i < fk,a, ∀ k = 1,…, nafk,i ≥ fk,a, ∀ k = na + 1,…, n
- i≺b ⇒
- fk,i ≤ fk,b, ∀ k = 1,…, n
- a≺≺b ⇒
- fk,a < fk,b, ∀ k = 1,…, n
5.4. D1. i||b Λ i||a
- i||a ⇒
- fk,i < fk,a, ∀ k = 1,…, nafk,i ≥ fk,a, ∀ k = na + 1,…, n
- i||b ⇒
- fk,i < fk,b, ∀ k = 1,…, nbfk,i ≥ fk,b, ∀ k = nb + 1,…, n
- a≺≺b ⇒
- fk,a < fk,b, ∀ k = 1,..., n
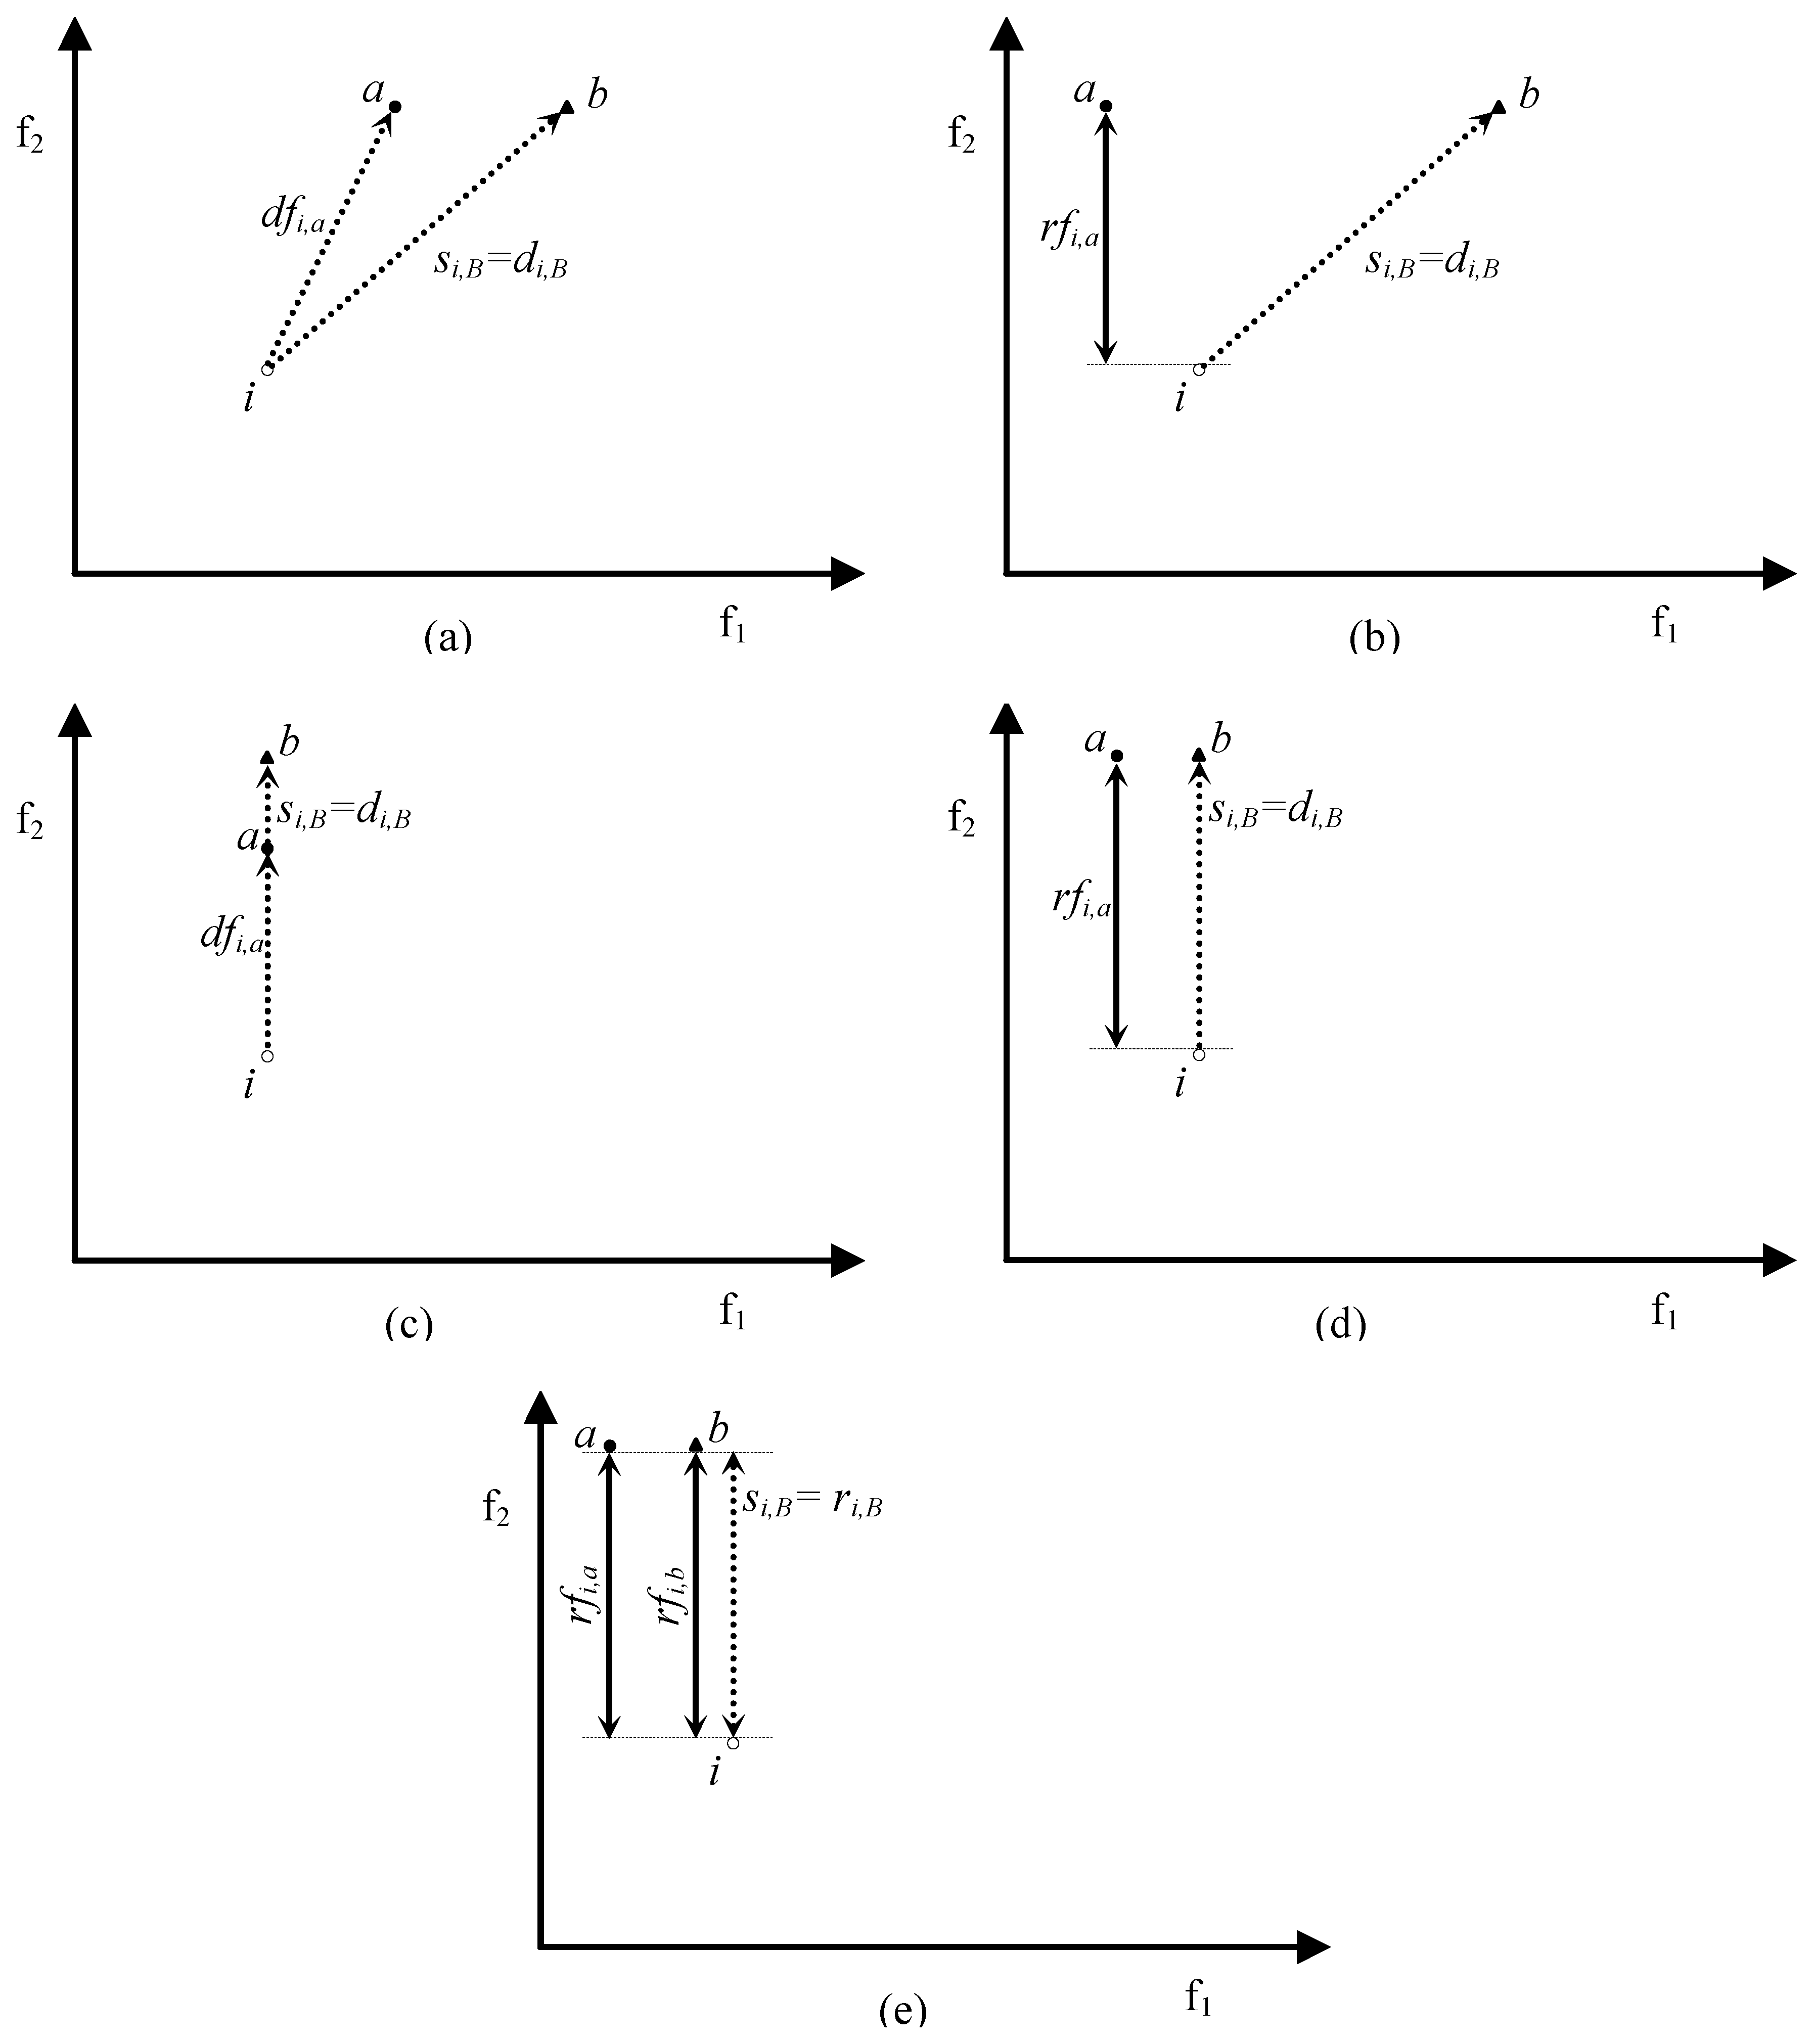
6. ≻-Completeness
- ifsi,A ≤ si,B ∀ i ∊ POF Λ ∃ i*∊POF: si*,A < si*,B
- then
- A2. i≺≺b Λ i≺a
- B2. i≺≺b Λ i||a
- C2. i≺b Λ i≼a
- D2. i≺b Λ i||a
- E2. i||b Λ i||a
- α.
- si,A ≤ si,B
- β.
- ∃ i* ∊ POF: si*,A < si*,B.
6.1. A2. i≺≺b Λ i≺a
- i≺a ⇒
- fk,i ≤ fk,a, ∀ k = 1,…, n
- a≺b ⇒
- fk,a ≤ fk,b, ∀ k = 1,…, n Λ ∃ j: fj,a < fj,b
6.2. B2. i≺≺b Λ i||a
- i||a ⇒
- fk,i < fk,a, ∀ k = 1,…, nafk,i ≥ fk,a, ∀ k = na + 1,…, n
- i≺≺b ⇒
- fk,i < fk,b, ∀ k = 1,..., n
- a≺b ⇒
- fk,a ≤ fk,b, ∀ k = 1,…, n
6.3. C2. i≺b Λ i≼a
- i≼a ⇒
- fk,i ≤ fk,a, ∀ k = 1,…, n
- a≺b ⇒
- fk,a ≤ fk,b, ∀ k = 1,…, n Λ ∃ j: fj,a < fj,b
6.4. D2. i≺b Λ i||a
- i||a ⇒
- fk,i < fk,a, ∀ k = 1,…, nafk,i ≥ fk,a, ∀ k = na + 1,…, n
- i≺b ⇒
- fk,i ≤ fk,b, ∀ k = 1,…, n Λ ∃ h: fh,i < fh,b
- a≺b ⇒
- fk,a ≤ fk,b, ∀ k = 1,…, n Λ ∃ j: fj,a < fj,b
6.5. E2. i||b Λ i||a
- i||a ⇒
- fk,i < fk,a, ∀ k = 1,…, nafk,i ≥ fk,a, ∀ k = na + 1,…, n
- i||b ⇒
- fk,i < fk,b, ∀ k = 1,…, nbfk,i ≥ fk,b, ∀ k = nb + 1,..,n
- a≺b ⇒
- fk,a ≤ fk,b, ∀ k = 1,…, n Λ ∃ j: fj,a < fj,b
- rfi,a < rfi,b if nb ≠ na;
- rfi,a ≤ rfi,b if nb = na.
7. ⋫-Compatibility
- si,A < dfi,a’ when a’ is dominated by i;
- si,A < rfi,a’ when a’ is not dominated by i.
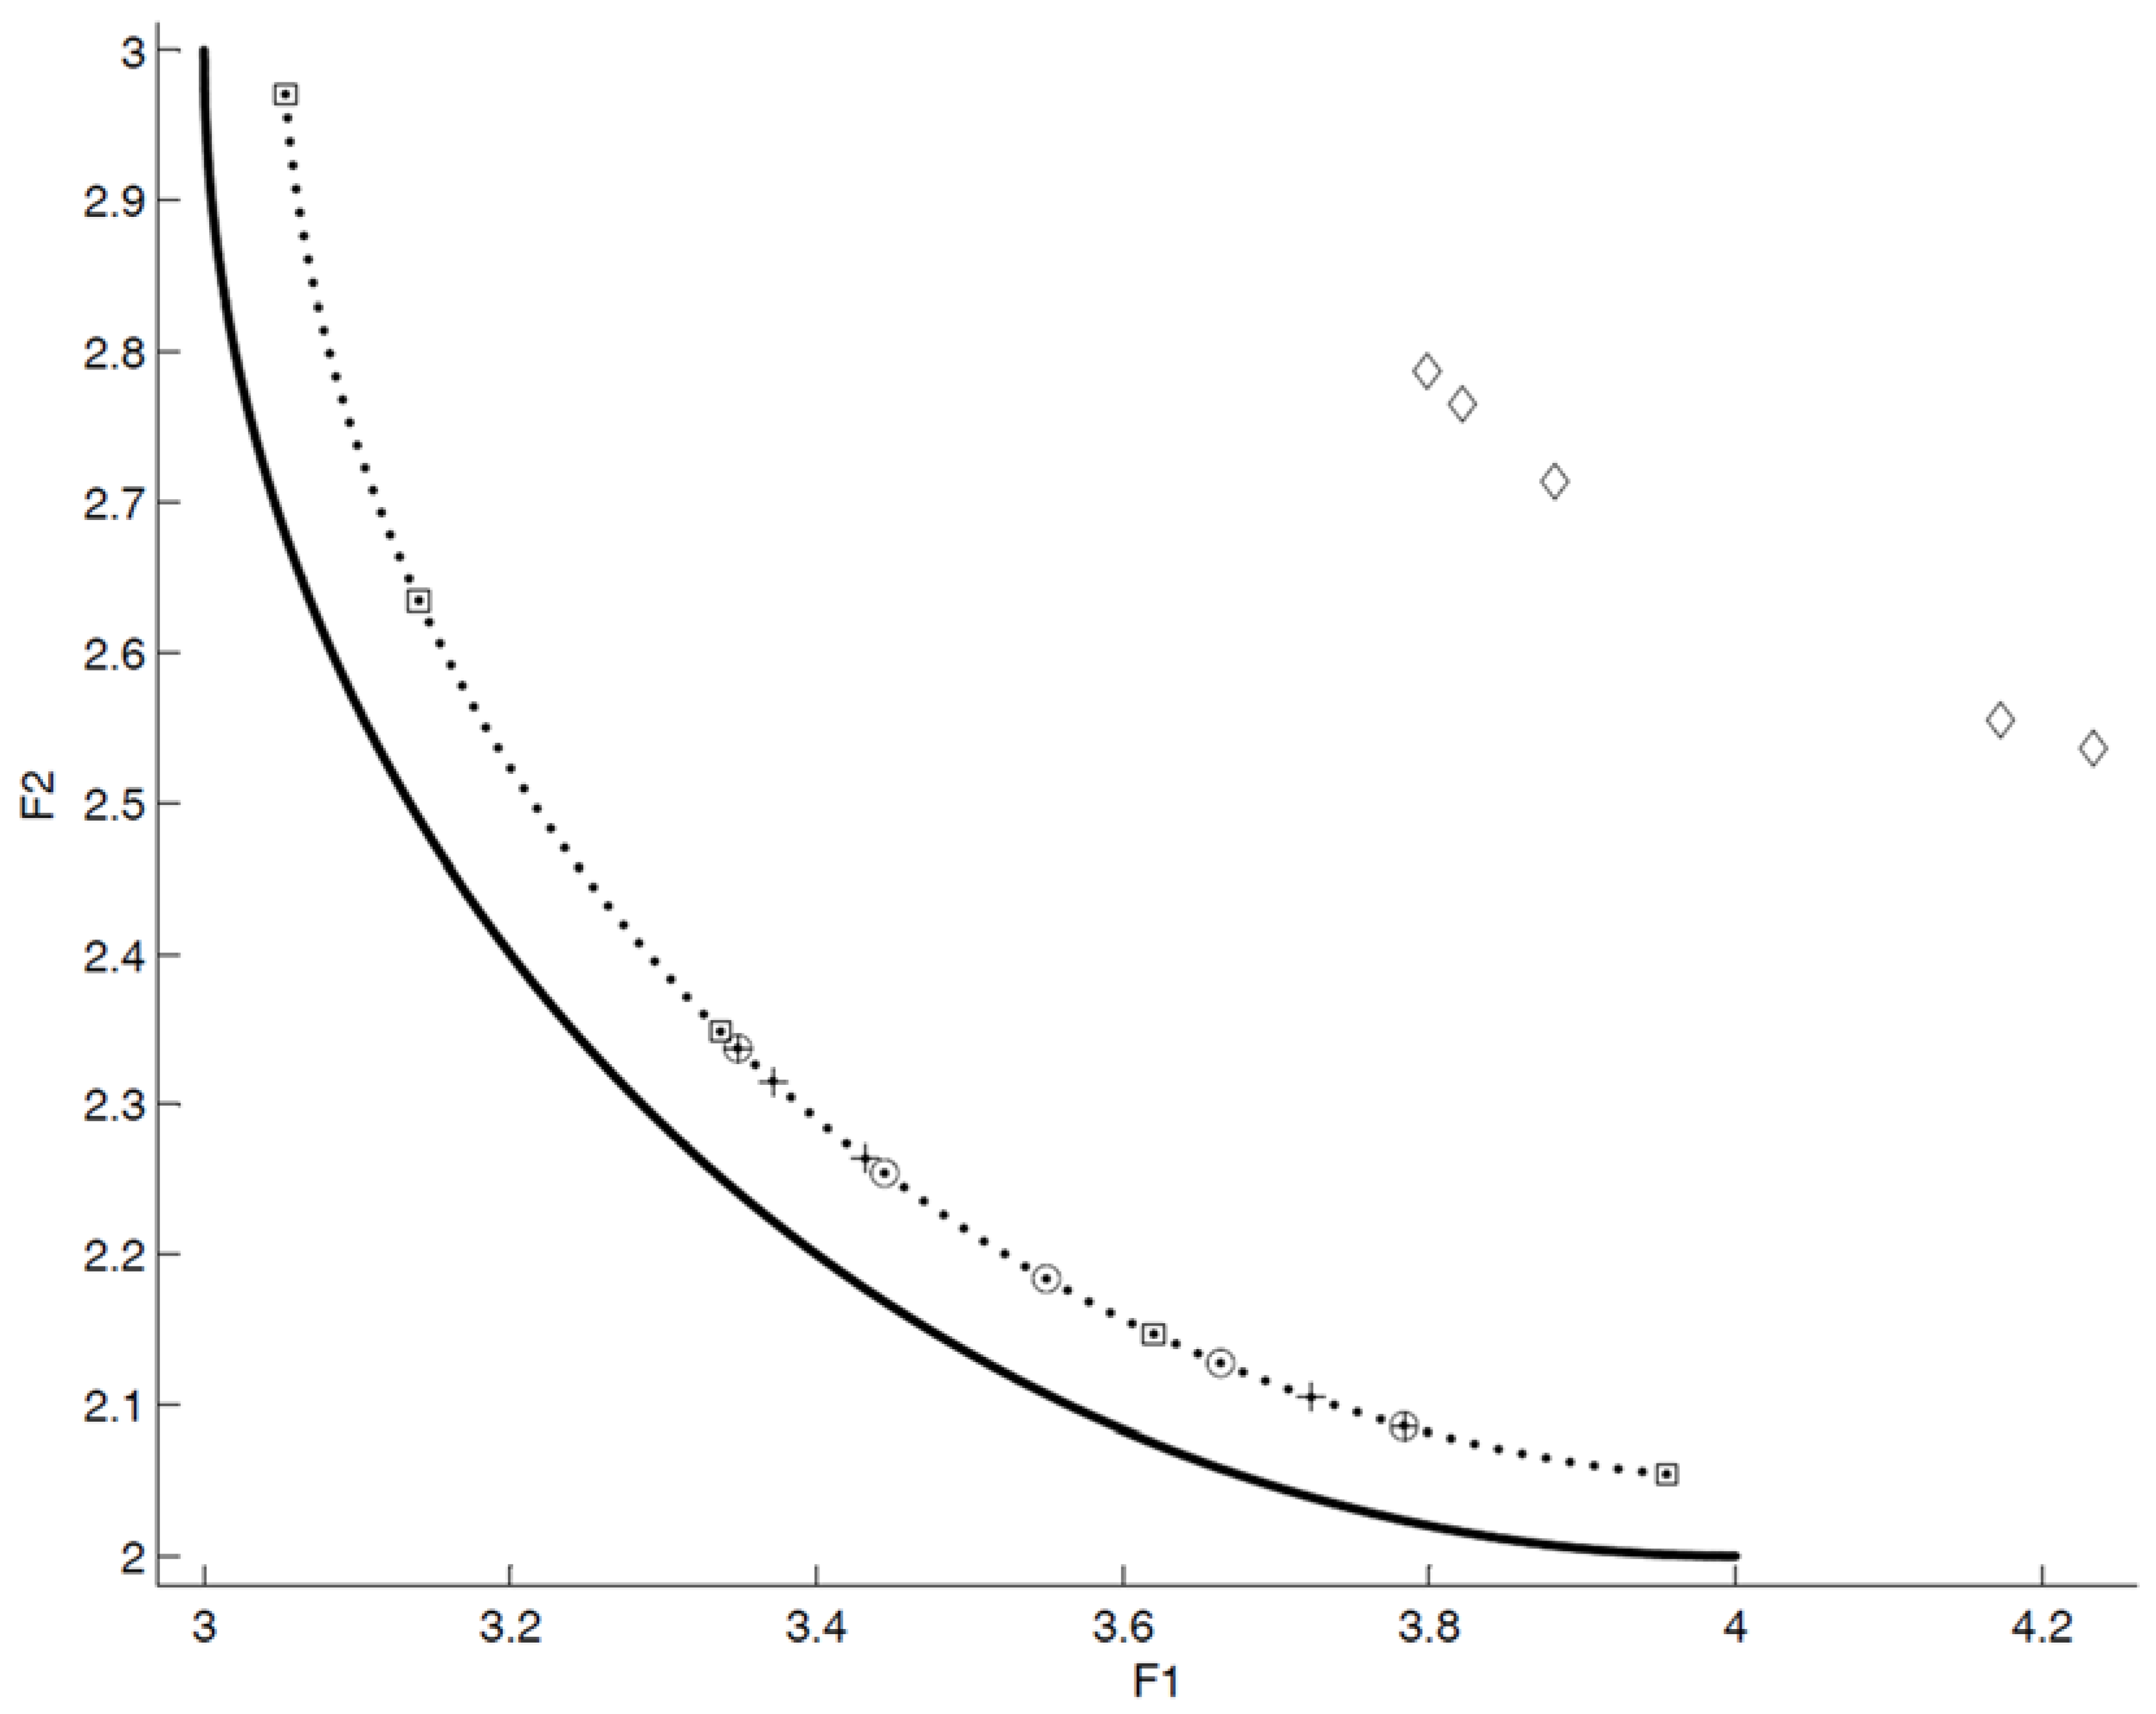
8. DOA Validation
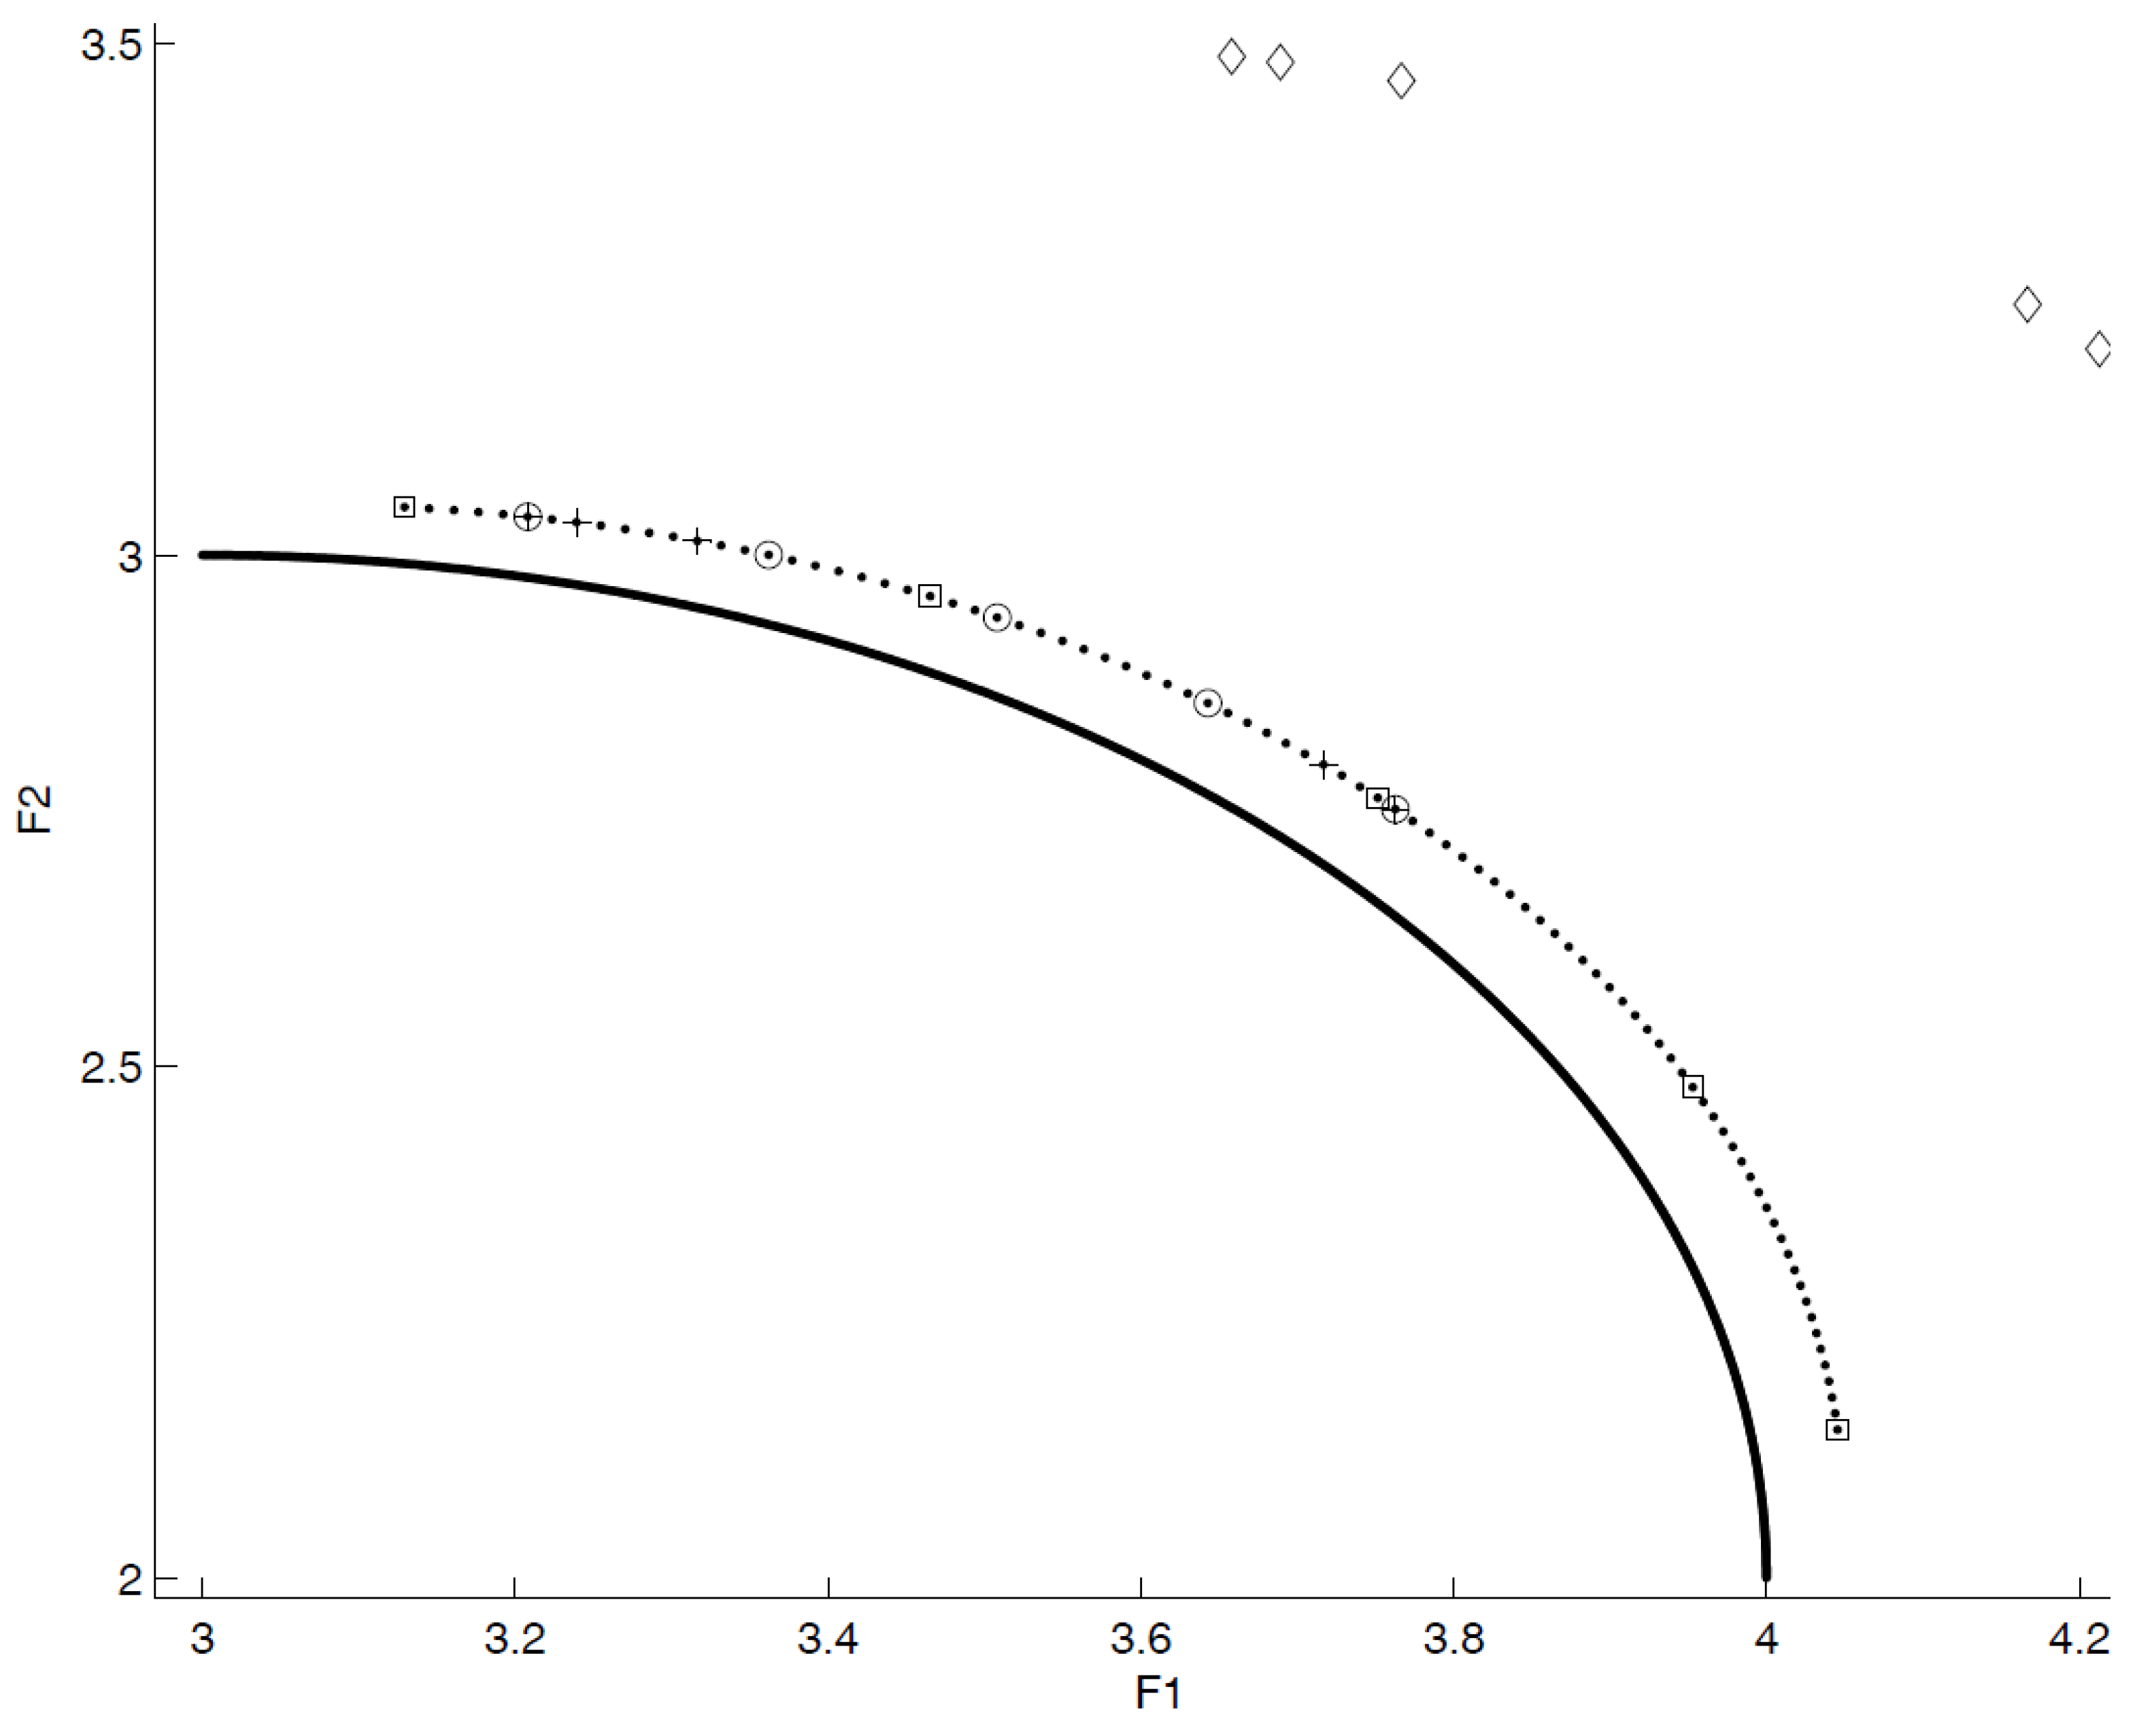
- convex and connected;
- non-convex and connected;
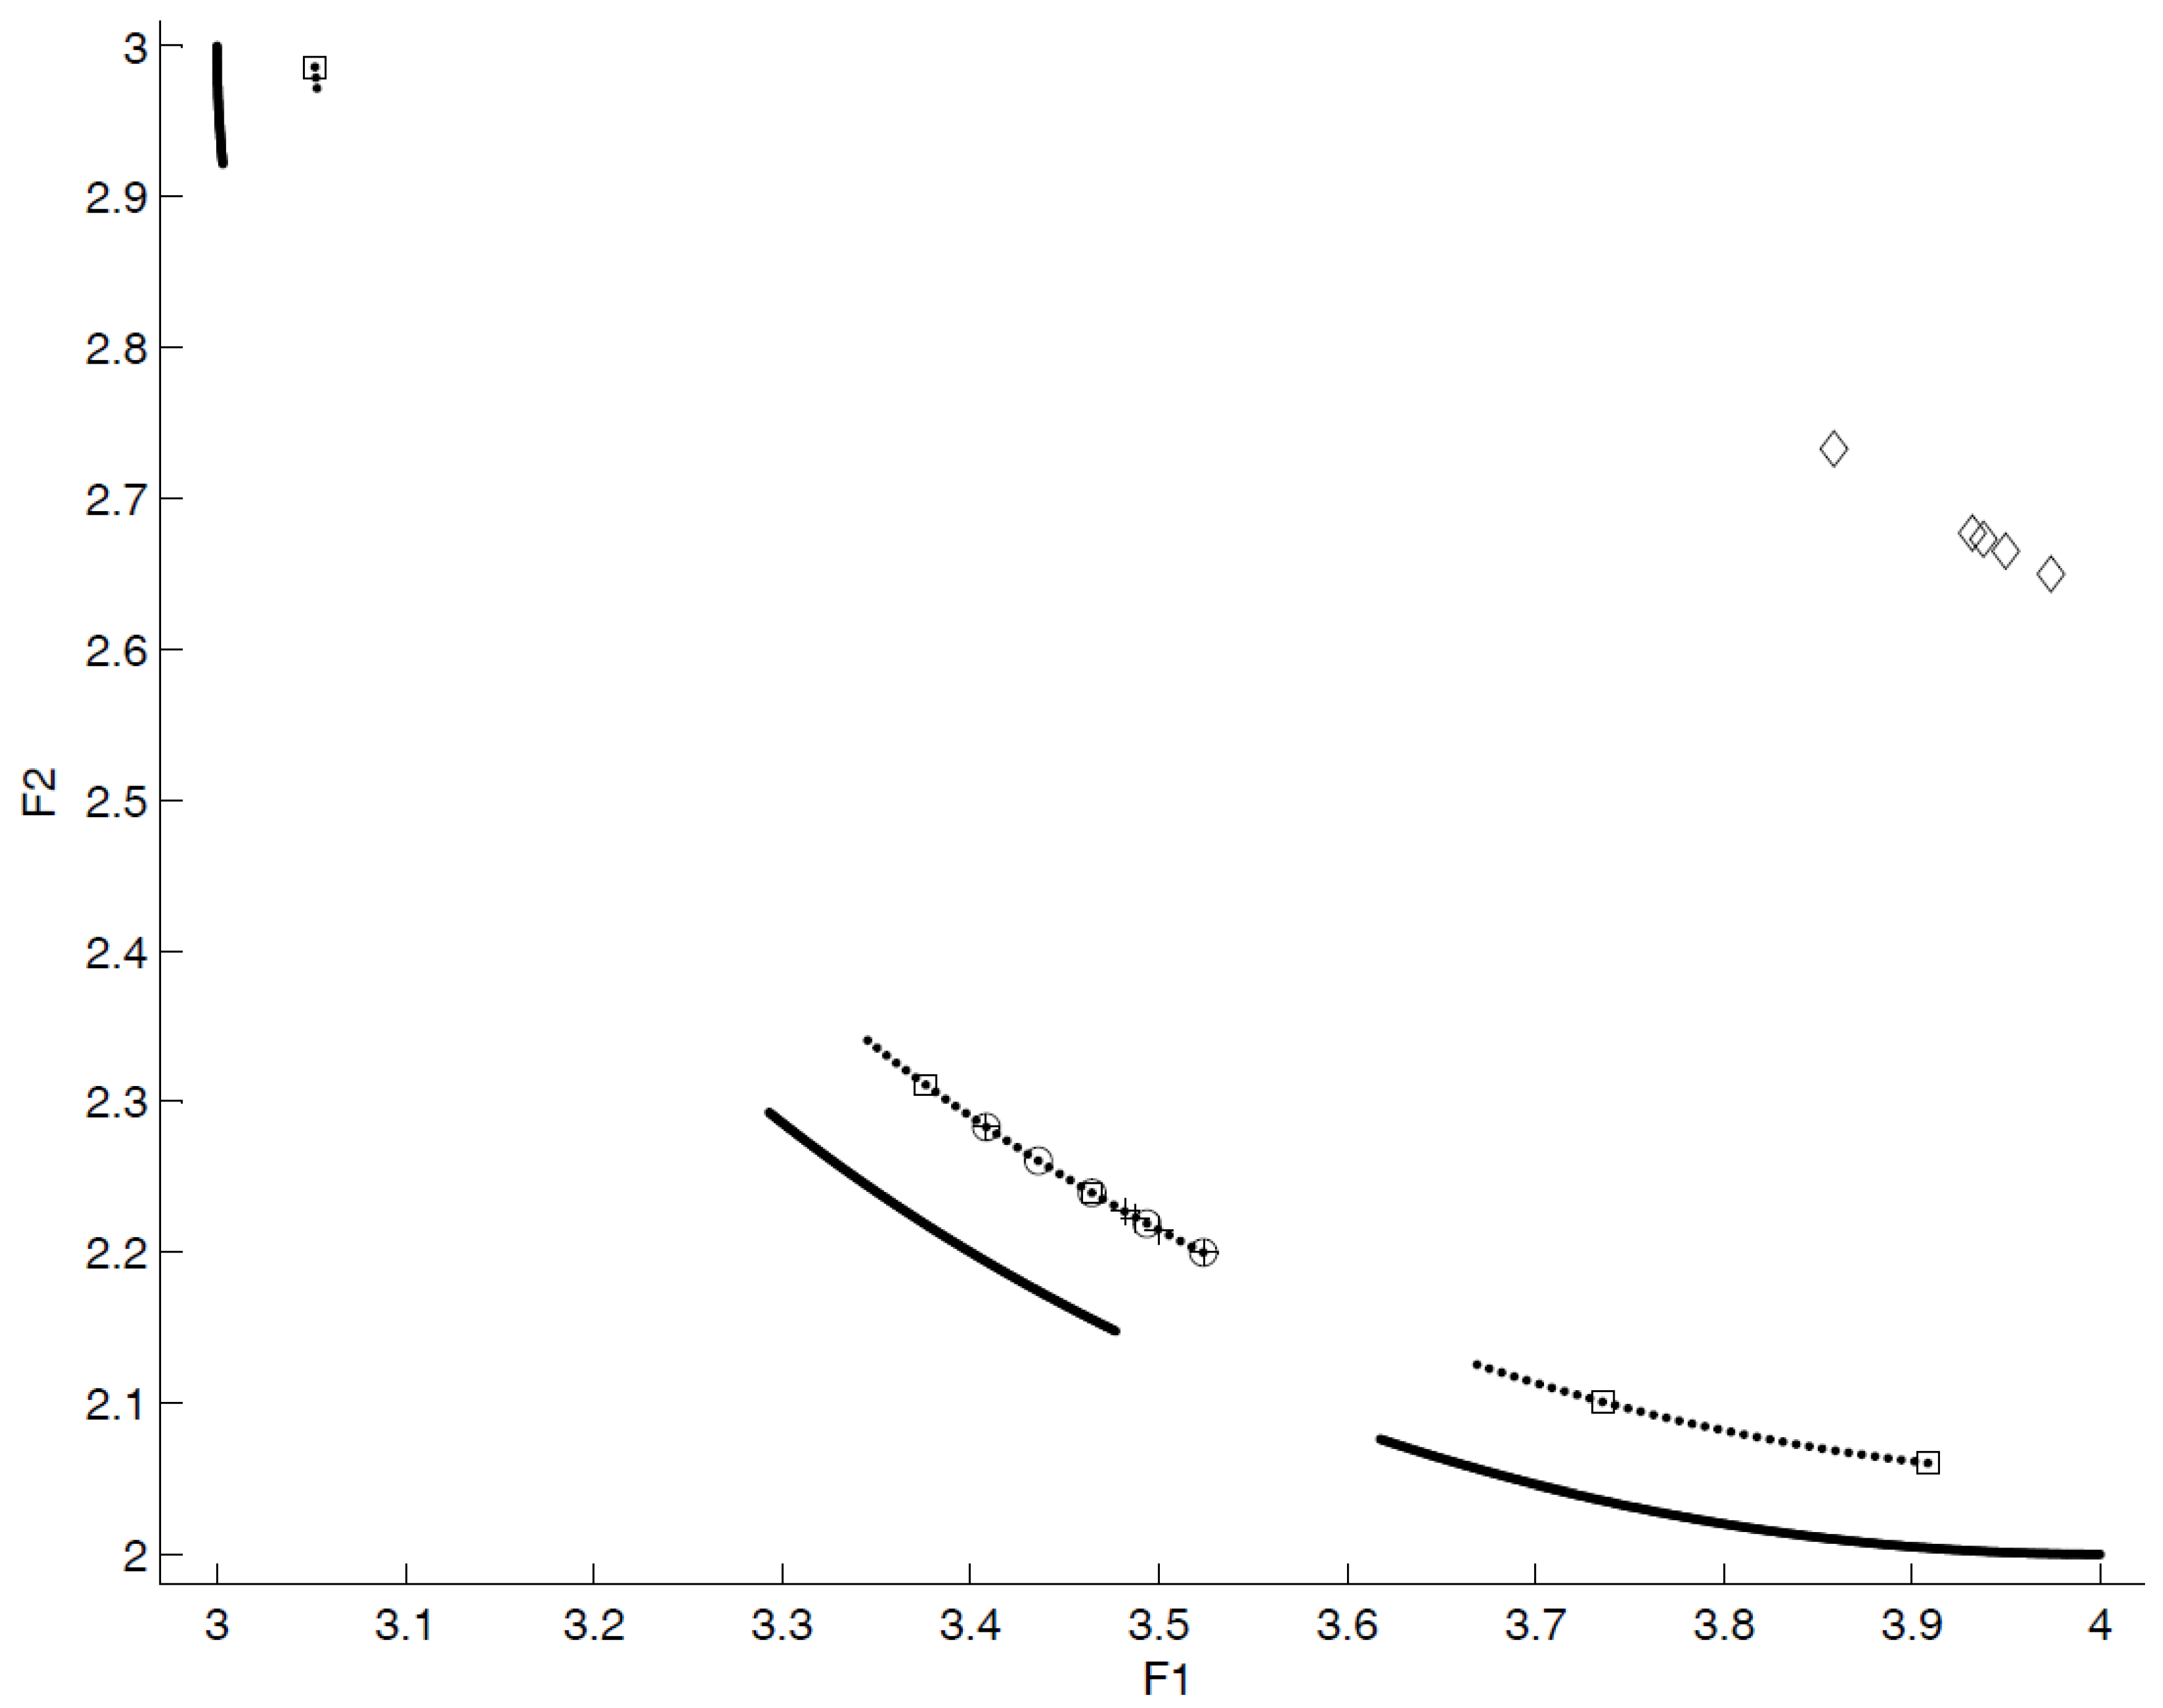
- convex and disconnected.
9. Conclusions and Future Work
Author Contributions
Conflicts of Interest
Appendix A.
- dfi*,a* = di*,A ⇒ dfi*,a* ≤ dfi*,a’ ∀ a’∊Di*,A
- dfi*,a* < ri*,A ⇒ dfi*,a* < rfi*,a″ ∀ a″∊A\Di*,A
- when i≼a≺b ⇒ dfi,a < dfi,b (see Section C2)
- when i||a ∧ i≺b ∧ a≺b ⇒ rfi,a ≤ dfi,b (see Section D2)
- when i||a ∧ i||b ∧ a≺b ⇒ rfi,a ≤ rfi,b (see Section E2)
- (a)
- a*≺b’
- (b)
- a’≺b’, where a’∊Di*,A
- (c)
- a″≺b’, where a″∊A\Di*,A.
Appendix B.
B.1. Proof by Induction with n = 2
B.2. Proof by Induction with n = 3
References
- Zitzler, E.; Thiele, L. Multiobjective optimization using evolutionary algorithms—A comparative case study. In Parallel Problem Solving from Nature-PPSN V; Springer: Heidelberg/Berlin, Germany, 1998; Volume 1498, pp. 292–301. [Google Scholar]
- Lei, Y.; Gong, M.; Zhang, J.; Li, W.; Jiao, L. Resource allocation model and double-sphere crowding distance for evolutionary multi-objective optimization. Eur. J. Oper. Res. 2014, 234, 197–208. [Google Scholar] [CrossRef]
- Wang, R.; Purshouse, R.C.; Fleming, P.J. Preference-inspired co-evolutionary algorithms using weight vectors. Eur. J. Oper. Res. 2015, 243, 423–441. [Google Scholar] [CrossRef]
- Sinha, A.; Korhonen, P.; Wallenius, J.; Deb, K. An interactive evolutionary multi-objective optimization algorithm with a limited number of decision maker calls. Eur. J. Oper. Res. 2014, 233, 674–688. [Google Scholar] [CrossRef]
- Ghosh, A.; Dehuri, S. Evolutionary Algorithms for Multi-Criterion Optimization: A Survey. Int. J. Comput. Inf. Sci. 2004, 2, 38–57. [Google Scholar]
- Dilettoso, E.; Rizzo, S.A.; Salerno, N. A Parallel Version of the Self-Adaptive Low-High Evaluation Evolutionary-Algorithm for Electromagnetic Device Optimization. IEEE Trans. Magn. 2014, 50, 633–636. [Google Scholar] [CrossRef]
- Wilfried, J.; Blume, C. Pareto Optimization or Cascaded Weighted Sum: A Comparison of Concepts. Algorithms 2014, 7, 166–185. [Google Scholar]
- Deb, K. Multi-Objective Optimization using Evolutionary Algorithms; John Wiley & Sons: Hoboken, NJ, USA, 2001. [Google Scholar]
- Chen, B.; Zeng, W.; Lin, Y.; Zhang, D. A New Local Search-Based Multiobjective Optimization Algorithm. IEEE Trans. Evol. Comput. 2015, 19, 50–73. [Google Scholar] [CrossRef]
- Talbi, E.G.; Basseur, M.; Nebro, A.J.; Alba, E. Multi-objective optimization using metaheuristics: Non-standard algorithms. Int. Trans. Oper. Res. 2012, 19, 283–305. [Google Scholar] [CrossRef]
- Zitzler, E.; Thiele, L.; Laumanns, M.; Fonseca, C.M.; Fonseca, V.G. Performance assessment of multiobjective optimizers: An analysis and review. IEEE Trans. Evol. Comput. 2003, 7, 117–132. [Google Scholar] [CrossRef]
- Fonseca, C.M.; Fleming, P.J. On the performance assessment and comparison of stochastic multiobjective optimizers. In Parallel Problem Solving from Nature (PPSN-IV); Springer: Berlin, Germany, 1996; pp. 584–593. [Google Scholar]
- Zitzler, E.; Deb, K.; Thiele, L. Comparison of multiobjective evolutionary algorithms: Empirical results. Evol. Comput. 2000, 8, 173–195. [Google Scholar] [CrossRef] [PubMed]
- Shukla, P.K.; Deb, K. On finding multiple Pareto-optimal solutions using classical and evolutionary generating methods. Eur. J. Oper. Res. 2007, 181, 1630–1652. [Google Scholar] [CrossRef]
- Chen, Y.; Zou, X.; Xie, W. Convergence of multi-objective evolutionary algorithms to a uniformly distributed representation of the Pareto front. Inf. Sci. 2011, 181, 3336–3355. [Google Scholar] [CrossRef]
- Lizárraga, G.; Gomez, M.J.; Castañon, M.G.; Acevedo-Davila, J.; Rionda, S.B. Why Unary Quality Indicators Are Not Inferior to Binary Quality Indicators. In MICAI 2009 Advances in Artificial Intelligence; Aguirre, A.H., Borja, R.M., Garciá, C.A.R., Eds.; Springer: Berlin, Germany, 2009; Volume 5845, pp. 646–657. [Google Scholar]
- Dilettoso, E.; Rizzo, S.A.; Salerno, N. A new indicator to assess the quality of a Pareto approximation set applied to improve the optimization of a magnetic shield. In Proceedings of the Scientific Computing in Electrical Engineering, Zurich, Switzerland, 11–14 September 2012.
- Deb, K.; Pratap, A.; Agarwal, S.; Meyariva, T. A Fast and Elitist Multiobjective Genetic Algorithm: NSGA-II. IEEE Trans.Evol. Comput. 2002, 6, 182–197. [Google Scholar] [CrossRef]
- Schaffer, J.D. Multiple objective optimization with vector evaluated genetic algorithms. In Proceedings of the First International Conference on Genetic Algorithms, Pittsburgh, PA, USA, 24–26 July 1985; Grefensttete, J.J., Ed.; Lawrence ErlbaumAssociates Inc.: Hillsdale, NJ, USA, 1987; pp. 93–100. [Google Scholar]
- Fonseca, C.M.; Fleming, P.J. An overview of evolutionary algorithms in multi-objective optimization. Evol. Comput. J. 1995, 3, 1–16. [Google Scholar] [CrossRef]
- Poloni, C. Hybrid GA for Multiobjective aerodynamic shape optimization. In Genetic Algorithms in Engineering and Computer Science; Winter, G., Periaux, J., Galan, M., Cuesta, P., Eds.; Wiley: New York, NY, USA, 1997; pp. 397–414. [Google Scholar]
- Kursawe, F. A variant of evolution strategies for vector optimization. In Parallel Problem Solving from Nature; Schwefel, H.-P., Männer, R., Eds.; Springer: Berlin, Germany, 1990; pp. 193–197. [Google Scholar]
- Deb, K.; Thiele, L.; Laumanns, M.; Zitzler, E. Scalable multiobjective optimization test problems. In Proceedings of the IEEE Congress on Evolutionary Computation, Honolulu, HI, USA, 12–17 May 2002; pp. 825–830.
- Beume, N.; Naujoks, B.; Emmerich, M. SMS-EMOA: Multiobjective selection based on dominated hypervolume. Eur. J. Oper. Res. 2007, 181, 1653–1669. [Google Scholar] [CrossRef]
- Schütze, O.; Domínguez-Medina, C.; Cruz-Cortés, N.; de la Fraga, L.G.; Sun, J.-Q.; Toscano, G.; Landa, R. A scalar optimization approach for averaged Hausdorff approximations of the Pareto front. Eng. Optim. 2016, 48, 1593–1617. [Google Scholar] [CrossRef]
- Zitzler, E.; Knowles, J.D.; Thiele, L. Quality assessment of pareto set approximations. In Multiobjective Optimization; Lecture Notes in Computer Science; Springer: Berlin, Germany, 2008; Volume 5252, pp. 373–404. [Google Scholar]
- Laumanns, M.; Zenklusen, R. Stochastic convergence of random search methods to fixed size Pareto front approximations. Eur. J. Oper. Res. 2011, 213, 414–421. [Google Scholar] [CrossRef]
- Fonseca, C.M.; Knowles, J.D.; Thiele, L.; Zitzler, E. A Tutorial on the Performance Assessment of Stochastic Multiobjective Optimizers. Available online: http://www.tik.ee.ethz.ch/pisa/publications/emo-tutorial-2up.pdf (accessed on 15 December 2016).
- Coello Coello, C.A.; Sierra, M.R. A Study of the Parallelization of a Coevolutionary Multi-objective Evolutionary Algorithm. Lect. Notes Comput. Sci. 2004, 2972, 688–697. [Google Scholar]
- Czyzak, P.; Jaskiewicz, A. Pareto simulated annealing—a metaheuristic technique for multi-objective combinatorial optimization. J. MultiCriteria Decis. Anal. 1998, 7, 34–47. [Google Scholar] [CrossRef]
- Lotov, A.V.; Kamenev, G.K.; Berezkin, V.E. Approximation and Visualization of Pareto-Efficient Frontier for Nonconvex Multiobjective Problems. Dokl. Math. 2002, 66, 260–262. [Google Scholar]
- Lotov, A.V.; Bushenkov, V.A.; Kamenev, G.K. Interactive Decision Maps: Approximation and Visualization of Pareto Frontier; Springer: Boston, MA, USA, 2004. [Google Scholar]
- Srinivas, N.; Deb, K. Multiobjective optimization using nondominated sorting in genetic algorithms. Evol. Comput. 1994, 2, 221–248. [Google Scholar] [CrossRef]
- Van Veldhuizen, D.A. Multiobjective Evolutionary Algorithms: Classifications, Analyzes, and New Innovations. Ph.D. Thesis, Engineering of the Air Force Institute of Technology University, Wright-Patterson AFB, OH, USA, 1999. [Google Scholar]
- Wu, J.; Azarm, S. Metrics for Quality Assessment of a Multiobjective Design Optimization Solution Set. J. Mech. Des. 2001, 123, 18–25. [Google Scholar] [CrossRef]
- Schott, J.R. Fault Tolerant Design Using Single and Multicriteria Genetic Algorithm Optimization. Mc.S. Thesis, Department of Aeronautics and Astronautics, Massachusetts Institute of Technology, Boston, MA, USA, 1995. [Google Scholar]
- Van Veldhuizen, D.A.; Lamont, G.B. On measuring multiobjective evolutionary algorithm performance. In Proceedings of the 2000 Congress on Evolutionary Computation, La Jolla, CA, USA, 16–19 July 2000; pp. 204–211.
- Tan, K.C.; Khor, E.F.; Lee, T.H. Evolutionary Algorithms for Multi-Objective Optimization: Performance Assessments and Comparisons. J. Artif. Intel. Rev. 2002, 17, 253–290. [Google Scholar]
- Schutze, O.; Esquivel, X.; Lara, A.; Coello Coello, C.A. Using the Averaged Hausdorff Distance as a Performance Measure in Evolutionary Multi-Objective Optimization. IEEE Trans. Evol. Comput. 2012, 16, 504–522. [Google Scholar] [CrossRef]
- Rudolph, G.; Schütze, O.; Grimme, C.; Medina, C.D.; Trautmann, H. Optimal averaged Hausdorff archives for bi-objective problems: Theoretical and numerical results. Comput. Optim. Appl. 2016, 64, 589–618. [Google Scholar] [CrossRef]
- While, L. A new analysis of the LebMeasure algorithm for calculating hypervolume. In Evolutionary Multi-Criterion Optimization; Lecture Notes in Computer Science; Springer: Heidelberg/Berlin, Germany, 2005; Volume 3410, pp. 326–340. [Google Scholar]
- While, L.; Bradstreet, L.; Barone, L.; Hingston, P. Heuristics for optimising the calculation of hypervolume for multi-objective optimisation problems. In Proceedings of the IEEE Congress on Evolutionary Computation, Edinburgh, UK, 2–5 September 2005; pp. 2225–2232.
- Fonseca, C.M.; Paquete, L.; López-Ibáñez, M. An improved dimension-sweep algorithm for the hypervolume indicator. In Proceedings of the IEEE Congress on Evolutionary Computation, Vancouver, BC, Canada, 16–21 July 2006; pp. 1157–1163.
- Beume, N.; Rudolph, G. Faster S-Metric calculation by considering dominated hypervolume as Klee’s measure problem. In Proceedings of the 2nd IASTED Conference on Computational Intelligence, San Francisco, CA, USA, 20–22 November 2006; pp. 231–236.
- Knowles, J.; Corne, D.; Fleischer, M. Bounded archiving using the lebesgue measure. In Proceedings of the 2003 Congress on Evolutionary Computation, Canberra, Australia, 8–12 December 2003; Volume 4, pp. 2490–2497.
- While, L.; Barone, L.; Hingston, P.; Huband, S. A Faster Algorithm for Calculating Hypervolume. IEEE Trans. Evol.Comput. 2006, 10, 29–38. [Google Scholar] [CrossRef]


| Symbol | Relation | Description |
|---|---|---|
| x1≺≺x2 | strictly dominance x1 strictly dominates x2 | x1 is better than x2 with respect to each objective function |
| x1≺x2 | dominance x1 dominates x2 | x1 is not worse than x2 with respect to each objective function and x1 is better than x2 by at least one objective function |
| x1≼x2 | weakly dominance x1 weakly dominates x2 | x1 is not worse than x2 with respect to each objective function |
| x1||x2 | incomparability x1 and x2 are incomparable | x1 and x2 do not weakly dominate each other |
| Symbol | Relation | Description |
|---|---|---|
| A≺≺B | A strictly dominates B | each solution belonging to B is strictly dominated by a solution belonging to A |
| A≺B | A dominates B | each solution belonging to B is dominated by a solution belonging to A |
| A⊲B | A is better than B | each solution belonging to B is weakly dominated by a solution belonging to A, and A≠B |
| A≼B | A weakly dominates B | each solution belonging to B is weakly dominated by a solution belonging to A |
| A||B | A and B are incomparable | A and B do not weakly dominate each other |
| Indicator | Closeness | Distribution | Extension | Cardinality |
|---|---|---|---|---|
| Average Distance from Reference Set [30] | ⚫ | ⚫ | ⚫ | ⚫ |
| Chi-Square-Like Deviation Measure [33] | | ⚫ | | |
| Completeness Indicator [31,32] | ⚫ | ⚫ | ⚫ | ⚫ |
| Enclosing Hypercube [11] | | ⚫ | ||
| Generational Distance [34] | ⚫ | |||
| Hypervolume [1] | ⚫ | ⚫ | ⚫ | ⚫ |
| Inverted Generational Distance [29] | ⚫ | ⚫ | ⚫ | ⚫ |
| M1* [13] | ⚫ | |||
| M2* [13] | ⚫ | | ||
| M3* [13] | ⚫ | |||
| Maximum Pareto Front Error [34] | ⚫ | |||
| Outer Diameter [26] | ⚫ | |||
| Overall Nondominated Vector Generation [34] | ⚫ | |||
| Overall Pareto Spread [35] | ⚫ | |||
| Potential Function [27] | ⚫ | ⚫ | ⚫ | ⚫ |
| Seven Points Average Distance [36] | ⚫ | | ⚫ | |
| Spacing [37] | ⚫ | |||
| Unary ε-Indicator [11,26] | ⚫ | |||
| Uniform Distribution [38] | ⚫ | |||
| Worst Distance from Reference Set [30] | ⚫ | |||
| Δ [8] | ⚫ | ⚫ | ||
| Δp [39,40] | ⚫ | ⚫ | ⚫ | ⚫ |
| POF | APF | Closeness | Distribution | Extension | Cardinality | DOA |
|---|---|---|---|---|---|---|
| Convex and connected (see Figure 14) | APF1(◊) | poor | poor | poor | poor | 0.71040 |
| APF2(+) | good | poor | poor | poor | 0.16940 | |
| APF3(○) | good | good | poor | poor | 0.16287 | |
| APF4(□) | good | good | good | poor | 0.10253 | |
| APF5(●) | good | good | good | good | 0.06431 | |
| Non-convex and connected (see Figure 15) | APF1(◊) | poor | poor | poor | poor | 0.79167 |
| APF2(+) | good | poor | poor | poor | 0.24303 | |
| APF3(○) | good | good | poor | poor | 0.23465 | |
| APF4(□) | good | good | good | poor | 0.09301 | |
| APF5(●) | good | good | good | good | 0.06993 | |
| Convex and disconnected (see Figure 16) | APF1(◊) | poor | poor | poor | poor | 0.69510 |
| APF2(+) | good | poor | poor | poor | 0.16866 | |
| APF3(○) | good | good | poor | poor | 0.16810 | |
| APF4(□) | good | good | good | poor | 0.07254 | |
| APF5(●) | good | good | good | good | 0.06331 |
© 2017 by the authors. Licensee MDPI, Basel, Switzerland. This article is an open access article distributed under the terms and conditions of the Creative Commons Attribution (CC BY) license ( http://creativecommons.org/licenses/by/4.0/).
Share and Cite
Dilettoso, E.; Rizzo, S.A.; Salerno, N. A Weakly Pareto Compliant Quality Indicator. Math. Comput. Appl. 2017, 22, 25. https://doi.org/10.3390/mca22010025
Dilettoso E, Rizzo SA, Salerno N. A Weakly Pareto Compliant Quality Indicator. Mathematical and Computational Applications. 2017; 22(1):25. https://doi.org/10.3390/mca22010025
Chicago/Turabian StyleDilettoso, Emanuele, Santi Agatino Rizzo, and Nunzio Salerno. 2017. "A Weakly Pareto Compliant Quality Indicator" Mathematical and Computational Applications 22, no. 1: 25. https://doi.org/10.3390/mca22010025
APA StyleDilettoso, E., Rizzo, S. A., & Salerno, N. (2017). A Weakly Pareto Compliant Quality Indicator. Mathematical and Computational Applications, 22(1), 25. https://doi.org/10.3390/mca22010025