
Real-Time Monitoring of Microalgal Biomass in Pilot-Scale Photobioreactors Using Nephelometry


Radius, Thomas More University of Applied Sciences, Kleinhoefstraat 4, 2440 Geel, Belgium
*
Author to whom correspondence should be addressed.
Processes 2021, 9(9), 1530; https://doi.org/10.3390/pr9091530
Submission received: 28 July 2021
/
Revised: 17 August 2021
/
Accepted: 26 August 2021
/
Published: 28 August 2021
(This article belongs to the Section Biological Processes and Systems)
Abstract
:The increasing cultivation of microalgae in photobioreactors warrants efficient and non-invasive methods to quantify biomass density in real time. Nephelometric turbidity assessment, a method that measures light scatter by particles in suspension, was introduced already several decades ago but was only recently validated as a high-throughput tool to monitor microalgae biomass. The light scatter depends on the density of the suspended particles as well as on their physical properties, but so far there are hardly any accounts on how nephelometric assessment relates to classic methods such as dry weight and spectrophotometric measurement across a broad biomass density range for different microalgae species. Here, we monitored biomass density online and in real time during the semi-continuous cultivation of three commercial microalgae species Chloromonas typhlos, Microchloropsis gaditana and Porphyridium purpureum in pilot-scale photobioreactors, and relate nephelometric turbidity to dry weight and optical density. The results confirm a relatively strong (R2 = 0.87–0.93) and nonlinear relationship between turbidity and biomass density that differs among the three species. Overall, we demonstrate how nephelometry can be used to monitor microalgal biomass in photobioreactors, and provide the necessary means to estimate the biomass density of the studied species from turbidity data to facilitate automated biomass monitoring.
1. Introduction
Microalgae cultivation is gaining interest due to the anticipated wealth of application opportunities in a wide range of economic sectors [1,2]. Because microalgae are highly diverse, they can be cultivated in various technical systems including in open tanks and raceway ponds, or in closed (photo) bioreactors to allow for tightly controlled operating conditions [3]. Photobioreactors are particularly useful for the (semi-)continuous, monospecific culturing of microalgae and to reach a high biomass productivity, as well as to manipulate various growth parameters for optimal production of high-value compounds [4].
Tight control of microalgal productivity in photobioreactors hinges on a fast, non-invasive and reliable monitoring method to quantify biomass density [5,6]. Over the years, various methods have been used that rely on optical density (spectrophotometry) and chlorophyll fluorescence (fluorometry) as a proxy for biomass [7,8]. However, these methods are inherently confounded by variation in pigment content [7], and do not easily allow for real-time data collection [8]. Likewise, traditional cell counts or dry weight measurements to more directly quantify microalgal biomass are generally labor- and time-intensive [8,9]. In contrast, nephelometric turbidity can be measured instantly and non-invasively, without needing the typical sample preparation steps (e.g., dilution, washing, filtration) of classic methods [10]. Nephelometers measure light scatter by suspended particles and are commonly used in various applications including in ecology to assess water turbidity [11], and in medicine and veterinary science to determine the level of proteins in biofluids [12]. This technique was introduced already several decades ago to also quantify algal biomass [13,14] but was never widely implemented due to the low sensitivity, reliability and automatability of the available instruments at the time [7]. Nowadays, these limitations are overcome by several technological improvements, and nephelometry was recently validated on lab-scale to monitor in real time the biomass of aquatic organisms including filamentous fungi [15], macroalgae and microalgae [7]. Consequently, the interest to use nephelometers in larger-scale microalgae photobioreactors is now rapidly increasing.
Nephelometric turbidity can be used as a proxy for microalgal density because the intensity of scattered light is directly proportional to the density of suspended particles [8,15]. However, light scatter also depends to some extent on the physical characteristics of the particles themselves such as size, shape and reflectivity [16,17,18], which typically vary extensively among microalgae species. To accurately monitor the biomass in photobioreactors for a given species, we therefore need to establish an empirical relationship between turbidity values and the corresponding biomass. Besides offering invaluable information on the ideal moment to harvest the culture, accurate biomass estimation also allows for real-time adjustment of growth parameters tailored to the cultivated species and conditions [6,8]. Still, there are hardly any reports in scientific literature on how nephelometric assessment relates to classic methods such as dry weight and spectrophotometric measurement across a broad biomass density range for different microalgae species. In this study, we address this paucity with the overall aim to facilitate the current trend of using nephelometry as a high-potential monitoring method of microalgal biomass in photobioreactors. For this, we monitor biomass density during the semi-continuous cultivation of three commercial microalgae species Chloromonas typhlos, Microchloropsis gaditana and Porphyridium purpureum in pilot-scale photobioreactors, and relate nephelometric turbidity to dry weight and optical density for each species.
2. Materials and Methods
2.1. Microalgal Strains and Culture Conditions
Chloromonas typhlos (SAG 26.86), Microchloropsis (Nannochloropsis) gaditana (SAG 2.99) and Porphyridium purpureum (SAG 1380-1C) were purchased from SAG (Department Experimental Phycology and Culture Collection of Algae, University of Goettingen, Germany). Stock cultures were maintained in 250 mL-erlenmeyers on an orbital shaker (90 rpm) in a climate-controlled room at 22 °C (±1 °C) and 70 µmol m−2 s−1 light exposure (top-illumination, cool-white fluorescent) under a 16/8-h light/dark regime. Sterile freshwater medium with the following composition was used for C. typhlos (based on SAG basal medium version 10.2008): 252 mg/L HNO3, 22 mg/L H3PO4, 248 mg/L KOH, 6.3 mg/L Fe-DTPA, 42 pg/L CuSO4.5H2O, 2.8 µg/L ZnSO4, 7.2 µg/L MnSO4, 4.3 µg/L Na2MoO4, 40 µg/L Na2B4O7, 0.2 g/L NaHCO3 and 23 mg/L MgSO4.7H2O. For M. gaditana and P. purpureum, sterile brackish medium with the following composition was used (based on SAG brackish water medium, version 10.2008): 252 mg/L HNO3, 22 mg/L H3PO4, 248 mg/L KOH, 6.3 mg/L Fe-DTPA, 42 pg/L CuSO4.5H2O, 2.8 µg/L ZnSO4, 7.2 µg/L MnSO4, 4.3 µg/L Na2MoO4, 40 µg/L Na2B4O7, 0.2 g/L NaHCO3, 3.15 g/L MgSO4.7H2O, 11.8 g/L NaCl and 0.315 g/L CaCl2.2H2O.
To provide the desired volume of algae-inoculum for culturing in photobioreactors, stock cultures were scaled up (in a stepwise approach) to aerated 1-L, 2-L and 50-L recipients each time the cultures reached a dry weight of 0.5–1.5 g L−1. When the desired culture volume was reached, a pilot-scale photobioreactor of 300 L or 1500 L was inoculated till a starting concentration of 0.05–0.15 g L−1 (1/10 dilution) to initiate the cultivation process.
2.2. Microalgal Cultivation in Photobioreactors
Horizontal, tubular photobioreactors (closed system, Sunbuilt installation, Figure 1) were used for pilot-scale cultivation of microalgae. Tubes were unplasticized polyvinylchloride (uPVC, transparent) with an outer diameter of 50 mm and a thickness of 2 mm. Compressed air was added to guarantee culture agitation, aeration and perfusion, and CO2 was injected on demand to regulate the set pH value (pH = 8, 7.5–8.5 and 8.0–9.0 for C. typhlos, M. gaditana and P. purpureum, respectively) using a Bronkhorst High-Tech B.V. mass flow controller (Veenendaal, The Netherlands). CO2 injection was steered by online continuous measurement of the pH and an electromagnetic valve-controlled injection. A maximum flow of 8859 and 5600 mL normal per minute was applied for the 300-L and 1500-L photobioreactor, respectively. Microalgae were cultivated in semi-continuous mode under nutrient-replete conditions for several growth cycles per culture (Figure 2 for details on time and duration), each time retaining 10% of the culture after harvest to initiate the next growth cycle (1/10 dilution) until termination. This was either done in a 300-L or 1500-L photobioreactor, or both, and during different seasons to capture realistic variation in growing conditions in an operational environment. Photobioreactors were installed in a greenhouse (Geel, Belgium) and experienced normal fluctuations in temperature. C. typhlos, M. gaditana and P. purpureum were cultured at a respective optimal temperature range of 10–25 °C, 20–35 °C and 18–30 °C. A natural light/dark photoperiod was maintained throughout the entire cultivation period. During winter, illumination through direct sunlight is scarce and was therefore supplemented with artificial lighting using fluorescent lamps (to a total of 500 mmol/m2/day).
2.3. Analytical Methods
Throughout the cultivation period, algal density in each culture was monitored in real time by means of an integrated MTOL+™ nephelometer of HF Scientific—WATTS (North Andover, MA, USA) and measured in nephelometric units (NTU, using krypton gas filled white light following EPA Method 180.1). The nephelometer was installed near the centrifugal pump that was used to pump the algal suspension through the reactor, which ensured an adequate flow pressure in the measuring chamber of the meter (Figure 1). In parallel, optical density and dry weight were assessed at regular timepoints by sampling the cultures and following standard methods [19]. Optical density measurements were done at a wavelength of 435, 565, 680 and 720 nm on a spectrophotometer (Genesys 10S UV-VIS, Thermo Fisher Scientific™) using the culture medium without microalgae as blank. To assess dry weight, 5-mL samples were collected and filtered on glass microfiber membranes (0.45 µm, washed in deionized water), dried at 70 °C for 24 h and transferred to a desiccator before weighing. Nephelometric turbidity was related to optical density and dry weight using regression analysis (with the highest coefficient of determination, R2) in Microsoft Excel version 2103.
3. Results and Discussion
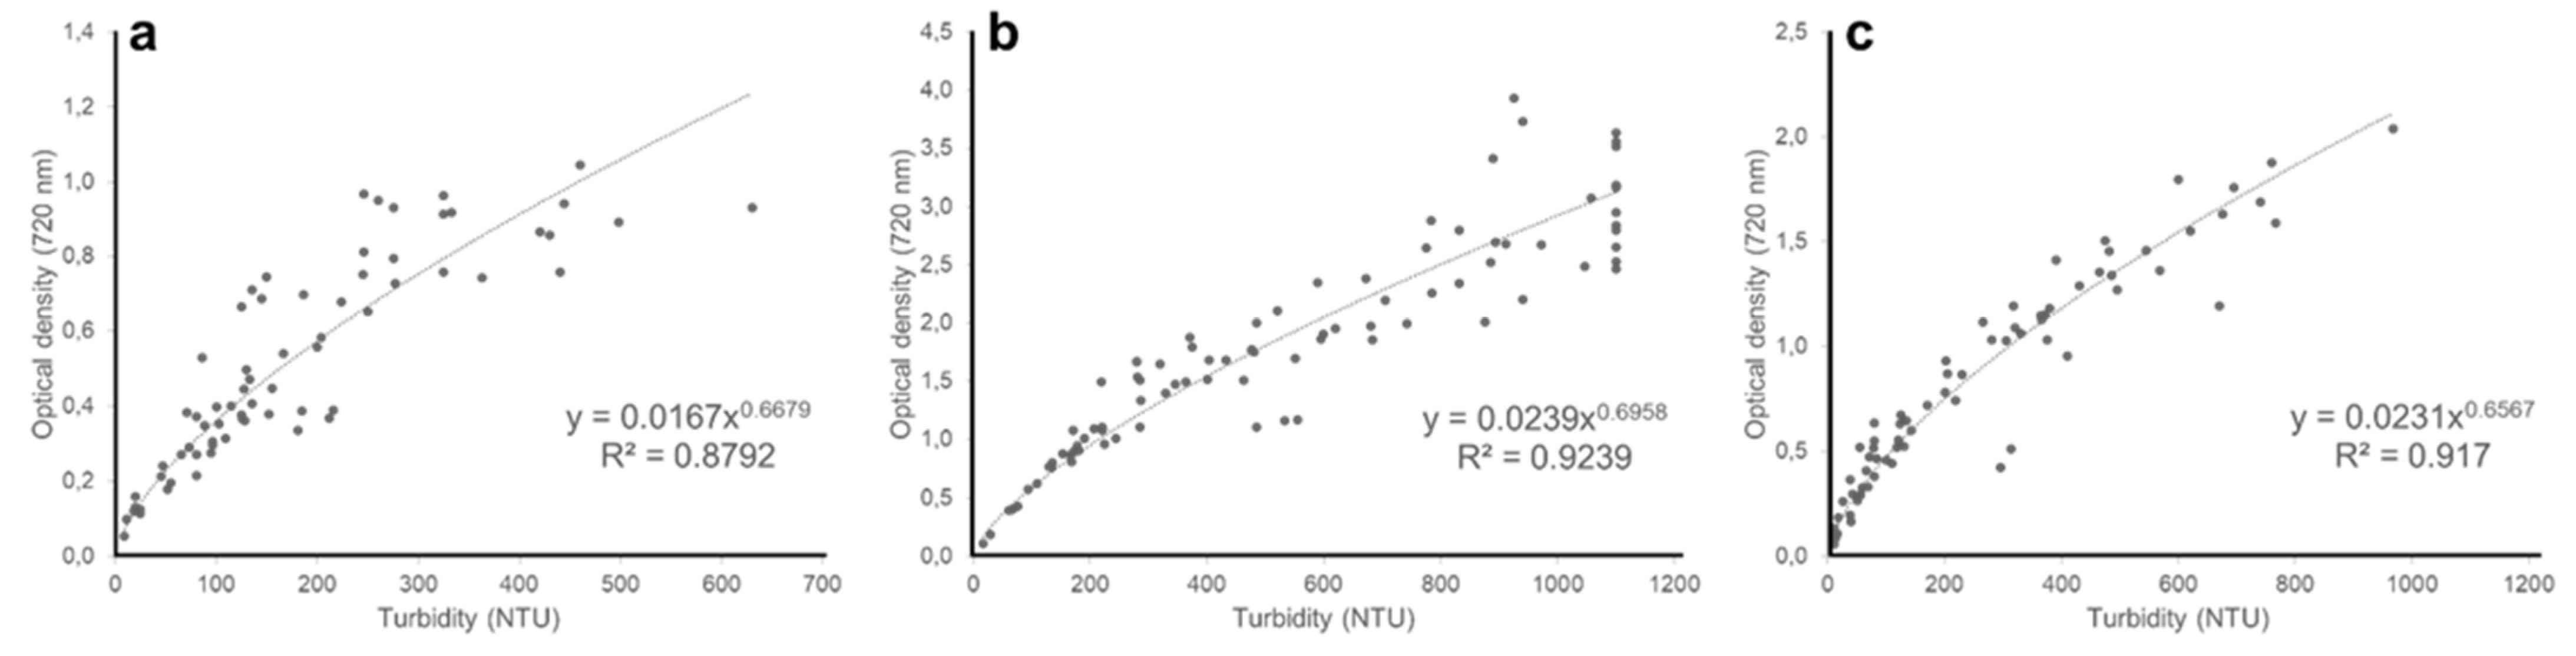
In this study, we piloted nephelometry to monitor in real time the biomass of three commercially interesting microalgae species in pilot-scale photobioreactors. A positive relationship between turbidity and dry weight emerged for all three microalgae (Figure 3a–c), showing that nephelometric turbidity can be used as a proxy for biomass density. This result is in line with earlier studies that demonstrate the potential of nephelometry to estimate algal biomass on lab-scale [7,8,20] and is corroborated by our observation that turbidity is positively related with optical density (720 nm) for all three species (Figure 4a–c, and Appendix A Figure A1, Figure A2 and Figure A3 for similar results at 435, 565 and 680 nm).
We considered a broad biomass density range relevant for microalgae culturing in photobioreactors because the dependency of turbidity on biomass density may vary in the same culture over time [8]. Our results confirm this by showing a relatively strong (R2 = 0.87–0.93) and nonlinear relationship between turbidity and dry weight for all three species. Importantly, and as expected, the exact empirical relationship also differed among the three species (Figure 3a–c). These observations can be explained by differences in propensity of particles to scatter light, which is determined by a range of morphometric properties of the algae cells including size and shape [16,17]. For instance, C. typhlos vegetative cells have an ellipsoidal or ovoid shape of 8–17 µm long and 6–13 µm wide [21], while M. gaditana and P. purpureum cells are spherical to (ob)ovoid with a diameter of 2–5 µm and 5–16 µm, respectively [22,23]. In addition, variation in several external (e.g., cell wall, flagella) and internal (e.g., vacuoles) structures also determines particle reflectivity. For instance, the cell wall of M. gaditana is a bilayer structure with an inner cellulose layer covered by an outer hydrophobic algaenan layer [24], while the cells of P. purpureum are encapsulated within a cell-wall polysaccharide complex [25]. Because of this extensive within- and among-species variation, it is essential to develop calibration curves for each algal species and across a broad biomass density range to accurately monitor biomass through nephelometry.
The current study delivers an effective demonstration of how nephelometry can be used to monitor microalgal biomass, and the provided empirical relationship between turbidity and biomass density can be used to accurately estimate the biomass density of the three studied microalgae species throughout the entire cultivation cycle. Nephelometers can easily be integrated in the design of photobioreactors, allowing for instant and non-invasive turbidity assessment. Because turbidity can be logged automatically throughout the entire cultivation, personnel costs of traditional, laborious monitoring methods are largely reduced [7]. Such continuous measuring is particularly useful to automate culturing and harvesting strategies, for instance to supplement nutrients or to harvest the culture when particular cell densities are reached, or to take corrective actions if the growth rate is not up to par. It should be noted, however, that the used nephelometer in the current study only measures turbidity accurately till ~1000 NTU. Although sensors with a higher range are available, the need for using such sensors needs to be evaluated on a case-by-case basis. For instance, M. gaditana only reached cell densities of 1–1.5 g L−1 at >800 NTU (Figure 3b), while P. purpureum already reached similar densities at 400–750 NTU (Figure 3c). Moreover, the accuracy of nephelometers may decline at higher turbidity values (i.e., at harvesting densities), as also suggested by the increasing variability at higher turbidity values in Figure 3, and may even drop significantly when cells aggregate—typically in response to environmental stress [26,27]. Likewise, occasional biofilm formation [28] in the reactor or at the sensor may also limit accurate turbidity assessment. Therefore, and especially when high cell densities are reached, periodic cleaning of the sensor may be necessary to ensure correct turbidity measurement. Moreover, variation in culturing conditions often triggers changes in life-stage and can lead to structural changes in algae cells—which is likely to affect the reflectivity of the particles. For instance, vegetative cells of the microalga Haematococcus pluvialis transform into dormant cysts with a thick cell wall when conditions become unfavorable [29]. Less drastically but still confounding, nitrogen deprivation increases the average cell size and cell wall thickness in several microalgae species [30], and may alter the quantity and composition of intracellular lipid bodies [31,32]. Besides such intra-species variation, unwanted particles such as contaminating microorganisms could also influence nephelometric turbidity [7]. Nevertheless, as in the current study, these potential drawbacks are largely reduced under controlled operating conditions with closed photobioreactors, which are typically used for highly standardized culturing of monocultures at stable, optimal growth conditions and with minimal to no risk of contamination [4]. Ideally, nephelometry could be combined with automated image-analysis to monitor the cultivation process in detail. In addition to data on biomass density, such method could also give information on cell size, morphology distributions and potential contamination [33,34], and was recently shown successful to evaluate the reproductive effort and progression of symptoms in diseased macroalgal cultures [7]. In this way, real-time monitoring of microalgae growth not only allows for a tight control of automated microalgal cultivation but may also advance our basic understanding of algae biology to improve commercial production of microalgal biomass and its derived high-value compounds.
Author Contributions
Conceptualization, E.S.J.T., F.S., J.S. and S.V.M.; Formal analysis, E.S.J.T.; Funding acquisition, S.V.M.; Methodology, F.S. and J.S.; Supervision, S.V.M.; Visualization, E.S.J.T.; Writing—original draft, E.S.J.T.; Writing—review and editing, E.S.J.T., F.S., J.S. and S.V.M. All authors have read and agreed to the published version of the manuscript.
Funding
This research was funded by Interreg North-West Europe, Grant No. NWE 639.
Institutional Review Board Statement
Not applicable.
Informed Consent Statement
Not applicable.
Data Availability Statement
The raw data supporting the conclusions of this article will be made available by the authors, without undue reservation.
Acknowledgments
We thank Interreg NWE for funding this research. We furthermore thank Rut Vleugels, Audrey De Cuyper and Geert Verheyen for their support in the practical work and conceptualization of this study.
Conflicts of Interest
The authors declare no conflict of interest. The funders had no role in the design of the study; in the collection, analyses, or interpretation of data; in the writing of the manuscript, or in the decision to publish the results.
Appendix A
Figure A1.
Relationship between nephelometric turbidity and optical density at 435 nm of (a) Chloromonas typhlos, (b) Microchloropsis gaditana and (c) Porphyridium purpureum. (NTU = nephelometric turbidity units).
Figure A1.
Relationship between nephelometric turbidity and optical density at 435 nm of (a) Chloromonas typhlos, (b) Microchloropsis gaditana and (c) Porphyridium purpureum. (NTU = nephelometric turbidity units).
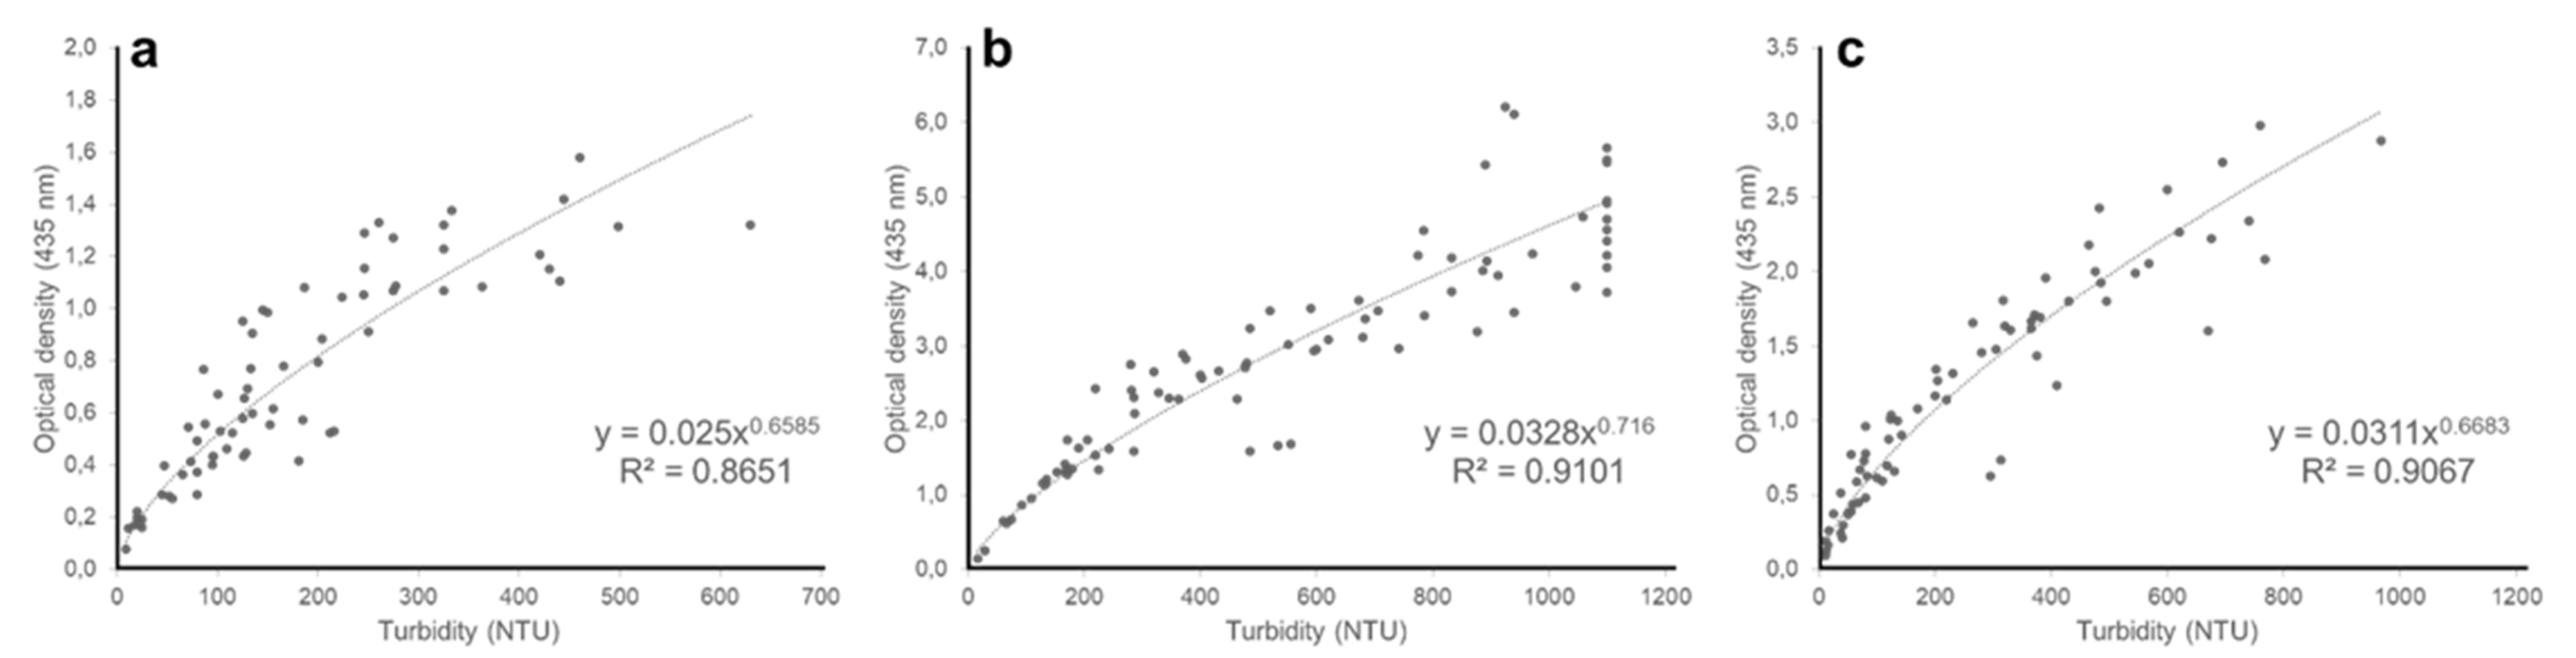
Figure A2.
Relationship between nephelometric turbidity and optical density at 565 nm of (a) Chloromonas typhlos, (b) Microchloropsis gaditana and (c) Porphyridium purpureum. (NTU = nephelometric turbidity units).
Figure A2.
Relationship between nephelometric turbidity and optical density at 565 nm of (a) Chloromonas typhlos, (b) Microchloropsis gaditana and (c) Porphyridium purpureum. (NTU = nephelometric turbidity units).

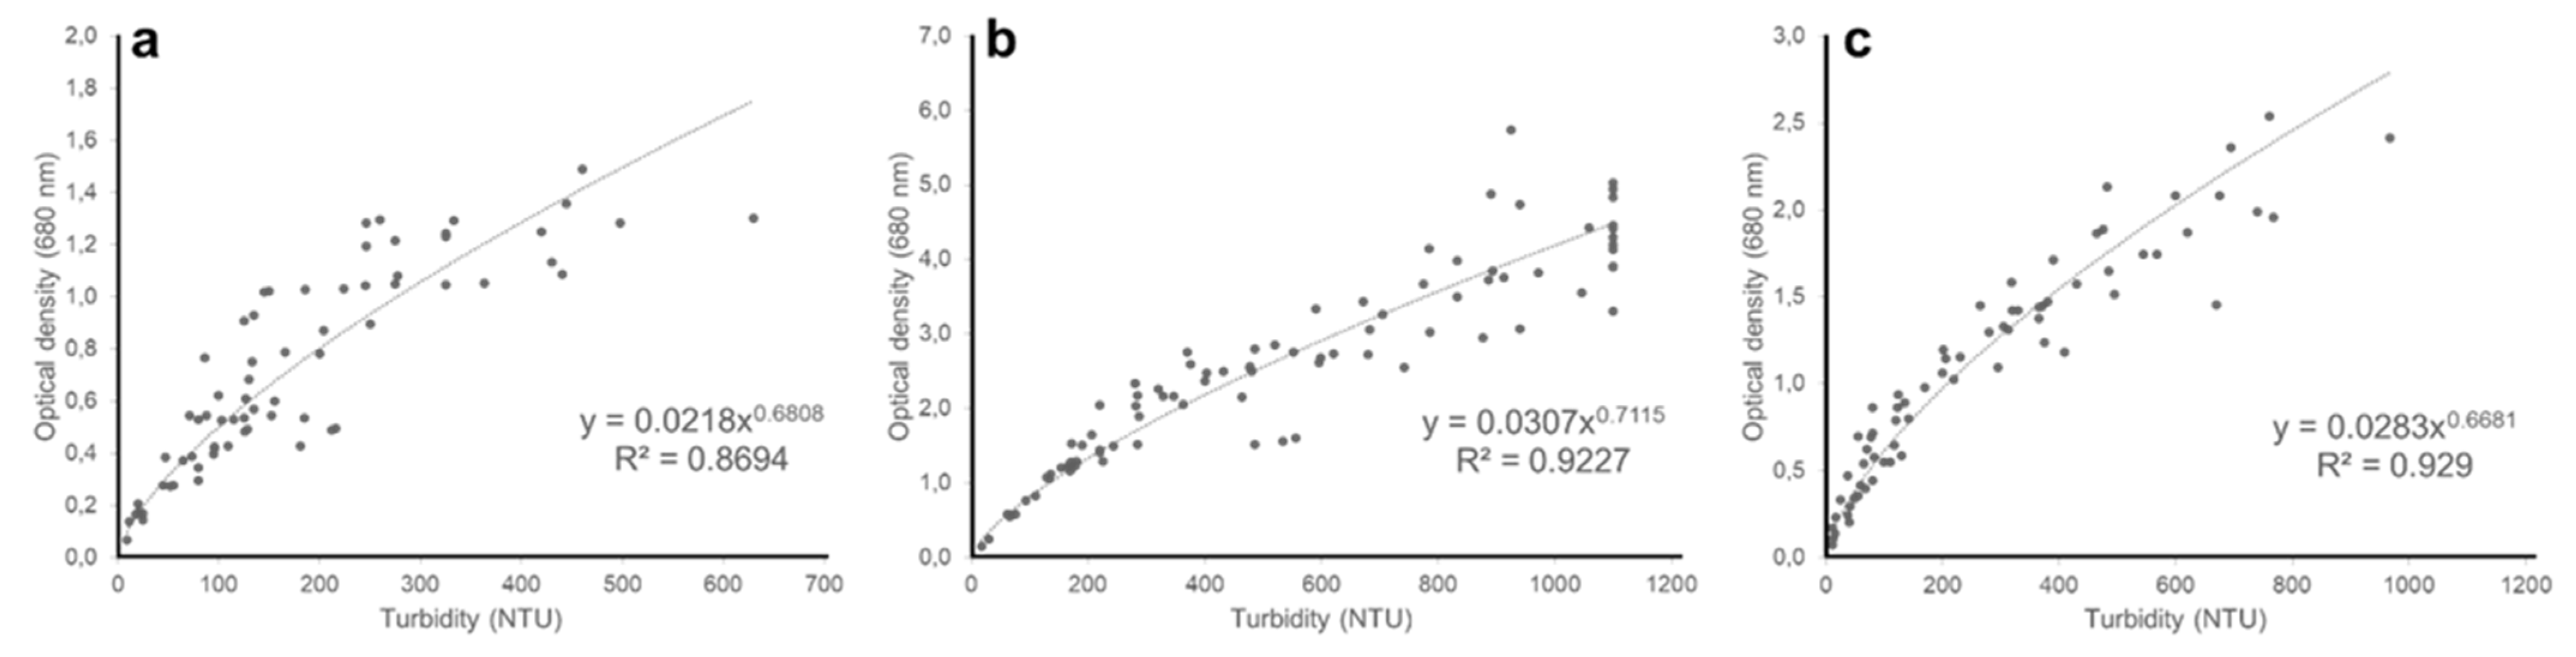
Figure A3.
Relationship between nephelometric turbidity and optical density at 680 nm of (a) Chloromonas typhlos, (b) Microchloropsis gaditana and (c) Porphyridium purpureum. (NTU = nephelometric turbidity units).
Figure A3.
Relationship between nephelometric turbidity and optical density at 680 nm of (a) Chloromonas typhlos, (b) Microchloropsis gaditana and (c) Porphyridium purpureum. (NTU = nephelometric turbidity units).
References
- Rösch, C.; Roßmann, M.; Weickert, S. Microalgae for integrated food and fuel production. GCB Bioenergy 2019, 11, 326–334. [Google Scholar] [CrossRef]
- Thoré, E.S.J.; Schoeters, F.; De Cuyper, A.; Vleugels, R.; Noyens, I.; Bleyen, P.; Van Miert, S. Waste Is the New Wealth—Recovering Resources from Poultry Wastewater for Multifunctional Microalgae Feedstock. Front. Environ. Sci. 2021, 9, 679917. [Google Scholar] [CrossRef]
- Narala, R.R.; Garg, S.; Sharma, K.K.; Thomas-Hall, S.R.; Deme, M.; Li, Y.; Schenk, P.M. Comparison of microalgae cultivation in photobioreactor, open raceway pond, and a two-stage hybrid system. Front. Energy Res. 2016, 4, 29. [Google Scholar] [CrossRef]
- Mata, T.M.; Martins, A.A.; Caetano, N.S. Microalgae for biodiesel production and other applications: A review. Renew. Sustain. Energy Rev. 2010, 14, 217–232. [Google Scholar] [CrossRef] [Green Version]
- Malapascua, J.R.F.; Jerez, C.G.; Sergejevová, M.; Figueroa, F.L.; Masojídek, J. Photosynthesis monitoring to optimize growth of microalgal mass cultures: Application of chlorophyll fluorescence techniques. Aquat. Biol. 2014, 22, 123–140. [Google Scholar] [CrossRef] [Green Version]
- Havlik, I.; Linder, P.; Scheper, T.; Reardon, K.F. On-line monitoring of large cultivations of microalgae and cyanobacteria. Trends Biotechnol. 2013, 31, 406–414. [Google Scholar] [CrossRef]
- Calmes, B.; Strittmatter, M.; Jacquemin, B.; Perrineau, M.; Rousseau, C.; Badis, Y.; Cock, J.M.; Destombe, C.; Valero, M.; Gachon, C.M.M. Parallelisable non-invasive biomass, fitness and growth measurement of macroalgae and other protists with nephelometry. Algal Res. 2020, 46, 101762. [Google Scholar] [CrossRef]
- Ferrando, N.S.; Benítez, H.H.; Gabellone, N.A.; Claps, M.C.; Altamirano, P.R. A quick and effective estimation of algal density by turbidimetry developed with Chlorella vulgaris cultures. Limnetica 2015, 34, 397–406. [Google Scholar] [CrossRef]
- Embleton, K.V.; Gibson, C.E.; Heaney, S.I. Automated counting of phytoplankton by pattern recognition: A comparison with a manual counting method. J. Plankton Res. 2003, 25, 669–681. [Google Scholar] [CrossRef] [Green Version]
- Jia, F.; Kacira, M.; Ogden, K.L. Multi-wavelength based optical density sensor for autonomous monitoring of microalgae. Sensors 2015, 15, 22234–22248. [Google Scholar] [CrossRef] [Green Version]
- Lloyd, D.S. Turbidity as a water quality standard for salmonid habitats in Alaska. N. Am. J. Fish. Manag. 1987, 7, 34–35. [Google Scholar] [CrossRef]
- Goehring, L.S.; Kessels, B.G.F.; Van Maanen, C.; Voorbij, H.A.M.; Sloet Van Oldruitenborgh-Oosterbaan, M.M. Evaluation of nephelometry for albumin measurement in serum and cerebrospinal fluid: Experiences with an indwelling subarachnoidal catheter system for repetitive cerebrospinal fluid collection in horses. J. Vet. Diagn. Investig. 2006, 18, 251–256. [Google Scholar] [CrossRef]
- Butterwick, C.; Heaney, S.I.; Talling, J.F. A comparison of eight methods for estimating the biomass and growth of planktonic algae. Br. Phycol. J. 1982, 17, 69–79. [Google Scholar] [CrossRef]
- Bosma, R.; van Zessen, E.; Reith, J.H.; Tramper, J.; Wijffels, R.H. Prediction of Volumetric Productivity of an Outdoor Photobioreactor. Biotechnol. Bioeng. 2007, 97, 1108–1120. [Google Scholar] [CrossRef]
- Joubert, A.; Calmes, B.; Berruyer, R.; Pihet, M.; Bouchara, J.; Simoneau, P.; Guillemette, T. Laser nephelometry applied in an automated microplate system to study filamentous fungus growth. Biotechniques 2010, 48, 399–404. [Google Scholar] [CrossRef] [Green Version]
- Berberoglu, H.; Pilon, L. Experimental measurements of the radiation characteristics of Anabaena variabilis ATCC 29413-U and Rhodobacter sphaeroides ATCC 49419. Int. J. Hydrog. Energy 2007, 32, 4772–4785. [Google Scholar] [CrossRef]
- Kandilian, R.; Pruvost, J.; Artu, A.; Lemasson, C.; Legrand, J.; Pilon, L. Comparison of experimentally and theoretically determined radiation characteristics of photosynthetic microorganisms. J. Quant. Spectrosc. Radiat. Transf. 2016, 175, 30–45. [Google Scholar] [CrossRef] [Green Version]
- Bin Omar, A.F.; Bin Matjafri, M.Z. Turbidimeter Design and Analysis: A Review on Optical Fiber Sensors for the Measurement of Water Turbidity. Sensors 2009, 9, 8311–8335. [Google Scholar] [CrossRef] [PubMed]
- Rice, E.W.; Baird, R.B.; Eaton, A.D. Standard Methods for the Examination of Water and Wastewater, 23rd ed.; American Public Health Association/American Water Works Association/Water Environment Federation: Washington, DC, USA, 2017. [Google Scholar]
- Nguyen, B.T.; Rittmann, B.E. Low-cost optical sensor to automatically monitor and control biomass concentration in microalgal cultivation. Algal Res. 2018, 32, 101–106. [Google Scholar] [CrossRef]
- Matsuzaki, R.; Hara, Y.; Nozaki, H. A taxonomic revision of Chloromonas reticulata (Volvocales, Chlorophyceae), the type species of the genus Chloromonas, based on multigene phylogeny and comparative light and electron microscopy. Phycologia 2012, 51, 74–85. [Google Scholar] [CrossRef]
- Chua, E.T.; Schenk, P.M. A biorefinery for Nannochloropsis: Induction, harvesting, and extraction of EPA-rich oil and high-value protein. Bioresour. Technol. 2017, 244, 1416–1424. [Google Scholar] [CrossRef] [PubMed] [Green Version]
- Borowitzka, M.A. Biology of Microalgae. In Microalgae in Health and Disease Prevention, 1st ed.; Levine, I.A., Fleurence, J., Eds.; Elsevier Inc.: Amsterdam, The Netherlands, 2018; pp. 23–73. [Google Scholar]
- Scholz, M.J.; Weiss, T.L.; Jinkerson, R.E.; Jing, J.; Roth, R.; Goodenough, U.; Posewitz, M.C.; Gerken, H.G. Ultrastructure and composition of the Nannochloropsis gaditana cell wall. Eukaryot. Cell 2014, 13, 1450–1464. [Google Scholar] [CrossRef] [PubMed] [Green Version]
- Simon-bercovitch, B.; Bar-zvi, D.; Arad, S.M. Cell-wall formation during the cell cycle of Porphyridium sp. (Rhodophyta). J. Phycol. 1999, 35, 78–83. [Google Scholar] [CrossRef]
- Fisher, R.M.; Bell, T.; West, S.A. Multicellular group formation in response to predators in the alga Chlorella vulgaris. J. Evol. Biol. 2016, 29, 551–559. [Google Scholar] [CrossRef] [Green Version]
- de Carpentier, F.; Lemaire, S.D.; Danon, A. When Unity Is Strength: The Strategies Used by Chlamydomonas to Survive Environmental Stresses. Cells 2019, 8, 1307. [Google Scholar] [CrossRef] [PubMed] [Green Version]
- Schnurr, P.J.; Allen, D.G. Factors affecting algae biofilm growth and lipid production: A review. Renew. Sustain. Energy Rev. 2015, 52, 418–429. [Google Scholar] [CrossRef]
- Xi, T.; Kim, D.G.; Roh, S.W.; Choi, J.S.; Choi, Y.E. Enhancement of astaxanthin production using Haematococcus pluvialis with novel LED wavelength shift strategy. Appl. Microbiol. Biotechnol. 2016, 100, 6231–6238. [Google Scholar] [CrossRef]
- Yap, B.H.J.; Crawford, S.A.; Dagastine, R.R.; Scales, P.J.; Martin, G.J.O. Nitrogen deprivation of microalgae: Effect on cell size, cell wall thickness, cell strength, and resistance to mechanical disruption. J. Ind. Microbiol. Biotechnol. 2016, 43, 1671–1680. [Google Scholar] [CrossRef] [PubMed]
- Richardson, B.; Orcutt, D.M.; Schwertner, H.A.; Martinez, C.L.; Wickline, H.E. Effects of nitrogen limitation on the growth and composition of unicellular algae in continuous culture. Appl. Microbiol. 1969, 18, 245–250. [Google Scholar] [CrossRef]
- Simionato, D.; Block, M.A.; La Rocca, N.; Jouhet, J.; Maréchal, E.; Finazzi, G.; Morosinotto, T. The response of Nannochloropsis gaditana to nitrogen starvation includes de novo biosynthesis of triacylglycerols, a decrease of chloroplast galactolipids, and reorganization of the photosynthetic apparatus. Eukaryot. Cell 2013, 12, 665–676. [Google Scholar] [CrossRef] [Green Version]
- Havlik, I.; Reardon, K.F.; Ünal, M.; Lindner, P.; Prediger, A.; Babitzky, A.; Beutel, S.; Scheper, T. Monitoring of microalgal cultivations with on-line, flow-through microscopy. Algal Res. 2013, 2, 253–257. [Google Scholar] [CrossRef] [Green Version]
- Höpfner, T.; Bluma, A.; Rudolph, G.; Lindner, P.; Scheper, T. A review of non-invasive optical-based image analysis systems for continuous bioprocess monitoring. Bioprocess Biosyst. Eng. 2010, 33, 247–256. [Google Scholar] [CrossRef] [PubMed]
Figure 1.
Microalgae were cultivated in 300-L or 1500-L photobioreactors, and algal density was monitored in real time by means of an integrated MTOL + TM nephelometer of HF Scientific—WATTS.
Figure 1.
Microalgae were cultivated in 300-L or 1500-L photobioreactors, and algal density was monitored in real time by means of an integrated MTOL + TM nephelometer of HF Scientific—WATTS.
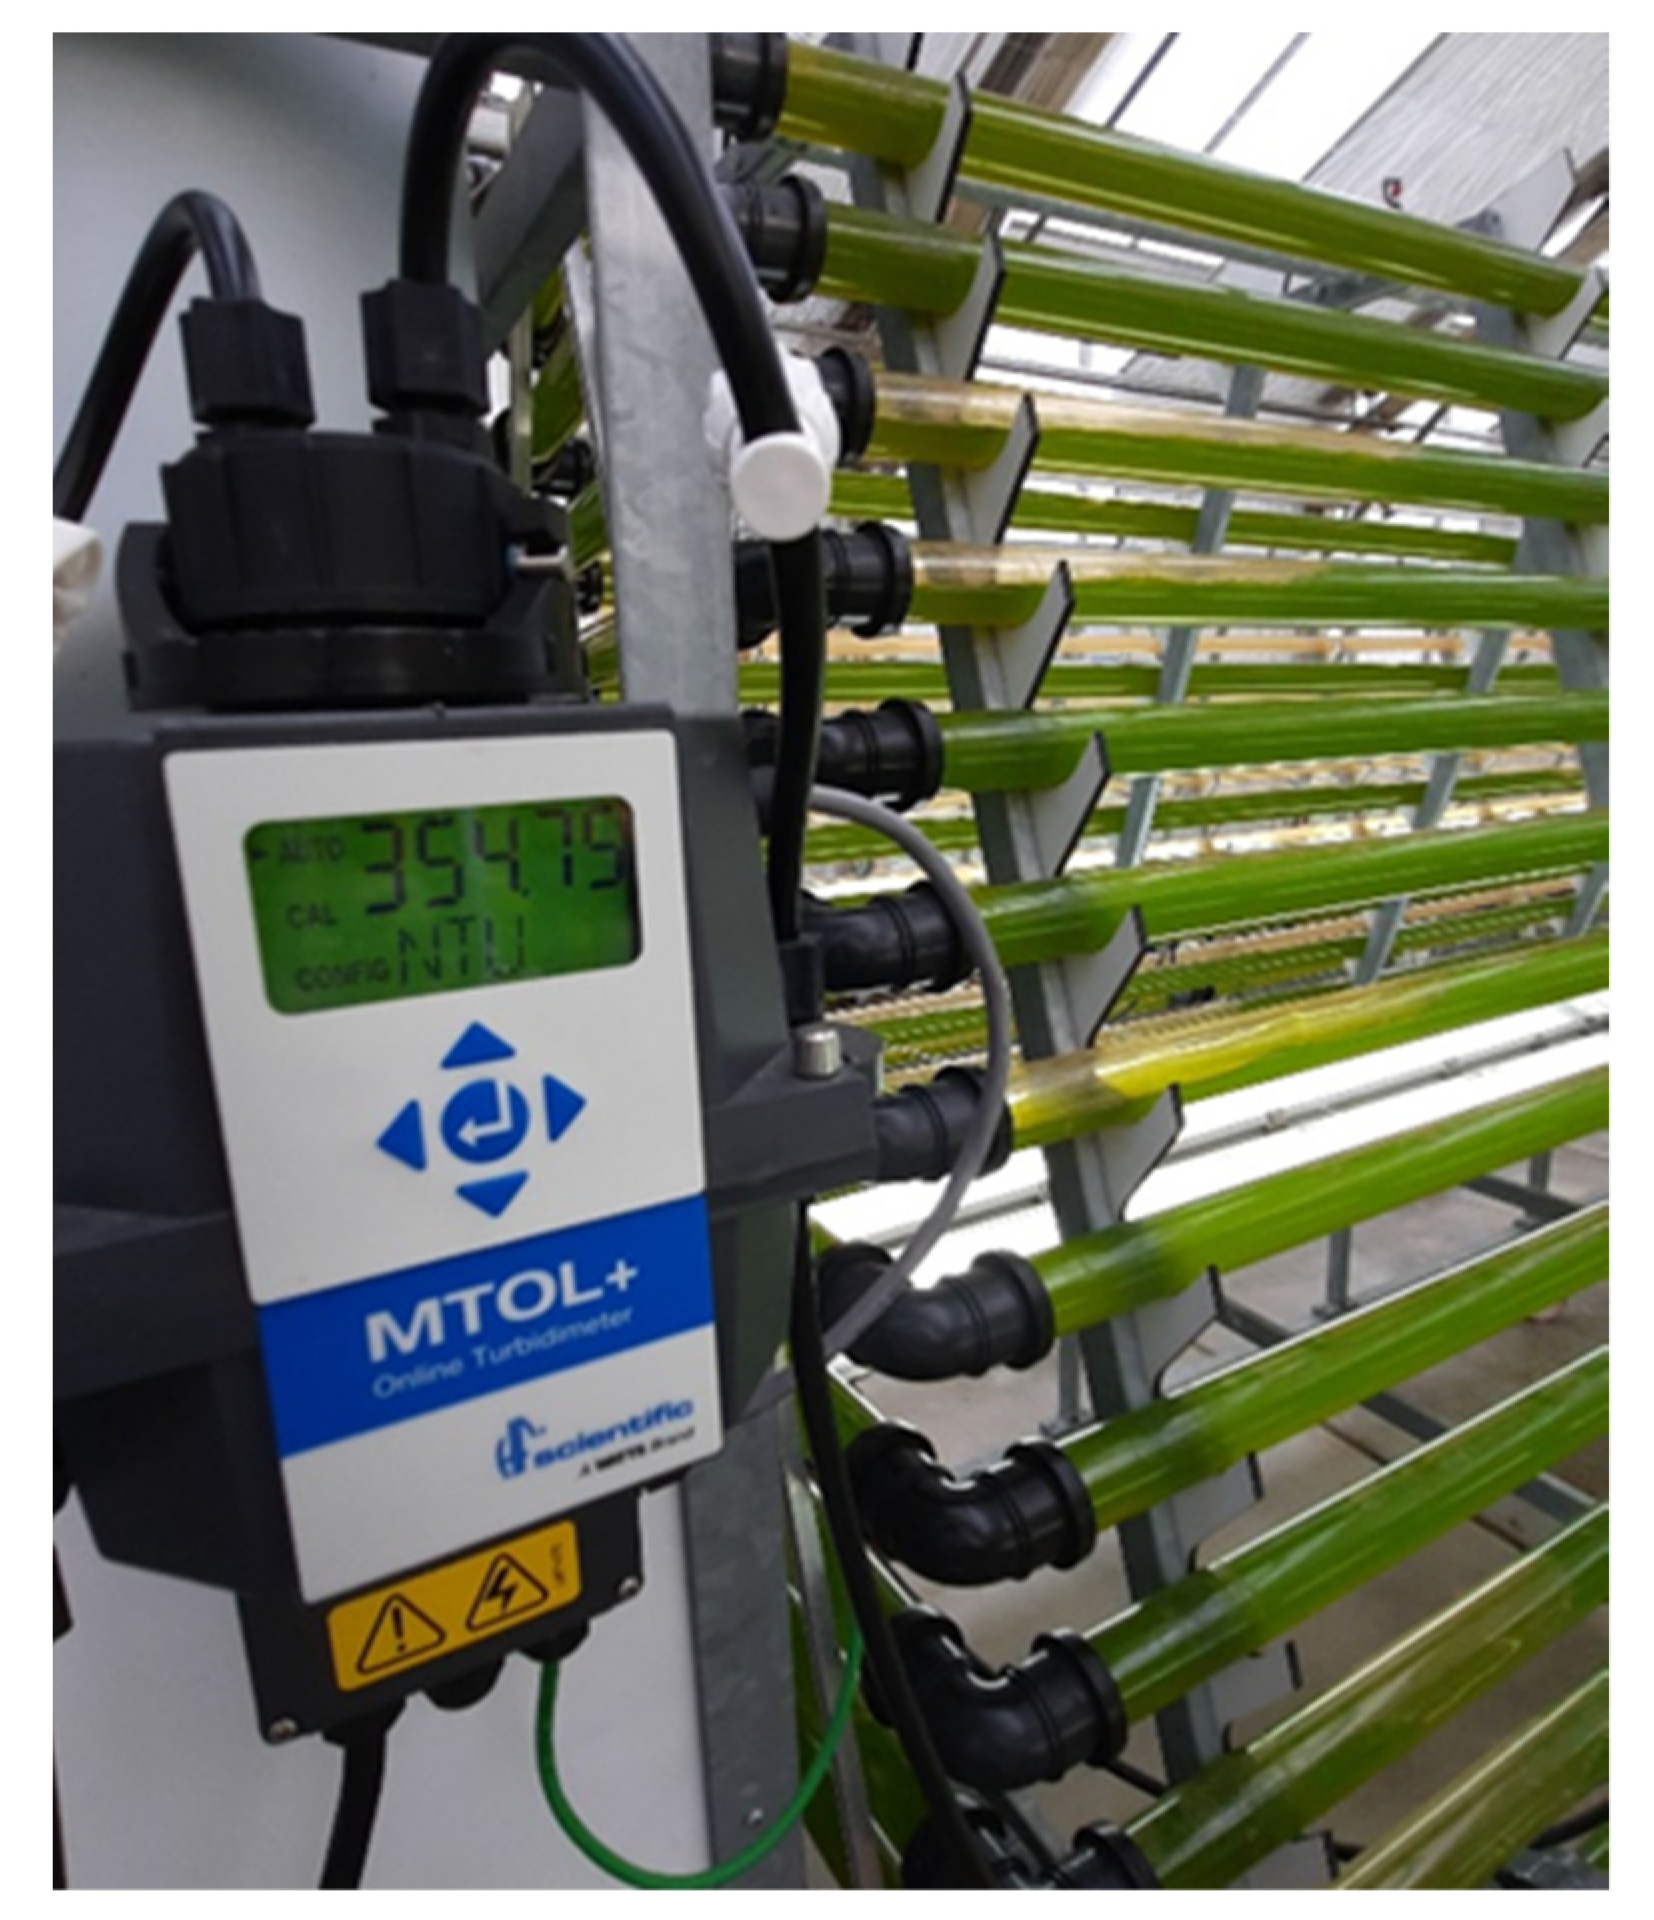
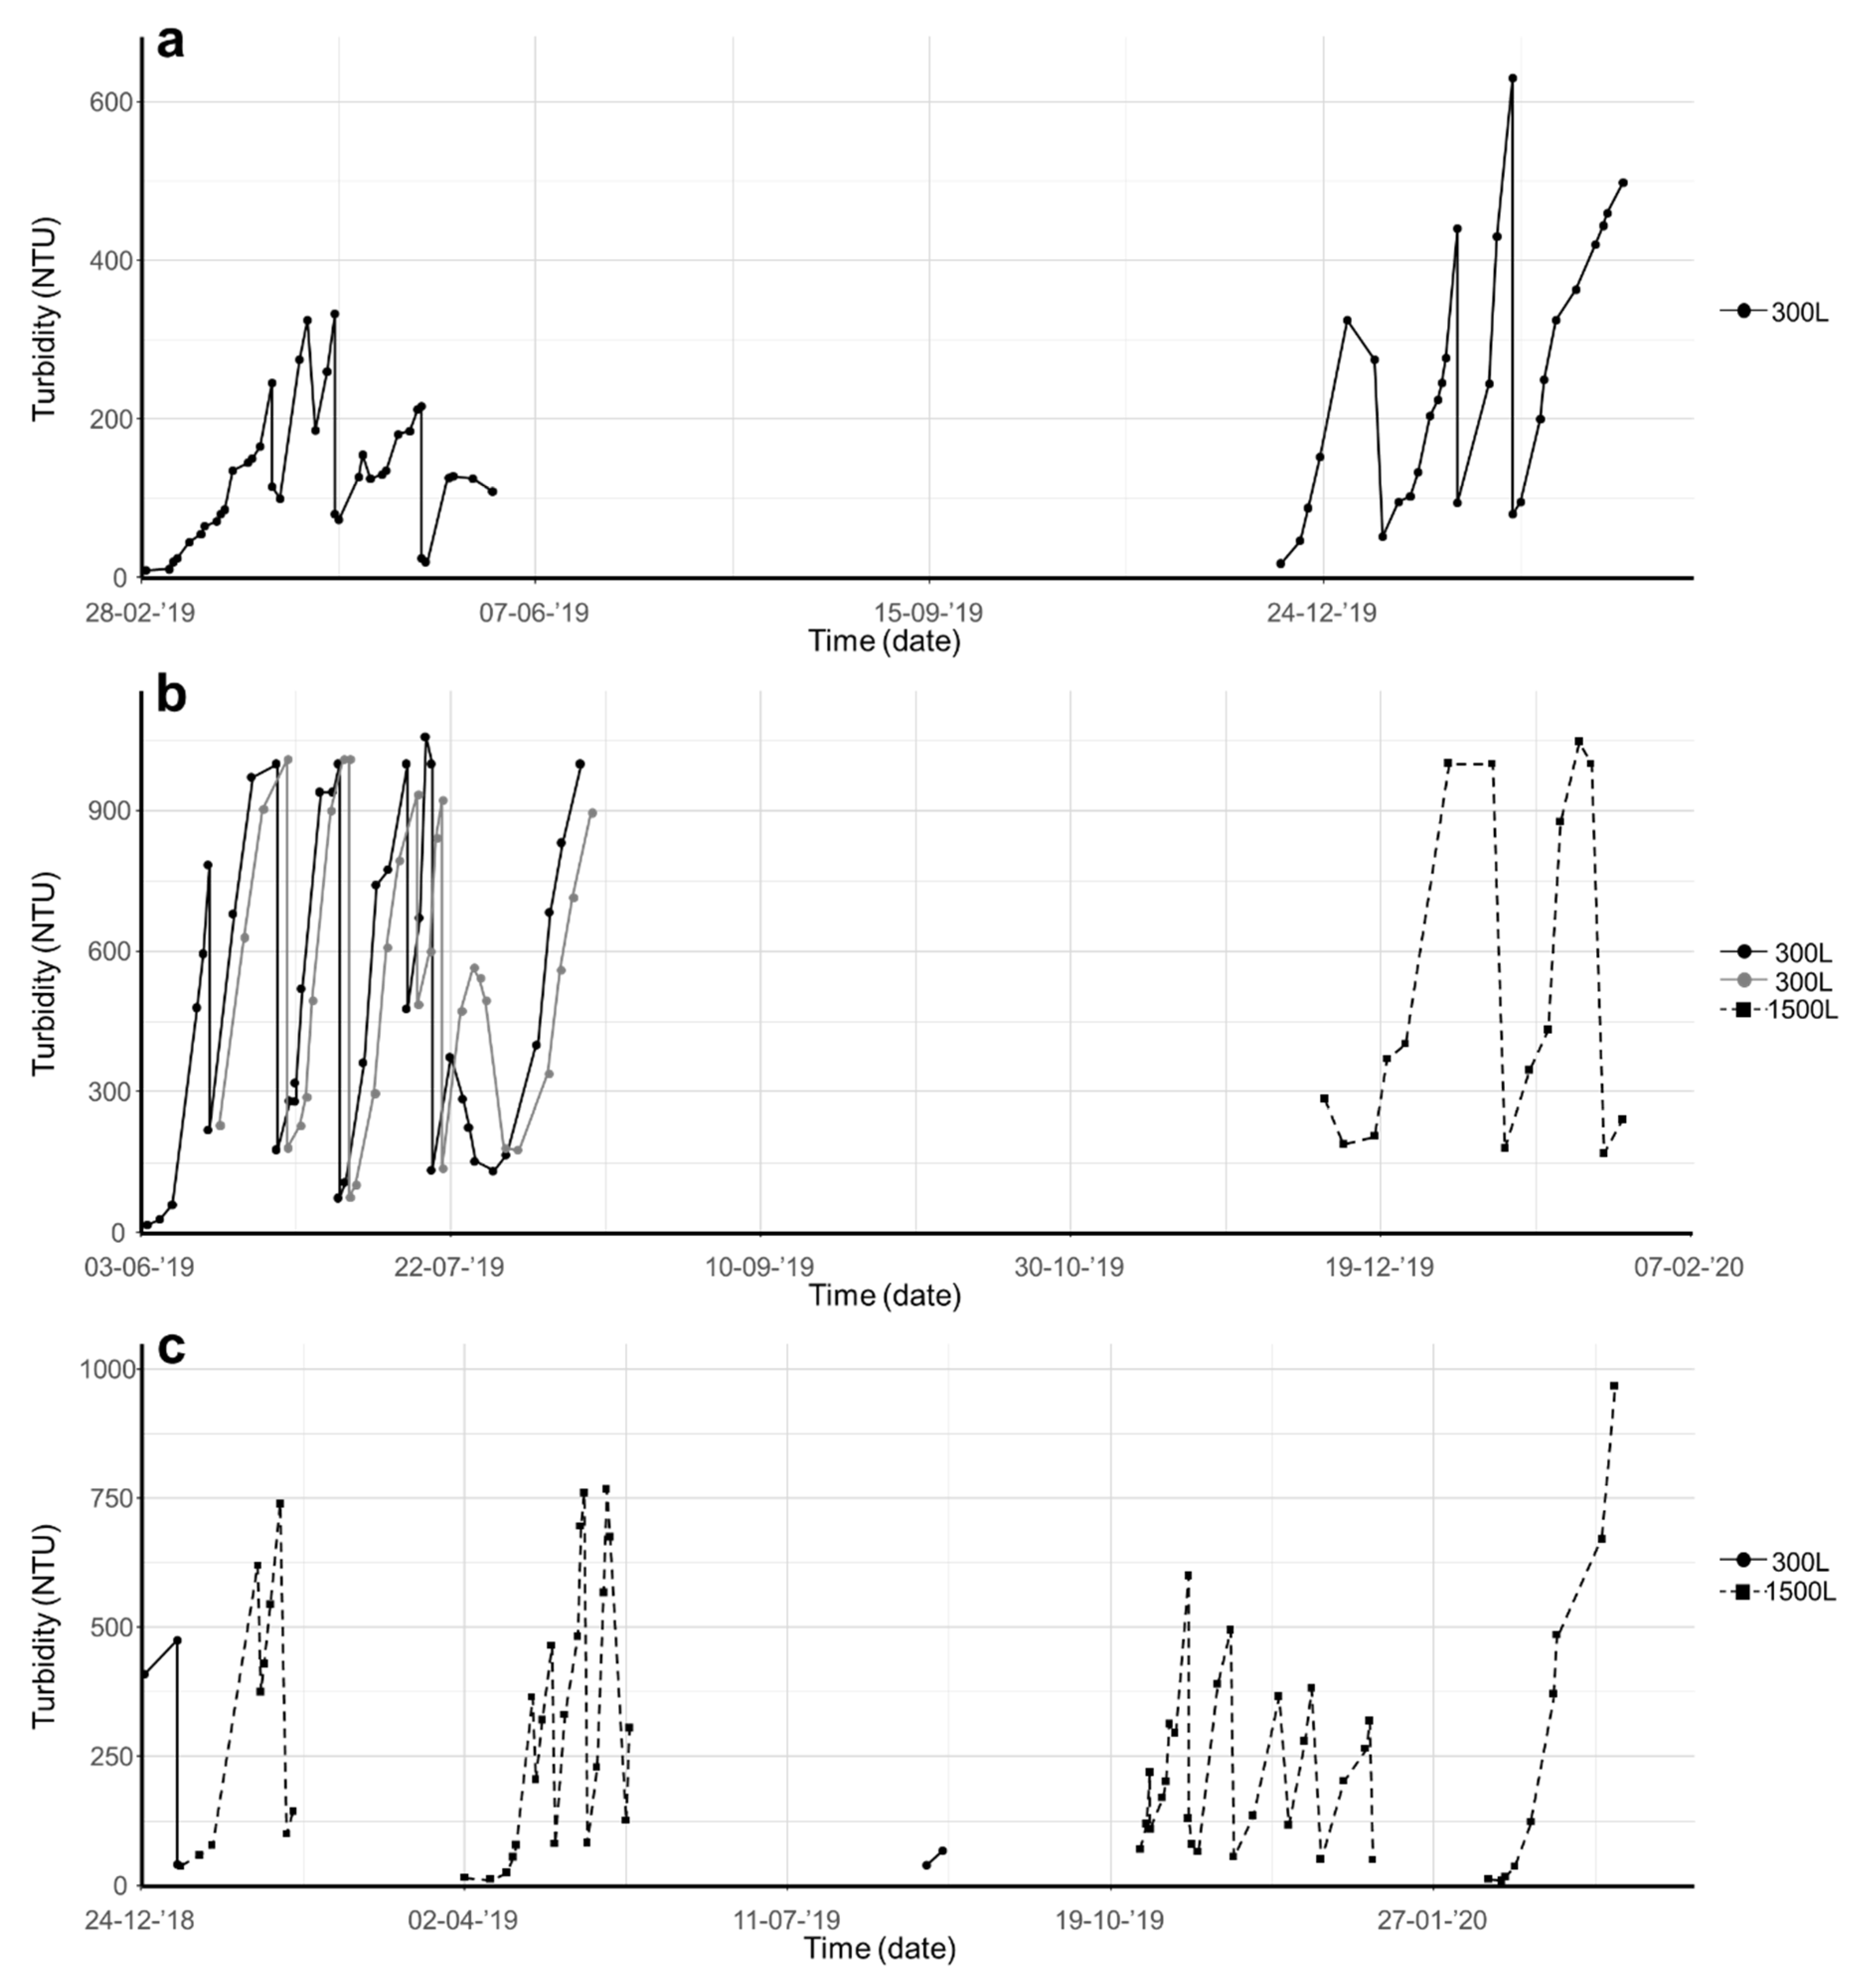
Figure 2.
Culturing of (a) Chloromonas typhlos, (b) Microchloropsis gaditana and (c) Porphyridium purpureum in photobioreactors (capacity of 300 or 1500 L). Each species was cultured several times in semicontinuous mode, and biomass density was monitored continuously online through nephelometric turbidity assessment. (NTU = nephelometric turbidity units).

Figure 3.
Relationship between nephelometric turbidity and dry weight of (a) Chloromonas typhlos, (b) Microchloropsis gaditana and (c) Porphyridium purpureum. (NTU = nephelometric turbidity units).
Figure 3.
Relationship between nephelometric turbidity and dry weight of (a) Chloromonas typhlos, (b) Microchloropsis gaditana and (c) Porphyridium purpureum. (NTU = nephelometric turbidity units).
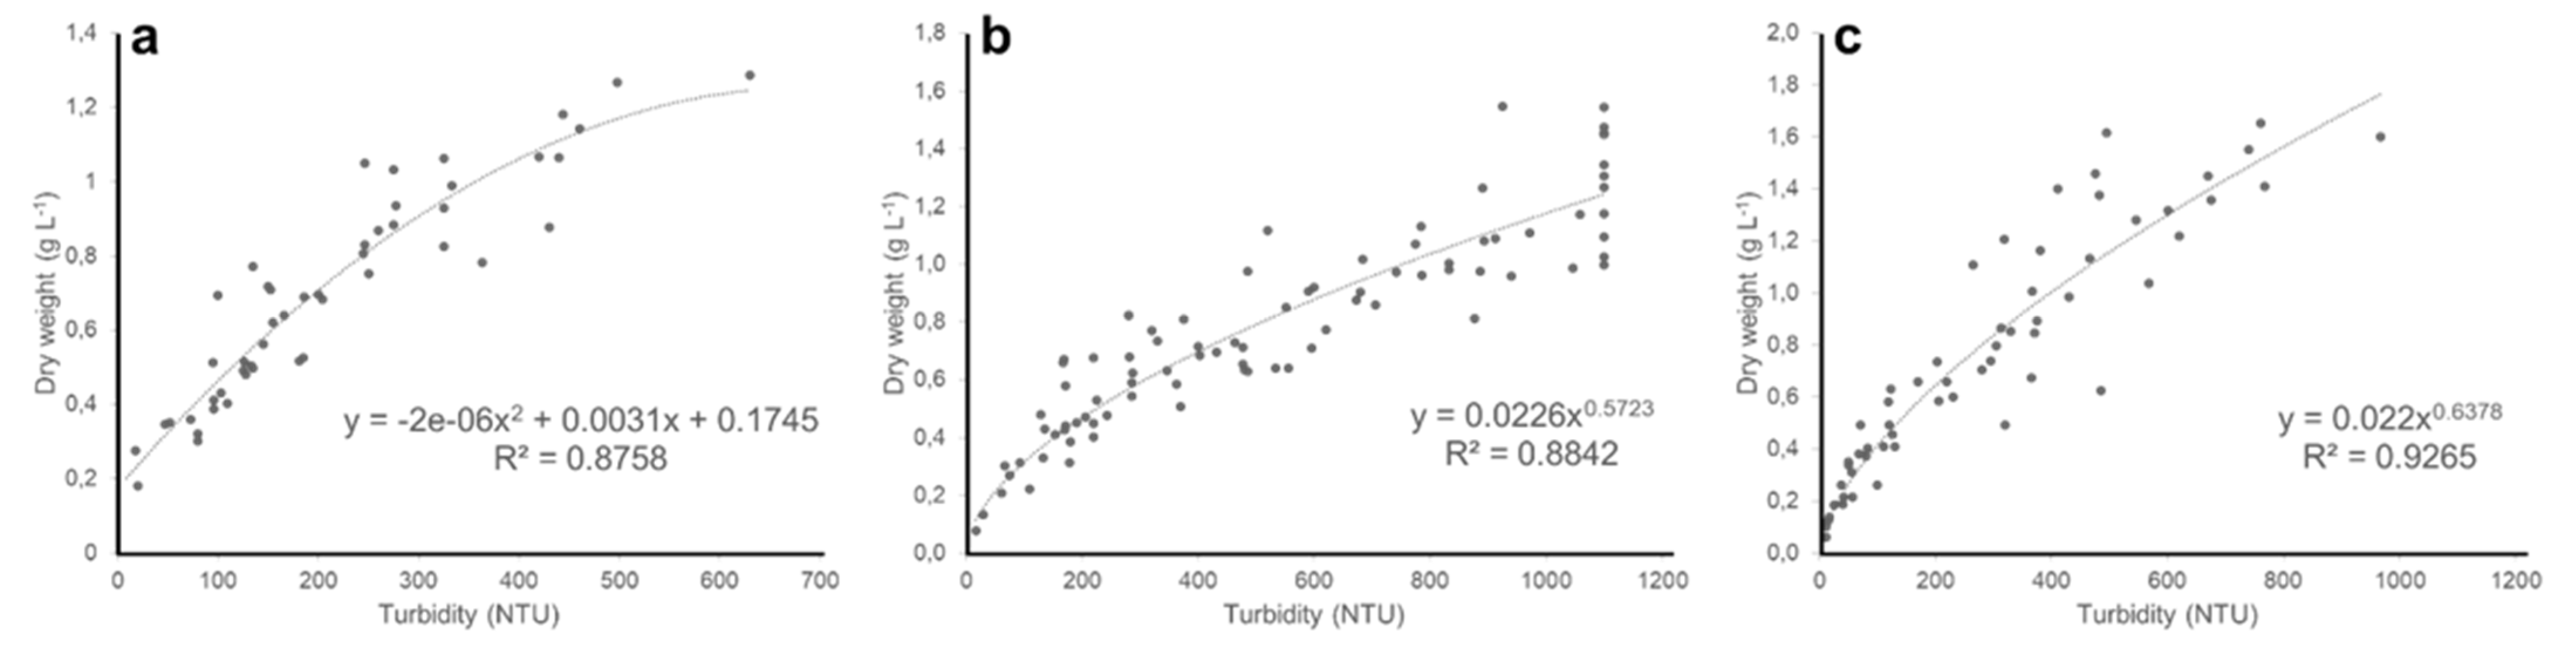
Figure 4.
Relationship between nephelometric turbidity and optical density at 720 nm of (a) Chloromonas typhlos, (b) Microchloropsis gaditana and (c) Porphyridium purpureum. (NTU = nephelometric turbidity units).
Figure 4.
Relationship between nephelometric turbidity and optical density at 720 nm of (a) Chloromonas typhlos, (b) Microchloropsis gaditana and (c) Porphyridium purpureum. (NTU = nephelometric turbidity units).
Publisher’s Note: MDPI stays neutral with regard to jurisdictional claims in published maps and institutional affiliations. |
© 2021 by the authors. Licensee MDPI, Basel, Switzerland. This article is an open access article distributed under the terms and conditions of the Creative Commons Attribution (CC BY) license (https://creativecommons.org/licenses/by/4.0/).
Share and Cite
MDPI and ACS Style
Thoré, E.S.J.; Schoeters, F.; Spit, J.; Van Miert, S. Real-Time Monitoring of Microalgal Biomass in Pilot-Scale Photobioreactors Using Nephelometry. Processes 2021, 9, 1530. https://doi.org/10.3390/pr9091530
AMA Style
Thoré ESJ, Schoeters F, Spit J, Van Miert S. Real-Time Monitoring of Microalgal Biomass in Pilot-Scale Photobioreactors Using Nephelometry. Processes. 2021; 9(9):1530. https://doi.org/10.3390/pr9091530
Chicago/Turabian StyleThoré, Eli S. J., Floris Schoeters, Jornt Spit, and Sabine Van Miert. 2021. "Real-Time Monitoring of Microalgal Biomass in Pilot-Scale Photobioreactors Using Nephelometry" Processes 9, no. 9: 1530. https://doi.org/10.3390/pr9091530
Note that from the first issue of 2016, this journal uses article numbers instead of page numbers. See further details here.