Article

Investigation of an Intensified Thermo-Chemical Experimental Set-Up for Hydrogen Production from Biomass: Gasification Process Performance—Part I

1
ENEA–Italian National Agency for New Technologies, Energy and Sustainable Economic Development, Lungotevere Thaon di Revel, 76, 00196 Rome, Italy
2
Department of Engineering Science, Marconi University, 00193 Rome, Italy
3
Department of Industrial Engineering, University of L’Aquila, Monteluco di Roio, 67100 L’Aquila, Italy
4
Pall GmbH, Zur Flügelau 70, D-74564 Crailsheim, Germany
*
Authors to whom correspondence should be addressed.
Processes 2021, 9(7), 1104; https://doi.org/10.3390/pr9071104
Submission received: 25 February 2021 / Revised: 11 June 2021 / Accepted: 21 June 2021 / Published: 25 June 2021
(This article belongs to the Special Issue Methane Reforming Processes)

Abstract

:
Biomass gasification for energy purposes has several advantages, such as the mitigation of global warming and national energy independency. In the present work, the data from an innovative and intensified steam/oxygen biomass gasification process, integrating a gas filtration step directly inside the reactor, are presented. The produced gas at the outlet of the 1 MWth gasification pilot plant was analysed in terms of its main gaseous products (hydrogen, carbon monoxide, carbon dioxide, and methane) and contaminants. Experimental test sets were carried out at 0.25–0.28 Equivalence Ratio (ER), 0.4–0.5 Steam/Biomass (S/B), and 780–850 °C gasification temperature. Almond shells were selected as biomass feedstock and supplied to the reactor at approximately 120 and 150 kgdry/h. Based on the collected data, the in-vessel filtration system showed a dust removal efficiency higher than 99%-wt. A gas yield of 1.2 Nm3dry/kgdaf and a producer gas with a dry composition of 27–33%v H2, 23–29%v CO, 31–36%v CO2, 9–11%v CH4, and light hydrocarbons lower than 1%v were also observed. Correspondingly, a Low Heating Value (LHV) of 10.3–10.9 MJ/Nm3dry and a cold gas efficiency (CGE) up to 75% were estimated. Overall, the collected data allowed for the assessment of the preliminary performances of the intensified gasification process and provided the data to validate a simulative model developed through Aspen Plus software.

1. Introduction

With the Green Deal initiative, launched in December 2019, the European Commission intend to meet very ambitious goals in the field of energy and the environment (i.e., the achievement of climate neutrality by 2050 and economic growth decoupled from resource use) [1,2].
In accordance with the relevant timeline, and through the subsequent specific programmes “Biodiversity Strategy by 2030” and “Strategies for Energy System Integration”, the Commission recognized sustainable bio-energy as an important tool to combat climate change, identifying it as a priority along with wind and solar energy. Biomass has also been acknowledged as an enabler of carbon capture, storage, and use that can contribute to the achievement of the no-net emissions of greenhouse gases (GHG) target.
Being produced from CO2 present in the atmosphere through the process of photosynthesis, biomass is by its intrinsic nature a GHG-neutral fuel. Therefore, its use for energy purposes (i.e., the production of bioenergy), if carried out in a sustainable way, is well consistent with the EU targets foreseen by 2050 [3,4]. The advantages, as well as the opportunity, of using biomass for energy production has also been considered by the international science community and the United Nation’s Intergovernmental Panel on Climate Change (IPCC), which has recognized the value of sustainable forestry in addressing climate change and of biomass as a renewable fuel. Thus, each IPCC scenario towards the achievement of the climate-neutrality by 2050 includes biomass [5].
Biomass is the fourth most abundant source of energy in the whole world after oil, coal, and natural gas. For this reason, biomass is a very attractive solution to replace fossil fuel [6,7,8]. As is well known, the progressive abandonment of fossil fuels has several advantages (e.g., the mitigation of global warming and climate change issues and the improvement of national energy security and independency). Since the use of biomass is a carbon-neutral process, it is important to fully investigate the potential for its use in replacing fossil sources and the benefits that its use can bring with respect to the problems of global warming and energy supply in each country or geographical area.
It is possible to convert biomass through different processes in order to develop reliable, efficient, and low-cost renewable energy power plants. For this purpose, one of the most effective processes is gasification (i.e., a thermo-chemical technology that allows the conversion of biomass into a gaseous energy carrier). Gasification can be implemented following different approaches and using reactors of different designs. The most widely used gasifiers are the fixed bed and the fluidized bed. Fixed bed gasifiers are commonly used in small size plants, and are characterized by simple construction and operation, but they have very low flexibility to heterogeneous raw materials [9,10]. Many authors have demonstrated that fluidized bed gasifiers can be scaled at larger size plants and have a great mixing and gas-solid contact. Such features ensure high reaction rates and conversion efficiencies and make these kind of reactors the most promising type of gasifiers [11,12,13]. Biomass-gasification occurs at high temperature (800–1000 °C) with the mixing of a gasifying agent (air, oxygen and/or steam) and transforms biomass into a combustible gas mixture by partial oxidation. The gas obtained by the gasification process is commonly called producer gas or syngas. This gas is prevalently composed by hydrogen, carbon monoxide, carbon dioxide, methane, and steam, along with several contaminants. Depending on the specific source of oxygen used (e.g., air, enriched air), some nitrogen can also be present in the producer gas. Being an inert gas, its presence has an effect on the quality of the produced gas in terms of heating values (i.e., LHV and HHV) and, hence, on the possible use to which it can be addressed. Producer gas from steam and/or oxygen gasification (that is, N2-free and, in turn medium heating value gas (e.g., 10–20 MJ/Nm3)) are suitable for conversion in high value products such as synthetic fuels for the transport sector (e.g., road, aviation and maritime) and chemicals. On the other hand, when air is used, the presence of N2 dilutes the produced gas significantly, resulting in a gas of low calorific value (~5 MJ/Nm3) that typically finds application for power generation through ICE [14,15,16].
Besides the gasifying medium, the ultimate composition of the syngas is affected by various other factors such as operating temperature and pressure, gasifier design (including heating mode (e.g., direct or indirect)), the addition of catalysts and/or sorbents, and the feedstock composition used as fuel [17,18,19,20,21,22]. By purifying the syngas, it is possible to obtain pure hydrogen, which is a promising energy vector. In fact, and differently from electricity, hydrogen can respond to all of the energy needs and can be used in different technologies such as the production of methanol and ammonia, in conventional internal combustion engines, or in fuel cells for more effective exploitation. Moreover, hydrogen is “clean” and, through gasification, distributed production from local resources could be achieved.
The first way to obtain more hydrogen in the syngas composition is to use steam and oxygen as gasifying agents. Such a gasification medium in fact allows one to achieve gas with potentially zero N2, and a higher amount of H2 [23]. Then, before sending the syngas to external gas cleaning and conditioning units, it is possible to increase its purification directly inside the gasifier through catalytic cracking and steam reforming of low and high molecular weight hydrocarbons. This approach allows one to gain several advantages simultaneously (i.e., higher hydrogen concentration, thermal integrations with the gasification process, high tar and light hydrocarbons conversion), with overall process intensification. [24,25].
The good results in obtaining a cleaner gas fuel out of an intensified gasifier have been confirmed at a significant scale with the UNIQUE concept [26]. Such an approach combines the advantages of a process of steam/oxygen gasification with the integration to a hot gas cleaning process into a single and compact fluidized-bed gasifier.
The activities presented in this paper are part of a more extensive programme of experimental work aimed at producing H2 from biomass through gasification. To achieve such a goal, a gasification plant characterized by some innovative items was coupled to an integrated portable unit, referred to as a portable purification station (PPS). This unit was equipped for gas conditioning and for H2 separation and production at a fuel cell vehicle grade (i.e., grade 4, 99.99%-v of H2). For proper discussion of the achieved results, the authors in the present work report only the gasification part (i.e., innovative gasification housing the gas filtration directly in the reactor, quoting gas compositions, contaminants, LHVs, yields, and cold gas efficiencies). Results concerning the second part, also involving the operation of the PPS, with the achievement of 99.99%-v of H2 will be in a second paper which is currently under preparation.
Moreover, in the present part, the experimental results gained at the integrated gasification system are used as input to validate a process simulation model developed via the commercial software Aspen Plus.

2. Materials and Methods

2.1. Experimental Set-Up

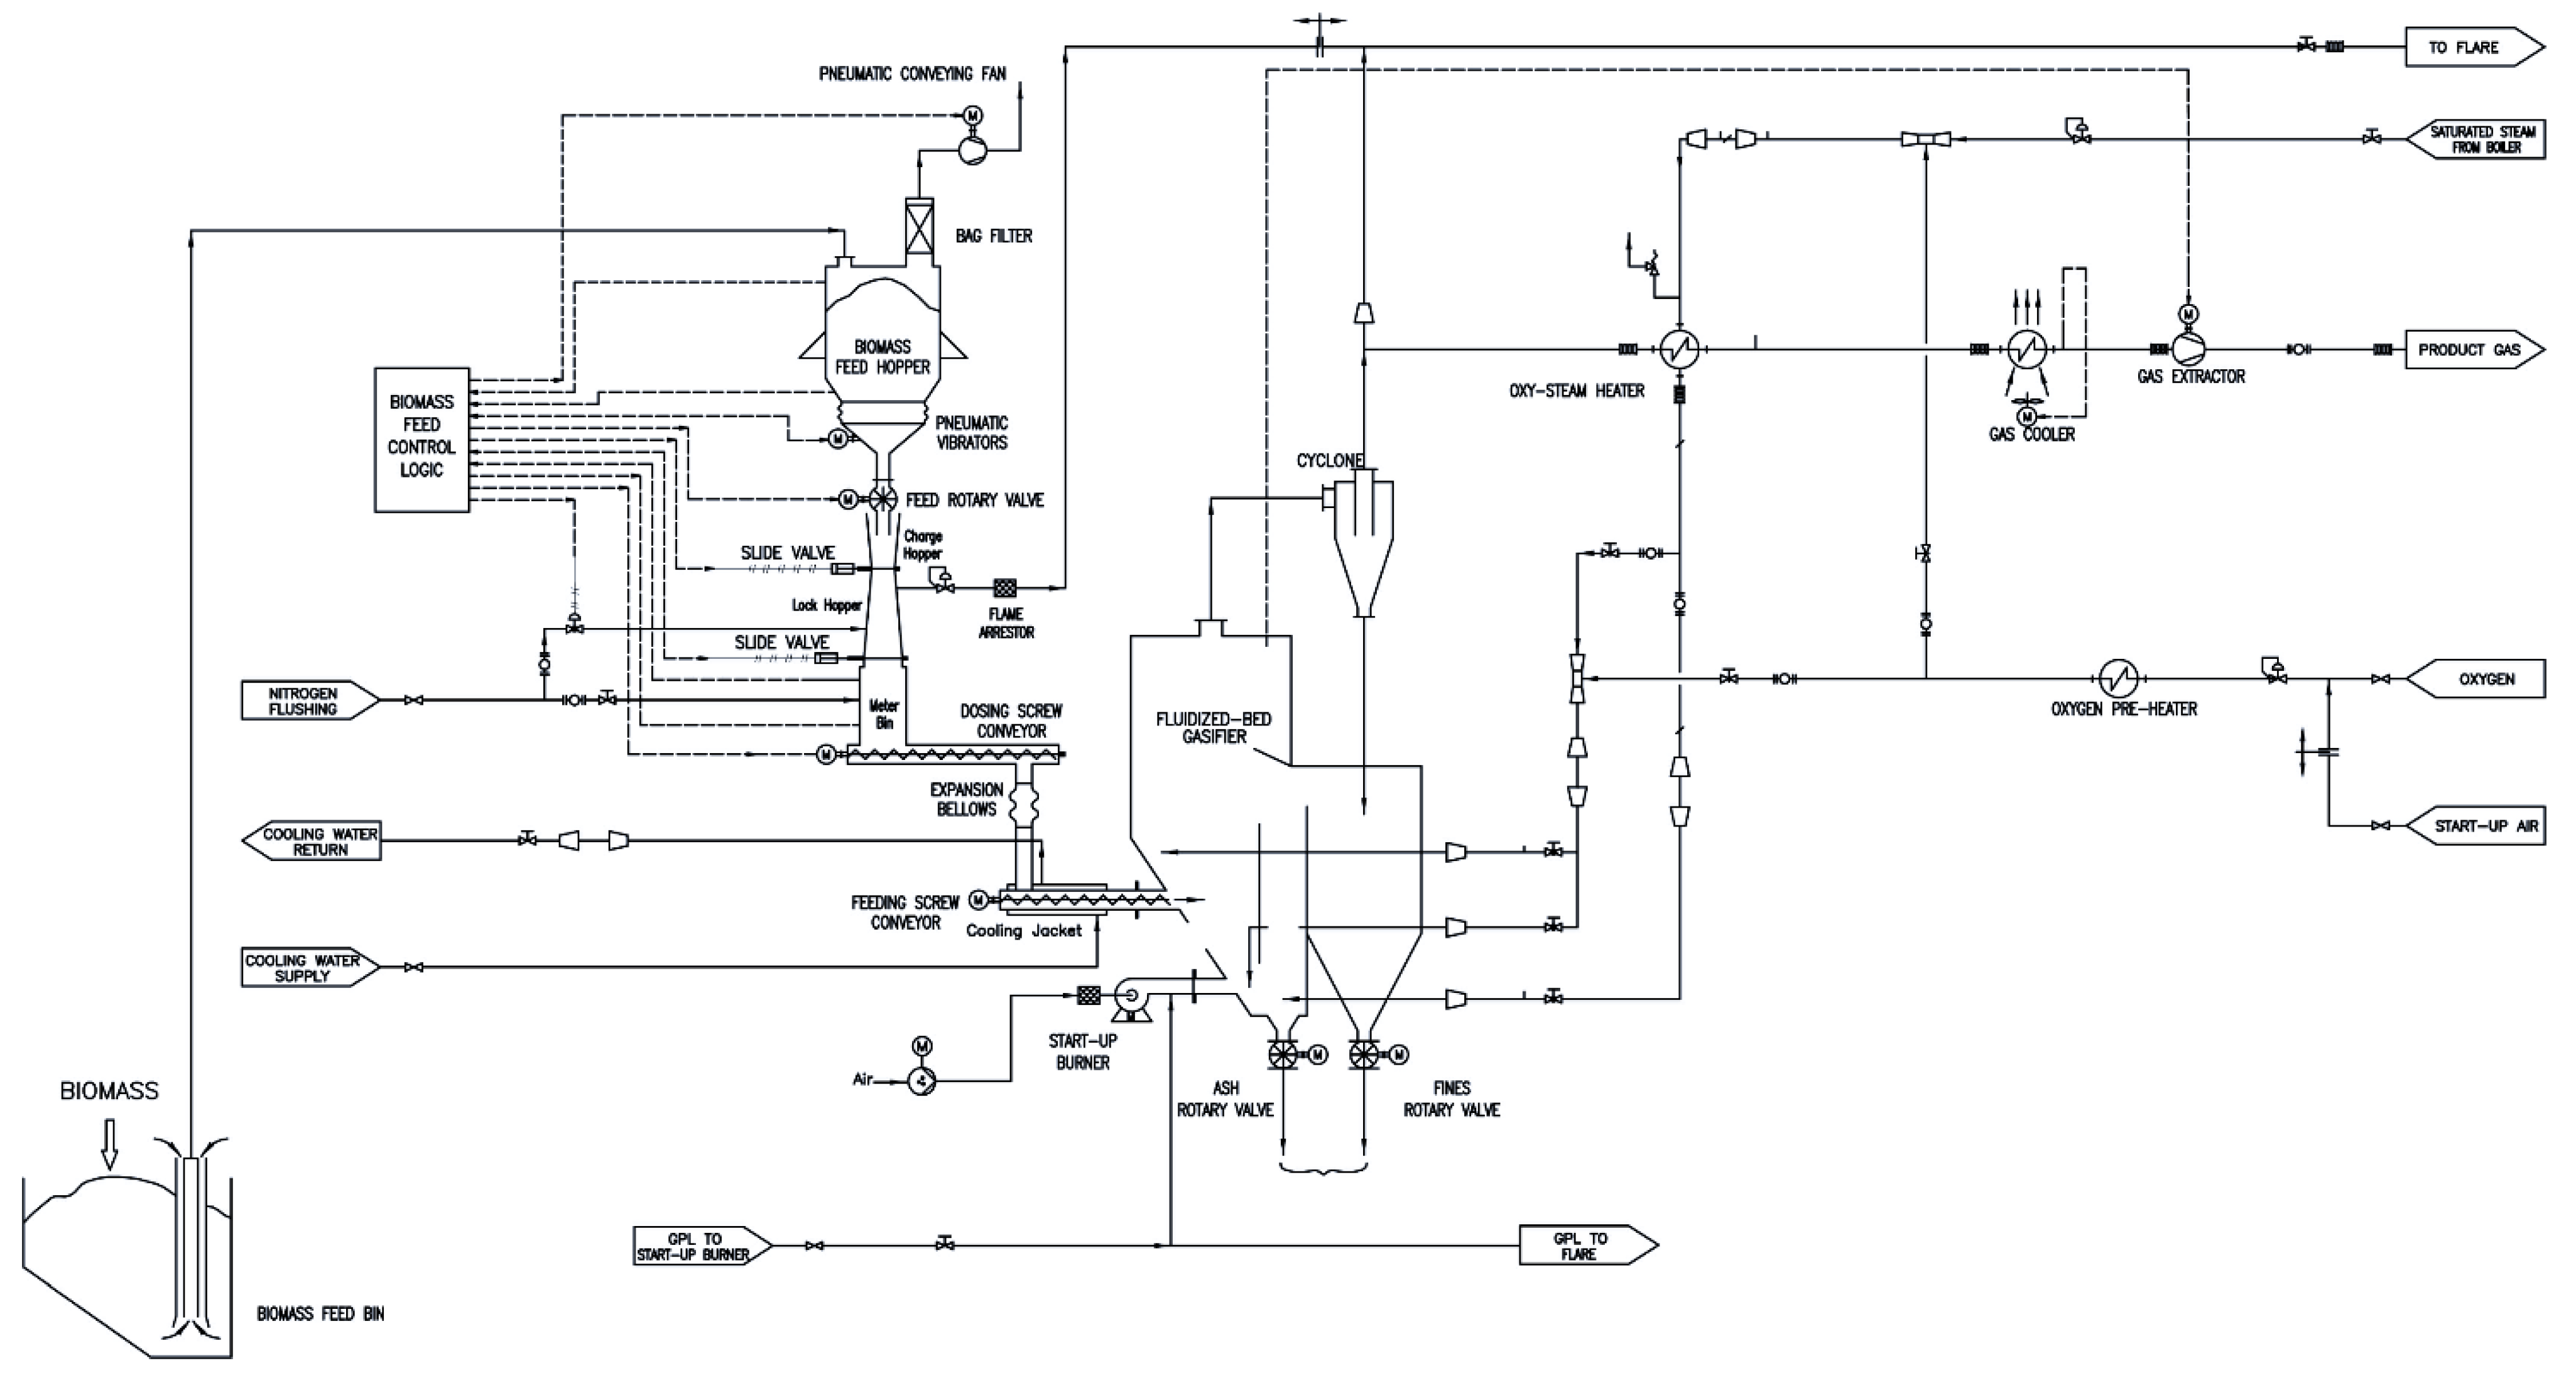
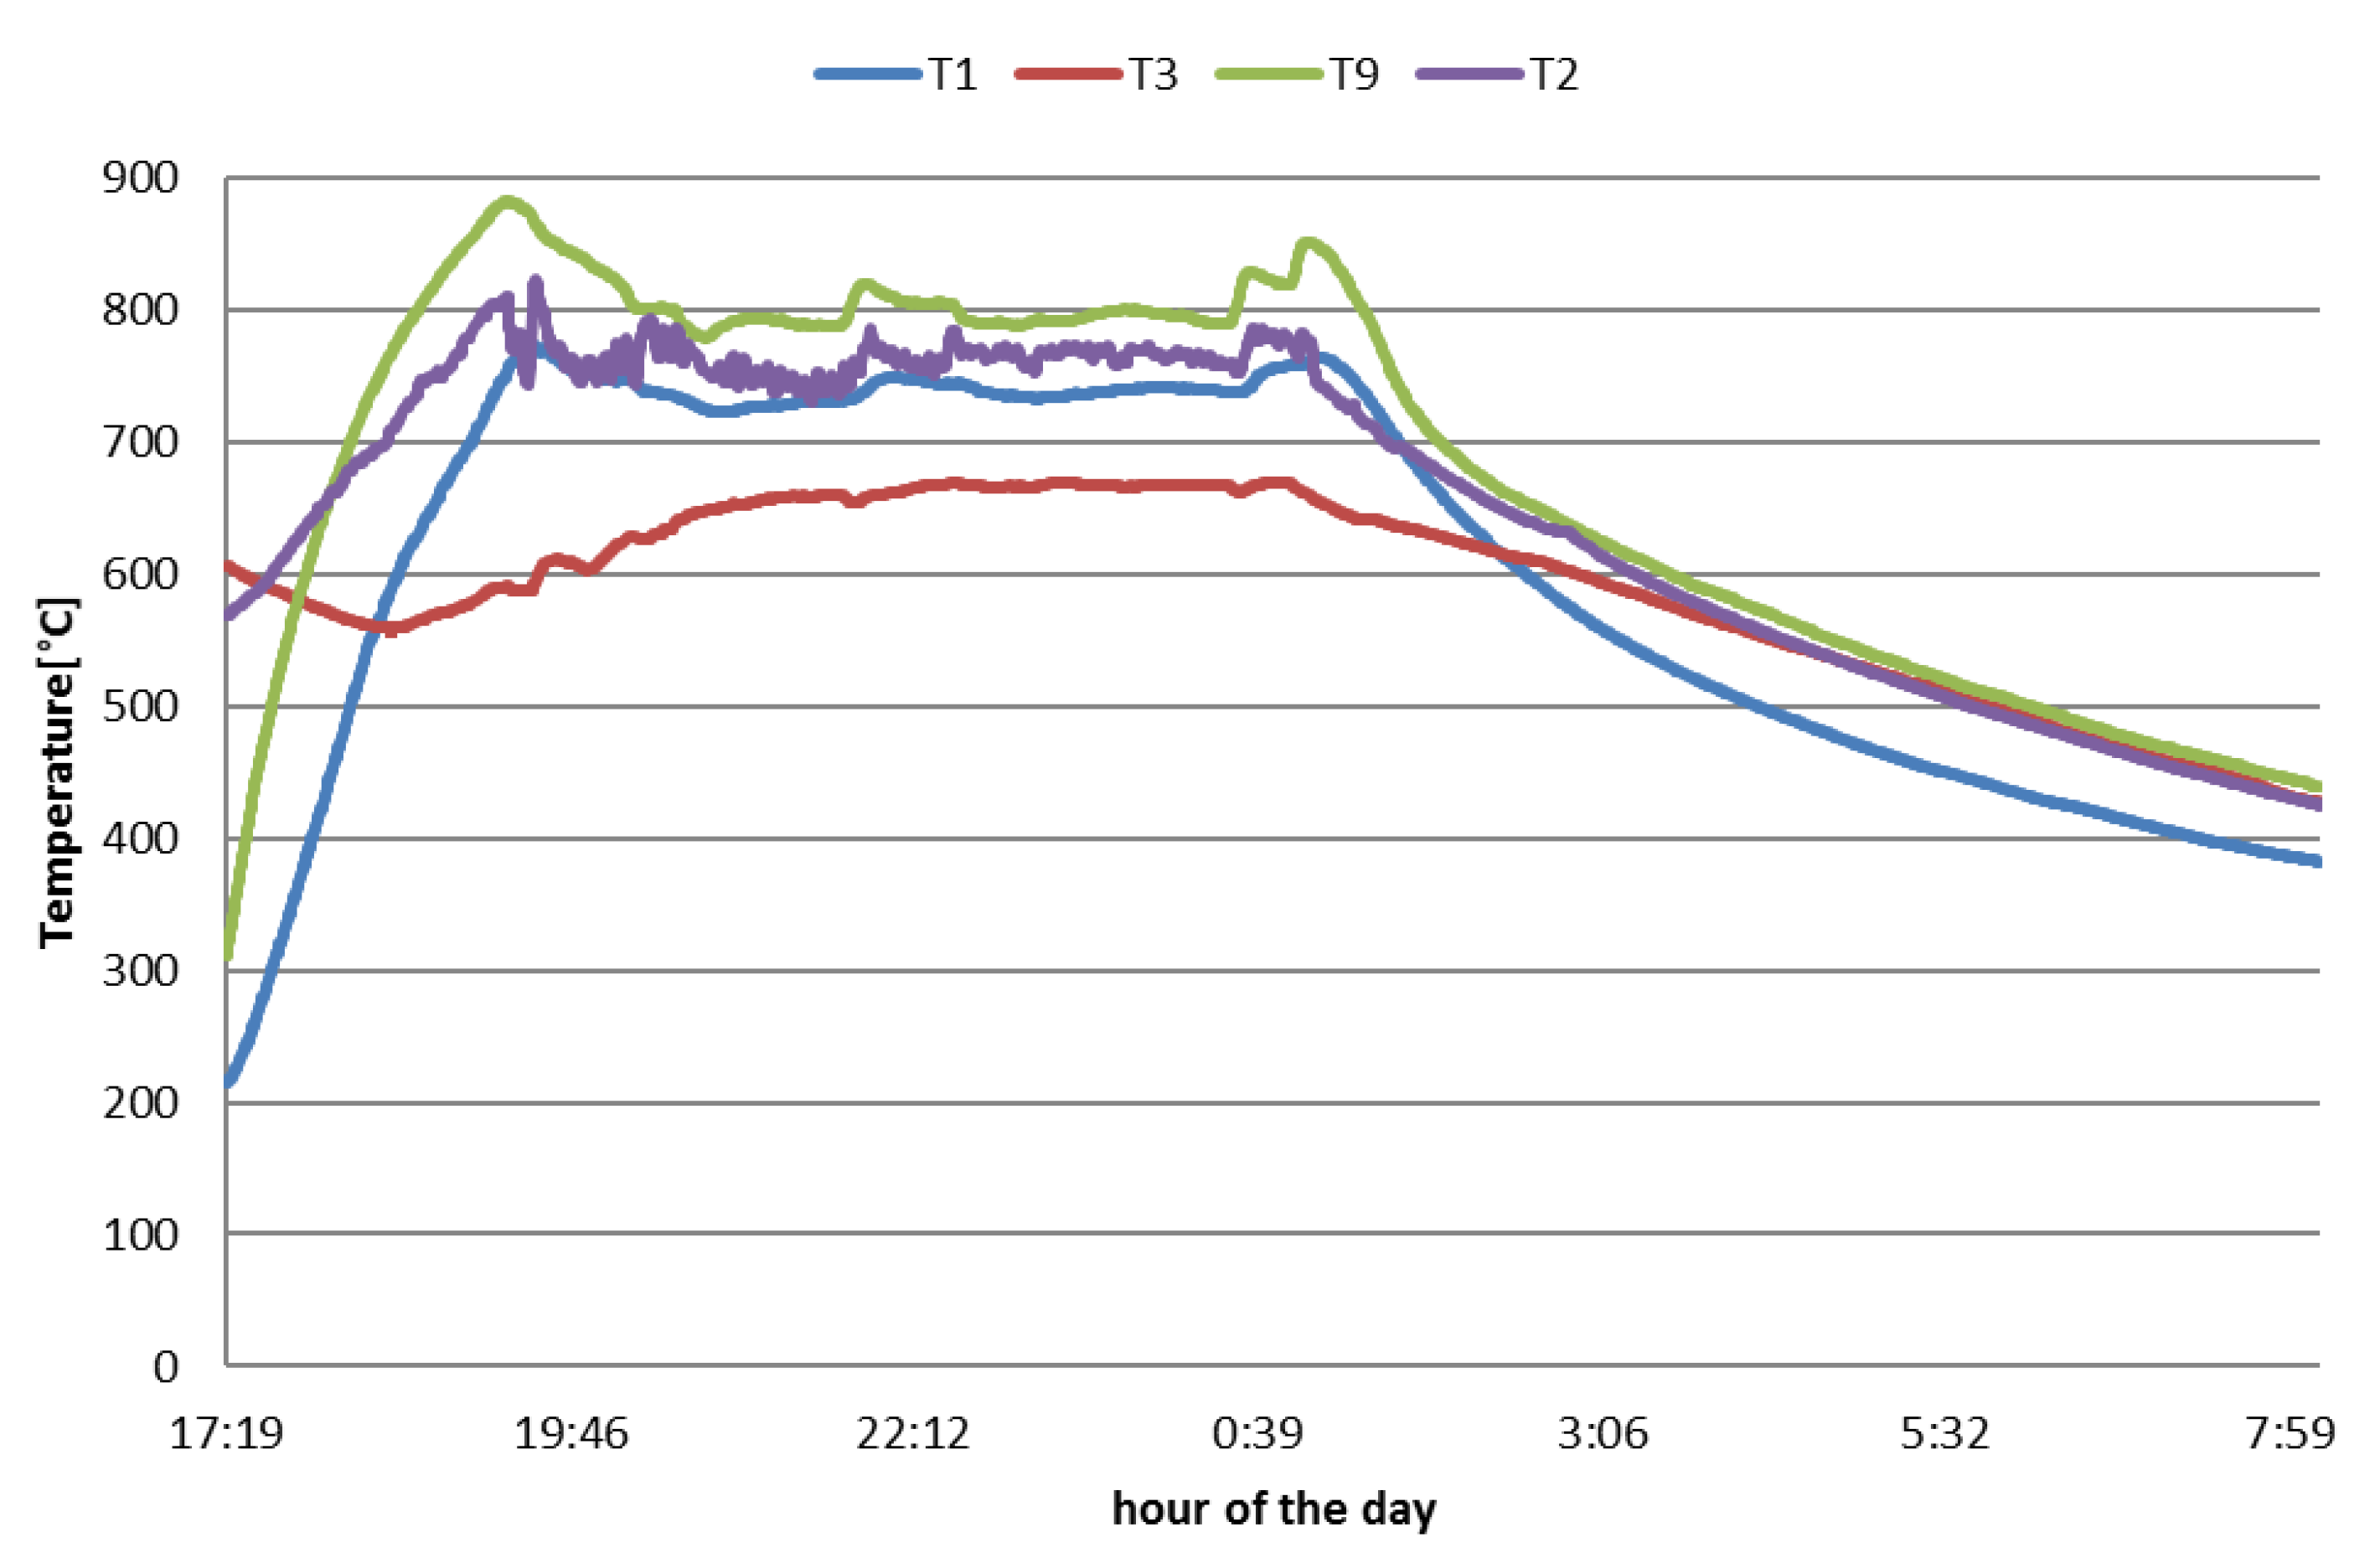
The pilot plant has been built at the ENEA Trisaia Research Centre, in the south of Italy. It is based on an auto-thermal bubbling fluidized bed reactor of 1000 kW nominal thermal input, operating at atmospheric pressure. The plant is equipped for continuous monitoring of the main operative parameters such as flow rates, pressure, and temperature, as well as with sampling points for online and offline gas analysis.
The main characteristic of this plant is the integration of a system for high temperature (HT) gas filtration based on ceramic candles housed directly inside the freeboard of the gasification reactor. The HT filtration elements, made with Al2O3 based ceramic foams, were provided by Pall Filtersystems GmbH and tailored for the specific application. The efficiency of the filtration system is maintained through a system of back pulsing operating with N2. In the course of gasification, based on the pressure drop between the gas inside the reactor and at the exit of the candles, short cycles of N2 pulsing removes the dust cake growing on the candle walls.
The reactor with in-vessel gas filtration was designed with the purpose of achieving both technical and economic advantages. Such a configuration can in fact give important benefits to the quality of the producer gas in terms of a very low particulate content and the possibility for a more effective use of the sensible heat, with a consequent improvement of the overall energy efficiency of the process.
For a higher process intensification, the gasifying agent of reference is oxygen mixed with steam in order to obtain a gas free of N2, the inert component which is instead present in large amount in the case of air gasification. However, to gain a larger flexibility in process performance assessments and the application of the producer gas, the pilot plant has been designed to also operate with enriched air.
The test sets focused in this work were carried out at 0.25–0.28 ER, 0.4–0.5 S/B, and 780–850 °C gasification temperature. As explained in the introduction section, UNIQUE concept pointed out a new gas cleaning technology for gas treatment within the gasifier. The way to demonstrate the efficacy of this approach is to analyse the product gas at the outlet of the gasification reactor. Almond shells were used as biomass (a summary of the their main physical and chemical characteristics is reported in Table 1 [27]) and supplied to the reactor at feeding rates up to 150 kgdry/h. An unmodified olivine, commercially known as Magnolithe GmbH [28], was used for the fluidized-bed inventory. The recall of the main characteristics of the bed material are reported in Table 2.

2.2. Gasification Pilot Plant and Gasifier with Integrated Gas Filtration

The in-vessel gas filtration system was implemented to a bubbling fluidized bed reactor, part of a pre-existing gasification plant designed for continuous operation. In this plant, the biomass is fed in “in-bed” mode in order to have a better mixing of bed material and supplied fuel, while the gasifying agents (steam and oxygen/enriched air) are fed from the bottom of the reactor to ensure proper bed fluidization. Drawings of the pre-existing plant and of the gasification reactor in the upgraded configuration are presented in Figure 1 and Figure 2, respectively. The details of the plant have been described in a previous work [27].
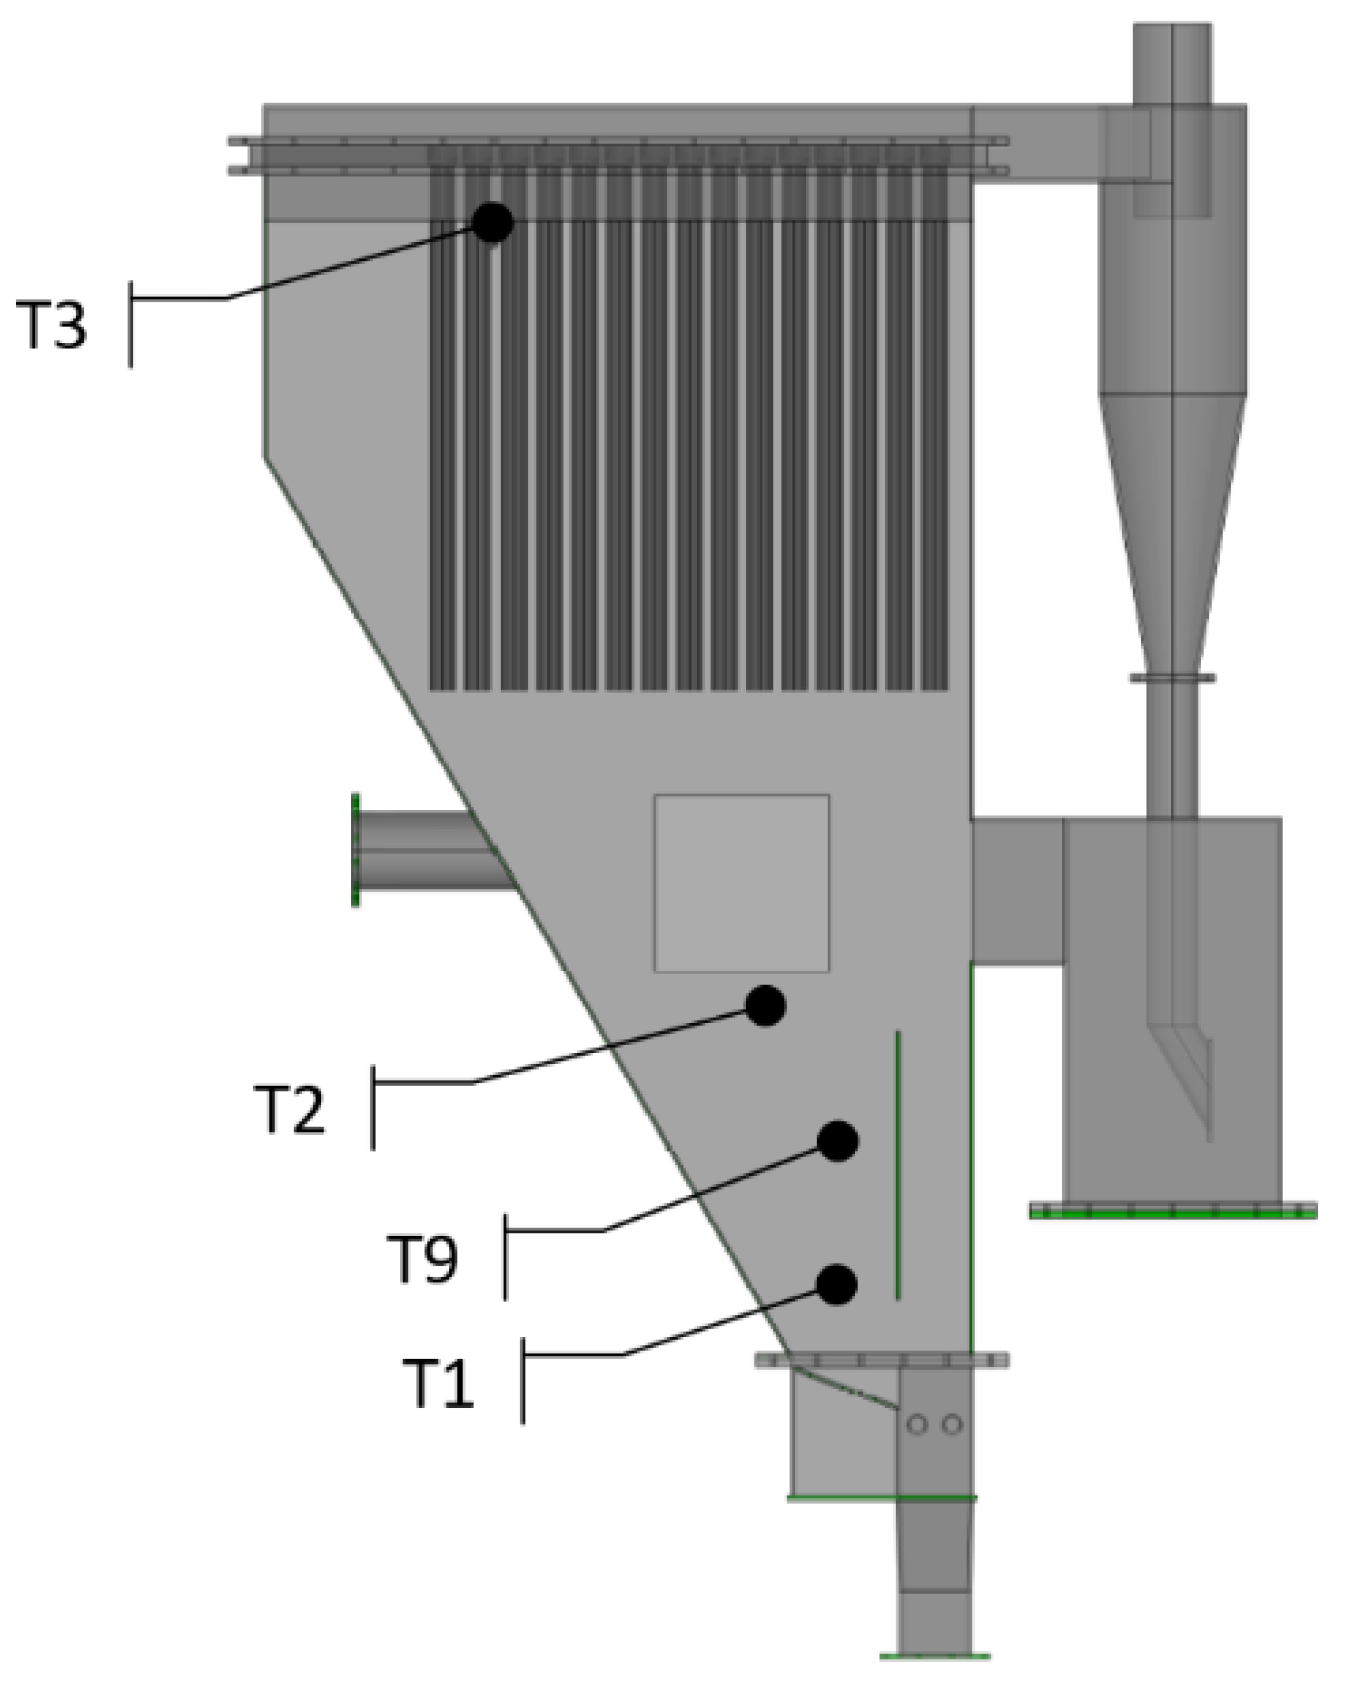
The HT filtration system consisted of sixty ceramic candles arranged in five clusters of twelve elements each. To monitor the temperature along the gasifier, several thermocouples were installed in the most relevant internal areas, as indicated in Figure 2. Specifically, two thermocouples were located inside the bed inventory, one in the freeboard in contact to the fluidized bed material and another one in the upper part of the gasifier near the ceramic candles.
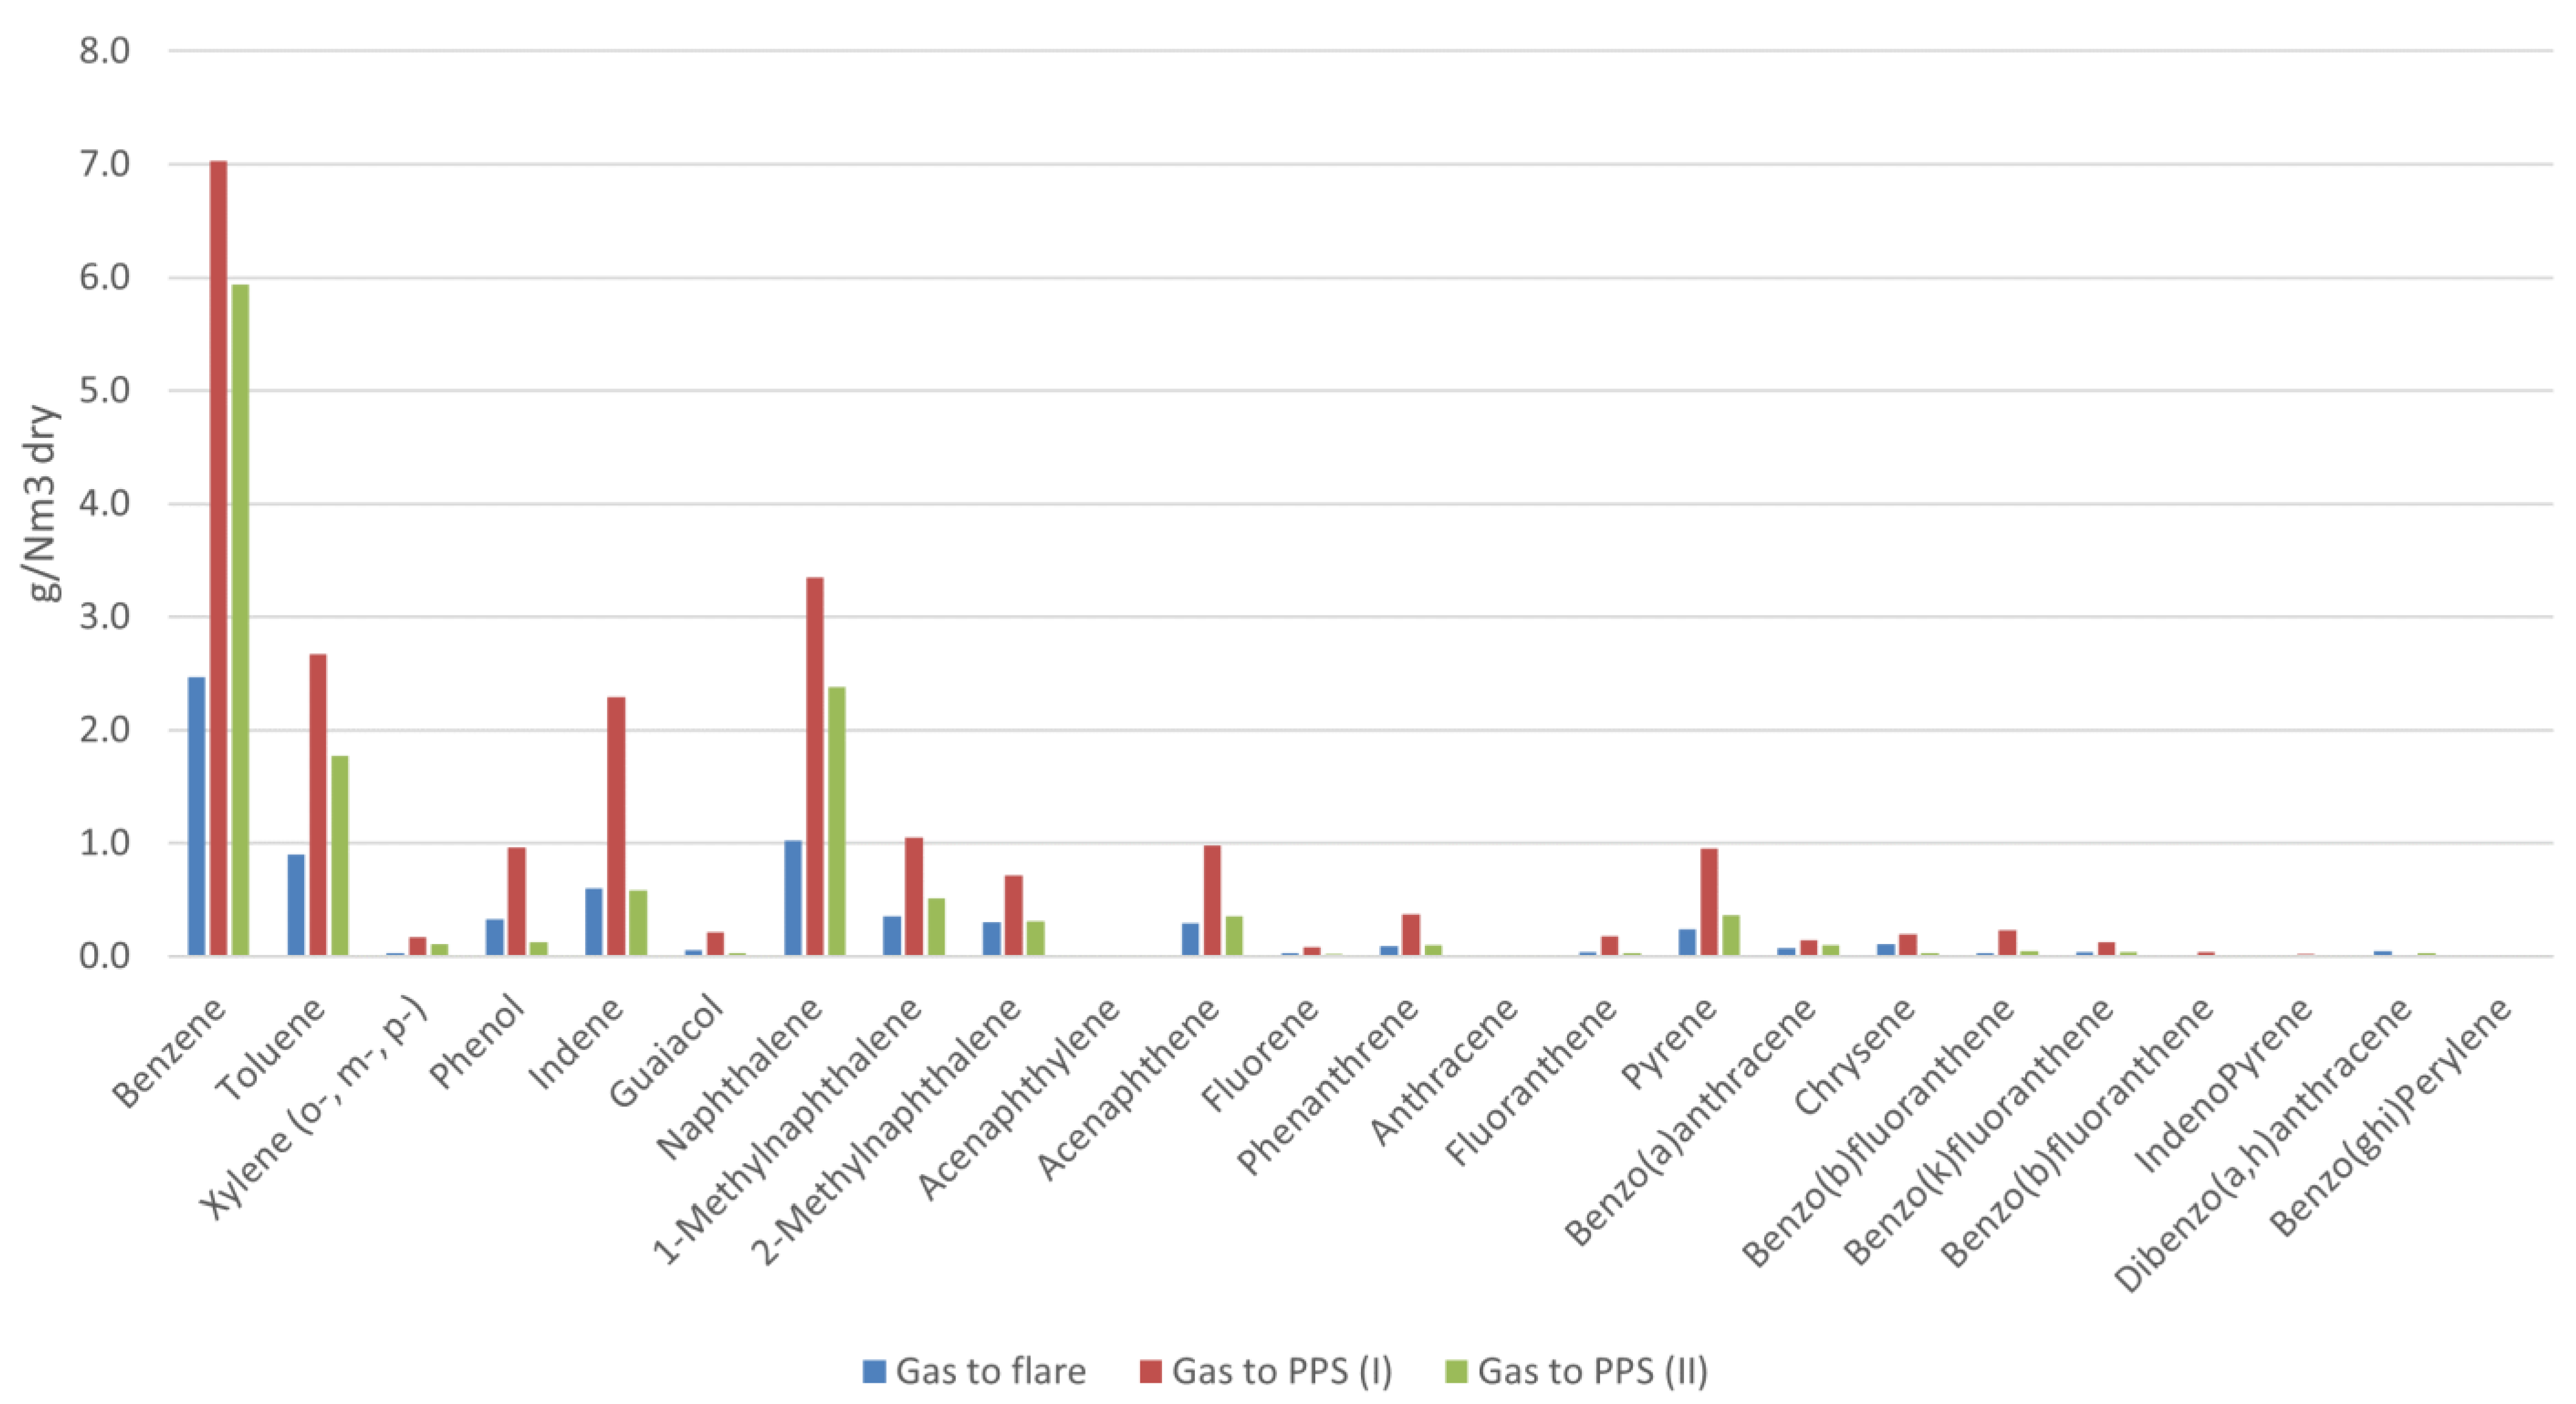
The head of the gasifier was arranged to allow the splitting of the producer gas into two streams in order to ensure that the current flow rate was suitable to test the experimental PPS designed for gas conditioning and H2 production. Given the size of the station, the gas was split to direct only the outflow from two of the five filtration clusters to the PPS. The remaining stream was instead directed to a flare for disposal by combustion.
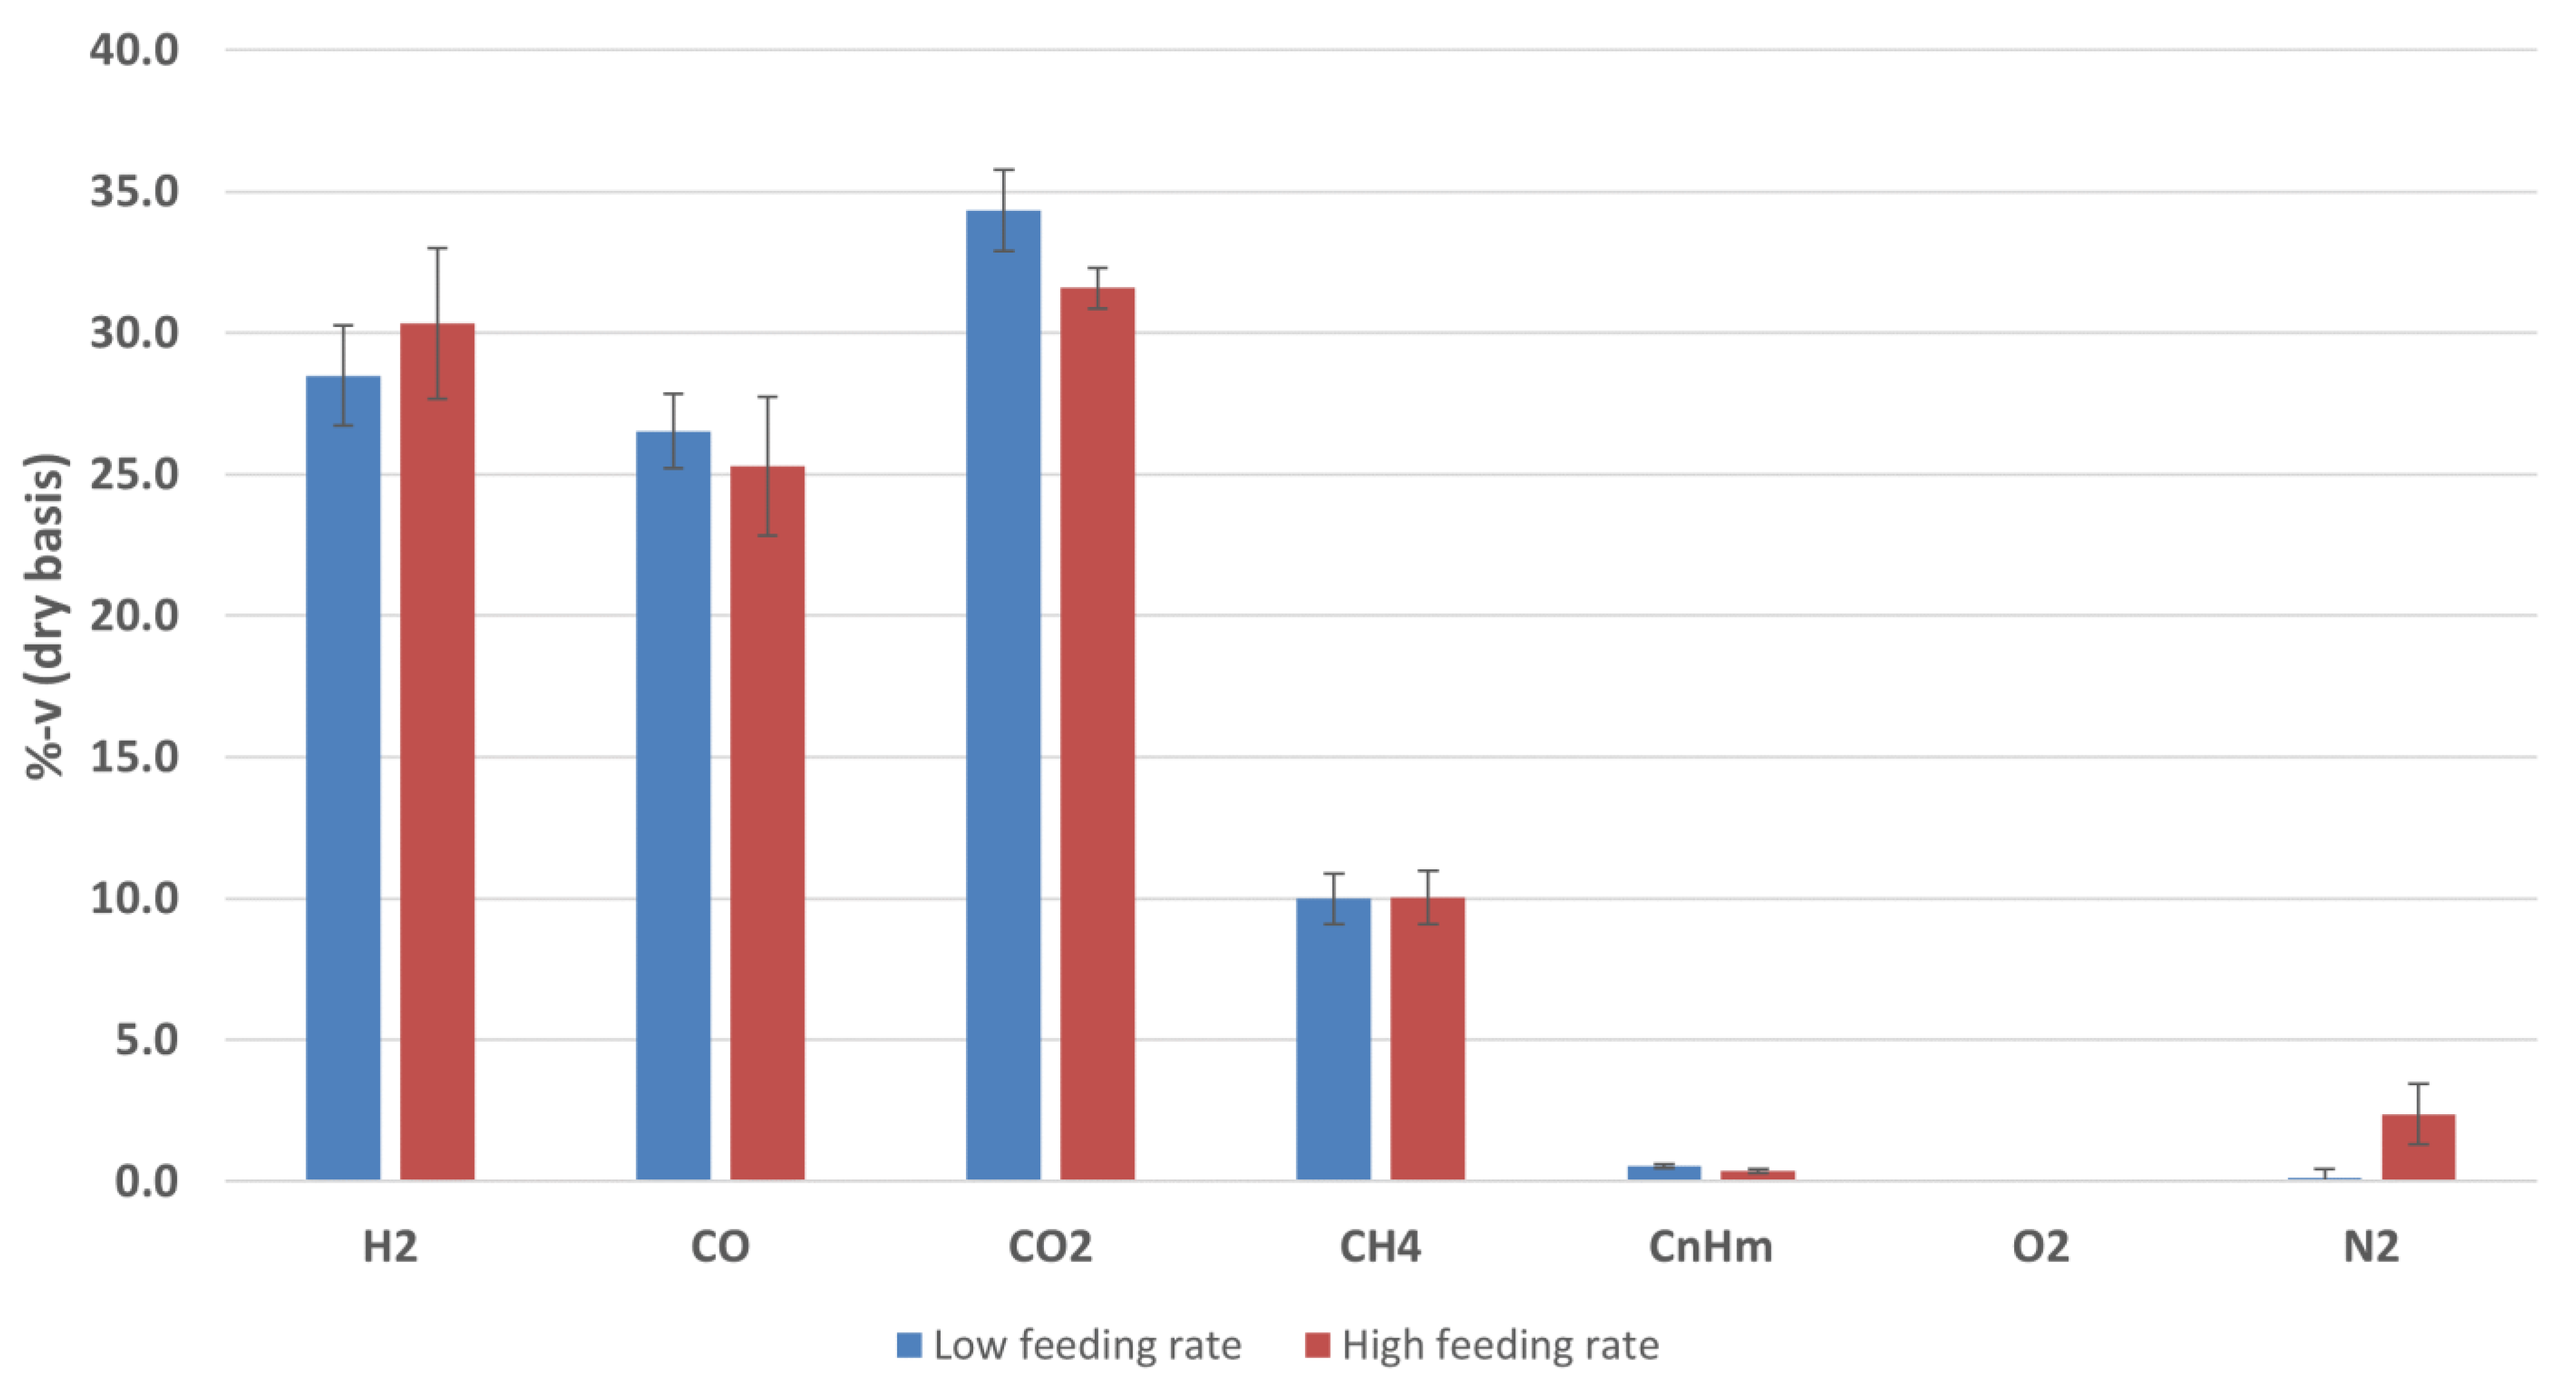
Experimental tests were carried out ranging the process parameters, mainly driven on the basis of the values of biomass feeding rate, in order to confirm the capability of the plant to elaborate different biomass feeding rates in similar conditions and, in doing so, giving similar outputs. A summary of the most representative conditions adopted as feeding conditions at the gasifier is presented in Table 3, corresponding to the lowest and highest biomass feeding rate adopted in the experimental campaigns herein presented.
During the tests, parameters such as flow rates, temperature, and pressure were monitored and the produced stream was sampled to acquire data on the permanent gas composition, as well as on the organic and inorganic contaminant content.
The dry gas composition was monitored online by a µGC–TCD system (by Agilent Technologies) equipped with MSieve5A and PoraplotQ narrow-bore columns. Argon 5.5 grade (99.9995%v) was used as carrier gas. The identification and quantification of each component was based on a retention time parameter and multilevel external calibration, respectively. The gas composition was monitored by acquisition carried out every 4 min. To avoid leaks of the producer gas through the feeding screws, the feedstock supply during the stage of gasification was carried out under a slight nitrogen current, therefore presence of N2 in the produced gas was also detected. The detected percentage was typically lower than 5%v.
Concerning the measurement of contaminant content, tar and particles were measured according to the CEN/TS 15439 protocol; isopropanol (2-propanol) was used as solvent for tar absorption. The final solution was then properly treated for gas chromatography mass spectrometry (GCMS) analysis and gravimetric quantification. Chromatographic analyses were carried out with a GCMS system by Agilent Technology, Mod. 5975 B, equipped with an HP-5MS cross-linked 5% PhMe-siloxane 30 m × 0.25 mm × 0.25 μm film thickness column. Helium 6.0 (99.9999%v) grade was used as gas carrier. A 4-level calibration curve and multi standard solutions containing up to 24 molecules were used for tar molecule quantification.
Inorganic vapours (i.e., HCl, H2S, and NH3) were measured by absorbing the produced gas with aqueous solutions. Specifically, 5%-wt NaOH solution was used for HCl and H2S sampling, and 5%-wt H2SO4 solution was used for NH3. The collected solutions were analysed via liquid chromatography at a DIONEX DX500 system for HPIC (High-Pressure Ion Chromatography). If needed, before the analysis the solutions were diluted at a suitable ratio.
To evaluate the performance of the in-vessel filtration system, the experimental data acquired in the campaigns carried out with the ceramic candles were compared with those from the tests conducted without them.

2.3. Gasifier Simulative Model

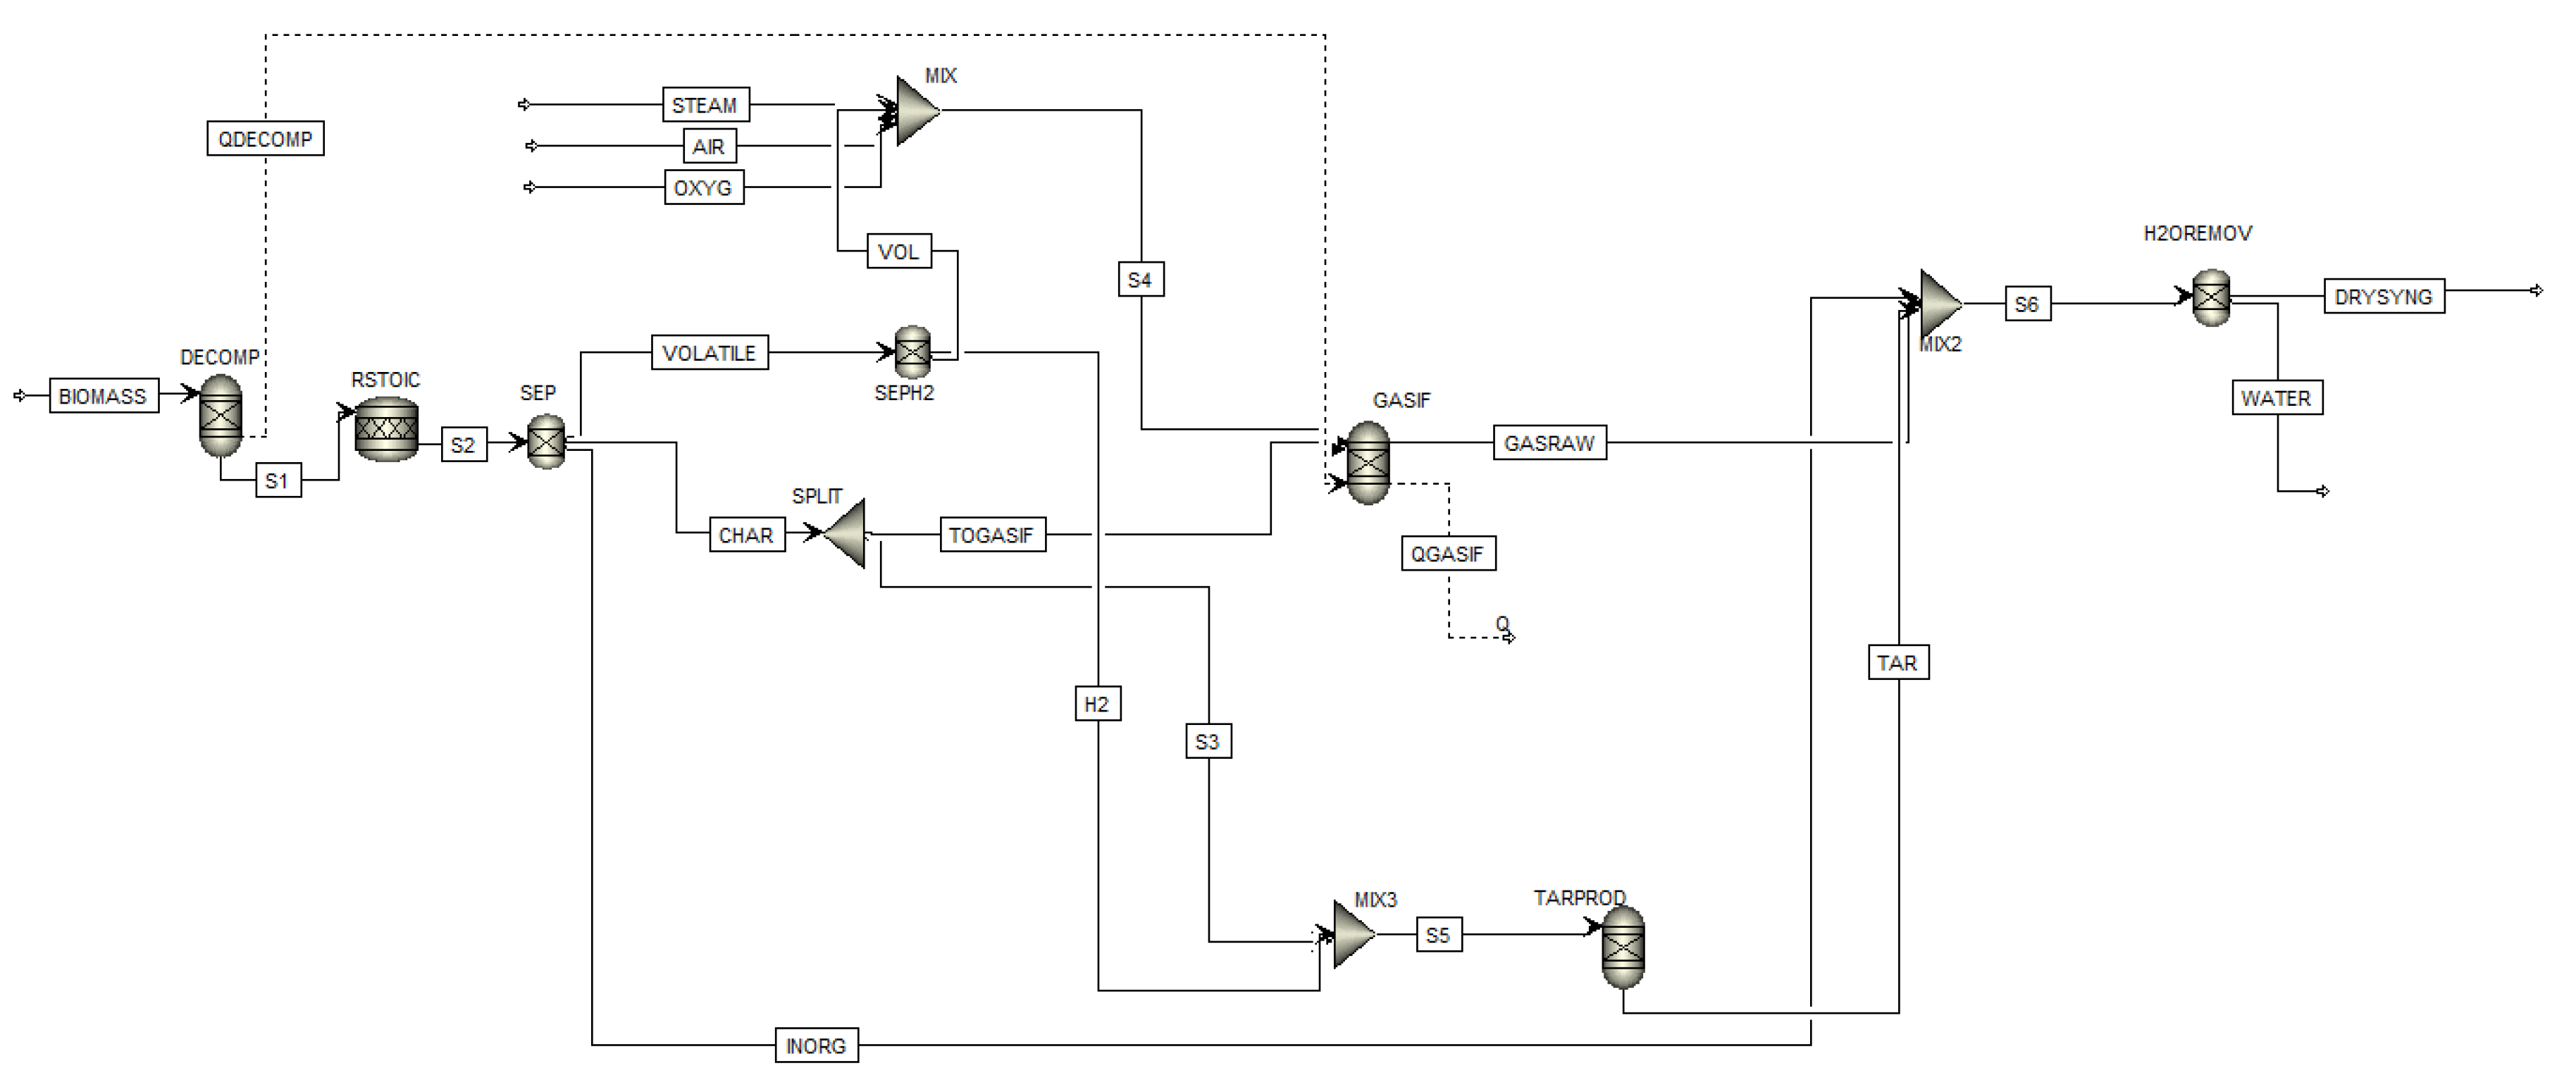
The gasifier model is based on Gibbs free energy minimisation through the quasi-equilibrium approach and has been developed and validated by Aspen Plus software in two previous works by the authors [29,30]. In Figure 3, the model flow sheet is shown. After defining the non-conventional component biomass based on the proximate and ultimate analysis (refer to Table 1), a RYIELD reactor DECOMP was used to convert biomass in conventional components (e.g., C, O2, H2, N2, Cl, S, according to the ultimate analysis). Since the repartition of the products (gas, tar, and contaminants) is unknown, a DECOMP was considered more suitable than a RYIELD, fixing the products based on specific experimental conditions. Products exiting the DECOMP block were moved to the RSTOIC block to simulate the production of H2S, HCl, and NH3 (N2, Cl, and S as elemental components are known to produce mainly H2S, HCl, and NH3, and a fractional conversion of 1 is quite in line with experimental data which represents the worst case of maximum contaminants) [30]. Deriving stream S2 was moved to a separator SEP which separates the stream into three sub-streams: volatile part VOLATILE, char part CHAR, and a stream composed of inorganic contaminants (HCl and H2S) called INORG. Then, VOLATILE stream was divided into two sub-streams: VOL and H2. The former, after mixing with the oxidizing fluid, went into the gasifier, GASIF, and the latter was used to simulate tar production in the RYield block TARPROD where tar is considered to be formed, using experimental data of 18 g/Nm3 [30]. The considered tar amount was repartitioned into 60% benzene, which does not condense (so it is not a “real” tar) but it is the most present hydrocarbon in biomass gasification after methane, 20% toluene (as representative of the fast tar) and 20% naphthalene (as representative of the slow tar) [30]. The gasifier, considered as an autothermal fluidized-bed reactor, was modelled by a RGibbs reactor (GASIF in Figure 3) and the bed material was sand. Within the reactor, the restricted chemical equilibrium of the specified reactions was simulated in order to set the product gas composition by specifying a temperature approach for each individual reaction. In Figure 3, the stream’s steam (STEAM), oxygen (OXYG), and air (AIR) are all shown since the model is able to work with all the combination of oxidizing agents. The mass flow of the stream that was not used was set to zero. The stream S6 represents the global wet output of the gasifier, which is in fact made by the union of GASRAW, INORG, and TAR streams. The block H2OREMOV represents a dryer that removes all the water, so the stream DRYSYNG is the dry output of the gasifier.
The reactions considered in the gasification process are reported in Table 4.

3. Results and Discussions

3.1. Process Performance

Two operating conditions were tested on the experimental plant. The first operating condition was a biomass feeding rate of 122 kgdry/h, ER of 0.25, and S/B of 0.4; the second one was a biomass feeding rate of 150 kgdry/h, ER of 0.28, and S/B of 0.5 (see Table 3). These conditions were selected in order to evaluate the plant operability at a reduced feeding rate, compared to the nominal one set at around 180–200 kgdry/h, depending on the relevant characteristics (e.g., LHV, bulk density, humidity content) of the biomass feedstock. Such a decision was taken in order to gradually evaluate the safe operation of the plant after the upgrading of the pre-existing gasifier in the first-of-a-kind reactor with a ceramic filtration system directly housed in its freeboard.
After the start-up phase, the process at each test sets and the plant achieved a stationary condition characterized by stable temperatures and gas composition. In Figure 4, as an example, the trend over time of the temperatures at the four measurement points when operating the gasifier at a high biomass feeding rate is shown. The stable operating period in which the bed inventory temperatures swing in the range of 780–850 °C is recognizable. The temperatures indicated by T3 are lower since the related thermocouple was located in the upper part of the reactor. The highest temperature, T9, is detected at the middle of the bed where an intimate mixing of biomass feedstock, sand, and gasifying agents was realized. The values indicated by T1 are reasonably lower that T9 and T2. In fact, T1 is positioned at the lower part of the fluidized bed, where gasifying agents at relatively cold temperature (350–400 °C) were addressed through the bottom of the reactor.
The corresponding ranges of percentage composition of each component in the producer gas are presented in Figure 5. Low Heating Values (LHV) of 10.3–10.9 MJ/Nm3dry were accordingly estimated.
The data collected appear to be consistent with each other as a result of the closeness of the operating conditions adopted (e.g., similar ER, S/B, and Tgasif.) and they are in line with the literature on data of steam-oxygen gasification. In particular, there are few differences in H2, CO, and CO2 compositions that can be ascribed to the temperature fluctuations and S/B variations. Moreover, from the gas composition, the H2:CO ratio clearly indicates the beneficial effect of the addition of steam in terms of H2 content in the producer gas. In both cases, in fact, the H2:CO ratio was higher than one (i.e., 1.1 and 1.2, respectively) as well as H2:CO2 between 0.8 and 1.0. These ratio result to be within the values that can be expected in a gasification carried out with only air or oxygen and a gasification conducted with only steam.
In fact, according to results available in the literature, under conditions similar to those adopted in the present work, without steam, H2:CO ratios in the range 0.4–0.7, and H2:CO2 in 0.4–0.9, were reported [31,32,33,34,35,36,37,38].
On the other hand, when using only steam, Pfeifer et al. [39] in their test of wood pellets gasification (steam/fuel ~0.8), in the temperature range 770–850 °C estimated a H2:CO ratio with values increasing from 1.2 up to 1.6 and H2:CO2 from 1.9 to 2.3. Michael et al. [40] reported in the temperature range 815–860 °C, steam/biomass around 1, values up to 1.9 and 2.0 for H2:CO and H2:CO2, respectively. Karatas et al. [32] in tests with cotton stalk at steam/biomass 0.52 and temperature of 765 °C achieved a H2:CO of 1.5 and a H2:CO2 of 2.6.
Finally, as examples of producer gas characteristics in the case of steam-oxygen/air mixed gasification agent, Campoy et al. [41], in their tests of wood pellet gasification with air at ER 0.27 and a bed temperature around 800 °C, found a H2:CO of 0.72. The ratio then increased to 1.36 by steam addition up to S/B 0.45, and T bed ~755 °C. For the H2:CO2, they found a value of roughly 0.9. Meng et al. [42] carried out steam-oxygen gasification campaigns with agrol, willow and DDGS in the temperature range 780–820 °C, ER 0.34–0.43 and S/B 0.8 ÷ 1.25. In accordance with their tests for process performance evaluations, trends in H2 enrichment and CO2 increase were observed, as expected by increasing the S/B and the ER ratios, respectively. Specifically in the case of willow, the tests carried out at 780 °C and 820 °C provided a producer gas composition with an H2:CO increasing from 1.2 to 1.4 and H2:CO2 in the range 0.6–0.7.
Overall, based on the flow rates of the produced gas and the dry gas compositions observed, in the experimental gasification campaigns here presented, values in the ranges of 1.0–1.2 Nm3dry/kgdaf and 63–75% for gas yield and cold gas efficiency were, respectively, estimated.

3.2. Contaminants: Organic, Inorganic, and Particulate Load

A summary of the average contents regarding tar and particulates, determined in accordance with the technical specification TS 15439, is presented in Table 5. The corresponding GCMS analyses showing the distributions of the most representative tar molecules are presented in Figure 6. These data were collected by sampling the producer gas at both available plant streams (i.e., the one prepared to be addressed to the PPS unit (sampled twice, referred to as PPS (I) and PPS (II)) and the one to the flare).
Comparing the tar content in the producer gas obtained in the three samplings, at first glance the figures seem to show a rather significant differences in terms of both gravimetric and chromatographic data. These differences can however be justified by the temperature values reached in the gasifier during the respective tar sampling. Specifically, the gasifier was in fact operating at a temperature around 830–840 °C during the gas sampling on the stream to the flare, at around 800–820 °C and 840–850 °C during the two gas samplings carried out on the stream addressed to the portable purification station, PPS (I) and PPS (II), respectively. Thus, the tar values from flare and PPS (II) are similar to each other, and have a lower content with respect to PPS (I). Since these values come from a plant of significant size, it is not the difference in values that is relevant, but rather the fact that overall the tar content was at most a few tens of grams per unit of dry gas (i.e., around 20 g/Nm3dry). Such value can therefore be considered as the one representative of the gasifier performance under the considered operating conditions.
The collected data are moreover consistent with values available in the literature under similar settings. Wolfesberger et al. [43] in their tests with wood chips found GCMS tar values in the range 12–15 g/Nm3 at 810 °C and around 6 g/Nm3 at 850 °C with wood pellets. Gil et al. in their test with pine wood chips, at Tbed 800–820 °C and ER 0.27, found a tar content up to 21 g/Nm3dry when using silica sand as a bed material.
In all measurements, benzene appeared to be the most abundant aromatic compound. Together with toluene and xylenes, single-ring aromatics accounted for more than 45%-wt of the total chromatographic tar. The next most abundant compound was naphthalene, a result which is in accordance with the gasification temperatures involved in the reactor and its design [43,44]. Together with 1 and 2-methylnaphthalene, the two-ring aromatic compounds accounted for about 25%-wt of the total tar. Finally, the overall abundance of non-polar single and double-ring compounds of known high volatility accounted for the low gravimetric versus the chromatographic tar values.
Considering the data in Table 5, and in accordance with the comments on the representative value of tar for the plant under development, a content not higher than 100 mg/Nm3dry was considered representative of the dust remaining in the producer gas at the exit of the ceramic candle filter. In measurements without ceramic candles, values in the range of 12–16 g/Nm3dry were instead observed. Therefore, by comparing the corresponding representative values for the in-vessel gas filtration system, a removal efficiency greater than 99% was assessed.
In accordance with the elemental analysis of the almond shells used in the tests (Table 1) and considering a gas yield of 1.2 Nm3/kgdaf, the experimental results about HCl and H2S in the producer gas (refer to Table 6) suggested that around 80%-wt of the Cl and S amounts present in the feedstock were converted into the two sour gases. These values were taken into account as feedback data for the preparation of the portable purification station and, in particular, to properly configure the guard beds to preserve the PPS unit from failure of the components provided for gas composition conditioning and H2 separation. A detailed description and discussion of these aspects will be presented in a more focused paper which is currently under preparation.

3.3. Experimental Results vs. Simulative Results

The comparison between the experimental results and the simulative ones predicted by the model developed with the Aspen Plus software [29,30] has shown values in pretty good agreement. Referring to Table 6 and Table 7, hydrogen increased with the increase of the S/B ratio because steam favours the water–gas reaction, resulting in an increase of H2 both in experimental and simulative data. Meanwhile, the simulative data, owing to the thermodynamic model, overestimated the values (with a relative error within 11%). In the simulative model, the variation of temperature was higher with respect to the variation of S/B, such that the temperature had the main influence. This is the reason why in the simulative results the CO concentration increased due to the endothermic reactions R2 (water–gas) and R5 (steam methane reforming) (see Table 4). For the same reason of the main influence of temperature, in the simulative model, the CO2 concentration decrease depends on reaction R4 (water–gas shift) which is exothermic and, therefore, was favoured at low temperatures. The difference in under or over production of methane in simulative modelling is an ordinary issue due to the neglecting of tar in the equilibrium models [30]. The higher results of H2S and HCl in the simulation are due to the assumption in the model of a fractional conversion for S and C equal to 1, whereas the experimental results (see Table 6) show that only 80%-wt of the Cl and S amounts present in the feedstock were converted into the two sour gases.
A comparison in the relative error between the experimental and simulative results for the producer gas composition under low and high feeding rate conditions is reported in Table 7.

4. Conclusions

This work reported the results of experimental campaigns carried out at a 1000 kWth, nominal power gasification pilot plant, based on an innovative bubbling fluidized bed reactor. The innovation concerns the integration directly in the reactor freeboard of a bundle of ceramic candles for high temperature gas filtration. The plant, within different biomass feeding rates, using ER in the range of 0.25–0.28 and an S/B ratio in the range of 0.4–0.5, was operated in a temperature range of 780–850 °C, obtaining a syngas with stable composition and low contaminants levels. The results provided evidence of its reliability in the upgraded configuration.
By using the in-vessel high temperature ceramic filter system, an efficiency dust removal rate higher than 99%-wt was proven to be achievable. Overall, for the LHV, CGE, and gas yield of the producer gas, values up to 10.9 MJ/Nm3dry, 75% and 1.2 Nm3/kgdaf were, respectively, estimated. The experimental results were compared against the simulative results coming from a thermodynamic model based on quasi-equilibrium approach. The comparison resulted in a good agreement, showing the affordability of the model. Finally, using the experimental values of the H2S and HCl fractional conversion, it was found that the model could be improved for further applications.

Author Contributions

Conceptualization, D.B., E.B., P.U.F., G.C. (Giuseppe Canneto), G.B. and S.H.; methodology, D.B., G.C. (Giuseppe Canneto), E.F., C.F. and E.B.; software, V.M.; experimental data curation, D.B., F.N., A.V. and M.G.; writing—original draft preparation, D.B. and V.M.; writing—review and editing, D.B., V.M. and E.B.; supervision, E.B., P.U.F. and S.H.; experimental campaigns supervision, G.C. (Giuseppe Canneto), C.F., E.F., F.N. and G.C. (Giacinto Cornacchia). All authors have read and agreed to the published version of the manuscript.

Funding

This research was funded by the Fuel Cells and Hydrogen Joint Undertaking programme under the grant agreement 299732.

Institutional Review Board Statement

Not applicable.

Informed Consent Statement

Not applicable.

Data Availability Statement

All data are reported in the paper.

Conflicts of Interest

The authors declare no conflict of interest.

References

  1. Available online: https://ec.europa.eu/info/strategy/priorities-2019-2024/european-green-deal_en (accessed on 16 February 2021).
  2. Communication from the Commission to the European Parliament and the Council. Available online: https://eur-lex.europa.eu/legal-content/EN/TXT/HTML/?uri=CELEX:52019DC0640&from=EN (accessed on 16 February 2021).
  3. Available online: https://ec.europa.eu/commission/presscorner/detail/en/ip_19_6691 (accessed on 16 February 2021).
  4. Available online: https://ec.europa.eu/commission/presscorner/detail/eni/ip_20_1259 (accessed on 16 February 2021).
  5. Available online: https://www.ipcc.ch/sr15/chapter/spm/ (accessed on 16 February 2021).
  6. Biagini, E.; Barontini, F.; Tognotti, L. Gasification of agricultural residues in a demonstrative plant: Vine pruning and rice husks. Bioresour. Technol. 2015, 194, 36–42. [Google Scholar] [CrossRef] [PubMed]
  7. Büyüktahtakın, E.; Cobuloglu, H.I. Food vs. Biofuel: An Optimization Approach to the Spatio-Temporal Analysis of Land-Use Competition and Environmental Impacts. Appl. Energy 2015, 140, 418–434. [Google Scholar]
  8. Marcantonio, V.; Ferrario, A.M.; Di Carlo, A.; Del Zotto, L.; Monarca, D.; Bocci, E. Biomass Steam Gasification: A Comparison of Syngas Composition between a 1-D MATLAB Kinetic Model and a 0-D Aspen Plus Quasi-Equilibrium Model. Computation 2020, 8, 86. [Google Scholar] [CrossRef]
  9. Beohar, H.; Gupta, B.; Sethi, V.K.; Pandey, M. Parametric Study of Fixed Bed Biomass Gasifier: A Review. Int. J. Therm. Technol. 2012, 2, 134–140. [Google Scholar]
  10. Niu, M.; Huang, Y.; Jin, B.; Liang, S.; Dong, Q.; Gu, H.; Sun, R. A novel two-stage enriched air biomass gasification for producing low-tar high heating value fuel gas: Pilot verification and performance analysis. Energy 2019, 173, 511–522. [Google Scholar] [CrossRef]
  11. Kuramoto, M.; Kunii, D.; Furusawa, T. Flow of dense fluidized particles through an opening in a circulation system. Powder Technol. 1986, 47, 141–149. [Google Scholar] [CrossRef]
  12. Canneto, G.; Freda, C.; Braccio, G. Numerical simulation of gas-solid flow in an interconnected fluidized bed. Therm. Sci. 2015, 19, 317–328. [Google Scholar] [CrossRef]
  13. Foscolo, P.U.; Germanà, A.; Jand, N.; Rapagnà, S. Design and cold model testing of a biomass gasifier consisting of two interconnected fluidized beds. Powder Technol. 2007, 173, 179–188. [Google Scholar] [CrossRef]
  14. Bridgwater, T. Biomass for energy. J. Sci. Food Agric. 2006, 86, 1755–1768. [Google Scholar] [CrossRef]
  15. Spath, P.L.; Dayton, D.C. Preliminary Screening—Technical and Economic Assessment of Synthesis Gas to Fuels and Chemicals with Emphasis on the Potential for Biomass-Derived Syngas; December 2003—NREL/TP-510-34929; National Renewable Energy Laboratory (U.S.): Golden, CO, USA, 2003. [Google Scholar]
  16. Hasler, P.; Nussbaumer, T. Gas cleaning for IC engine applications from fixed bed biomass gasification. Biomass-Bioenergy 1999, 16, 385–395. [Google Scholar] [CrossRef]
  17. Basu, P. Biomass Gasification and Pyrolysis: Practical Design and Theory; Academic Press: Cambridge, MA, USA, 2010. [Google Scholar]
  18. Iversen, H.L.; Gøbel, B. Chapter 9—Update on Gas Cleaning Technologies, in Handbook Biomass Gasification; BTG Biomass Technology Group: Enschede, The Netherlands, 2005. [Google Scholar]
  19. Klass, D.L. Energy Consumption, Reserves, Depletion, and Environmental Issues. In Biomass for Renewable Energy, Fuels, and Chemicals; Elsevier: Amsterdam, The Netherlands, 1998; pp. 1–27. [Google Scholar]
  20. Sikarwar, V.; Zhao, M.; Clough, P.; Yao, J.; Zhong, X.; Memon, M.Z.; Shah, N.; Anthony, E.J.; Fennell, P.S. An overview of advances in biomass gasification. Energy Environ. Sci. 2016, 9, 2939–2977. [Google Scholar] [CrossRef] [Green Version]
  21. Farzad, S.; Mandegari, M.A.; Gorgens, J. A critical review on biomass gasification, co-gasification, and their environmental assessments. Biofuel Res. J. 2016, 3, 483–495. [Google Scholar] [CrossRef]
  22. Rauch, R.; Hrbek, J.; Hofbauer, H. Biomass gasification for synthesis gas production and applications of the syngas. Wiley Interdiscip. Rev. Energy Environ. 2014, 3, 343–362. [Google Scholar] [CrossRef]
  23. Marcantonio, V.; De Falco, M.; Capocelli, M.; Bocci, E.; Colantoni, A.; Villarini, M. Process analysis of hydrogen production from biomass gasification in fluidized bed reactor with different separation systems. Int. J. Hydrogen Energy 2019, 44, 10350–10360. [Google Scholar] [CrossRef]
  24. Caballero, M.A.; Corella, J.; Aznar, M.-P.; Gil, J. Biomass Gasification with Air in Fluidized Bed. Hot Gas Cleanup with Selected Commercial and Full-Size Nickel-Based Catalysts. Ind. Eng. Chem. Res. 2000, 39, 1143–1154. [Google Scholar] [CrossRef]
  25. Zhang, R.; Wang, Y.; Brown, R.C. Steam Reforming of Tar Compounds over Ni/Olivine Catalysts Doped with CeO2. Energy Convers. Manag. 2007, 48, 68–77. [Google Scholar] [CrossRef]
  26. UNIQUE Cooperative Research Project, Contract N.211517. Available online: https://cordis.europa.eu/project/id/211517 (accessed on 12 February 2021).
  27. Barisano, D.; Canneto, G.; Nanna, F.; Alvino, E.; Pinto, G.; Villone, A.; Carnevale, M.; Valerio, V.; Battafarano, A.; Braccio, G. Steam/oxygen biomass gasification at pilot scale in an internally circulating bubbling fluidized bed reactor. Fuel Process. Technol. 2016, 141, 74–81. [Google Scholar] [CrossRef]
  28. Available online: http://www.magnolithe.at/ (accessed on 20 February 2021).
  29. Marcantonio, V.; Bocci, E.; Ouweltjes, J.P.; Del Zotto, L.; Monarca, D. Evaluation of sorbents for high temperature removal of tars, hydrogen sulphide, hydrogen chloride and ammonia from biomass-derived syngas by using Aspen Plus. Int. J. Hydrogen Energy 2020, 45, 6651–6662. [Google Scholar] [CrossRef]
  30. Marcantonio, V.; Bocci, E.; Monarca, D. Development of a Chemical Quasi-Equilibrium Model of Biomass Waste Gasification in a Fluidized-Bed Reactor by Using Aspen Plus. Energies 2019, 13, 53. [Google Scholar] [CrossRef] [Green Version]
  31. Lahijani, P.; Zainal, Z.A. Gasification of palm empty fruit bunch in a bubbling fluidized bed: A performance and agglomeration study. Bioresour. Technol. 2011, 102, 2068–2076. [Google Scholar] [CrossRef]
  32. Karatas, H.; Olgun, H.; Akgun, F. Experimental results of gasification of cotton stalk and hazelnut shell in a bubbling fluidized bed gasifier under air and steam atmospheres. Fuel 2013, 112, 494–501. [Google Scholar] [CrossRef]
  33. Zaccariello, L.; Mastellone, M.L. Fluidized-Bed Gasification of Plastic Waste, Wood, and Their Blends with Coal. Energies 2015, 8, 8052. [Google Scholar] [CrossRef] [Green Version]
  34. Narváez, I.; Orío, A.; Aznar, M.P.; Corella, J. Biomass Gasification with Air in an Atmospheric Bubbling Fluidized Bed. Effect of Six Operational Variables on the Quality of the Produced Raw Gas. Ind. Eng. Chem. Res. 1996, 35, 2110–2120. [Google Scholar] [CrossRef]
  35. Liu, L.; Huang, Y.; Cao, J.; Liu, C.; Dong, L.; Xu, L.; Zha, J. Experimental study of biomass gasification with oxygen-enriched air in fluidized bed gasifier. Sci. Total. Environ. 2018, 626, 423–433. [Google Scholar] [CrossRef]
  36. Salami, N.; Skála, Z. Use of the Steam as Gasifying Agent in Fluidized Bed Gasifier. Chem. Biochem. Eng. Q. 2015, 29, 13–18. [Google Scholar] [CrossRef]
  37. González-Vázquez, M.P.; García, C.P.; Pevida, C.; Rubiera, F. Optimization of a Bubbling Fluidized Bed Plant for Low-Temperature Gasification of Biomass. Energies 2017, 10, 306. [Google Scholar] [CrossRef] [Green Version]
  38. Xue, G.; Kwapinska, M.; Horvat, A.; Kwapinski, W.; Rabou, L.; Dooley, S.; Czajka, K.; Leahy, J.J. Gasification of torrefied Miscanthus×giganteus in an air-blown bubbling fluidized bed gasifier. Bioresour. Technol. 2014, 159, 397–403. [Google Scholar] [CrossRef] [Green Version]
  39. Pfeifer, C.; Koppatz, S.; Hofbauer, H. Steam gasification of various feedstocks at a dual fluidised bed gasifier: Impacts of operation conditions and bed materials. Biomass- Convers. Biorefinery 2011, 1, 39–53. [Google Scholar] [CrossRef]
  40. Michel, R.; Rapagnà, S.; Burg, P.; Di Celso, G.M.; Courson, C.; Zimny, T.; Gruber, R. Steam gasification of Miscanthus X Giganteus with olivine as catalyst production of syngas and analysis of tars (IR, NMR and GC/MS). Biomass-Bioenergy 2011, 35, 2650–2658. [Google Scholar] [CrossRef]
  41. Campoy, M.; Barea, A.G.; Villanueva, A.L.; Ollero, P. Air−Steam Gasification of Biomass in a Fluidized Bed under Simulated Autothermal and Adiabatic Conditions. Ind. Eng. Chem. Res. 2008, 47, 5957–5965. [Google Scholar] [CrossRef]
  42. Meng, X.; de Jong, W.; Fu, N.; Verkooijen, A.H. Biomass gasification in a 100 kWth steam-oxygen blown circulating fluidized bed gasifier: Effects of operational conditions on product gas distribution and tar formation. Biomass-Bioenergy 2011, 35, 2910–2924. [Google Scholar] [CrossRef]
  43. Aigner, I.; Wolfesberger, U.; Hofbauer, H. Tar Content and Composition in Producer Gas of Fluidized Bed Gasification and Low Temperature Pyrolysis of Straw and Wood—Influence of Temperature; ICPS 2009, 1st-3rd of September 2009, Vienna, Austria. Available online: https://www.best-research.eu/files/publications/pdf/PubDat_177839.pdf (accessed on 20 February 2021).
  44. Milne, T.A.; Evans, R.J.; Abatzoglou, N. Biomass Gasifier “Tars”: Their Nature, Formation, and Conversion; November 1998—NREL/TP-570-25357. Available online: https://www.osti.gov/biblio/3726-biomass-gasifier-tars-nature-formation-conversion (accessed on 20 February 2021).
Figure 1. Sketch of the pre-existing 1000 kWth bubbling fluidized bed pilot plant.
Processes 09 01104 g001
Figure 2. Schematic of the bubbling fluidized bed gasifier with the ceramic candles housed in the freeboard. The positioning of the four main thermocouples for measuring the temperature inside the gasifier (i.e., T1, T2, T3, and T9) is shown.
Processes 09 01104 g002
Figure 3. Aspen Plus simulation flowsheet of the auto-thermal BFB gasification reactor (the dashed streams are heat streams; the continuous streams are material streams).
Processes 09 01104 g003
Figure 4. Temperature trends inside the reactor with focus on the steady-state time window. Legend temperatures in accordance with the positions are shown in Figure 2.
Processes 09 01104 g004
Figure 5. Average compositions of the producer gas obtained in the gasification tests at low and high biomass feeding rates. Percentages by volume, referred to dry gas.
Processes 09 01104 g005
Figure 6. Distribution in the main tar molecules as observed via GCMS analysis.
Processes 09 01104 g006
Table 1. Physical and chemical characteristics of almond shells.
Bulk Density (kg/m3)Humidity (%wt)
45010–12
Proximate Analysis (%wt, dry basis)
AshVolatile MatterFixed Carbon
1.280.618.2
Ultimate Analysis (%wt, dry basis)
CHNOClS
47.96.30.3244.270.0120.015
Heating values (MJ/kgdry)
HHVLHV
19.518.0
Table 2. Relevant characteristics of Magnolithe GmbH.
General Characteristics
Origin:Austria
Density3400–3500 kg/m3
Bulk density1900–2050 kg/m3
Mean diameter344 μm
Fusion point1750 °C
Therm. Expansion1.3% (1100 °C)
Mohs hardness6.5–7.0
Specific heat0.95–1.05 kJ/(kg °C)
Composition (%wt)
SiO241.9
MgO49.5
Fe2O37.1
Al2O31
Mineralogy (%wt)
Forsterite (Mg2SiO4)94
Fayalite (Fe2SiO4)6
Table 3. Gasification operating conditions in test of low and high biomass feeding rate.
Operating ParameterLow FeedingHigh Feeding
Feeding rate (kgdry/h; kgar/h) (a)122; 140150; 170
O2 (kg/h)44–4658–61
Steam (kg/h)48–5070–80
Equivalence Ratio (ER)0.250.28
Steam/Biomass (S/B) (b)0.40.5
(a) ar, as received; humidity content, 12%-wt; (b) dry basis.
Table 4. Gasification reactions [23].
ReactionReaction NameHeat of ReactionReaction Number
Heterogeneous reaction
C + 0.5 O2 → COChar partial combustion(−111 MJ kmol−1)(R1)
C + H2O ↔ CO + H2Water-gas(+172 MJ kmol−1)(R2)
Homogeneous reactions
H2 + 0.5 O2 → H2OH2 partial combustion(−283 MJ kmol−1)(R3)
CO + H2O ↔ CO2 + H2Water gas-shift(−41 MJ kmol−1)(R4)
CH4 + H2O → CO + 3H2Steam-methane reforming(+206 MJ kmol−1)(R5)
Table 5. Particulate and tar contents in the producer gas.
Contaminant MeasurementGas stream to the FlareGas Stream to the PPS (I)Gas Stream to the PPS (II)
Particulate (mg/Nm3dry)N.A. (a)9626
Gravimetric Tar (g/Nm3dry)4.714.23.2
Tot Chromatographic tar (g/Nm3dry)7.121.812.9
Tot Chromatographic tar (g/Nm3dry, no Benzene) (b)4.614.86.9
(a) N.A., not available; (b) In this evaluation the benzene content was not included since, according to the commonly accepted definition, “tars” are considered all aromatic compounds with a molecular weight higher than benzene.
Table 6. Comparison between the experimental and the Aspen Plus simulation results.
Experimental ResultsSimulative Results
Low Feeding RateHigh Feeding Rate
Gasification temperature (°C)780–850780–850780850
Gasification pressure (bar)1111
S/B0.40.50.40.5
ER0.250.280.250.28
H2 (%v, dry)28.530.330.833.7
CO (%v, dry)26.325.327.630.9
CO2 (%v, dry)34.331.227.225.0
CH4 (%v, dry)10.010.07.86.8
H2S (ppmvdry basis)60–9060–90270280
HCl (ppmvdry basis)40–5040–50100110
Tar (g/Nm3dry)4.64.65.55.5
Gas yield (Nm3/kg)1.21.21.21.2
Table 7. Relative error between the experimental and simulative results.
Relative Error (%) at Feeding Low Rate Relative Error (%) at Feeding High Rate
H28.0%11.2%
CO4.9%22.1%
CO221.0%19.8%
CH4 22.0%32.0%
Publisher’s Note: MDPI stays neutral with regard to jurisdictional claims in published maps and institutional affiliations.

