Article

Sequential Hydrothermal Processing of Sewage Sludge to Produce Low Nitrogen Biocrude

Institute of Catalysis Research and Technology (IKFT), Karlsruhe Institute of Technology (KIT), Hermann-von-Helmholtz-Platz 1, 76344 Eggenstein-Leopoldshafen, Germany
*
Author to whom correspondence should be addressed.
Processes 2021, 9(3), 491; https://doi.org/10.3390/pr9030491
Submission received: 29 January 2021 / Revised: 23 February 2021 / Accepted: 28 February 2021 / Published: 9 March 2021
(This article belongs to the Special Issue Process Design of Biomass Thermochemical Conversion)

Abstract

:
A hydrothermal pre-treatment has been developed to improve sewage sludge quality or to produce low nitrogen biocrude via hydrothermal liquefaction (HTL) in a subsequent step. The mild hydrothermal pre-treatment (150 °C) step was performed with deionized water, sulfuric acid (0.5 M), or citric acid (0.5 M) to solubilize nitrogen containing compounds in the aqueous supernatant. Downstream, the residual solid material was liquefied with the addition of sodium carbonate via hydrothermal liquefaction (350 °C). The pre-treatment with citric acid transferred up to 66.7 wt. % of nitrogen into the aqueous supernatant, while 62.0 wt. % of carbon was recovered in the solid. Due to the pre-treatment lipids retained in the sewage sludge solid, which increased the favored biocrude yield up to 42.9 wt. % and the quality evaluating value H/Ceff ratio significantly to 1.48. Multi-method characterization of the resulted biocrude samples showed a lower concentration of N-heterocycles, while long-chain aliphatics and free fatty acid are increased.

1. Introduction

Sewage sludge is generated from wastewater treatment plants, demand urgent management and proper disposal. More than 10 million tons of sewage sludge were produced in the European Union (EU) in 2010, with a rising amount due to population growth, urbanization and higher regulations on the wastewater effluent [1,2]. Common disposal methods are the use in agriculture, incineration or landfill [3]. However, the sludge management remains a challenging issue for the member states as the European legislations provided with the Directive 2018/851/EC a priority hierarchy in waste management, starting from prevention, to preparing for reuse, to recycling, to energy recovery, and finally to disposal [4]. Besides, the limit levels for pathogens, metal and nutrient application rates to land are set and new issues arise with micro-plastics and pharmaceutical residuals [5,6,7]. The common method to handle excess sewage sludge in Europe is sludge thickening followed by anaerobic digestion (AD) [8]. The AD is not a final solution and is only applied to reduce the amount of sludge for subsequent transportation to the incineration plant [9].
As sewage sludge is a waste product with a relatively high content of organic matter, it has gained interest for thermochemical utilization [10]. For instance, hydrothermal liquefaction (HTL) can convert wet feedstocks, like sewage sludge to renewable fuel [11]. After mechanical dewatering, sewage sludge still contains 80–90% moisture. HTL can skip the energy-intense drying step, as the process takes advantage of the extraordinary properties of hot compressed water at 200–400 °C and 5–35 MPa [11,12,13]. The higher reactivity is caused by a superior ionic product and a low dielectric permittivity, which enhances acid/base and ionic reactions and breaks down cell structures and macromolecules, including carbohydrates, lipids, and proteins [14,15]. The main organic products are the biocrude, char, water-soluble substances and gas. In a lower temperature regime, char production is favored (hydrothermal carbonization), while higher temperature leads to gasification (hydrothermal gasification) [16]. The inorganic components are recovered primarily in a solid phase (above 70 wt. %), and the rest is mostly solubilized in the water phase and traces can be found in the biocrude [17].
However, there are still some issues to be solved. Biocrude from HTL of sewage sludge suffers from high contents of nitrogen, originating from proteins and differs therefore from fossil crude oils [18,19]. There have been many efforts to refine biocrude into commercial fuels through various extensive methods such as catalytic cracking, hydrotreating, emulsifying and blending [18,20]. Additionally, the role of HTL operating parameters in producing higher biocrude yields and better quality has been elucidated extensively in the past [21]. A new approach to lower nitrogen content and thus to increase biocrude quality is to investigate an upstream hydrothermal pre-treatment, improving the HTL feedstock [22]. A mild hydrothermal treatment is already commonly applied on sewage sludge to improve dewaterability or biodegradability for downstream anaerobic digestion in a wastewater treatment plant [23]. With a focus on the transformation of organic nitrogen during hydrothermal treatment of sewage sludge, Zhuang et al. showed solubilization of nitrogen over a wide temperature range [24]. It was shown that the application of a hydrothermal pre-treatment could reduce the nitrogen content of sewage sludge and led to lower the NOx emission prior to subsequent combustion [25]. Concerning different biogenic feedstock, Yoshida et al. examined the subcritical water treatment on waste squid and Zhu et al. the decomposing of fish proteins to produce amino acids [26,27]. The combination of a mild hydrothermal pre-treatment with HTL on microalgae lowered successfully the heteroatom content [28]. Jazrawi et al. applied also a two-stage hydrothermal process of algae and added inorganic and organic acids to lower the nitrogen content of the derived biocrude [29]. Furthermore, the pre-treated algae were analyzed in deep to gain a better understanding of the process. A different approach was conducted by Guo et al., who tried to pre-treat algae with a pulsed electric field to extract valuable proteins and improve the quality of the subsequently derived biocrude [30].
Nevertheless, most research focus on the relation of yield and the nitrogen content in biocrude when sewage sludge is subjected to a pre-treatment. Preceding research of Fan et al. at IKFT suggests strong competition of Maillard or amidation reactions of proteins with carbohydrates or fatty acids, respectively [31]. Maillard reactions form N-heterocycles, while amidation of fatty acids leads to long-chain amides. These findings propose a pre-treatment where proteins, carbohydrates and their Maillard products are solubilized in an aqueous supernatant and subsequently removed. We pursue to apply a two-stage hydrothermal process with set reaction conditions, including water and two acid hydrothermal pre-treatments and the subsequent liquefaction. The influence on the interactions of proteins, carbohydrates and fatty acids are addressed the first time on a real biomass. The effect on the yield, carbon and nitrogen distribution and chemical composition of the pre-treated solids and products is therefore discussed in detail.

2. Materials and Methods

2.1. Biomass and Chemicals
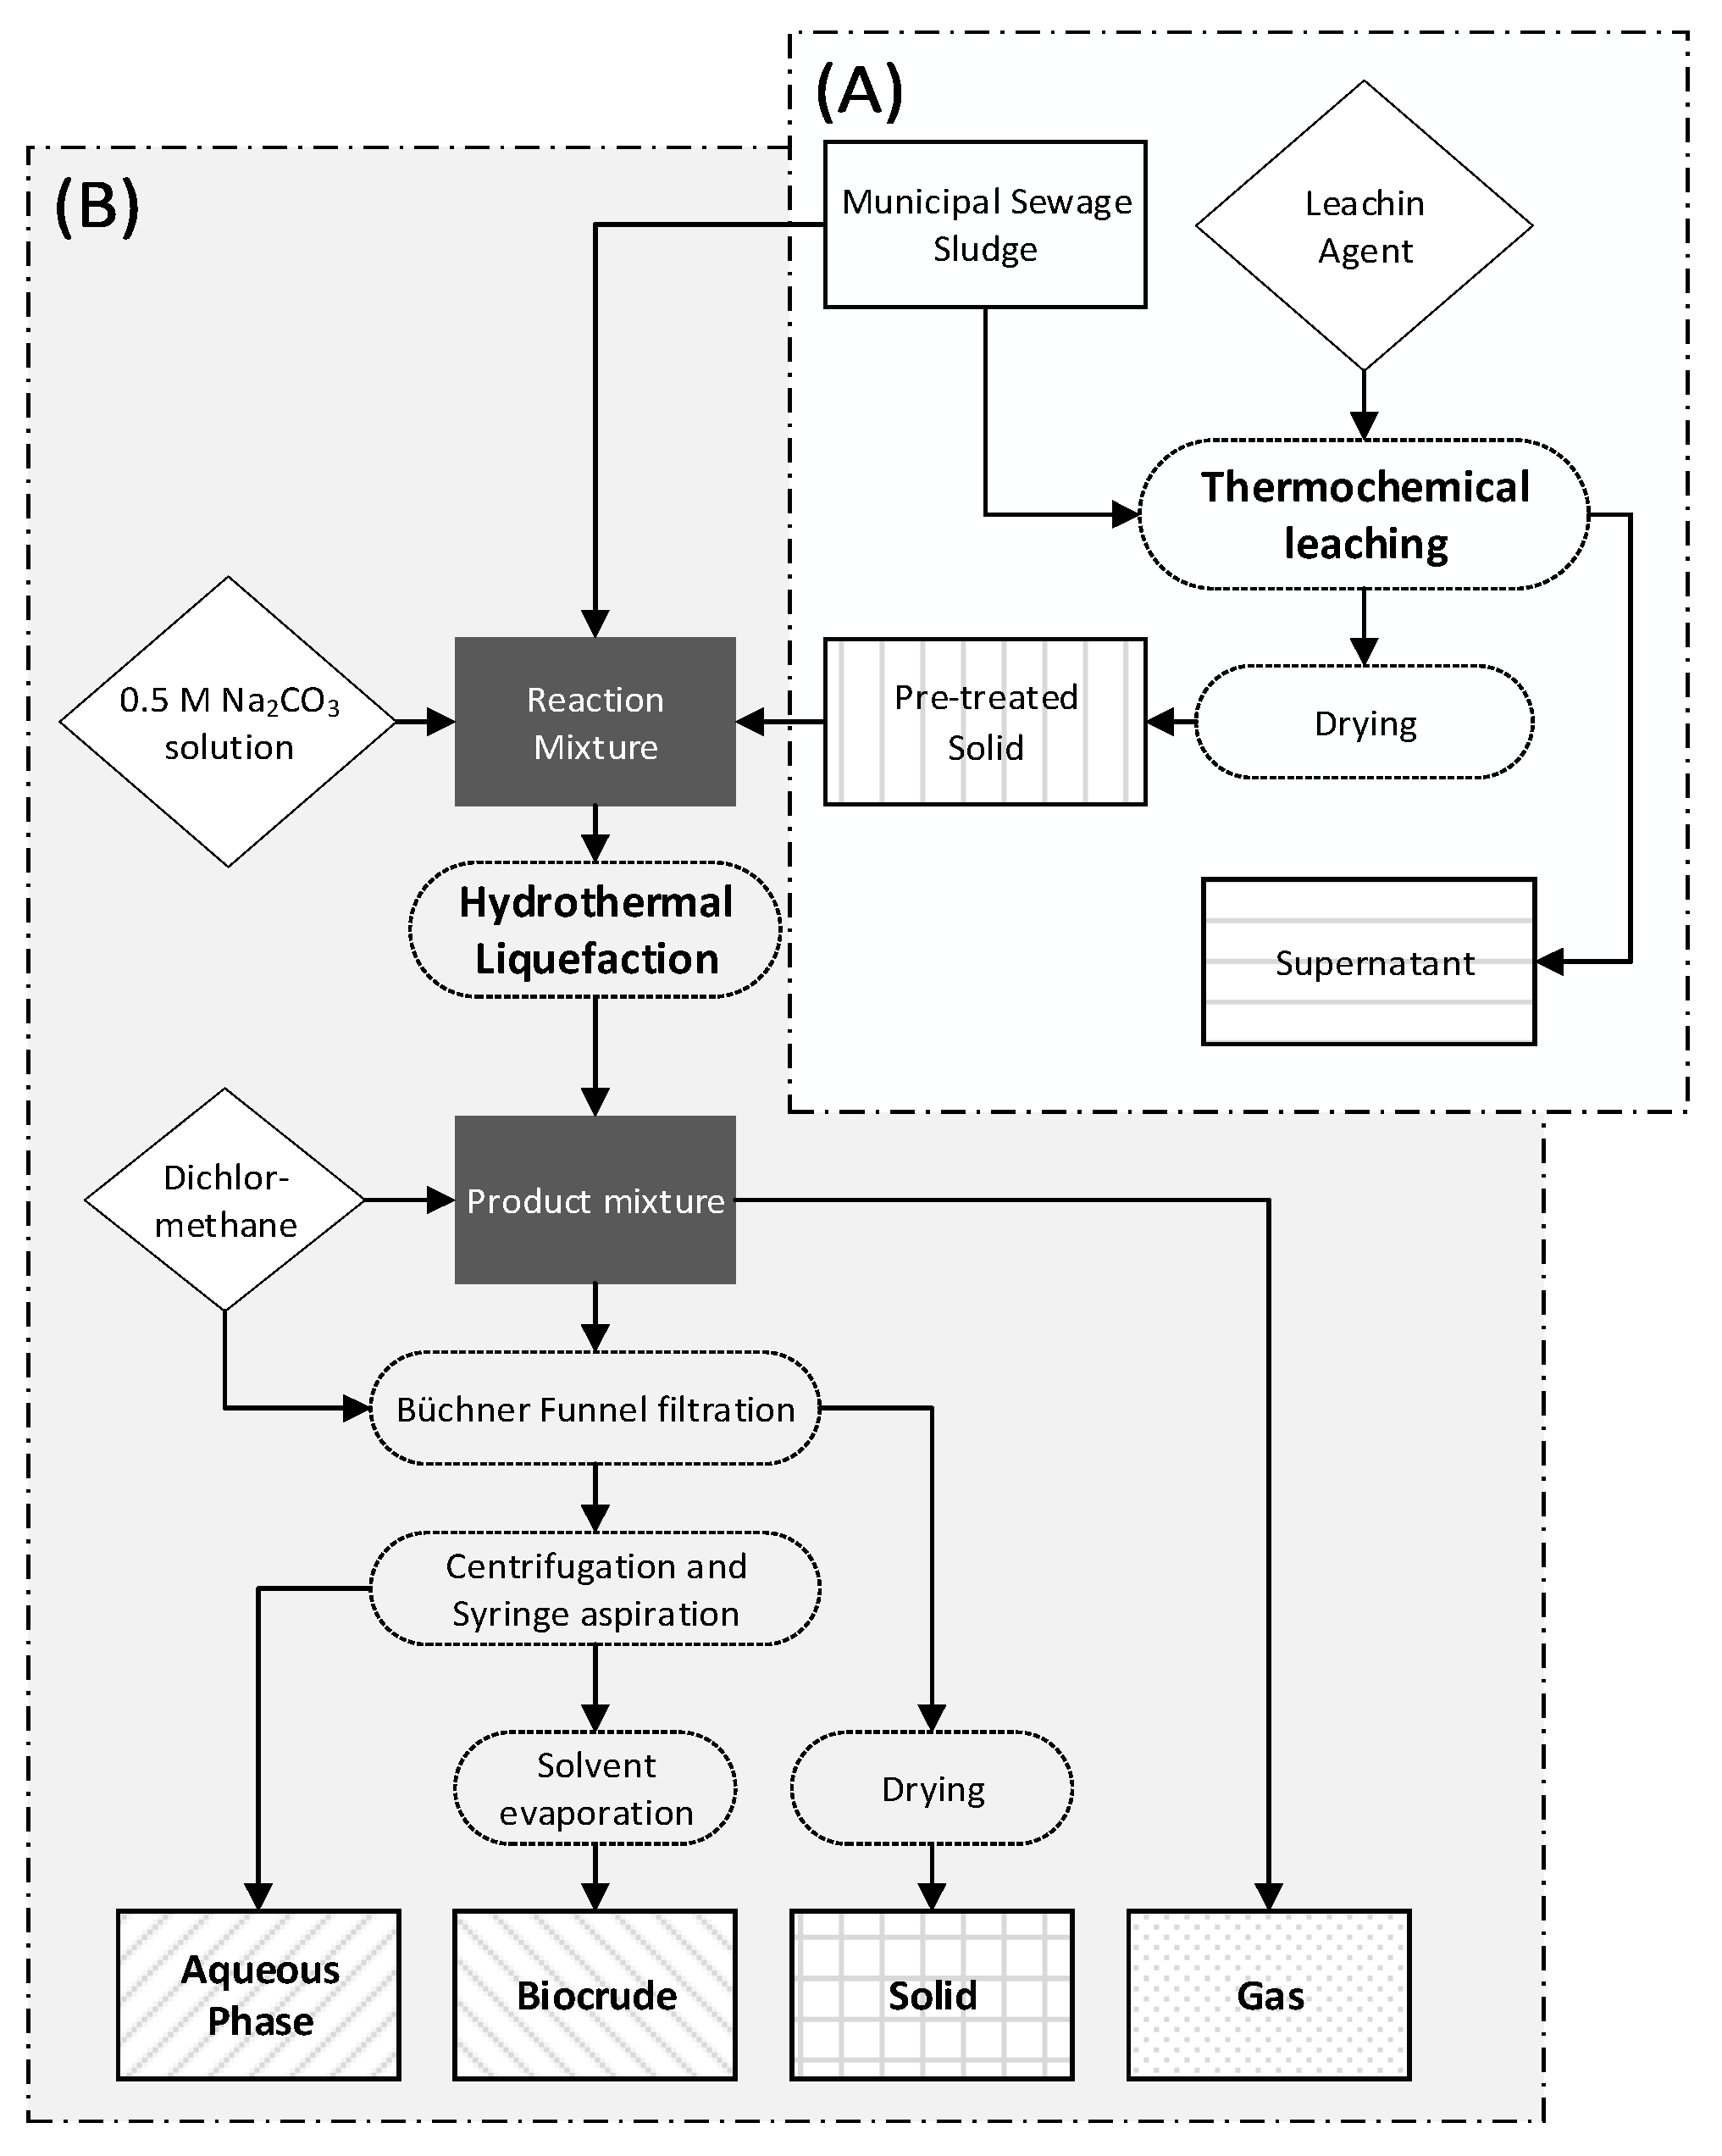
A sample of around 60 kg municipal sewage sludge (MSS), including centrifuged primary and secondary (activated) sludge, was collected at the local wastewater treatment plant (Städtisches Klärwerk, Karlsruhe, Germany) in November 2019. The sample was directly dried at 105 °C for 24 h and collected into two fractions. One fraction was prepared for pre-treatment experiments and sieved to a 5–7 mm grain size by laboratory frame screens. Another fraction was prepared for subsequent HTL experiments and evenly ground with a laboratory rotor mill (Pulverisette, Fritsch, Idar-Oberstein, Germany) with a screen size of 200 µm.
Chemicals used for the experiments were obtained in analytical grade. Citric and sulfuric acid, sodium carbonate, dichloromethane, deuterated chloroform, hexane, hexadecanol, phenol, pentadecane, and FAME mix were obtained from Merck (Darmstadt, Germany). 2-Piperidone and 4-Methyl-indole were purchased from Acros Organics (Acros Organics, Bridgewater, NJ, USA). Hexadecanamide was purchased from Cayman Chemicals (Ann Abor, MI, USA).

2.2. Pre-Treatment

The pre-treatment of MSS was conducted according to the procedure shown in Figure 1A. The used test rig is schematized in the Supplementary Material in Figure S1. It was constructed in-house and consists of a fixed bed reactor (FBR) with reactor volume of 100 mL (diameter = 42 mm, length = 72 mm) and a fritted sinter metal with a pore size of 200 µm to retain the MSS. The reactor was surrounded by an aluminum block heated by cartridges. The leaching agent was pumped into the FBR by an HPLC Pump (PrepStar SD-1, Agilent Technologies, Santa Clara, CA, USA). Subsequently, the leachate was cooled to room temperature with a heat exchanger while the pressure was regulated manually by a backpressure valve.
In one experiment, approximately 30 g of MSS powder was loaded into the reactor. All experiments were performed at 2 MPa reactor pressure to prevent the evaporation of water. After the FBR has been flushed with 75 mL of deionized water with a flow rate of 15 mL·min−1 the feed was switched to 5 mL·min−1 leaching agent, 0.5 M sulfuric acid (SA), 0.5 M or citric acid (CA), and heated 70 min to 150 °C and kept there for 30 min. The molarity of citric acid and sulfuric acid were assumed to be comparable, as organic acids tend to dissociated incomplete. Then the liquid flow was switched back to de-ionized water and the flow rate was increased to 10 mL·min−1 for additional 100 min to wash out residual leaching agent. Similar procedure was conducted with pure de-ionized water (DW) as a blank. During this treatment, every 10 min and between min 50 and 70, every 5 min a sample of 2 mL was taken and filtered with a 0.45 µm Teflon syringe filter to remove high molecular weight impurities, subsequently stored below 5 °C until analysis. The treated MSS was subsequently dried at 105 °C for 24 h and then ground to 200 µm. The experiments were performed in triplicates for every leaching agent. The resulting pre-treated solids were labelled as “DW-Solid,” “SA-Solid,” and “CA-Solid.”

2.3. Hydrothermal Liquefaction

The HTL experiments were conducted according to the procedure schematized in Figure 1B As reaction vessels, in-house build autoclaves (Stainless steel, EN 1.4571) with a capacity of 25 mL were used. To start an experiment, they were filled with a solution containing raw or pre-treated MSS and 0.1 M sodium carbonate (Na2CO3) solution occupying 60 % of the available volume (solid load of approximately 15 wt. %). The Na2CO3 was added to raise the pH into an alkaline reaction environment. The headspace was purged with nitrogen three times and pressurized to 1 MPa, which facilitate the product gas collection after the experiment. The autoclaves were then sealed with a torque key. In one run, six autoclaves were placed into an isothermal fluidized sand bath (SBL 2, Techne, Stone, UK [32]), set to a temperature of 350 °C, resulting in a reaction pressure of 20 MPa according to the gas saturation pressure of water [33]. The heating rate inside was measured previously as 40 K·min−1, resulting in a heating time of 8.75 min. After attaining the reaction temperature, it was held for 20 min. Afterwards, the reactors were rapidly cooled down in a water bath for 10 min. HTL experiments on raw MSS were denoted as “MSS-HTL” and on pre-treated solids “DW-HTL”, “SA-HTL”, and “CA-HTL” respectively. All experiments were again conducted in triplicates.
After the reaction procedure, the autoclaves were opened in a gas collection system with a known volume and attached manometer (Swagelok, Solon, OH, USA). An aliquot of 100 µL was taken with a gas-tight syringe for further analysis by gas chromatography, equipped with a 2 m Molsieve 5 Å and a 2 m Porapak Q column to flame ionization detector (FID) and thermal conductivity detector (TCD), respectively. The ideal gas law was applied to calculate the total mass of the gas, considering its final pressure after the HTL experiment and its composition.
The residual HTL products in the reactor was mixed with 5 mL dichloromethane (DCM) and separated by a Büchner funnel (47 mm diameter, 0.45 µm pore size, Nylon, Whatman, GE Healthcare, Buckinghamshire, UK). Then, the reactor and filter residue was washed exhaustively with 45 mL DCM. Retained solids including the filter paper were dried overnight at 105 °C. To support the separation of the aqueous phase and the organic phase, the mixture was centrifuged at 7000 rpm (EP 5430, Eppendorf AG, Hamburg, Germany) for 5 min. Subsequently, the aqueous top layer was removed with a syringe and stored below 5 °C for further analysis. DCM in the residual organic phase was removed overnight under a gentle nitrogen stream.

2.4. Bulk Analysis of Feedstock, Pre-Treated Solids and HTL-Products

The carbon, hydrogen, nitrogen, and sulfur content of the feedstock, pre-treated solids and biocrude as well as solid products were analyzed using a CHNS-Analyser (Vario EL cube, Elementar Analysetechnik GmbH, Hanau, Germany). Further inorganic constituents were analysed by inductively coupled plasma optical emission spectrometry (ICP-OES) (ICP-725; Agilent Technologies, Santa Clara, CA, USA), after microwave-assisted acid digestion in reverse aqua regia (mixture of nitric acid and hydrochloric acid in molar ration of 3:1). Carbon and nitrogen content in aqueous samples were determined by TOC and TNb analyzer (DIMATOC 2100 and DIMA-N, Dimatec Analysetechnik GmbH, Essen, Germany).
The storage moisture and ash content of the feedstock were determined by drying the sample at 105 °C and incinerating 500 mg of sample in an automated thermogravimetric analyzer (TGA701, Leco, St. Joseph, MI, USA) at 550 °C under air.
The content of crude lipids (saponifiable and unsaponifiable lipids) in the MSS and pre-treated solids was determined by an n-hexane soxhlet extraction [34]. Therefore, 1 g of dried solid sample was put into a cellulose extraction thimble (Whatman, GE Healthcare, Buckinghamshire, UK) and refluxed for 12 h. After extraction, the hexane was removed in a rotary evaporator (40 °C and 50 mbar), weighing the remaining extract to determine the extraction yield. Additionally, 17 amino acids, including alanine (Ala), arginine (Arg), aspartic acid (Asp), cysteine (Cys), glutamic acid (Glu), glycine (Gly), histidine (His), leucine (Leu), lysine (Lys), methionine (Met), phenylalanine (Phe), proline (Pro), serine (Ser), threonine (Thr), tyrosine (Tyr), isoleucine (Ile), and valine (Val) were detected, following hydrolysis the procedure EC-Regulation 152/2009 F [35]. Briefly, proteins were hydrolyzed by 6N HCl for 24 h at 110 °C. Subsequently, the amino acids (except tryptophan) were determined via HPLC on a sulfonated polystyrene resin column.

2.5. Chemical Composition of Biocrude

To identify and determine the chemical composition, the biocrude was analyzed by a gas chromatograph (GC, Agilent 6890N, Santa Clara, CA, USA) coupled with a mass spectrometric (MS, Agilent 5973N, Santa Clara, CA, USA) and flame ionization detector on an RTX-5MS column (30 m × 0.25 mm × 0.25 mm, Restek Corporation, Bellefonte, PA, USA). All samples were prepared in tetrahydrofuran (THF). 0.5 µL were injected at 280 °C in splitless mode, using helium as carrier gas (1.5 mL·min−1). The column oven program started at 70 °C which was held for 2 min and progressing at 8 K·min−1 until 180 °C and 4 K·min−1 until 280 °C followed by a hold time of 15 min. For identification, the Agilent deconvolution was applied. A Polyarc® micro-reactor (Activated Research Company, Eden Prairie, MN, USA) was installed before the FID detector to enable a direct quantification of identified compounds [36]. For each compound class, a representing compound was chosen: phenol for cyclic-O, valerolactam and skatol for cyclic-N, hexadecanol for aliphatic-O, and hexadecanamide for aliphatic-N was chosen and previously confirmed by the retention time with the pure standard chemical. Pentadecane was applied as a general internal standard.
For quantification, free fatty acids were transesterified to FAME (Fatty Acid Methyl Ester) in order to prevent potential decarboxylation into hydrocarbons during GC-injection. Therefore, a modified method developed by Lepage and Roy [37] was applied. A stock solution containing 500 ppm pentadecane and 50 ppm butylated hydroxytoluene (BHT) was prepared in methanol-hexane (4:1 vol/vol) mixture. Approximately 20 mg of biocrude sample were prepared in a borosilicate glass vial and 500 µL of the stock solution was added. The vials were placed on ice and 100 µL acetyl chloride was added dropwise and then capped under nitrogen. To accelerate the reaction, the vials were placed in an oven for 2 h at 80 °C. After the vials were cooled to room temperature, 1 mL of 0.05 M Na2CO3 solution and 500 µL was added, vortexed for 1 min and subsequently centrifuged for 5 min at 7000 rpm. The upper hexane phase (200 µL) was transferred to a GC vial, analysed by GC-MS, and quantified with the previously mentioned Polyarc® micro-reactor. For the integration of peaks and area determination, Agilent’s Mass Hunter internal Chemstation integrator was used (Agilent Technologies, Santa Clara, CA, USA).
Functional groups in the biocrude were semi-quantitatively analysed at room temperature by nuclear magnetic resonance spectroscopy (NMR), recorded on a Bruker 250 MHz NMR (Biospin 250, Bruker, Rheinstetten, Germany). Sample preparation consisted of dissolving 0.1 g of biocrude in 0.7 mL of deuterated chloroform with tetramethylsilane as an internal standard. Before loading the 5 mm NMR-tubes, the solution was filtered through a 0.22 µm syringe filter (Spheros PFTE, LLG Labware, Turnov, Czech Republic), removing suspended particles. 1H spectra were acquired in a 90° pulse angle with a delay of 1s, 126 scans and a spectral width of 3400 Hz. The resulting signals were processed and integrated with MestReNova 14.1.2 (Mestrelab Research S.L., Santiago de Compostela, Spain). For the integration and functional group assignments, regions for the 1H spectra were given by Mullen et al. [38]. Signals from residual DCM (δ = 5.30 ppm) and a trace of non-deuterated chloroform (δ = 7.26 ppm) and their related areas were excluded by deconvolution [39].

2.6. Calculations

The product yields of biocrude, solid and gas phases were calculated by Equation (1).
Y i   ( d r y ,   a s h   f r e e ) = m i m s l u d g e   s o l i d m a s h m m o i s t u r e
where Y is the yield (wt. %), the index i is the corresponding phase (biocrude, aqueous phase, gas or solid) and m is the mass (g) of the product or feedstock.
The carbon or nitrogen recovery of biocrude, solid, gas, and aqueous phases were calculated by Equation (2).
ER i =   m i · E i m s l u d g e   s o l i d · E s l u d g e   s o l i d
where ER is the element recovery (carbon or nitrogen), the index i is the corresponding phase (biocrude, aqueous phase, gas or solid), m is the mass (g) and E is the element concentration (wt. %). It needs to be noted that the mass of water was defined as constant and formation or consumption of water due to condensation, hydrolysis or water gas shift reactions, were considered as negligible.
A commonly applied expression to characterize the fuel quality of petroleum is the H/C ratio. For biomass-derived fuels, a modified descriptor (H/Ceff), given elsewhere [40], is applied on each sludge solid and biocrude. To get a petroleum-like fuel, the heteroatoms oxygen, nitrogen, and sulfur can be removed as water (H2O), ammonia (NH3), and hydrogen sulfide (H2S), respectively, developing Equation (3).
H / C eff = H 2 O 3 N 2 S C
where H/Ceff is the effective hydrogen to carbon ratio, where H, O, N, S, and C represent the element concentrations of hydrogen, oxygen, nitrogen, sulfur, and carbon, respectively.
A change indicator (CI) was calculated to evaluate the effect of pre-treatment on the derived biocrude. CI compares the concentration of specific compounds quantified by GC in the biocrude with and without pre-treatment. A negative CI value indicates a lower, a positive CI value a higher amount of the specific compound. Is the CI value close or equal to zero, there is essentially no effect.
CI i = C i , p r e t r e a t m e n t C i , n o   p r e t r e a t m e n t C i , n o   p r e t r e a t m e n t
CI is the change indicator; index i is the specific compound; Ci,pre-treatment is the concentration of component i in the HTL derived biocrude of a pre-treated sludge and Ci,no pre-treatment is the concentration of the biocrude from blank sewage sludge.
For all calculations, the propagation of uncertainty is taken into account.

3. Results

3.1. Effects of Pre-Treatment on Sewage Sludge

Table 1 summarizes the results of the proximate analysis and the elemental, biochemical and ash composition of the MSS and the pre-treated solids. The results show that the MSS has an organic content of 70.0 wt. %, which decreased to 61.9 wt. % by hydrothermal pre-treatment with DW or increased to 75.3 wt. % by treatment with CA, while SA had no notable effect. Due to the different organic content, certain values of the MSS and its derived pre-treated solids are given on a dry ash-free basis for better comparison. It was found that the carbon content of MSS increased due to a hydrothermal treatment from 52.8 wt. % up to 59.4 wt. %, in CA-Solid. On the other hand, the nitrogen content decreased from 7.1 wt. % down to 3.1 wt. %, most effectively by applying SA. Similarly, the oxygen content is reduced, especially after adding acids. It needs to be mentioned that SA treated sludge shows an increased S content of 3.1 wt. %, which can be present as sulphate, but is potentially bound to some organic compounds [29]. The pre-treatment has lowered the N/O ratio and indicates a prioritized extraction of N. In addition, the H/Ceff ratio is derived from the elemental composition. Pre-treated solids show a significant higher H/Ceff, risen from 0.55 up to 0.67.
Nevertheless, the extraction of N and a potential quality improvement came with a loss of solid organic matter. All pre-treatments indicate a decrease in solid yield. The application of DW and SA shows a solid yield of 54.8 and 52.8 wt. %, while CA has a solid yield of 63.4 wt. %. An increasing temperature led to a higher degree of solubilization of organic material by hydrolysis reactions to form smaller, water-soluble fragments [41]. This can be accelerated by adding an acid [42]. Figure 2 shows the extent of C and N recovery in the solid and aqueous phase. For further information, the extraction of C and N into the aqueous phase is depicted in the Supplementary Materials, Figure S2. The treatment with DW and CA shows very similar carbon recoveries into the solid phase. The maximum recovery of C and N in the aqueous phase is achieved by the SA treatment; up to 34.1 wt. % and 66.7 wt. %, respectively. In summary, more nitrogen than carbon is extracted during the pre-treatment into the aqueous phase, which can be increased by the addition of an acidic agent. The amount of hydrolysable amino acids is lowered due to a pre-treatment with DW from 21.8 wt. % to 13.5 wt. % and the application of an acidic agent halve this amount to 10 wt. % in the SA-Solid and 9.3 wt. % in the CA-Solid, respectively. The specific amino acid composition is listed in the Supplementary Materials, Table S1. All hydrothermal pre-treatments, no matter if DW, SA, or CA is applied, lessen the amount of all amino acids. Similar observations on the amino acid composition were made by Chen et al. [43]. This observed change occurs more or less congruently with the nitrogen extraction and the reduction of the N/O ratio. It needs to be pointed out that the chosen temperature of 150 °C was indicated as a threshold for protein transfer into the supernatant [44,45]. In addition, the release of NH4+ by deamination reactions is often referred [46,47]. Concerning more fundamental studies, proteins are hydrolyzed into peptides, which then hydrolyze usually slowly to amino acids [48]. This can be accelerated significantly by applying hydrothermal conditions or even more by adding acids [49]. With increased temperature, amino acids start to decompose under deamination reactions or form together with carbohydrates water-soluble Amadori compounds via Maillard reactions [50,51,52].
To visualize the effect of the pre-treatment, Figure 3 shows two Van Krevelen plots. Figure 3A shows the O/C to H/C ratio and Figure 3B the N/C to H/C ratio of the produced solid materials. Additionally, the directions for removal of water, carbon dioxide, and ammonia, which are typical reactions during the hydrothermal pre-treatment are drawn. Apparently, in Figure 3A the step from MSS to the solids after pre-treatment is primarily following a dehydration pathway. This phenomenon is typical for lower temperature regimes and can be observed via the formation of hydrochar [53]. The SA-solid shows a slight tendency toward decarboxylation. SA suggests to cause some sort of severity to the reaction, as it is a potential oxidizing inorganic acid. From Figure 3B, it can be observed that the step from MSS to the solid pre-treatment products essentially follows the deamination pathway. In summary, acid-treated solids show a higher degree of dehydration and deamination compared to treatment in water only.
As shown in Table 1, the amount of crude lipids is increased from 21.7 wt. % in MSS up to 29 wt. % in SA-solid. Again, both acidic pre-treatments here show the biggest effect. The lipid content increased congruently with the solubilization of organic matter in the aqueous phase. This could be explained by a favored extraction of proteins and carbohydrates. Bougrier et al. and Li et al. reported negligible or even no influence on the solubility of lipids, even with moderately elevated temperatures [44,54]. Furthermore, the significant higher H/Ceff value of the pre-treated solids can be referred to its lipid content, as lipids are primarily composed of fatty acids with long-chain –(CH2)n– units that contain much fewer heteroatoms than carbohydrates and proteins.
In Table 1 the ash composition of the MSS and the DW, SA and CA solids is given in terms of the main inorganic elements. The pre-treatment with DW shows no effect on the composition, while SA and CA substantially leached calcium (Ca), iron (Fe), magnesium (Mg), and phosphor (P). The Ca amount in the SA solid needs to be mentioned, as it was not as effectively removed as in the CA solid. With regard to the sulfur content from the elemental analysis, this suggests the precipitation with sulphate (SO42−), supplied from the SA, to form calcium sulphate (CaSO4). This would explain why the ash is not reduced. Here it needs to be notified, that the subsequent water washing step was not able to remove all acidic residues, especially when using SA [55]. In summary, the pre-treatment with CA removed most of the inorganic constituents, while DW only solubilizes organic matter.

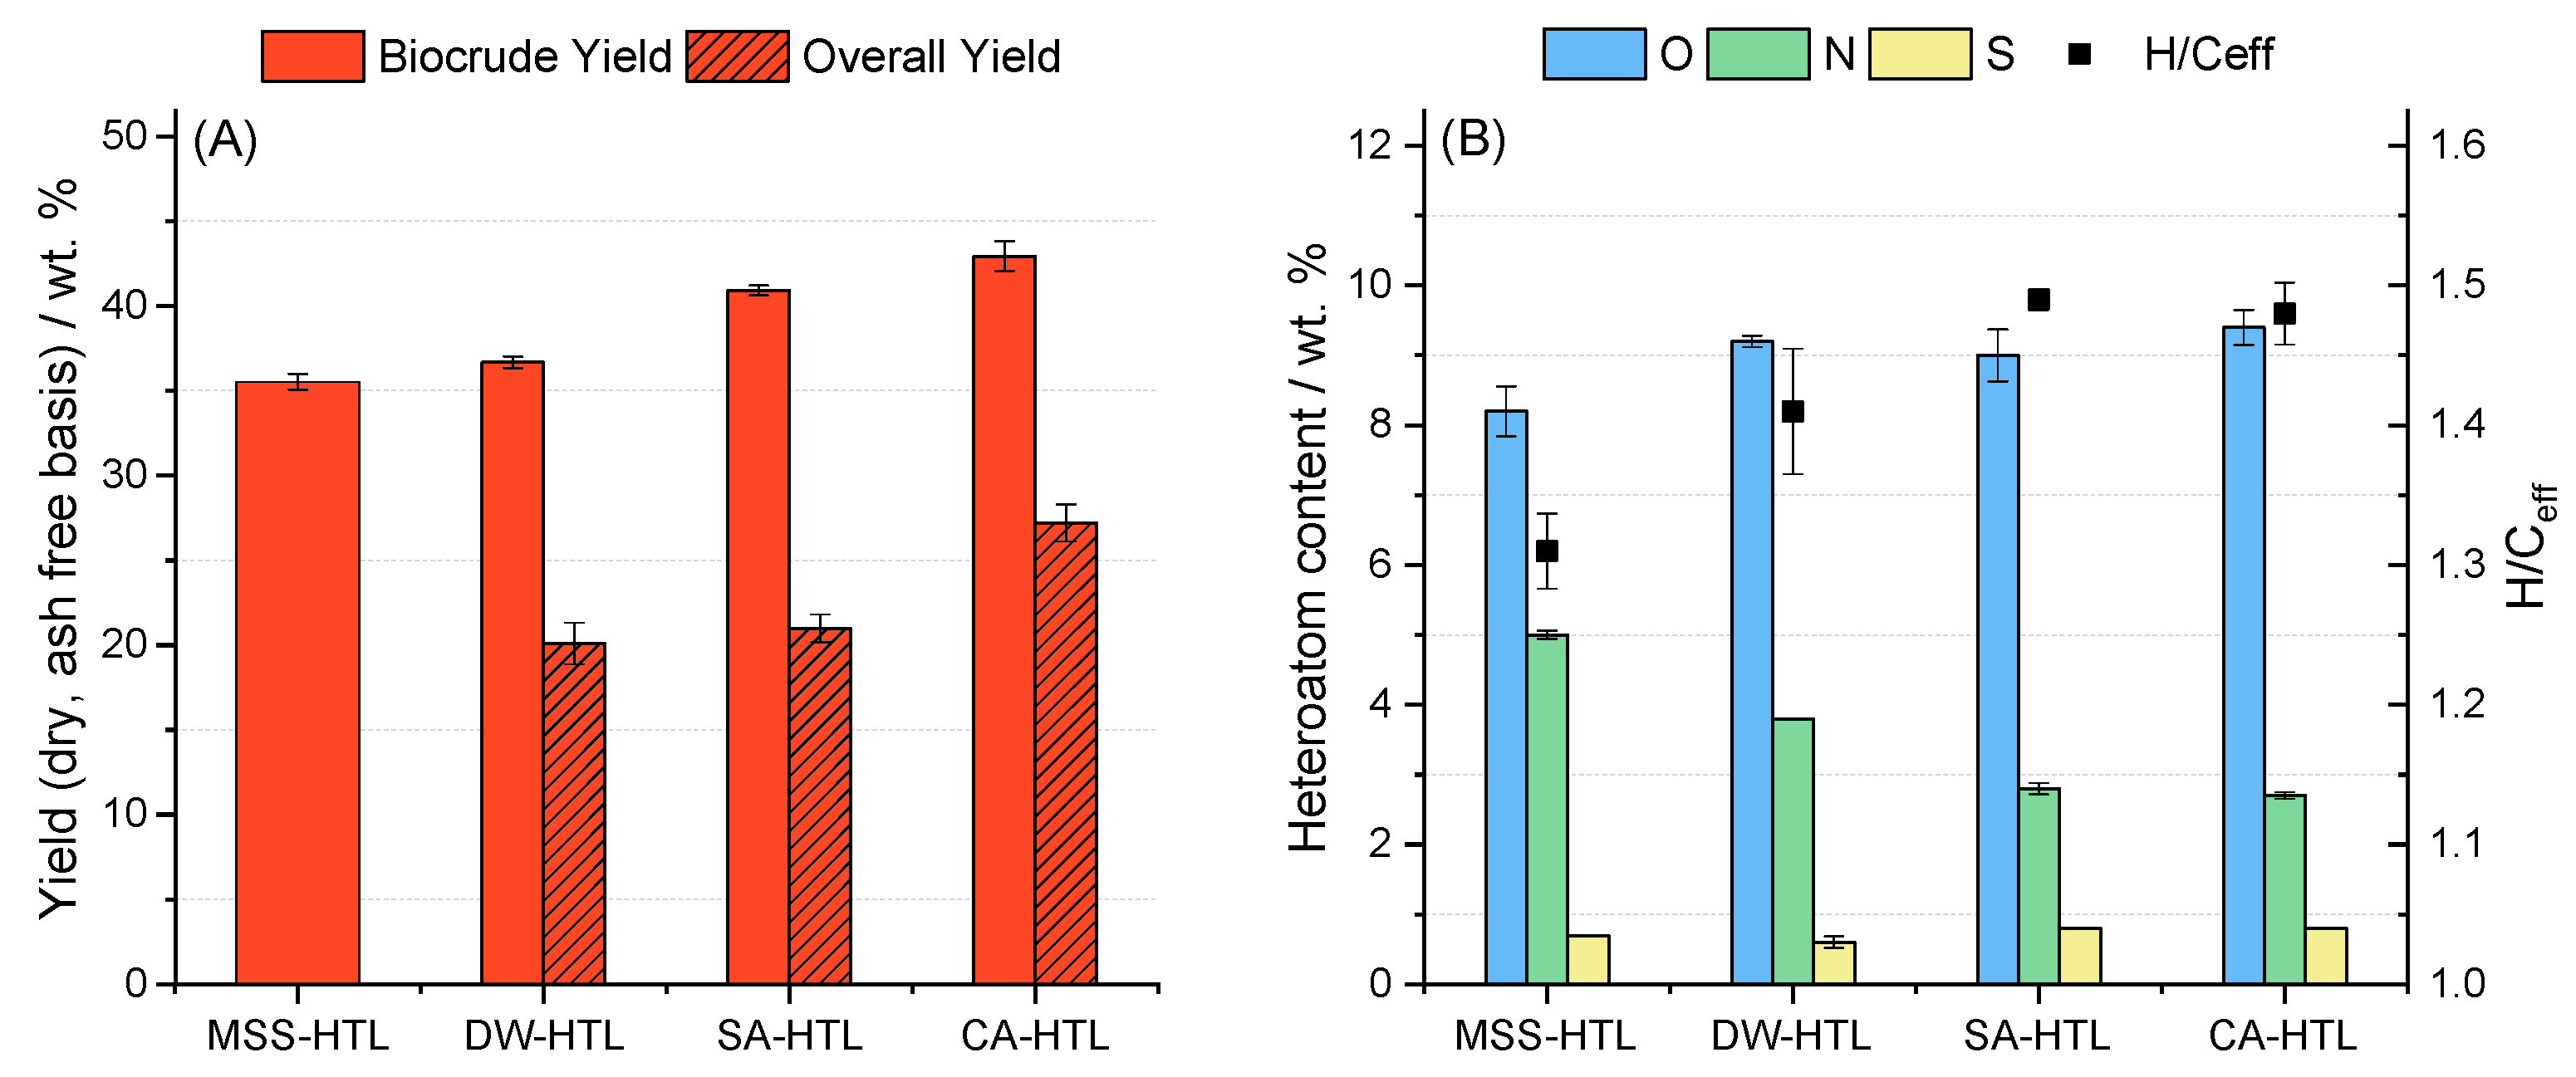
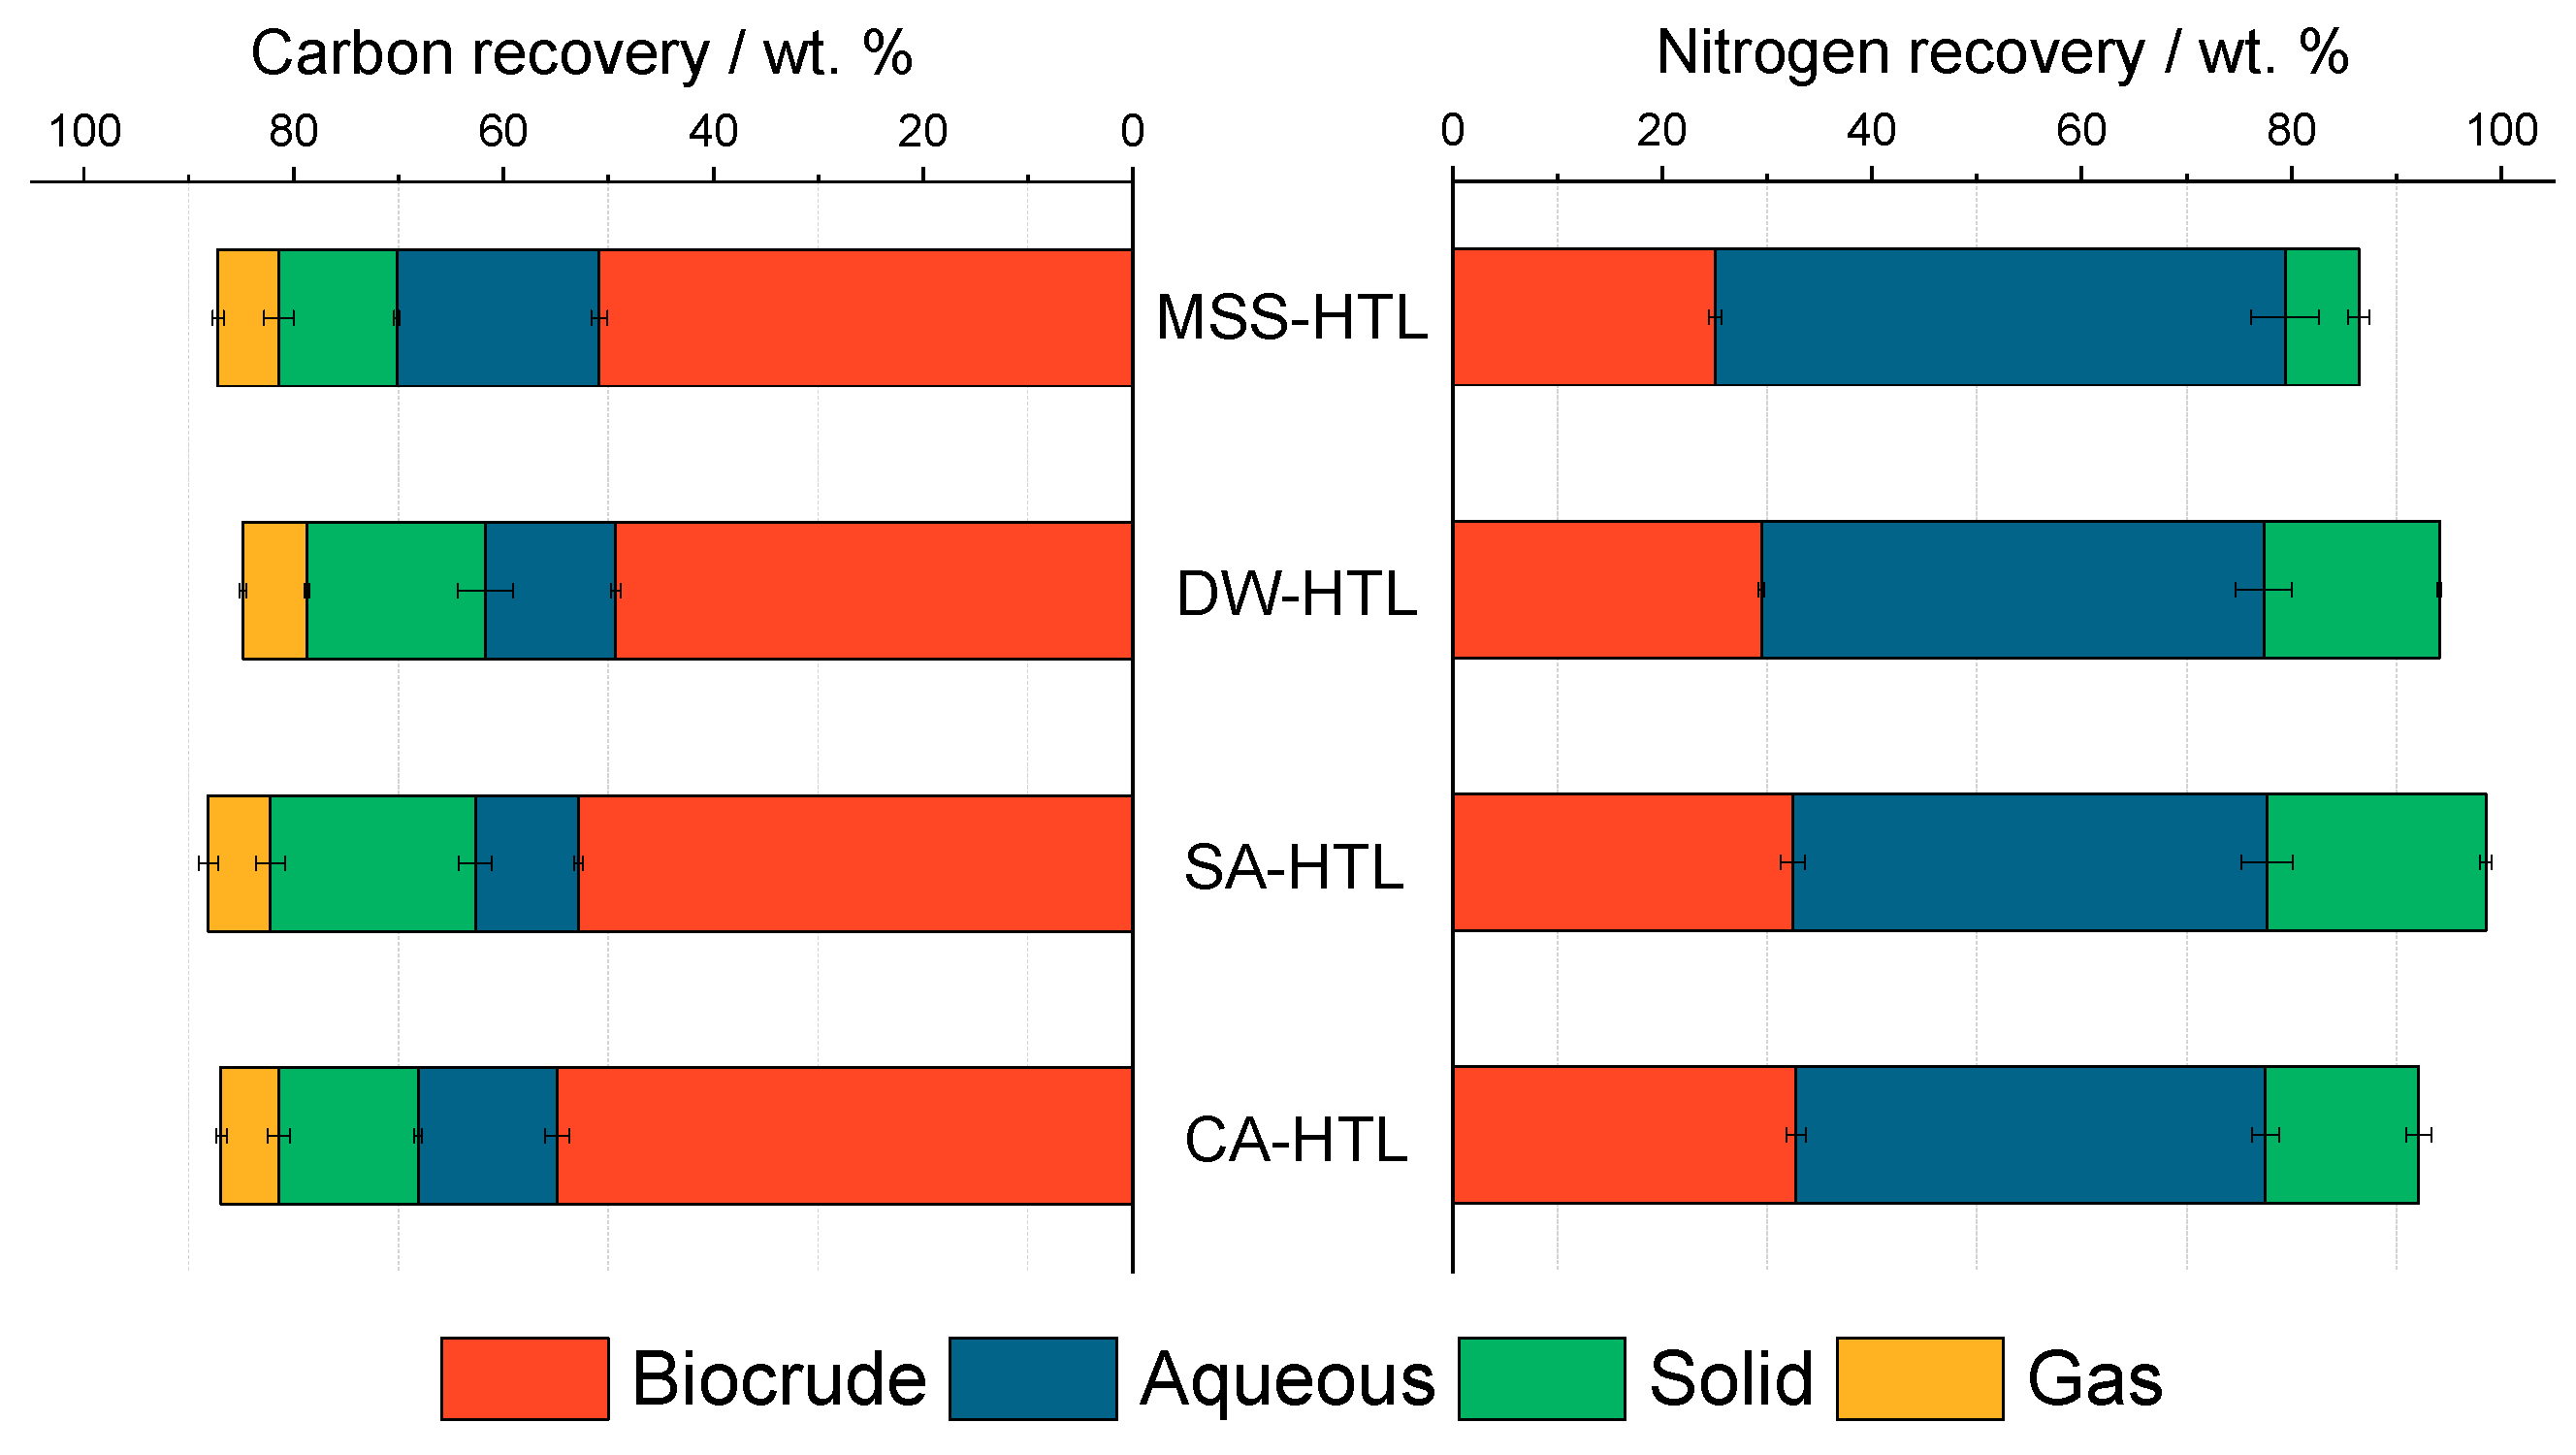
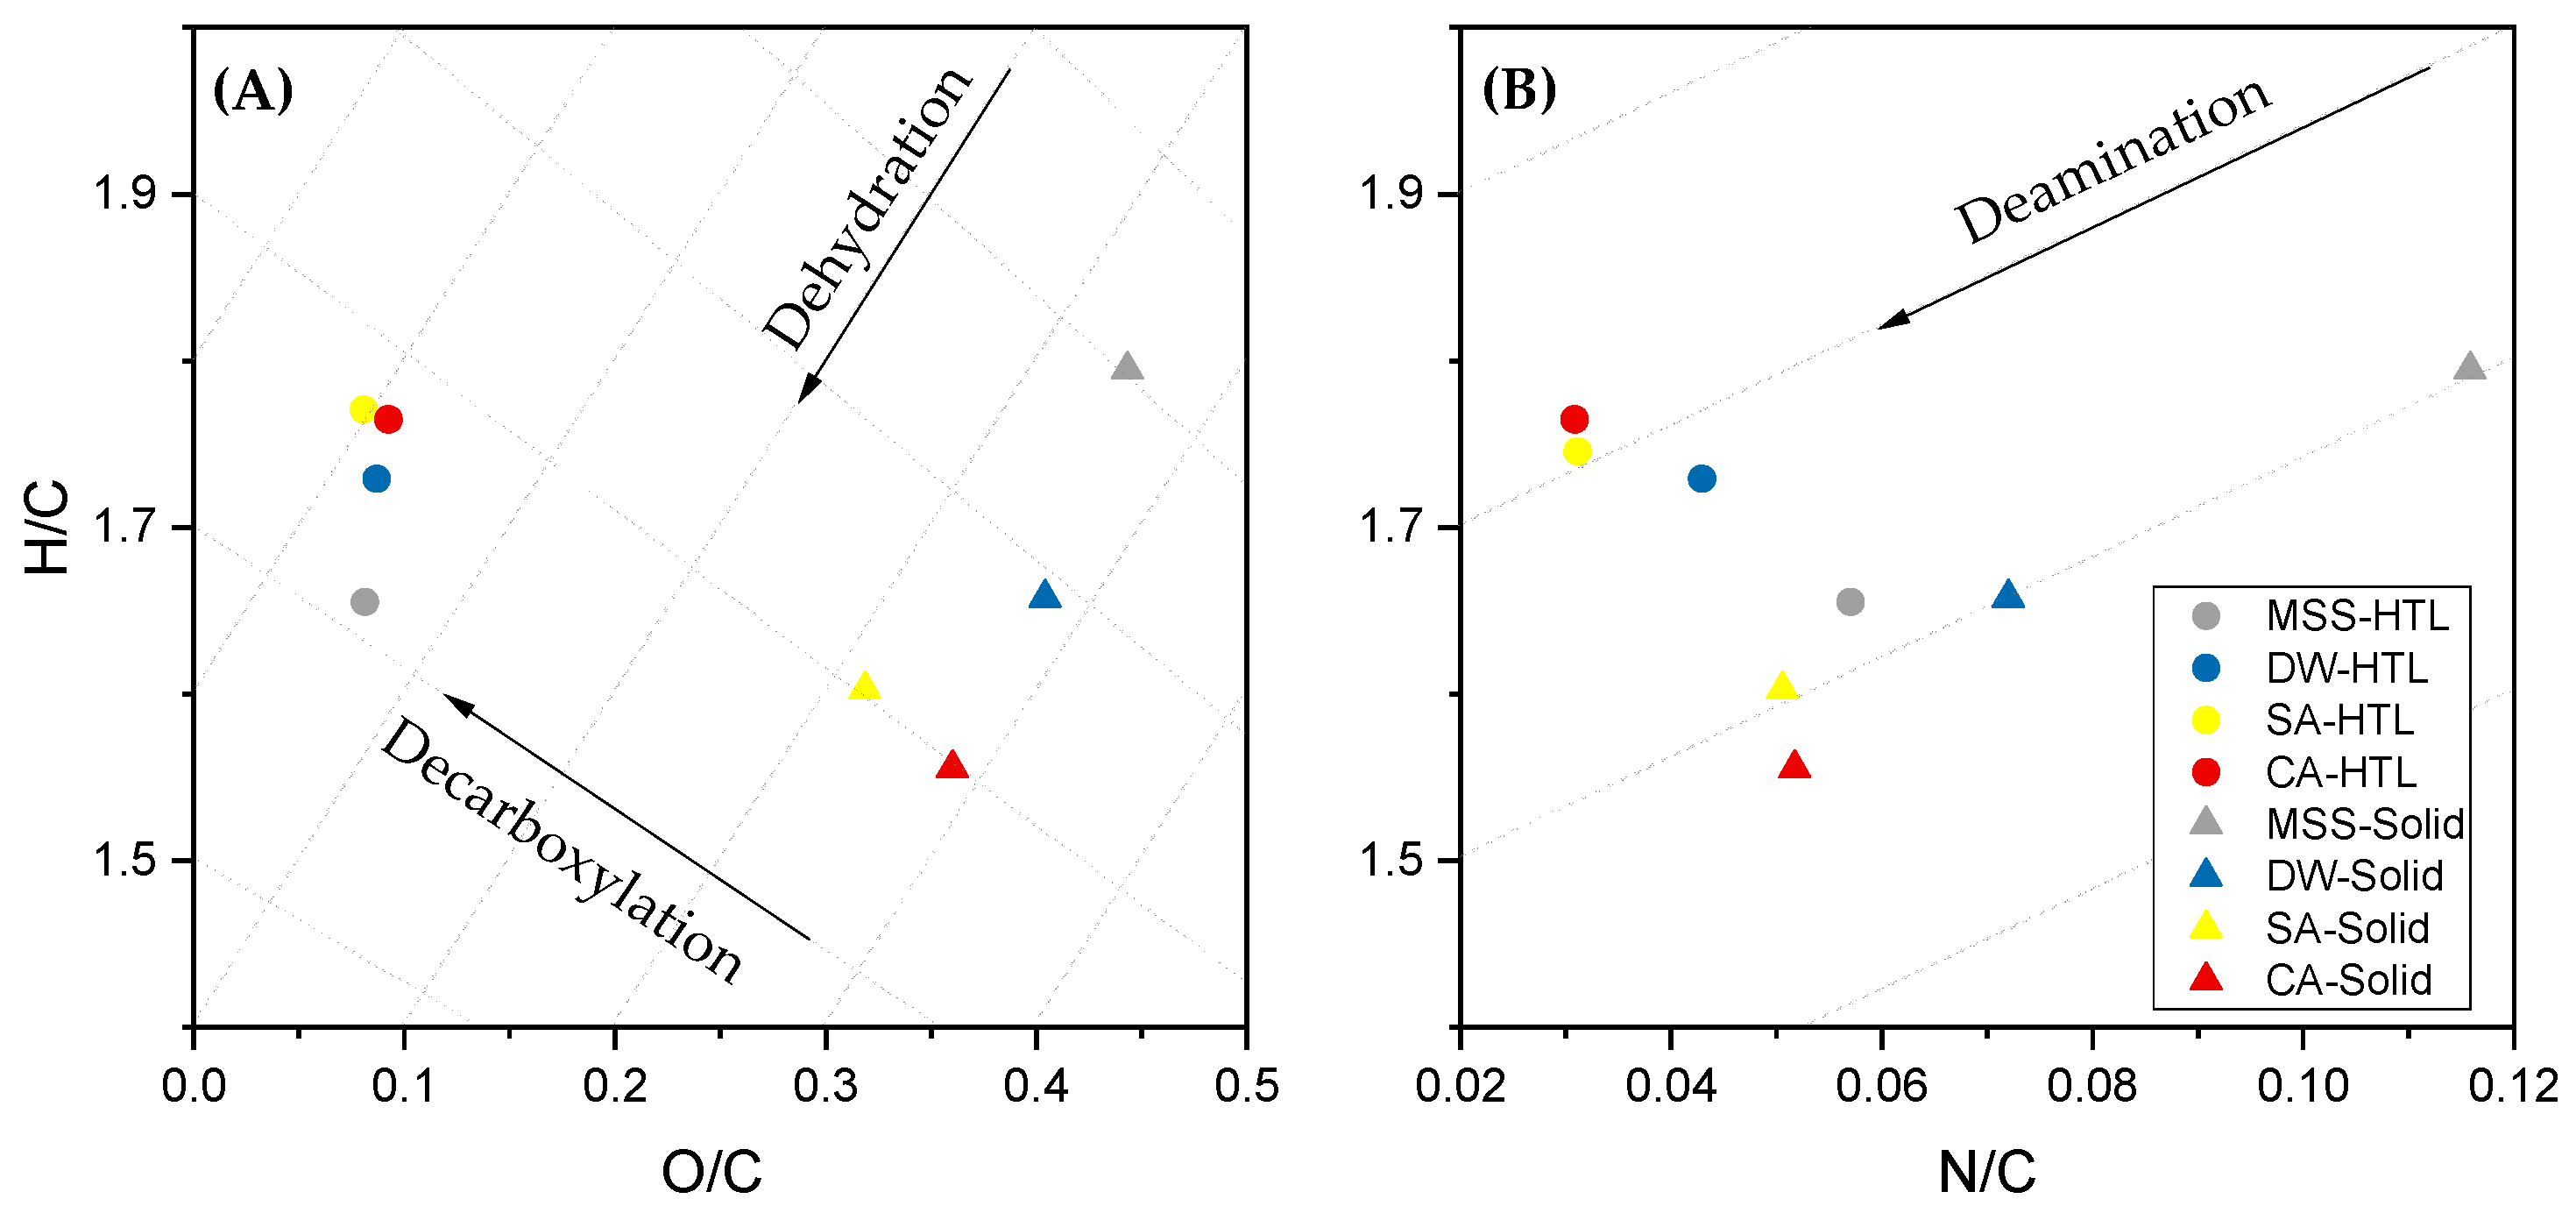
3.2. Effect of Pre-Treatment on the Yield and the Elemental Composition of HTL-Products

The obtained solids from the pre-treatment step were again hydrothermally processed at fixed temperature, reaction time and solid load of 350 °C and 30 min and 15 wt. %, respectively. As mentioned above, the solids tend to contain residual acidic compounds, thus Na2CO3 is added as an alkaline agent to facilitate the reaction towards the favored biocrude product. First, an acidic reaction condition is reported to increase the repolymerization of intermediates and the formation of undesired solid char [56]. Second, carbonates are believed to lead to a higher degree of deoxygenation and lastly the alkali salts, which may catalyze the fragmentation of macromolecules [57,58]
One important measure of HTL performance is the biocrude yield. As shown in Figure 4, it was found that hydrothermal pre-treatment increases the yield. For DW-HTL derived biocrude the yield is slightly increased to 36.6 wt. %, compared to the one obtained with direct HTL of MSS. It is also shown that an acid pre-treatment results in significantly more HTL biocrude; 39.4 wt. % for SA-HTL and 42.9 wt. % CA-HTL. An explanation for the reduced biocrude yield of MSS- and DW-HTL, could be the reported higher content of metals in the MSS and the DW-Solid. In a study by Chen et al., metals in the are reported to reduce the biocrude yield of HTL of wastewater algae [59]
However, Figure 4A also shows the overall yield related to the MSS feedstock, which is significantly lower when compared to the biocrude yield which results from HTL of pre-treated material. The overall yield does not only depend on the efficiency of converting the pre-treated solids to biocrude but also their production from the original MSS feedstock. Thus, the extraction of organic matter during pre-treatment makes the difference. With regard to the extensive solubilization during the pre-treatment, DW-HTL shows the lowest overall yields with about 20.1 wt. %, while SA-HTL shows a slightly higher value with 21.0 wt. %. The CA-HTL has the highest overall yield over both process steps with 27.2 wt. %. Jazrawi et al. observed a similar trend in two-stage hydrothermal processing on algae [29]. The extraction of organic matter significantly lowered the overall yield. In contrast to the findings here, Jazrawi et al. found a much lower overall yield for the acidic pre-treated solids [29].
With the first view on the yield this process seems disadvantageous, therefore quality evaluation values and chemical composition are presented and discussed in detail below. Furthermore, the aqueous supernatant of the pre-treatment is an untapped issue but could be valorized in anaerobic digestion, as thermal hydrolysis processes are commonly applied in wastewater treatment plants [23,47].
Regarding the elemental analysis of the biocrude products obtained from HTL in Table 2, it was found that the carbon and hydrogen content was greatly increased in comparison to the MSS and the related solids from pre-treatment, while the heteroatoms were removed by HTL. Especially the nitrogen content of the bio-crude from pre-treated solids was reduced. In contrast, the oxygen content is slightly increased, probably due to acid residuals [60]. The effects on the elemental composition have emerged in the H/Ceff ratio, which is necessarily increased for the biocrude from the pre-treated feedstock. Elemental composition and derived H/Ceff ratio are shown in Figure 4. Generally, the increase of the H/Ceff from feedstock to biocrude can be attributed to the reduction of oxygen. The further increase for the pre-treated biocrude is associated with lower nitrogen content. Yoo et al. refer a dependency of the H/Ceff value to the biochemical composition of his feedstock algae, in particular a higher lipid content of the feedstock [61]. This suggestion can be applied especially to SA-HTL and CA-HTL It is also noteworthy to mention the absent elevation of sulfur content in the SA-HTL biocrude because the SA-Solid contained more than three times more sulfur, whereas the biocrude of SA-HTL and CA-HTL contain the same proportion of S.
Figure 5 depicts the carbon and nitrogen recovery into the different product phases, namely biocrude, aqueous phase, solid and gas in the HTL step. It can be found that carbon is mainly recovered in the biocrude. MSS-HTL, in comparison to the DW-HTL, shows a small decrease in carbon recovery from 50.9 wt. % to 49.3 wt. %. The acid pre-treatment increases the C-recovery in the biocrude SA-HTL and CA-HTL to 52.8 wt. % and 54.9 wt. %, respectively. The carbon recovery in the aqueous phase is lowered for all pre-treated samples, while it is increased for the solid. Here it needs to be noted, that the aqueous phase of MSS-HTL shows an alkaline pH value of 9.5; however, for DW-, SA- and CA-HTL aqueous phase the pH was almost neutral. As previously mentioned, the SA-solids are believed to contain acidic residues, which aids the formation of a char. Therefore, SA-HTL shows the lowest carbon recovery in the aqueous phase and the highest in the solid. Another explanation for the lower recovery of soluble carbon compounds in the aqueous phase is the upstream removal of carbohydrate and protein oligomeric structures, as their monomers are likely solubilized in the aqueous phase. In terms of gas formation, no significant differences can be observed. For all samples, the C recovery could not be closed to 100 wt. % as light volatile compounds are probably lost during the evaporation of DCM. The nitrogen recovery, on the other hand, behaves differently. MSS-HTL shows the lowest nitrogen recovery with 25.1 wt. % and increases with the application of a pre-treatment to 32.5 wt. % for SA-HTL and 32.7 wt. % for CA-HTL biocrude. Recovery of nitrogen in the solid is increased analogously to the carbon recovery in the solid. Again SA-HTL shows here the highest value with 20.8 wt. %. For the aqueous phase, the nitrogen recovery seems to be more or less similar for the two-step HTL, but significantly lower for MSS-HTL. One explanation could be the formation of ammonium carbonate following the reactions (5) and subsequent decomposition (6) [62,63].
Na 2 CO 3 + 2 NH 4 +     ( NH 4 ) 2 CO 3 + 2 Na +
( NH 4 ) 2 CO 3 NH 3   +   CO 2   +   H 2 O
Pre-treated samples, on the other hand, likely contain acidic residuals, which instead react with the added Na2CO3. Thus, the free ammonium ion can react further into the biocrude fractions to form amines and amides and with a higher proportion of lipids, more fatty acids are formed. These are likely to react with free ammonia further to fatty acid amides [31]. In addition, the overall difference in total nitrogen recovery needs to be mentioned. As the products were separated via vacuum filtration, ammonium was potentially stripped off from the aqueous phase, especially at higher pH values.
In Figure 6, two Van Kreveln diagrams are presented. Figure 6A shows the O/C to H/C ratio and Figure 6B the N/C to H/C ratio. In addition to the MSS and the pre-treated solids, the derived biocrude samples are depicted. To identify the shift in elemental composition during HTL, again the directions for dehydration, decarboxylation, and deamination are drawn. With a look on (A), the HTL of MSS to the corresponding biocrude is following a combination of dehydration and decarboxylation reactions [64]. With the use of a water pre-treated solid DW-HTL, less dehydration takes place. This combination of reactions is mainly shifted to decarboxylation reactions with SA- and CA-HTL. As previously described, during each pre-treatment, the MSS is to a certain extend dehydrated, providing less opportunity for further dehydration reactions during the subsequent HTL. This would refer back to the suggested upstream removal of oligomeric like carbohydrates and proteins.
With regard to Figure 6B, similarities between dehydration and deamination can be observed. The HTL of MSS to the corresponding biocrude follows mainly the deamination pathway. However, for the DW-HTL the degree of deamination is reduced. The acid pre-treated solids are located perpendicularly on the deamination line to the derived biocrude SA- and CA-HTL. This indicates that deamination occurred in the pre-treatment and not in the HTL-step.

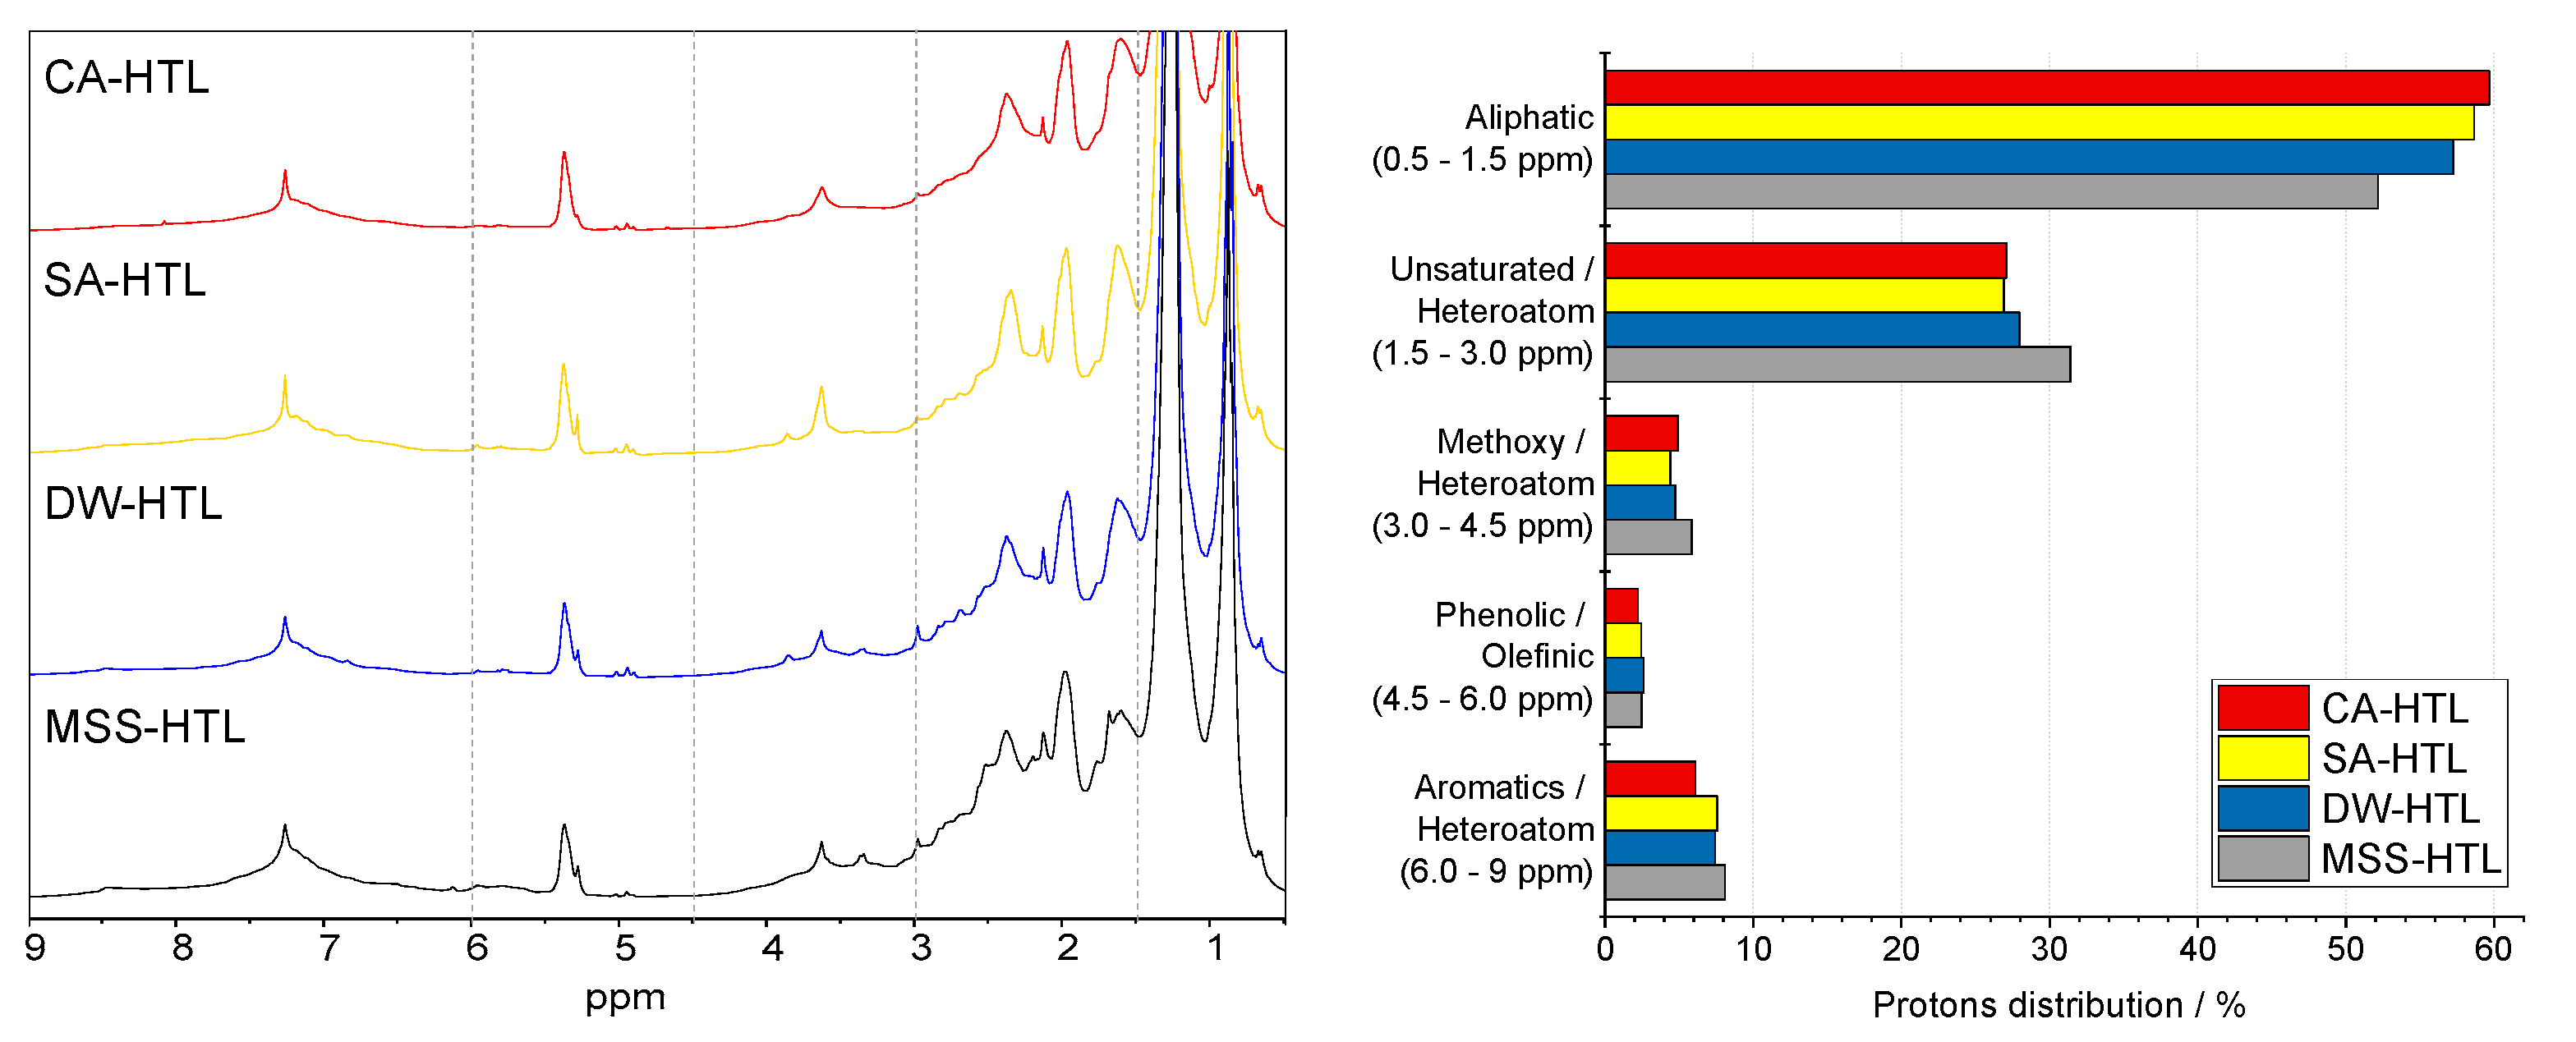
3.3. Effect of Pre-Treatment on the Chemical Composition of HTL-Biocrude

The results of the chemical characterization of HTL biocrude from MSS and the solids from pre-treatment show some markable differences, which are exhibited and discussed in this chapter.
In a qualitative analysis, applying GC–MS, more than 100 compounds were identified via deconvolution for each biocrude sample. The 30 major compounds (quantified by peak area) and their retention time (RT) are listed in Table 3. The total ion chromatogram (TIC) of each biocrude sample is provided in the Supplementary Materials, Figure S3. The identified compounds were allocated to eight chemical classes such as aliphatic alcohol, aliphatic alkene, fatty acid, fatty acid amide, ketones, N-heterocycles, phenols and sterols. In general, biocrude contains compounds with high molecular weight and boiling points and therefore only a fraction can be identified by GC–MS. Furthermore, compounds with a low boiling point have probably been lost due to the evaporation of the DCM solvent.
It can be noted that the lower boiling point range (RT < 17 min) of the biocrude consists mainly of cyclic and heteroatomic compounds. Cyclic ketones and phenols are detected in all biocrude samples and are likely to derive from proteins and carbohydrates [57,65]. The biocrude from direct HTL of MSS shows a major presence of cyclic amides like lactams and cyclic amines like indoles. These N-heterocycles are originated by the degradation of proteins Maillard reactions with sugars [66]. In comparison, the acid pre-treated samples indicate the presence of methoxy phenols, which are referred to as lignin decomposition products [67]. Along with the higher boiling point range (RT > 17 min), pre-treated samples show more long-chain alkenes and alcohols. Latter compounds are decarboxylation and hydrodeoxygenation products of fatty acids, which are highly abundant in all biocrude samples [68,69]. Moreover, the presence of fatty acid amides in all biocrude samples occurs from the reaction of fatty acids and NH3 and other decarboxylation products of amino acids [70]. Here it needs to be noted that approximately 70–80% of the area is related to the free fatty acids and the resulting derivates (aliphatic alkenes, aliphatic alcohols, fatty acid amide). Compounds at the end of the RT-scale are detected as poly-condensed structures, known as sterols, which are already present in sewage sludge [71]. The qualitative GC-MS results are in agreement with other authors, who reported HTL of sewage sludge [72,73]. Major compounds are oxygenated aromatics along with nitrogen-containing compounds like heterocycles or long-chain amides oils and sterols. When the sludge was rich in lipids, free fatty acids were found.
The effect of the pre-treatment on the HTL of MSS can be further elucidated by the Change Index CI of class representative compounds in the biocrude sample. Five compounds were chosen, namely phenol (phenols), 2-piperidione and 1H-indole, 3-methyl- (N-heterocycles), hexadecanol (aliphatic alcohols), and hexadecanamide (fatty acid amide). Additionally, all fatty acids were quantified via in-situ transesterification to FAME to prevent potential decarboxylation into hydrocarbons during GC-injection. The concentrations are listed in the Supplementary Materials, Table S3. With the CI in Figure 7, it can be noted that a pre-treatment with DW and SA reduced the amount of phenol in the derived biocrude by 18.1% and 20.7%, respectively. The concentration of 2-piperidone is significantly reduced by more than 70% in all pre-treated biocrude samples. In the same way, the amount of 1H-indole, 3-methyl is reduced by approximately 40%. Formation of 2-piperidone was probably following internal condensation reactions of amino acids followed by ring closure [74]. 1H-indole, 3-methyl can be derived from the degradation of tryptophan or other aromatic amino acids via pyrrole formation and subsequent cycloaddition [75,76,77]. Concerning the fatty acids and their alcoholic derivates, a significant increase can be observed.
DW-HTL and derived biocrude show a 25% increased content of free fatty acids, which can be further increased by more than 50% by acid pre-treatment. For hexadecanol, a hydrodeoxygenation product of hexadecanoic acid, the concentration is increased by 20.6% for DW-HTL and by 31.3% for CA-HTL. The highest increase of 52.9% was observed for SA-HTL. The content of hexadecane amide is slightly and non-significantly increased in DW-HTL biocrude. SA-HTL sample shows the highest increase of 17.9% of hexadecanamide. As acidic residuals in the SA-Solid are assumed, the pH is lowered during HTL, close to neutral. Referring to Fu et. al., the formation of amides is decreased under alkaline conditions [78].
As GC techniques are usually limited by vaporization temperature, 1H NMR was applied to have a better understanding of the complementary functional group distribution in the biocrude. The NMR-spectra and results of the semi-quantitative analysis are summarized in Figure 8. The region in 1.5–0.5 ppm represents aliphatic methyl- and methylene protons. The two most prominent peaks are located at 0.87 ppm (methyl, -CH3) and at 1.25 ppm (methylene -CH2-) protons in alkyl chains [38]. These protons sum up in DW-HTL to 57.2% and in SA- and CA-HTL samples to 58.6% and 59.7%, respectively. MSS-HTL sample exhibited the lowest alkane functionality with 52.1%. These results were attributed to the high lipid content in the feedstock. Occurring shifts in the region 3.0–1.5 ppm are related to protons in β-position (1.5–1.8 ppm) and α-position (1.9–3.0 ppm) in N- and O-containing functional groups like linear or branched amides and non-aromatic heterocyclic compounds [79]. MSS-HTL shows with 31.4% the highest contribution of protons, which verifies the higher nitrogen content in the biocrude. The results are in good agreement with the GC-MS qualification. The distinguished peak at 3.6 ppm in the region 4.5–3.0 ppm is due to methoxy groups [80]. SA-HTL shows the lowest contribution of protons, which is unexpected as this sample shows plenty of methoxy phenolic compounds by GC-MS. Protons in the hydroxyl group of phenols are represented at 5.4 ppm, together with olefinic bound protons with a triplet at 5.0–4.9 ppm as found in unsaturated fatty acids they are summed up in the region of 6.0–4.5 ppm. No significant differences can be observed among the different biocrude. In the region of 9.0–6.0 ppm, the aromatic and heteroaromatic functionalities were observed in all biocrude samples. This is again in agreement with the by GC-MS detected indoles.

4. Conclusions

Municipal sewage sludge, was pre-treated hydrothermally with three different agents namely de-ionized water, sulfuric acid, and citric acid at set reaction conditions. In a subsequent stage, the residual solids were converted to biocrude via HTL and compared to the direct HTL derived product. By applying detailed multi-method characterization of the solids derived from pre-treatment and products from HTL the following conclusions can be drawn:
(1)
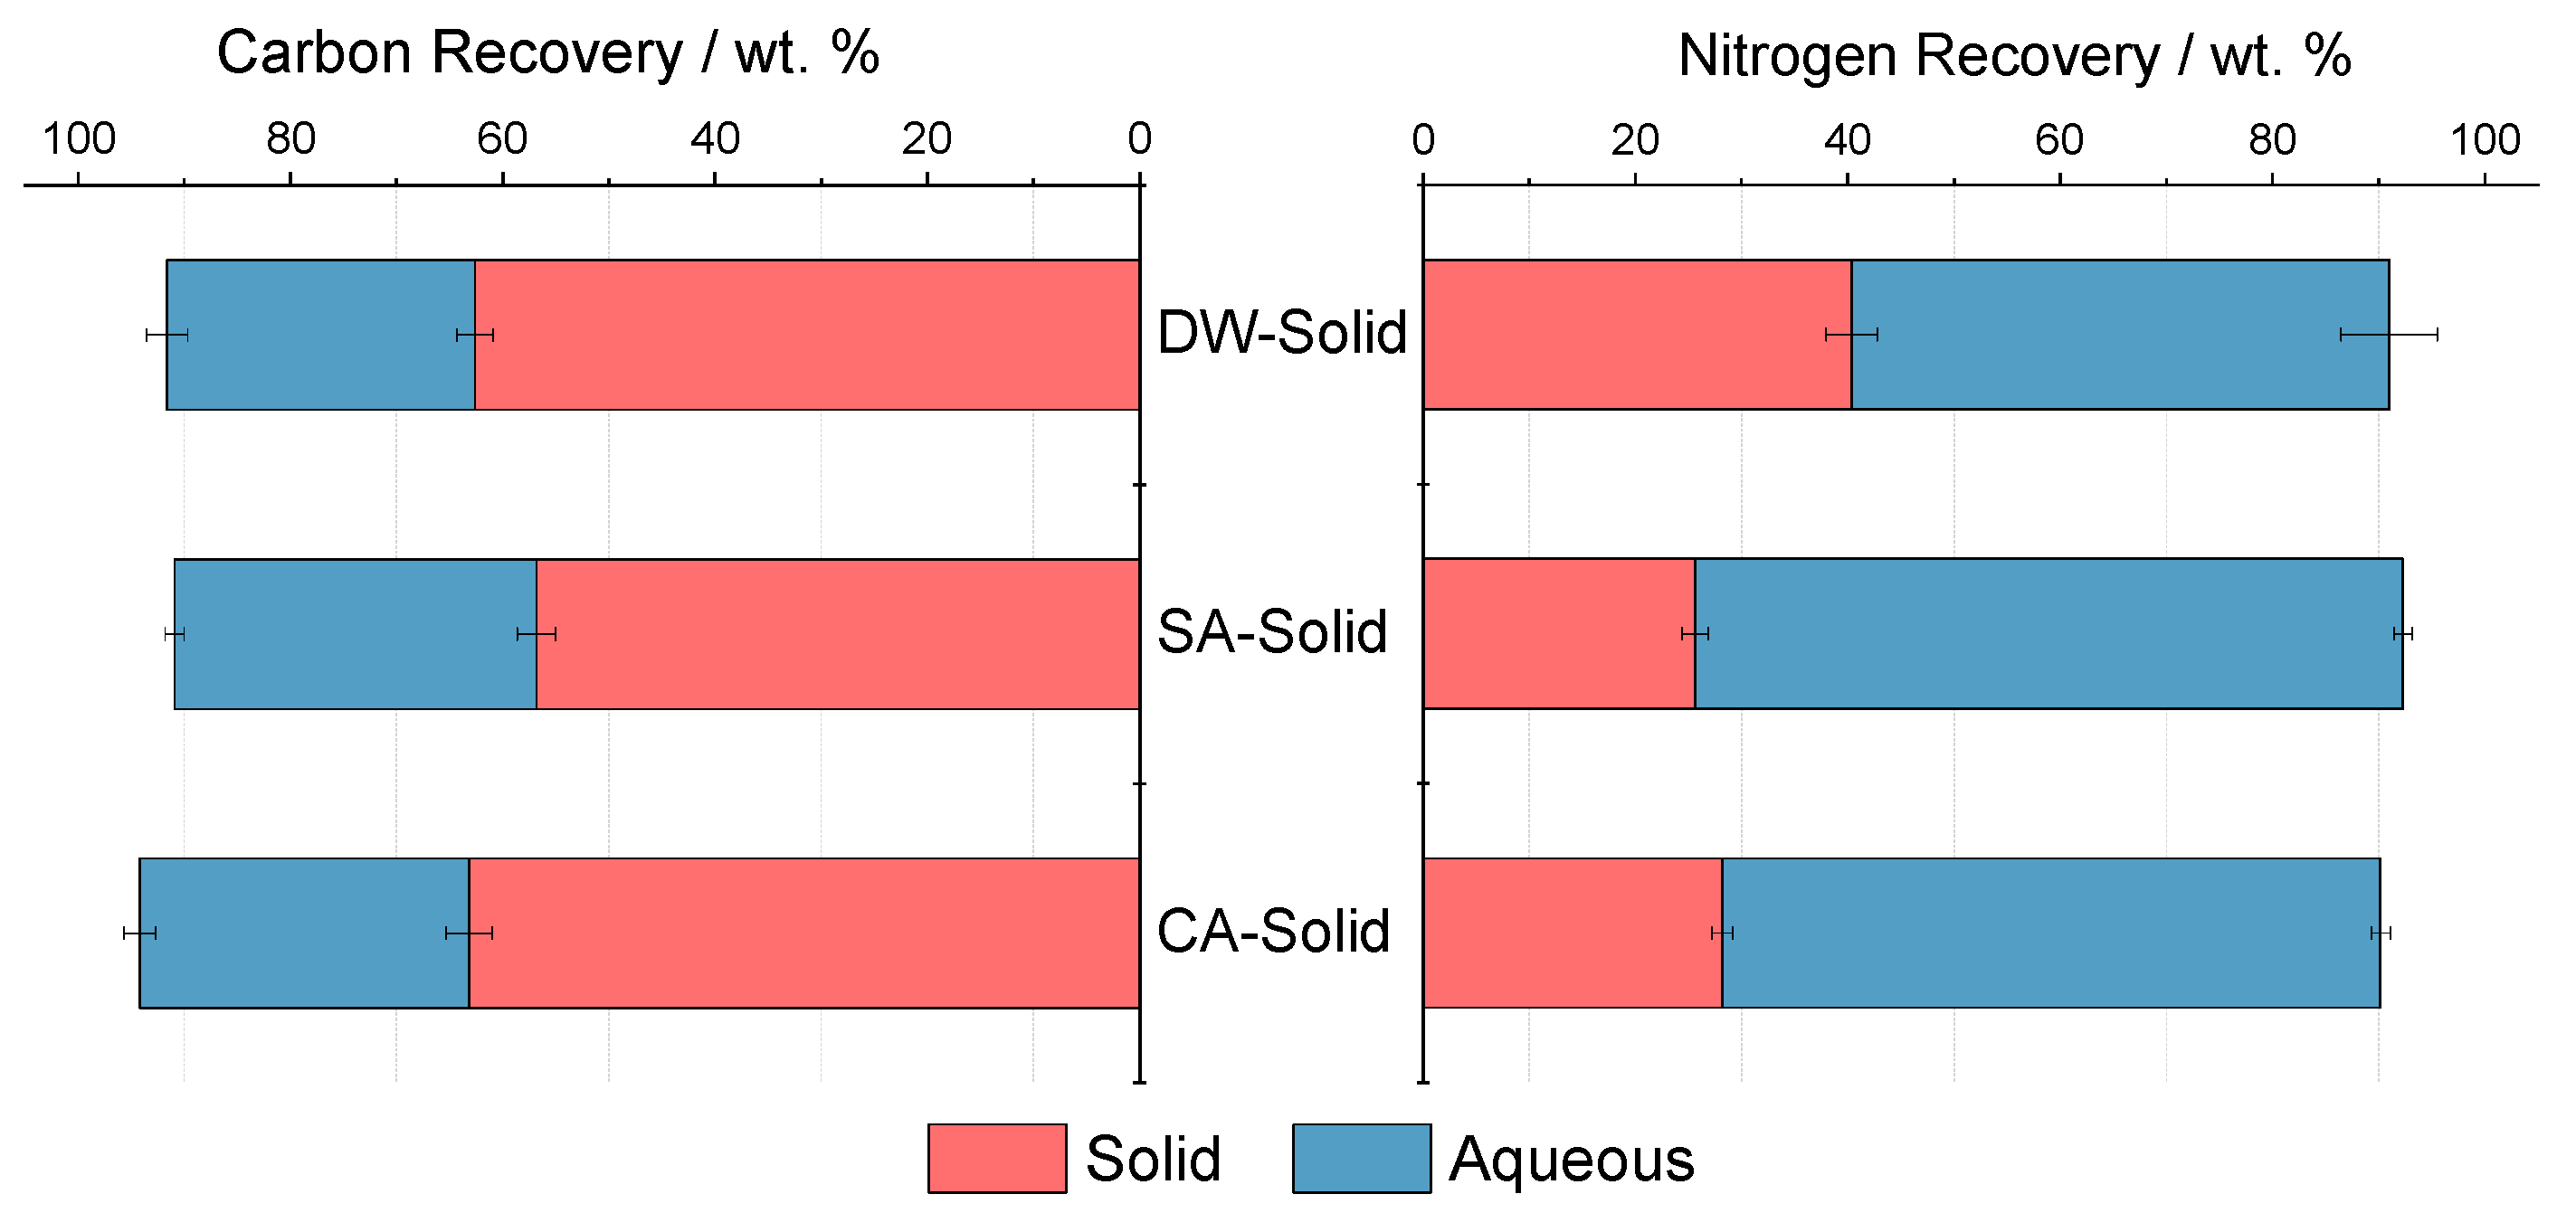
Bulk analysis of the products from pre-treatment shows a reduction in nitrogen due to solubilization of proteins in the aqueous supernatant, while crude lipids are retained. With the addition of an acidic agent, the solubilization of nitrogen is enhanced.
(2)
The yield of hydrothermal liquefaction can be increased due to the hydrothermal acid pre-treatment, under significant concomitant solubilization of organic matter in the pre-treatment. This is reflected in the overall yield after the combined process. An in-depth discussion on potential valorization or recovery of the solubilized organics of the pre-treatment is out of scope of this study, but will be an issue of further studies.
(3)
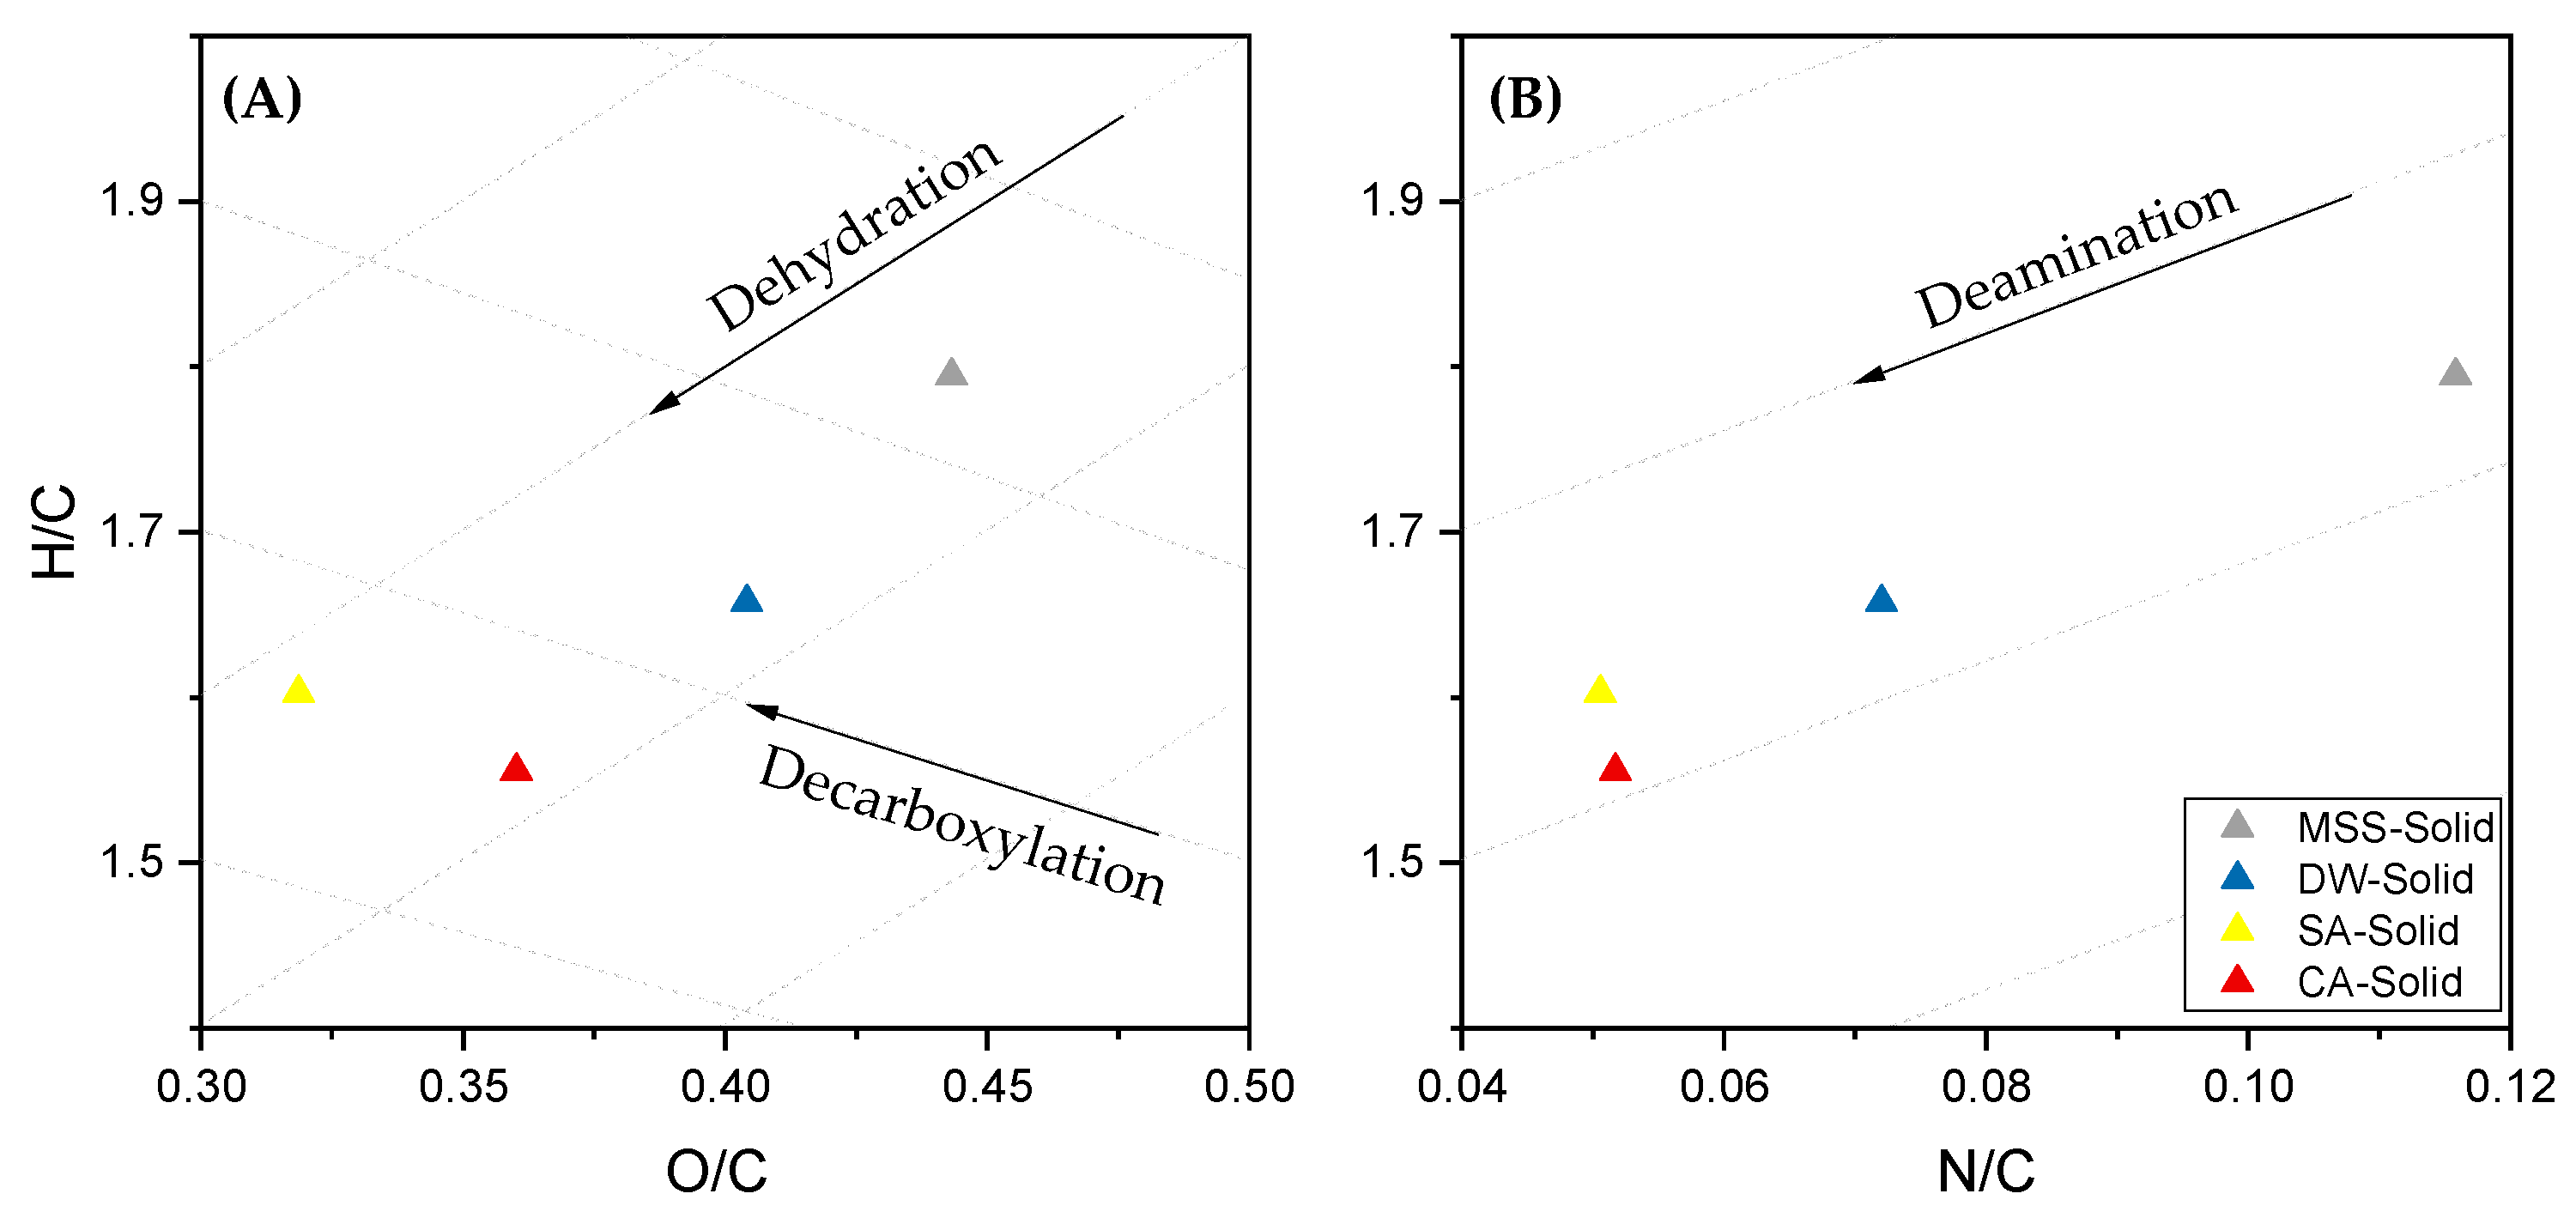
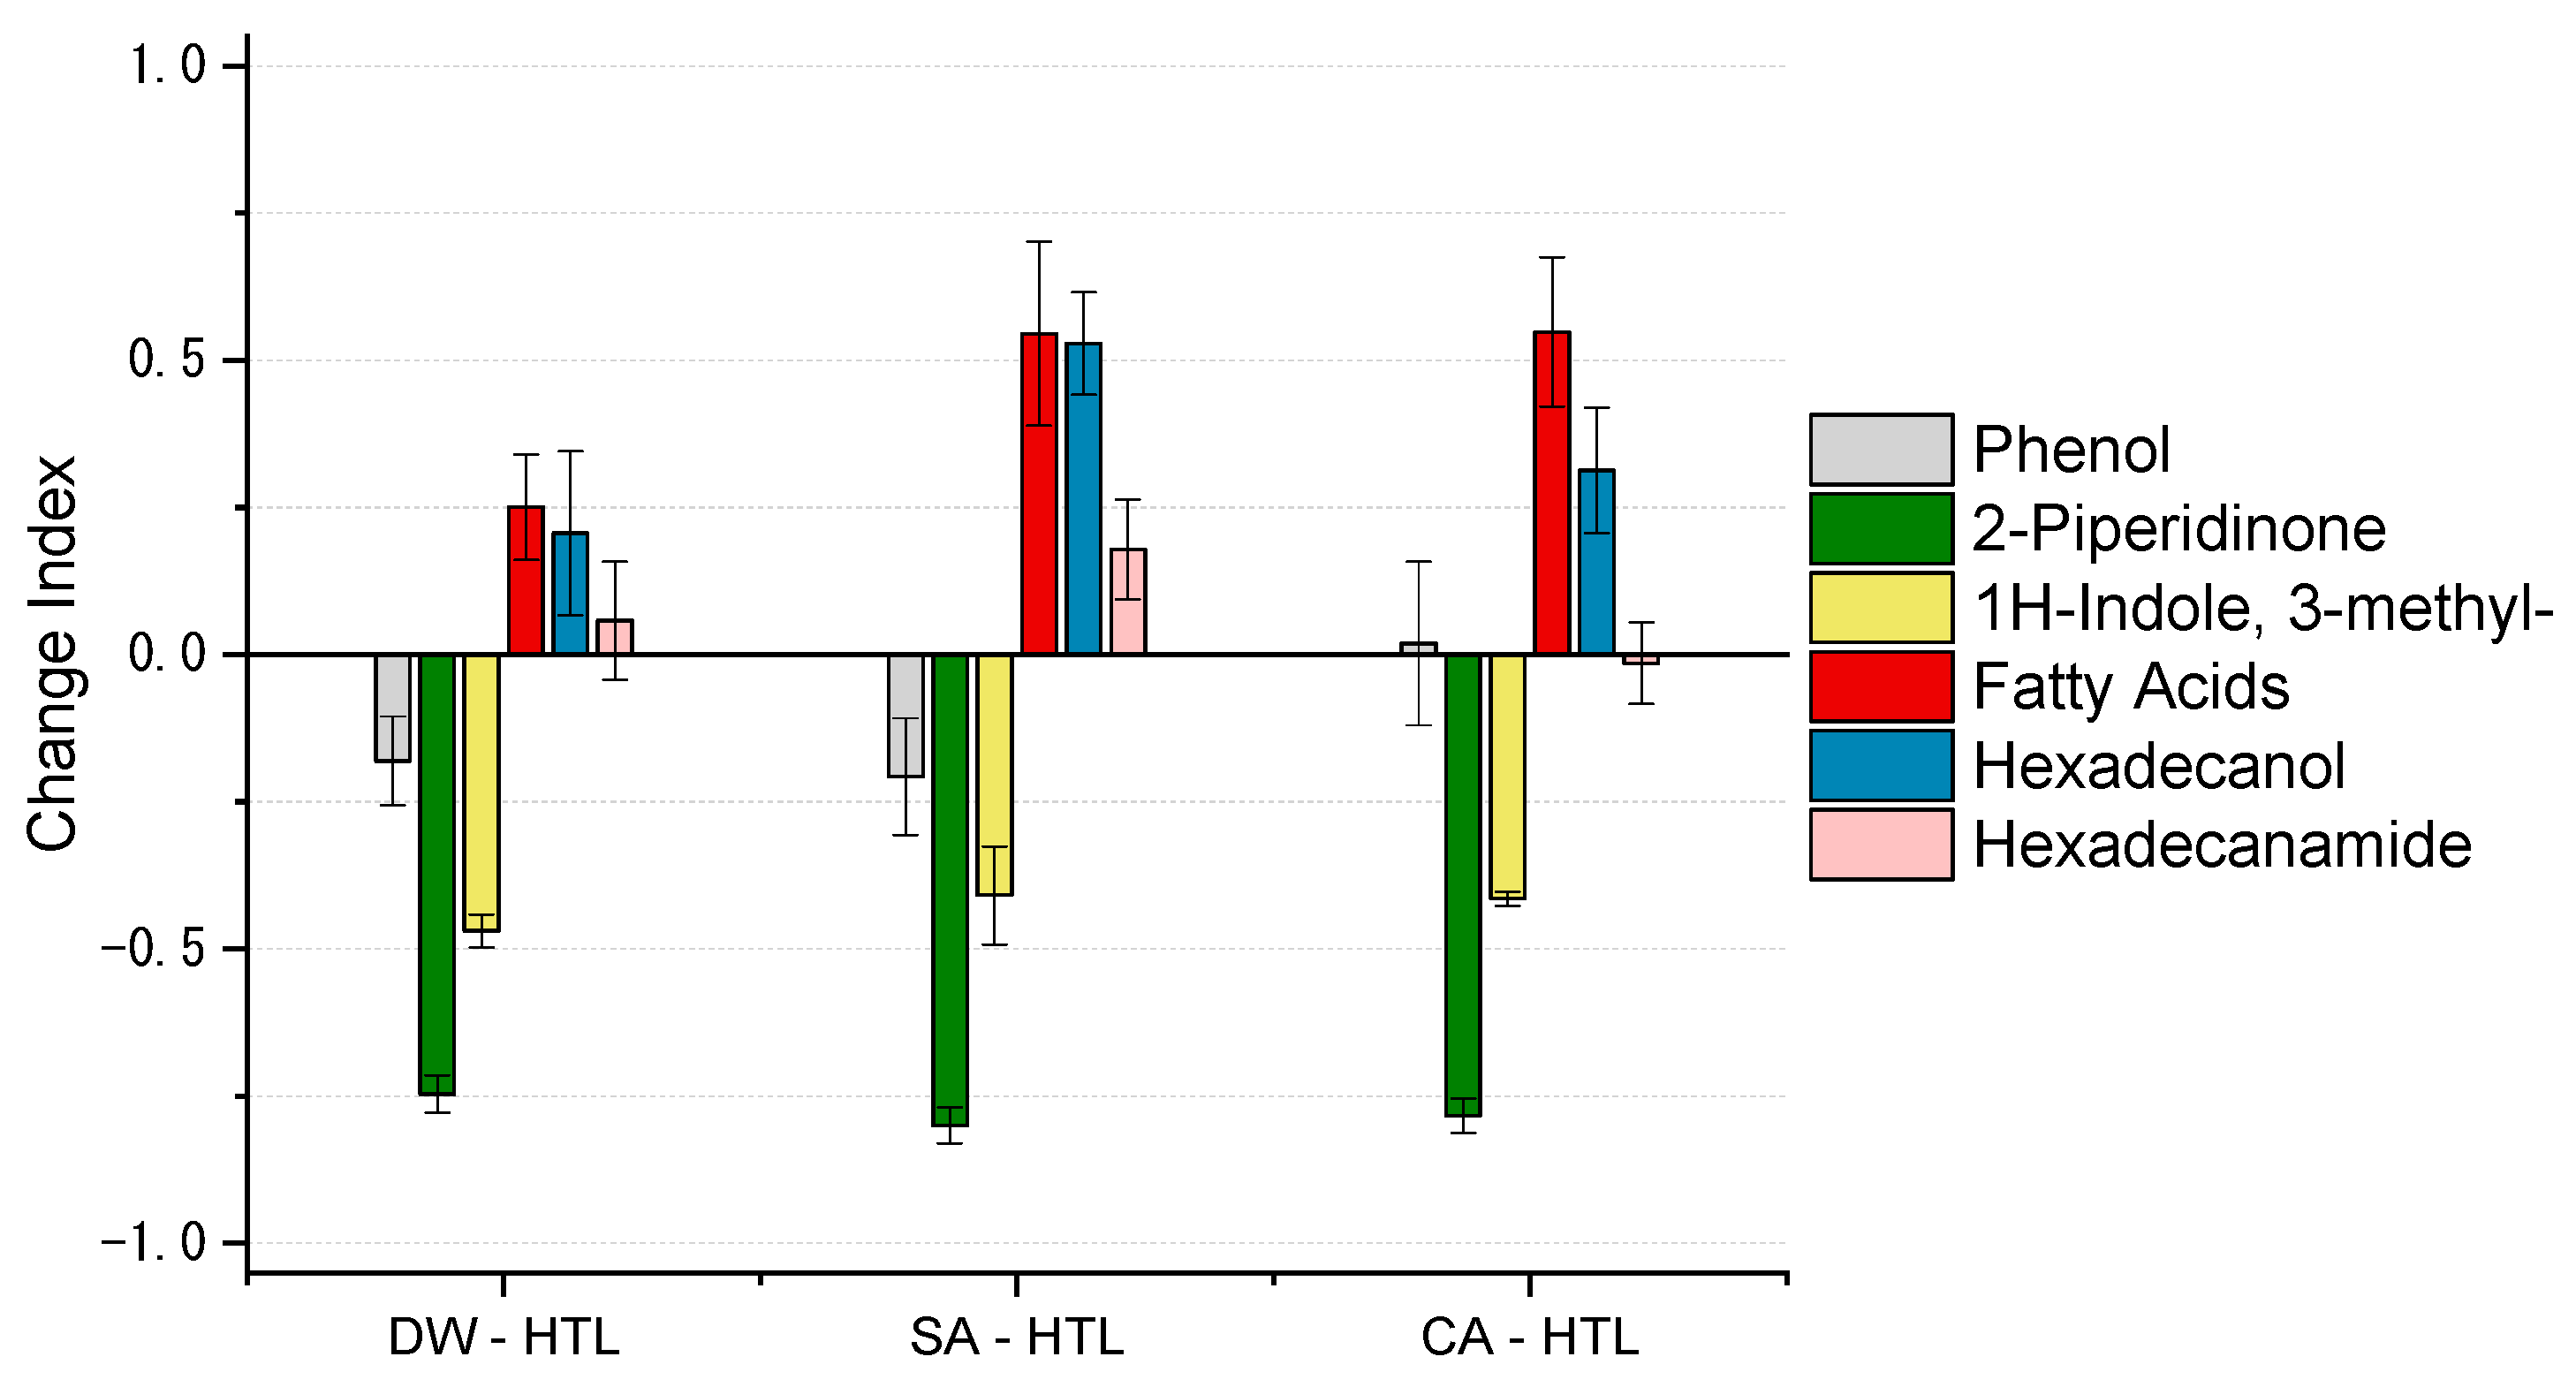
Biocrude quality was increased due to a pre-treatment as the N-heteroatom content is reduced, H/Ceff ratio is increased. Furthermore, long-chain aliphatic structures are accumulated and N-heteroatoms are primarily in the form of fatty acid amides. Directly, hydrothermal liquefied sewage sludge suffers from N-heteroatoms bound in a cyclic or even aromatic structure which can affect further upgrading strategies.
This stated process could potentially increase biocrude quality and take usage of existing anaerobic digestion facilities at the wastewater treatment plant.

Supplementary Materials

The following are available online at https://www.mdpi.com/2227-9717/9/3/491/s1, Figure S1: PID of Testrig, Figure S2: GC-TIC Chromatogram of derived biocrude, Figure S3: TOC and TNb concentration and cumulative C and N removal from MSS, Table S1: Content of amino acids in sewage sludge and pre-treated solids., Table S2: Concentration of fatty acids in biocrude samples., Table S3: Concentration of representative compounds in biocrude samples.

Author Contributions

Conceptualization, J.Z.; methodology, J.Z.; validation, J.Z.; formal analysis, J.Z., K.R., and N.D.; investigation, J.Z.; writing—original draft preparation, J.Z.; writing—review and editing, J.Z., K.R., and N.D.; visualization, J.Z.; supervision, K.R. and N.D.; project administration, K.R.; funding acquisition, K.R. All authors have read and agreed to the published version of the manuscript.

Funding

This research was funded by the European Union’s Horizon 2020 research and innovation program under grant agreement No. 818413 (NextGenRoadFuel-Sustainable Drop-In Transport fuels from Hydrothermal Liquefaction of Low Value Urban Feedstocks).

Institutional Review Board Statement

Not Applicable.

Informed Consent Statement

Not Applicable.

Data Availability Statement

Not Applicable.

Acknowledgments

We are grateful to Irantzu Alegría Dallo (National Renewable Energy Centre (CENER); Spain) for protein hydrolysis and amino acid analysis. We are thankful to Stefano Chiaberge (ENI S.p.A. Renewable Energy and Environmental R&D; Italy) for help in GCMS analysis. Konrad Völker (Institute of Catalysis and Technology Research (IKFT)) is acknowledged for his assistance in laboratory experiments.

Conflicts of Interest

The authors declare no conflict of interest.

References

  1. Eurostat. Sewage Sludge Production and Disposal in the EU. 2020. Available online: http://appsso.eurostat.ec.europa.eu/nui/submitViewTableAction.do (accessed on 8 August 2020).
  2. Collivignarelli, M.C.; Abbà, A.; Miino, M.C.; Torretta, V. What advanced treatments can be used to minimize the production of sewage sludge in WWTPs? Appl. Sci. 2019, 9, 2650. [Google Scholar] [CrossRef] [Green Version]
  3. Kelessidis, A.; Stasinakis, A.S. Comparative study of the methods used for treatment and final disposal of sewage sludge in European countries. Waste Manag. 2012, 32, 1186–1195. [Google Scholar] [CrossRef]
  4. European Parliament; Council of the European Union. Directive (EU) 2018/851 of the European Parliament and of the Council of 30 May 2018 amending Directive 2008/98/EC on waste. Off. J. Eur. Union L-150/109–140 2018, 150, 109–140. [Google Scholar]
  5. Collivignarelli, M.C.; Abbà, A.; Frattarola, A.; Carnevale Miino, M.; Padovani, S.; Katsoyiannis, I.; Torretta, V. Legislation for the reuse of biosolids on agricultural land in Europe: Overview. Sustainability 2019, 11, 6015. [Google Scholar] [CrossRef] [Green Version]
  6. Mahon, A.M.; O’Connell, B.; Healy, M.G.; O’Connor, I.; Officer, R.; Nash, R.; Morrison, L. Microplastics in Sewage Sludge: Effects of treatment. Environ. Sci. Technol. 2017, 51, 810–818. [Google Scholar] [CrossRef]
  7. Verlicchi, P.; Zambello, E. Pharmaceuticals and personal care products in untreated and treated sewage sludge: Occurrence and environmental risk in the case of application on soil—A critical review. Sci. Total Environ. 2015, 538, 750–767. [Google Scholar] [CrossRef]
  8. Thomsen, M.; Seghetta, M.; Mikkelsen, M.H.; Gyldenkærne, S.; Becker, T.; Caro, D.; Frederiksen, P. Comparative life cycle assessment of biowaste to resource management systems–A Danish case study. J. Clean Prod. 2017, 142, 4050–4058. [Google Scholar] [CrossRef]
  9. Hao, X.; Chen, Q.; van Loosdrecht, M.C.; Li, J.; Jiang, H. Sustainable disposal of excess sludge: Incineration without anaerobic digestion. Water Res. 2020, 170. [Google Scholar] [CrossRef]
  10. Manara, P.; Zabaniotou, A. Towards sewage sludge based biofuels via thermochemical conversion–A review. Renew. Sustain. Energy Rev. 2012, 16, 2566–2582. [Google Scholar] [CrossRef]
  11. Dimitriadis, A.; Bezergianni, S. Hydrothermal liquefaction of various biomass and waste feedstocks for biocrude production: A state of the art review. Renew. Sustain. Energy Rev. 2017, 68, 113–125. [Google Scholar] [CrossRef]
  12. Yin, X.; Han, P.; Lu, X.; Wang, Y. A review on the dewaterability of bio-sludge and ultrasound pretreatment. Ultrason Sonochem. 2004, 11, 337–348. [Google Scholar] [CrossRef]
  13. Kruse, A.; Dahmen, N. Water–A magic solvent for biomass conversion. J. Supercrit Fluids 2015, 96, 36–45. [Google Scholar] [CrossRef]
  14. Kruse, A.; Dinjus, E. Hot compressed water as reaction medium and reactant. J. Supercrit Fluids 2007, 39, 362–380. [Google Scholar] [CrossRef]
  15. Toor, S.S.; Rosendahl, L.; Rudolf, A. Hydrothermal liquefaction of biomass: A review of subcritical water technologies. Energy 2011, 36, 2328–2342. [Google Scholar] [CrossRef]
  16. Munir, M.T.; Mansouri, S.S.; Udugama, I.A.; Baroutian, S.; Gernaey, K.V.; Young, B.R. Resource recovery from organic solid waste using hydrothermal processing: Opportunities and challenges. Renew. Sustain. Energy Rev. 2018, 96, 64–75. [Google Scholar] [CrossRef]
  17. Conti, F.; Toor, S.S.; Pedersen, T.H.; Seehar, T.H.; Nielsen, A.H.; Rosendahl, L.A. Valorization of animal and human wastes through hydrothermal liquefaction for biocrude production and simultaneous recovery of nutrients. Energy Convers. Manag. 2020, 216, 112925. [Google Scholar] [CrossRef]
  18. Leng, L.; Zhang, W.; Peng, H.; Li, H.; Jiang, S.; Huang, H. Nitrogen in bio-oil produced from hydrothermal liquefaction of biomass: A review. Chem. Eng. J. 2020, 401, 126030. [Google Scholar] [CrossRef]
  19. Speight, J.G. Handbook of Petroleum Product Analysis; John Wiley & Sons, Inc.: Hoboken, NJ, USA, 2014. [Google Scholar]
  20. Obeid, F.; Chu Van, T.; Brown, R.; Rainey, T. Nitrogen and sulphur in algal biocrude: A review of the HTL process, upgrading, engine performance and emissions. Energy Convers. Manag. 2019, 181, 105–119. [Google Scholar] [CrossRef]
  21. Akhtar, J.; Amin, N.A.S. A review on process conditions for optimum bio-oil yield in hydrothermal liquefaction of biomass. Renew. Sustain. Energy Rev. 2011, 15, 1615–1624. [Google Scholar] [CrossRef]
  22. Gu, X.; Yu, L.; Pang, N.; Martinez-Fernandez, J.S.; Fu, X.; Chen, S. Comparative techno-economic analysis of algal biofuel production via hydrothermal liquefaction: One stage versus two stages. Appl. Energy 2020, 259, 114115. [Google Scholar] [CrossRef]
  23. Barber, W.P.F. Thermal hydrolysis for sewage treatment: A critical review. Water Res. 2016, 104, 53–71. [Google Scholar] [CrossRef]
  24. Zhuang, X.; Huang, Y.; Song, Y.; Zhan, H.; Yin, X.; Wu, C. The transformation pathways of nitrogen in sewage sludge during hydrothermal treatment. Bioresour. Technol. 2017, 245, 463–470. [Google Scholar] [CrossRef]
  25. Zhao, P.; Chen, H.; Ge, S.; Yoshikawa, K. Effect of the hydrothermal pretreatment for the reduction of NO emission from sewage sludge combustion. Appl. Energy 2013, 111, 199–205. [Google Scholar] [CrossRef]
  26. Yoshida, H.; Tavakoli, O. Sub-critical water hydrolysis treatment for waste squid entrails and production of amino acids, organic acids, and fatty acids. J. Chem. Eng. JPN 2004, 37, 253–260. [Google Scholar] [CrossRef]
  27. Zhu, X.; Zhu, C.; Zhao, L.; Cheng, H. Amino acids production from fish proteins hydrolysis in subcritical water. Chin. J. Chem. Eng. 2008, 16, 456–460. [Google Scholar] [CrossRef]
  28. Huang, Z.; Wufuer, A.; Wang, Y.; Dai, L. Hydrothermal liquefaction of pretreated low-lipid microalgae for the production of bio-oil with low heteroatom content. Process Biochem. 2018, 69, 136–143. [Google Scholar] [CrossRef]
  29. Jazrawi, C.; Biller, P.; He, Y.; Montoya, A.; Ross, A.B.; Maschmeyer, T.; Haynes, B.S. Two-stage hydrothermal liquefaction of a high-protein microalga. Algal. Res. 2015, 8, 15–22. [Google Scholar] [CrossRef] [Green Version]
  30. Guo, B.; Yang, B.; Silve, A.; Akaberi, S.; Scherer, D.; Papachristou, I.; Frey, W.; Hornung, U.; Dahmen, N. Hydrothermal liquefaction of residual microalgae biomass after pulsed electric field-assisted valuables extraction. Algal. Res. 2019, 43, 101650. [Google Scholar] [CrossRef]
  31. Fan, Y.; Hornung, U.; Raffelt, K.; Dahmen, N. The influence of lipids on the fate of nitrogen during hydrothermal liquefaction of protein-containing biomass. J. Anal. Appl. Pyrolysis 2020, 147, 104798. [Google Scholar] [CrossRef]
  32. Techne SBL-1, SBL-2, SBL-2D Fluidised Baths; Operator’s Manual. 2003. Available online: http://www.techne-calibration.com/adminimages/Techne_SBL1_2_2D.pdf (accessed on 8 August 2020).
  33. VDI ev. VDI Heat Atlas; Springer: Berlin/Heidelberg, Germany, 2010. [Google Scholar]
  34. Olkiewicz, M.; Caporgno, M.P.; Fortuny, A.; Stüber, F.; Fabregat, A.; Font, J.; Bengoa, C. Direct liquid–liquid extraction of lipid from municipal sewage sludge for biodiesel production. Fuel Process Technol. 2014, 128, 331–338. [Google Scholar] [CrossRef] [Green Version]
  35. European Commission. Commission Regulation (EC) No 152/2009 of 27 January 2009 Laying down the Methods of Sampling and Analysis for the Official Control of Feed. Off. J. Eur. Union. 2009, 54, 1–130. [Google Scholar]
  36. Bai, L.; Carlton, D.D.; Schug, K.A. Complex mixture quantification without calibration using gas chromatography and a comprehensive carbon reactor in conjunction with flame ionization detection. J. Sep. Sci. 2018, 41, 4031–4037. [Google Scholar] [CrossRef]
  37. Lepage, G.; Roy, C.C. Direct transesterification of all classes of lipids in a one-step reaction. J. Lipid Res. 1986, 27, 114–120. [Google Scholar] [CrossRef]
  38. Mullen, C.A.; Strahan, G.D.; Boateng, A.A. Characterization of various fast-pyrolysis bio-oils by NMR spectroscopy. Energy Fuels 2009, 23, 2707–2718. [Google Scholar] [CrossRef]
  39. Fulmer, G.R.; Miller, A.J.; Sherden, N.H.; Gottlieb, H.E.; Nudelman, A.; Stoltz, B.M.; Becarw, J.E.; Goldberg, K.I. NMR Chemical shifts of trace impurities: Common laboratory solvents, organics, and gases in deuterated solvents relevant to the organometallic chemist. Organometallics 2010, 29, 2176–2179. [Google Scholar] [CrossRef] [Green Version]
  40. Huber, G.W.; Corma, A. Synergies between Bio- and oil refineries for the production of fuels from biomass. Angew. Chemie Int. Ed. 2007, 46, 7184–7201. [Google Scholar] [CrossRef]
  41. Park, M.; Kim, N.; Lee, S.; Park, M.; Kim, N.; Lee, S.; Yeon, S.; Seo, J.H.; Park, D. A study of solubilization of sewage sludge by hydrothermal treatment. J. Environ. Manag. 2019, 250, 109490. [Google Scholar] [CrossRef]
  42. Neyens, E.; Baeyens, J.; Weemaes, M.; De Heyder, B. Hot acid hydrolysis as a potential treatment of thickened sewage sludge. J. Hazard Mater. 2003, 98, 275–293. [Google Scholar] [CrossRef]
  43. Chen, S.; Dong, B.; Dai, X.; Wang, H.; Li, N.; Yang, D. Effects of thermal hydrolysis on the metabolism of amino acids in sewage sludge in anaerobic digestion. Waste Manag. 2019, 88, 309–318. [Google Scholar] [CrossRef]
  44. Bougrier, C.; Delgenès, J.P.; Carrère, H. Effects of thermal treatments on five different waste activated sludge samples solubilisation, physical properties and anaerobic digestion. Chem. Eng. J. 2008, 139, 236–244. [Google Scholar] [CrossRef]
  45. Wilson, C.A.; Novak, J.T. Hydrolysis of macromolecular components of primary and secondary wastewater sludge by thermal hydrolytic pretreatment. Water Res. 2009, 43, 4489–4498. [Google Scholar] [CrossRef] [PubMed]
  46. Xue, Y.; Liu, H.; Chen, S.; Dichtl, N.; Dai, X.; Li, N. Effects of thermal hydrolysis on organic matter solubilization and anaerobic digestion of high solid sludge. Chem. Eng. J. 2015, 264, 174–180. [Google Scholar] [CrossRef]
  47. Yuan, T.; Cheng, Y.; Zhang, Z.; Lei, Z.; Shimizu, K. Comparative study on hydrothermal treatment as pre- and post-treatment of anaerobic digestion of primary sludge: Focus on energy balance, resources transformation and sludge dewaterability. Appl. Energy 2019, 239, 171–180. [Google Scholar] [CrossRef]
  48. Belitz, H.-D.; Grosch, W.; Schieberle, P. Amino acids, peptides, proteins. In Food Chemistry; Springer: Berlin/Heidelberg, Germany, 2018; pp. 8–92. [Google Scholar]
  49. Brunner, G. Processing of biomass with hydrothermal and supercritical water. In Hydrothermal and Supercritical Water Processes; Elsevier: Amsterdam, The Netherlands, 2014; pp. 395–509. [Google Scholar]
  50. Andersson, E.; Holm, N.G. The stability of some selected amino acids under attempted redox constrained hydrothermal conditions. Orig. Life Evol. Biosph. 2000, 30, 9–23. [Google Scholar] [CrossRef] [PubMed]
  51. Abdelmoez, W.; Yoshida, H.; Nakahasi, T. Pathways of amino acid transformation and decomposition in saturated subcritical water conditions. Int. J. Chem. React. Eng. 2010, 8. [Google Scholar] [CrossRef]
  52. Martins, S.I.F.S.; Van Boekel, M.A.J.S. A kinetic model for the glucose/glycine Maillard reaction pathways. Food Chem. 2005, 90, 257–269. [Google Scholar] [CrossRef]
  53. Hoffmann, V.; Jung, D.; Zimmermann, J.; Rodriguez Correa, C.; Elleuch, A.; Halouani, K.; Kruse, A. Conductive carbon materials from the hydrothermal carbonization of vineyard residues for the application in electrochemical double-layer capacitors (EDLCs) and direct carbon fuel cells (DCFCs). Materials (Basel) 2019, 12, 1703. [Google Scholar] [CrossRef] [PubMed] [Green Version]
  54. Li, Y.-Y.; Noike, T. Upgrading of anaerobic digestion of waste activated sludge by thermal pretreatment. Water Sci. Technol. 1992, 26, 857–866. [Google Scholar] [CrossRef]
  55. Zhu, Z.; Toor, S.S.; Rosendahl, L.; Yu, D.; Chen, G. Influence of alkali catalyst on product yield and properties via hydrothermal liquefaction of barley straw. Energy 2015, 80, 284–292. [Google Scholar] [CrossRef]
  56. Yin, S.; Tan, Z. Hydrothermal liquefaction of cellulose to bio-oil under acidic, neutral and alkaline conditions. Appl. Energy 2012, 92, 234–239. [Google Scholar] [CrossRef]
  57. Demirbaş, A. Mechanisms of liquefaction and pyrolysis reactions of biomass. Energy Convers. Manag. 2000, 41, 633–646. [Google Scholar] [CrossRef]
  58. Chornet, E.; Overend, R.P. Biomass liquefaction: An overview. In Fundamentals of Thermochemical Biomass Conversion; Springer: Dordrecht, The Netherlands, 1985; pp. 967–1002. [Google Scholar]
  59. Chen, W.T.; Qian, W.; Zhang, Y.; Mazur, Z.; Kuo, C.T.; Scheppe, K.; Schideman, L.C.; Sharma, B.K. Effect of ash on hydrothermal liquefaction of high-ash content algal biomass. Algal. Res. 2017, 25, 297–306. [Google Scholar] [CrossRef]
  60. Ross, A.B.; Biller, P.; Kubacki, M.L.; Lea-Langton, A.; Jones, J.M. Hydrothermal processing of microalgae using alkali and organic acids. Fuel 2010, 89, 2234–2243. [Google Scholar] [CrossRef]
  61. Yoo, G.; Park, M.S.; Yang, J.-W.; Choi, M. Lipid content in microalgae determines the quality of biocrude and Energy Return On Investment of hydrothermal liquefaction. Appl. Energy 2015, 156, 354–361. [Google Scholar] [CrossRef]
  62. Shah, A.A.; Toor, S.S.; Conti, F.; Nielsen, A.H.; Rosendahl, L.A. Hydrothermal liquefaction of high ash containing sewage sludge at sub and supercritical conditions. Biomass Bioenergy 2020, 135. [Google Scholar] [CrossRef]
  63. Zapp, K.H.; Wostbrock, K.H.; Schäfer, M.; Sato, K.; Seiter, H.; Zwick, W.; Creutziger, R.; Leiter, H. Ammonium compounds. Ullmann’s Encycl. Ind. Chem. 2012. [Google Scholar] [CrossRef]
  64. Qian, L.; Wang, S.; Savage, P.E. Fast and isothermal hydrothermal liquefaction of sludge at different severities: Reaction products, pathways, and kinetics. Appl. Energy 2020, 260, 114312. [Google Scholar] [CrossRef]
  65. Biller, P.; Ross, A.B. Potential yields and properties of oil from the hydrothermal liquefaction of microalgae with different biochemical content. Bioresour. Technol. 2011, 102, 215–225. [Google Scholar] [CrossRef]
  66. Fan, Y.; Hornung, U.; Dahmen, N.; Kruse, A. Hydrothermal liquefaction of protein-containing biomass: Study of model compounds for Maillard reactions. Biomass Convers. Biorefinery 2018, 8, 909–923. [Google Scholar] [CrossRef]
  67. Pińkowska, H.; Wolak, P.; Złocińska, A. Hydrothermal decomposition of alkali lignin in sub- and supercritical water. Chem. Eng. J. 2012, 187, 410–414. [Google Scholar] [CrossRef]
  68. Watanabe, M.; Iida, T.; Inomata, H. Decomposition of a long chain saturated fatty acid with some additives in hot compressed water. Energy Convers. Manag. 2006, 47, 3344–3350. [Google Scholar] [CrossRef]
  69. Liu, X.; Yang, M.; Deng, Z.; Dasgupta, A.; Guo, Y. Mechanism and kinetic modeling. Chem. Eng. J. 2021, 407, 126332. [Google Scholar] [CrossRef]
  70. Garcia Alba, L.; Torri, C.; Samorì, C.; van der Spek, J.; Fabbri, D.; Kersten, S.R.; Brilman, D.W. Hydrothermal Treatment (HTT) of Microalgae: Evaluation of the process as conversion method in an algae biorefinery concept. Energy Fuels 2011, 26, 642–657. [Google Scholar] [CrossRef]
  71. McCalley, D.V.; Cooke, M.; Nickless, G. Effect of sewage treatment on faecal sterols. Water Res. 1981, 15, 1019–1025. [Google Scholar] [CrossRef]
  72. Fan, Y.; Fonseca, F.G.; Gong, M.; Hoffmann, A.; Hornung, U.; Dahmen, N. Energy valorization of integrating lipid extraction and hydrothermal liquefaction of lipid-extracted sewage sludge. J. Clean Prod. 2021, 285, 124895. [Google Scholar] [CrossRef]
  73. Vardon, D.R.; Sharma, B.K.; Scott, J.; Yu, G.; Wang, Z.; Schideman, L.; Zhang, Y.; Strathmann, T.J. Chemical properties of biocrude oil from the hydrothermal liquefaction of Spirulina algae, swine manure, and digested anaerobic sludge. Bioresour. Technol. 2011, 102, 8295–8303. [Google Scholar] [CrossRef] [PubMed]
  74. Islam, M.N.; Kaneko, T.; Kobayashi, K. Reaction of amino acids in a supercritical water-flow reactor simulating submarine hydrothermal systems. Bull. Chem. Soc. Jpn. 2003, 76, 1171–1178. [Google Scholar] [CrossRef]
  75. Moldoveanu, S.C. Analytical pyrolysis of other natural organic polymers. In Analytical Pyrolysis of Natural Organic Polymers, 1st ed.; Elsevier: Amsterdam, The Netherlands, 2021; pp. 427–429. [Google Scholar]
  76. He, C.; Wang, K.; Yang, Y.; Amaniampong, P.N.; Wang, J.Y. Effective nitrogen removal and recovery from dewatered sewage sludge using a novel integrated system of accelerated hydrothermal deamination and air stripping. Environ. Sci. Technol. 2015, 49, 6872–6880. [Google Scholar] [CrossRef]
  77. Katritzky, A.R.; Luxem, F.J.; Murugan, R.; Greenhill, J.V.; Siskin, M. Aqueous high-temperature chemistry of carbo- and heterocycles. 19. Pyrroles and indoles. Energy Fuels 1992, 6, 450–455. [Google Scholar] [CrossRef]
  78. Fu, X.; Liao, Y.; Glein, C.R.; Jamison, M.; Hayes, K.; Zaporski, J.; Yang, Z. Direct synthesis of amides from amines and carboxylic acids under hydrothermal conditions. ACS Earth Space Chem. 2020, 4, 722–729. [Google Scholar] [CrossRef]
  79. Gai, C.; Zhang, Y.; Chen, W.T.; Zhang, P.; Dong, Y. Energy and nutrient recovery efficiencies in biocrude oil produced via hydrothermal liquefaction of Chlorella pyrenoidosa. RSC Adv. 2014, 4, 16958. [Google Scholar] [CrossRef]
  80. Ingram, L.; Mohan, D.; Bricka, M.; Steele, P.; Strobel, D.; Crocker, D.; Mitchell, B.; Mohammed, J.; Cantrell, K.; Pittman, C.U., Jr. Pyrolysis of wood and bark in an auger reactor: Physical properties and chemical analysis of the produced bio-oils. Energy Fuels 2018, 22, 614–625. [Google Scholar] [CrossRef]
Figure 1. Process procedure: (A) pre-treatment and (B) hydrothermal liquefaction (HTL) process, including product separation.
Processes 09 00491 g001
Figure 2. Carbon and nitrogen recovery in the solid phase and aqueous supernatant of hydrothermal pre-treatment.
Processes 09 00491 g002
Figure 3. Van Krevelen diagram of MSS and the solids prepared by hydrothermal pre-treatment, (A) O/C vs. H/C ratio and (B) N/C vs. H/C ratio.
Processes 09 00491 g003
Figure 4. (A) Biocrude yield of hydrothermal liquefaction and the overall yield of the combined process with pre-treatment and (B) heteroatom content (O, N, S) and H/Ceff of derived biocrude.
Processes 09 00491 g004
Figure 5. Carbon and nitrogen recovery in the different product phases of HTL.
Processes 09 00491 g005
Figure 6. Van Krevelen diagram of MSS, solids from pre-treatment, and HTL derived biocrude, plotted as (A) O/C vs. H/C ratio and (B) N/C vs. H/C ratio.
Processes 09 00491 g006
Figure 7. Change indexes (CI) of selected compounds in biocrude derived by hydrothermal liquefaction of pre-treated solids (indexes were calculated based on the comparison to the untreated product).
Processes 09 00491 g007
Figure 8. 1H NMR spectra and spectral distribution of functional groups present in biocrude based on integrated peak areas assigned to characteristic spectral regions.
Processes 09 00491 g008
Table 1. Characterization of the feedstock (MSS) and pre-treated solids (DW, SA, CA). The values in brackets indicate the standard deviation.
MSSDW-SolidSA-SolidCA-Solid
Proximate analysis (dry basis)
Ash [wt. %]30.0 (0.1)38.1 (0.3)30.5 (0.7)24.7 (0.1)
Organic a [wt. %]70.0 (0.1)61.9 (0.3)69.5 (0.7)75.3 (0.1)
Elemental analysis (dry, ash-free basis)
C [wt. %]52.8 (0.1)56.3 (0.2)57.2 (0.5)59.4 (0.2)
H [wt. %]7.9 (0.1)7.7 (0.1)7.6 (0.1)7.7 (0.1)
N [wt. %]7.1 (0.0)4.7 (0.1)3.4 (0.1)3.6 (0.0)
S [wt. %]0.9 (0.0)0.9 (0.0)3.1 (0.2)0.8 (0.0)
O a [wt. %]31.3 (0.0)30.4 (0.2)28.6 (0.8)28.5 (0.1)
N/O0.26 (0.00)0.18 (0.00)0.14 (0.00)0.14 (0.0)
H/Ceff b0.55 (0.02)0.59 (0.01)0.66 (0.03)0.67 (0.02)
Yield and recovery (dry, ash-free basis)
Solid yield [wt. %]-54.8 (3.3)52.8 (2.0)63.4 (2.2)
C-recovery solid phase [wt. %]-62.6 (1.7)56.8 (1.8)62.7 (2.3)
C-recovery aqueous phase [wt. %]-29.0 (1.9)34.1 (0.9)31.0 (1.5)
N-recovery solid phase [wt. %]-40.3 (2.4)25.6 (1.2)28.2 (1.0)
N-recovery aqueous phase [wt. %]-50.6 (4.5)66.7 (0.9)62.0 (0.7)
Organic composition (dry, ash-free basis)
Hydrolytic amino acids [wt. %]21.813.510.09.3
Lipids c [wt. %]21.7 (1.1)24.4 (1.1)29.9 (1.4)28.6 (0.6)
Ash analysis (dry, organic-free basis)
Al [wt. %]2.52.62.32.4
Ca [wt. %]7.67.65.62.8
Fe [wt. %]18.018.14.55.7
Mg [wt. %]0.90.80.30.8
P [wt. %]8.08.13.42.8
a Calculated by difference; b all H/Ceff values were calculated according to Equation (3); c saponifiable and un-saponifiable.
Table 2. Characterization of HTL products. Yield is based on dry, ash free values. The values in brackets indicate the standard deviation.
MSS-HTLDW-HTLSA-HTLCA-HTL
Biocrude
Yield [wt. %]35.5 (0.5)36.6 (0.2)39.4 (0.2)42.9 (0.7)
C [wt. %]75.6 (0.2)75.5 (0.2)76.1 (0.2)75.9 (0.1)
H [wt. %]10.4 (0.2)10.9 (0.2)11.2 (0.0)11.2 (0.1)
N [wt. %]5.0 (0.1)3.8 (0.0)2.8 (0.1)2.7 (0.0)
S [wt. %]0.7 (0.0)0.6 (0.1)0.8 (0.0)0.8 (0.0)
O a [wt. %]8.2 (0.4)9.2 (0.1)9.0 (0.4)9.4 (0.2)
H/Ceff b1.31 (0.03)1.41 (0.04)1.49 (0.01)1.48 (0.02)
C-recovery [wt. %]50.9 (0.8)49.3 (0.5)52.8 (0.5)54.9 (1.2)
N-recovery [wt. %]25.1 (0.6)29.5 (0.3)32.5 (1.2)32.7 (0.9)
Aqueous
C-recovery [wt. %]19.3 (0.3)12.4 (2.6)10.0 (1.6)13.3 (0.4)
N-recovery [wt. %]54.3 (3.2)47.9 (2.7)45.2 (2.4)44.7 (1.3)
Solid
C-recovery [wt. %]11.0 (1.2)17.0 (0.2)19.6 (1.6)13.3 (1.1)
N-recovery [wt. %]7.1 (1.0)16.7 (0.2)20.8 (0.6)14.6 (1.2)
Gas
C-recovery [wt. %]5.3 (0.5)6.1 (0.3)6.0 (0.9)5.5 (0.5)
a Calculated by difference; b All H/Ceff values were calculated according to Equation (3).
Table 3. Major compounds of the GC-MS total ion chromatogram areas of biocrude samples from liquefied municipal sewage sludge and pre-treated solids.
RTCompound NameMSS-HTLDE-HTLSA-HTLCA-HTLClass
8.52PhenolxxxxPhenol
9.732-Cyclopenten-1-one, 2,3-dimethyl-x xxKetone
10.322-Pyrrolidinonexx N-heterocycle
10.46p-CresolxxxxPhenol
10.712,5-Pyrrolidinedione, 1-methyl-xx N-heterocycle
10.78Phenol, 2-methoxy- xxPhenol
10.78Phenol, 4-methoxy- xPhenol
10.782-Cyclopenten-1-one, 3,4,5-trimethyl- x xKetone
11.052-Pyrrolidinone, 1-propyl-xx N-heterocycle
12.35Phenol, 4-ethyl-xxxxPhenol
12.652-Piperidinonex N-heterocycle
12.85Phenol, 2-methoxy-3-methyl- x Phenol
14.91Indolex N-heterocycle
15.78Piperidine, 1-pentyl-xxx N-heterocycle
16.29N-[2-Hydroxyethyl]succinimidexx N-heterocycle
16.661H-Indole, 3-methyl-xxxxN-heterocycle
17.961-Dodecanol xxAliphatic alcohol
18.251-Pentadecene xxAliphatic alkene
19.531-Tetradecanol xxxAliphatic alcohol
22.011-Heptadecene xxxAliphatic alkene
23.73Tetradecanoic acidxxxxAliphatic alcohol
24.171-HexadecanolxxxxAliphatic alcohol
27.83Hexadecenoic acidxxxxFatty acid
28.31Hecadecanoic acidxxxxFatty acid
30.50Octadecen-1-olxxxxAliphatic alcohol
26.881-OctadecanolxxxxAliphatic alcohol
32.39Octadecenoic acidxxxxFatty acid
32.82Octadecanoic acidxxxxFatty acid
28.12HexadecanamidexxxxFatty acid amide
28.51Hexadecanamide, N-methylxxxxFatty acid amide
29.03Hexadecanamide, N-ethylxxxxFatty acid amide
37.11OctadecenamidexxxxFatty acid amide
37.92Octadecenamide, N-methylxxxxFatty acid amide
38.77Octadecenamide, N-ethylxxxxFatty acid amide
47.41Cholest-3-ene, (5.alpha.)-xxxxSterol
48.19Cholest-2-ene, (5.alpha.)-xxxxSterol
48.64Cholest-4-enexxxxSterol
49.05Cholest-5-enexxxxSterol
Publisher’s Note: MDPI stays neutral with regard to jurisdictional claims in published maps and institutional affiliations.

