Article

Moving Multiscale Modelling to the Edge: Benchmarking and Load Optimization for Cellular Automata on Low Power Microcomputers

Department of Applied Computer Science and Modelling, AGH University of Science and Technology, Av. Mickiewicza 30, 30-059 Kraków, Poland
*
Author to whom correspondence should be addressed.
Processes 2021, 9(12), 2225; https://doi.org/10.3390/pr9122225
Submission received: 3 November 2021 / Revised: 27 November 2021 / Accepted: 5 December 2021 / Published: 9 December 2021
(This article belongs to the Special Issue Advances in Digital Design and Manufacturing)

Abstract

:
Numerical computations are usually associated with the High Performance Computing. Nevertheless, both industry and science tend to involve devices with lower power in computations. This is especially true when the data collecting devices are able to partially process them at place, thus increasing the system reliability. This paradigm is known as Edge Computing. In this paper, we propose the use of devices at the edge, with lower computing power, for multi-scale modelling calculations. A system was created, consisting of a high-power device—a two-processor workstation, 8 RaspberryPi 4B microcomputers and 8 NVidia Jetson Nano units, equipped with GPU processor. As a part of this research, benchmarking was performed, on the basis of which the computational capabilities of the devices were classified. Two parameters were considered: the number and performance of computing units (CPUs and GPUs) and the energy consumption of the loaded machines. Then, using the calculated weak scalability and energy consumption, a min–max-based load optimization algorithm was proposed. The system was tested in laboratory conditions, giving similar computation time with same power consumption for 24 physical workstation cores vs. 8x RaspberryPi 4B and 8x Jetson Nano. The work ends with a proposal to use this solution in industrial processes on example of hot rolling of flat products.

1. Introduction

The development of technology does not stop for a moment. Components used in modern devices: computers, laptops, and smartphones have more and more to offer. One of the key parameters that is constantly being improved, from both consumer and developer point of view, is the performance of the equipment. In scientific applications, we usually refer to data centers and supercomputers. According to the TOP500 ranking of supercomputers, it can be seen that in the last 5 years computing capabilities of the most powerful machine has increased from 33.86 TFlop/s to 442,010.0 TFlop/s [1].
Nevertheless, significant progress was also made among the group of devices with lower power. Every year, platforms, such as Arduino, Gallileo, or RaspberryPi offer new models that feature both adding new modules (e.g., RaspberryPi received a separate Ethernet and USB controller) and modernizing the existing ones (e.g., memory controllers, higher clock timings). In 2020, the RasperryPi Foundation released a new version of RasperryPi Compute module 4, dedicated to industrial applications [2].
The aforementioned devices are classified in the category of machines with low computing power, but both the cost of purchase and subsequent operation are incomparably low in relation to High Performance Computing (HPC) or the cloud. In 2013, the ranking of supercomputers in the energy efficiency category-GREEN500-was created. Most of the devices used in Green Computing have similar parameters to the RaspberryPi microcomputer. Ranking depends on the efficiency expressed in GFlop/s per watt. The top ten of this ranking includes supercomputers, which are placed high in the TOP500 basic ranking. So it can be seen that the contemporary trends in creating machines with enormous computing potential increasingly consider the issues of ecology and energy consumption.
This paper presents a comparison of the use of devices with high computational capabilities, in this case a two-processor workstation with NVidia RTX 2080ti GPU, and edge devices: RaspberryPi 4B and NVidia Jetson Nano, for numerical computations in the field of multi-scale modeling. Particular attention was paid to Cellular Automata (CA) and their behavior on selected devices. On the basis of performed benchmarks and received performance measures (such as a weak scalability [3] or a ratio of energy consumption) we proposed min–max-based load optimization procedure operating on the edge, which is the main aim of this work. This procedure allows to optimize utilization of computational resources (edge devices and workstation) assuring minimum execution time and/or energy consumption. The work ends with a description of the practical application of this edge system in industrial practice.
In Section 2, state of the art for computational tasks execution on edge architectures, especially related with multiscale modelling, is presented. Section 3 consists of computational task definition, based on microstructure grain growth using Cellular Automata method. We describe there transition rules and architecture of the edge system, where the computations are executed. Then, all performed benchmarks are presented and commented. In Section 4, a min–max based algorithm for load distribution in proposed edge architecture is presented. In Section 5, the algorithm is evaluated and compared with other solutions. The paper ends with proposition of industrial application (Section 6), conclusions, and further works.

2. State of the Art

2.1. Computational Problems in Edge Architectures

When considering the issues of device performance, two aspects should be considered: (i) related to a hardware efficiency, including CPUs, memory, or GPUs, (ii) related to communication and connection of multiple devices. Both, basing on the problem to be solved, may affect the efficiency of the system. In the case of highly distributed systems network communication is an important factor and is one of the most frequently appearing paradigm in this context of Edge Computing [4,5].
The development of technology has had a very strong impact on the industrial sector. The newly built enterprises are equipped with automation and electronic devices from the very beginning. Existing industries are improving their infrastructure by adding IT systems to support their production processes. Currently, many Industrial Information Systems (IIS) have a multi-level (hierarchical) architecture. When analyzing the functionality of IIS’s individual components, it can be noticed that it can fit into the Cloud-Fog-Edge Computing paradigm. A visualization of such an architecture is shown in Figure 1.
At the very bottom of the hierarchy, the sensor and actuator layer can be found. Within this group there are many devices. Usually, they can be classified in the Industrial Internet of Things (IIoT). Although simple data generators sending only a sequence of bits (bytes) to a message queue or a dedicated storage are not able to perform additional operations, the more complex ones, equipped for example with any arithmetic and logical unit, can manipulate these data. It can be treated as preprocessing in order to reduce the number of messages sent to the server or to offload the computational unit at the end of the IIS hierarchy.
Bottom-up automation systems are the next element of the IIS. At this level, the data sent by a sensor system, located directly at the production lines, are received. Due to this fact, these devices must be equipped with more advanced resources allowing for required data parsing, transformation and/or processing. Bottom-up devices may also belong to the IIoT group, but it would be more accurate to define them as edge devices for the lower sensor layer.
After initial processing, the data generated by the sensors are sent in the form of messages to the next layer-control area of the technological process. At this stage, monitoring and management of one or more technologically related production lines occur. Usually, these are units with CPUs, sometimes with additional GPU and a significant amount of RAM compared to the sensors. Considering their location between the sensor integration and the final layers, it can be described as a computational fog of the system.
At the top of the hierarchy, company’s production management system is located. This is a place where both simple and complex computational units can be found. However, in most cases, most of the devices are powerful and are able to perform complex computations. Depending on their distance from the rest of the infrastructure, which can have on-premise or cloud model, and inter-layer isolation in the system, communication aimed at feedback to the sensors may be difficult or impossible. Hence, such paradigms as Fog and Edge Computing were defined, where some of the computations can be transferred to devices closer to the source: data, information, client.
In this paper, we decided to use edge devices and IIoT to perform computations that could support and enhance production processes, without the need to involve resources from higher layers of the hierarchy. There are many examples in the literature, that combine the EC paradigm with IoT, including its industrial counterpart. It is important to note that such combination, apart from its benefits, brings a number of challenges that need to be solved first in order for the yield to be noticeable [6]. Due to the lack of computational resources (CPU, GPU, RAM, disk space) compared to the data center, the tasks assigned to them must be adapted to their capabilities. Another problem is the high distribution of the system, which brings many problems related to communication, authentication, and load balancing. IoT devices work very often on battery power, which is usually the justification for wireless communication. Energy limitations directly affect the antenna power, which may result in errors in inter-node communication. One of the possible solutions to this problem for IoT devices, where the energy is a limiting factor, can be found in the literature [7].
A common combination is to use IoT with artificial intelligence (AI) methods, including machine learning [8], artificial neural networks [9,10], and fuzzy logic [11]. Although these devices are mainly used as measurement sensors, authors propose and present implementations that also use them for computations. Despite their low computational capabilities, authors indicate efficiency gains in the form of shortening the execution time or reduction in the energy consumption by up to 15%, compared to the use of workstations. Usually, machine learning model can be accelerated using GPU, so there is also possibility of using edge devices, such as NVidia Jetson platform. Distribution of the computations on this type of devices may be beneficial and result in improvements in execution time and/or energy consumption for entire system. The performance of Jetson platform is promising if tasks being solved in the system can benefit from GPGPU acceleration, keeping the energy consumption low, at 15 W maximum [12].
Therefore, attention should be paid to the computational offloading and computations distribution for IoT and IIoT devices [13]. In cases where the amount of generated data is enormous, e.g., Big Data applications, problems related to high delays are observed due to the network load and the distance between the source and the recipient of the data. In the case of devices with energy restrictions, communication standards with very low energy consumption, and thus low bandwidths with several hundred kbps, are used, e.g., Bluetooth/Wi-Fi Low Energy, LoRa, ZigBee.
The situation can also be opposite: devices at the bottom of the hierarchy may not be able to handle the load due to limited resources. In most cases, the power of devices at the top of the hierarchy (HPC, Cloud) can be used. In the literature, authors use artificial intelligence methods, including bio-inspired algorithms [14], considering energy consumption at the same time [15]. Authors compare different approaches, based on the classification of devices depending on the access to energy, the computational capabilities of these devices and the distance between them.
In the case where IoT devices are overloaded, the best solution is to delegate tasks to underloaded devices, usually higher in the hierarchy. The edge devices, which have more computational power, are the closest to the sensors. On the one hand, they can participate in the computations, and on the other, they distribute the computations onto other underloaded sensors. There are many solutions to this problem in the literature [16,17,18] including those based on AI and optimization [19,20]. The roles played by edge devices in the work cover a wide range of computer systems operation: from IoT device management, through cache and storage for information relevant on a given edge, to participation in computational processes. Equally important in this context is the management of energy through the network leaves. In the context of EC, a frequent problem is also the heterogeneity of the system, as each level of the hierarchy is characterized by different parameters. There are also differences between devices on the same level. The main optimization criteria are the time required to complete the task, the load on individual devices and energy consumption. These parameters meet the following dependencies: the higher in the hierarchy, the greater computational power; the lower in the hierarchy, the smaller the delay.
There are few examples, where communication is essential, e.g., early warning systems. From the point of view of the information system architecture, it is important that the system is characterized by very low delays and high transmission reliability [21]. Some processes require data to be sent and processed on the server. In the case of a weather breakdown, it may turn out that the sensors, which mostly use wireless communication, will not be able to send relevant information, which will make it difficult or impossible to perform the tasks. Some of this problems can be solved using passive optical multi-bus systems [22].
However, it should be remembered that in a highly distributed edge system, the computing power of system components usually decreases with the distance from the core (tree root). On the other hand, the closer to the data source, the smaller the latency. The final solution must consider both criteria and propose an appropriate compromise between the performance and quality of the interconnection.

2.2. Multiscale Modelling vs. Edge Architectures

The analysis of a wide range of edge computing systems shows that the strong distribution of its components will affect the problems related to two performance parameters: the power of individual devices and internodal communication. As it has been shown earlier, devices at the end of the network have much more limited computing power than the central component, which is most often a data center (cloud, HPC). In the case of the network aspect, a significant gain can be seen in the case of the Edge Computing paradigm. Comparing Cloud Computing with it, it can be seen that locating nodes on the edge reduces the time needed for a response—the message/packet travels through a much shorter physical distance. Moreover, edge devices, due to their smaller physical dimensions, have greater mobility. The appropriate selection of the problem to use this approach results in the improvement of the user’s experience with the service provided [6]. In particular, it is worth noting that Internet of Things (IoT) devices are usually less expensive than data centers. This allows to reduce implementation costs.
Among the most commonly used multiscale models, two computation approaches can be distinguished (Figure 2):
  • Full-field models with the same computational domain is used in both macro and micro scale;
  • Mean-field models with a single integration point in macro scale used as an input for micro scale computations.
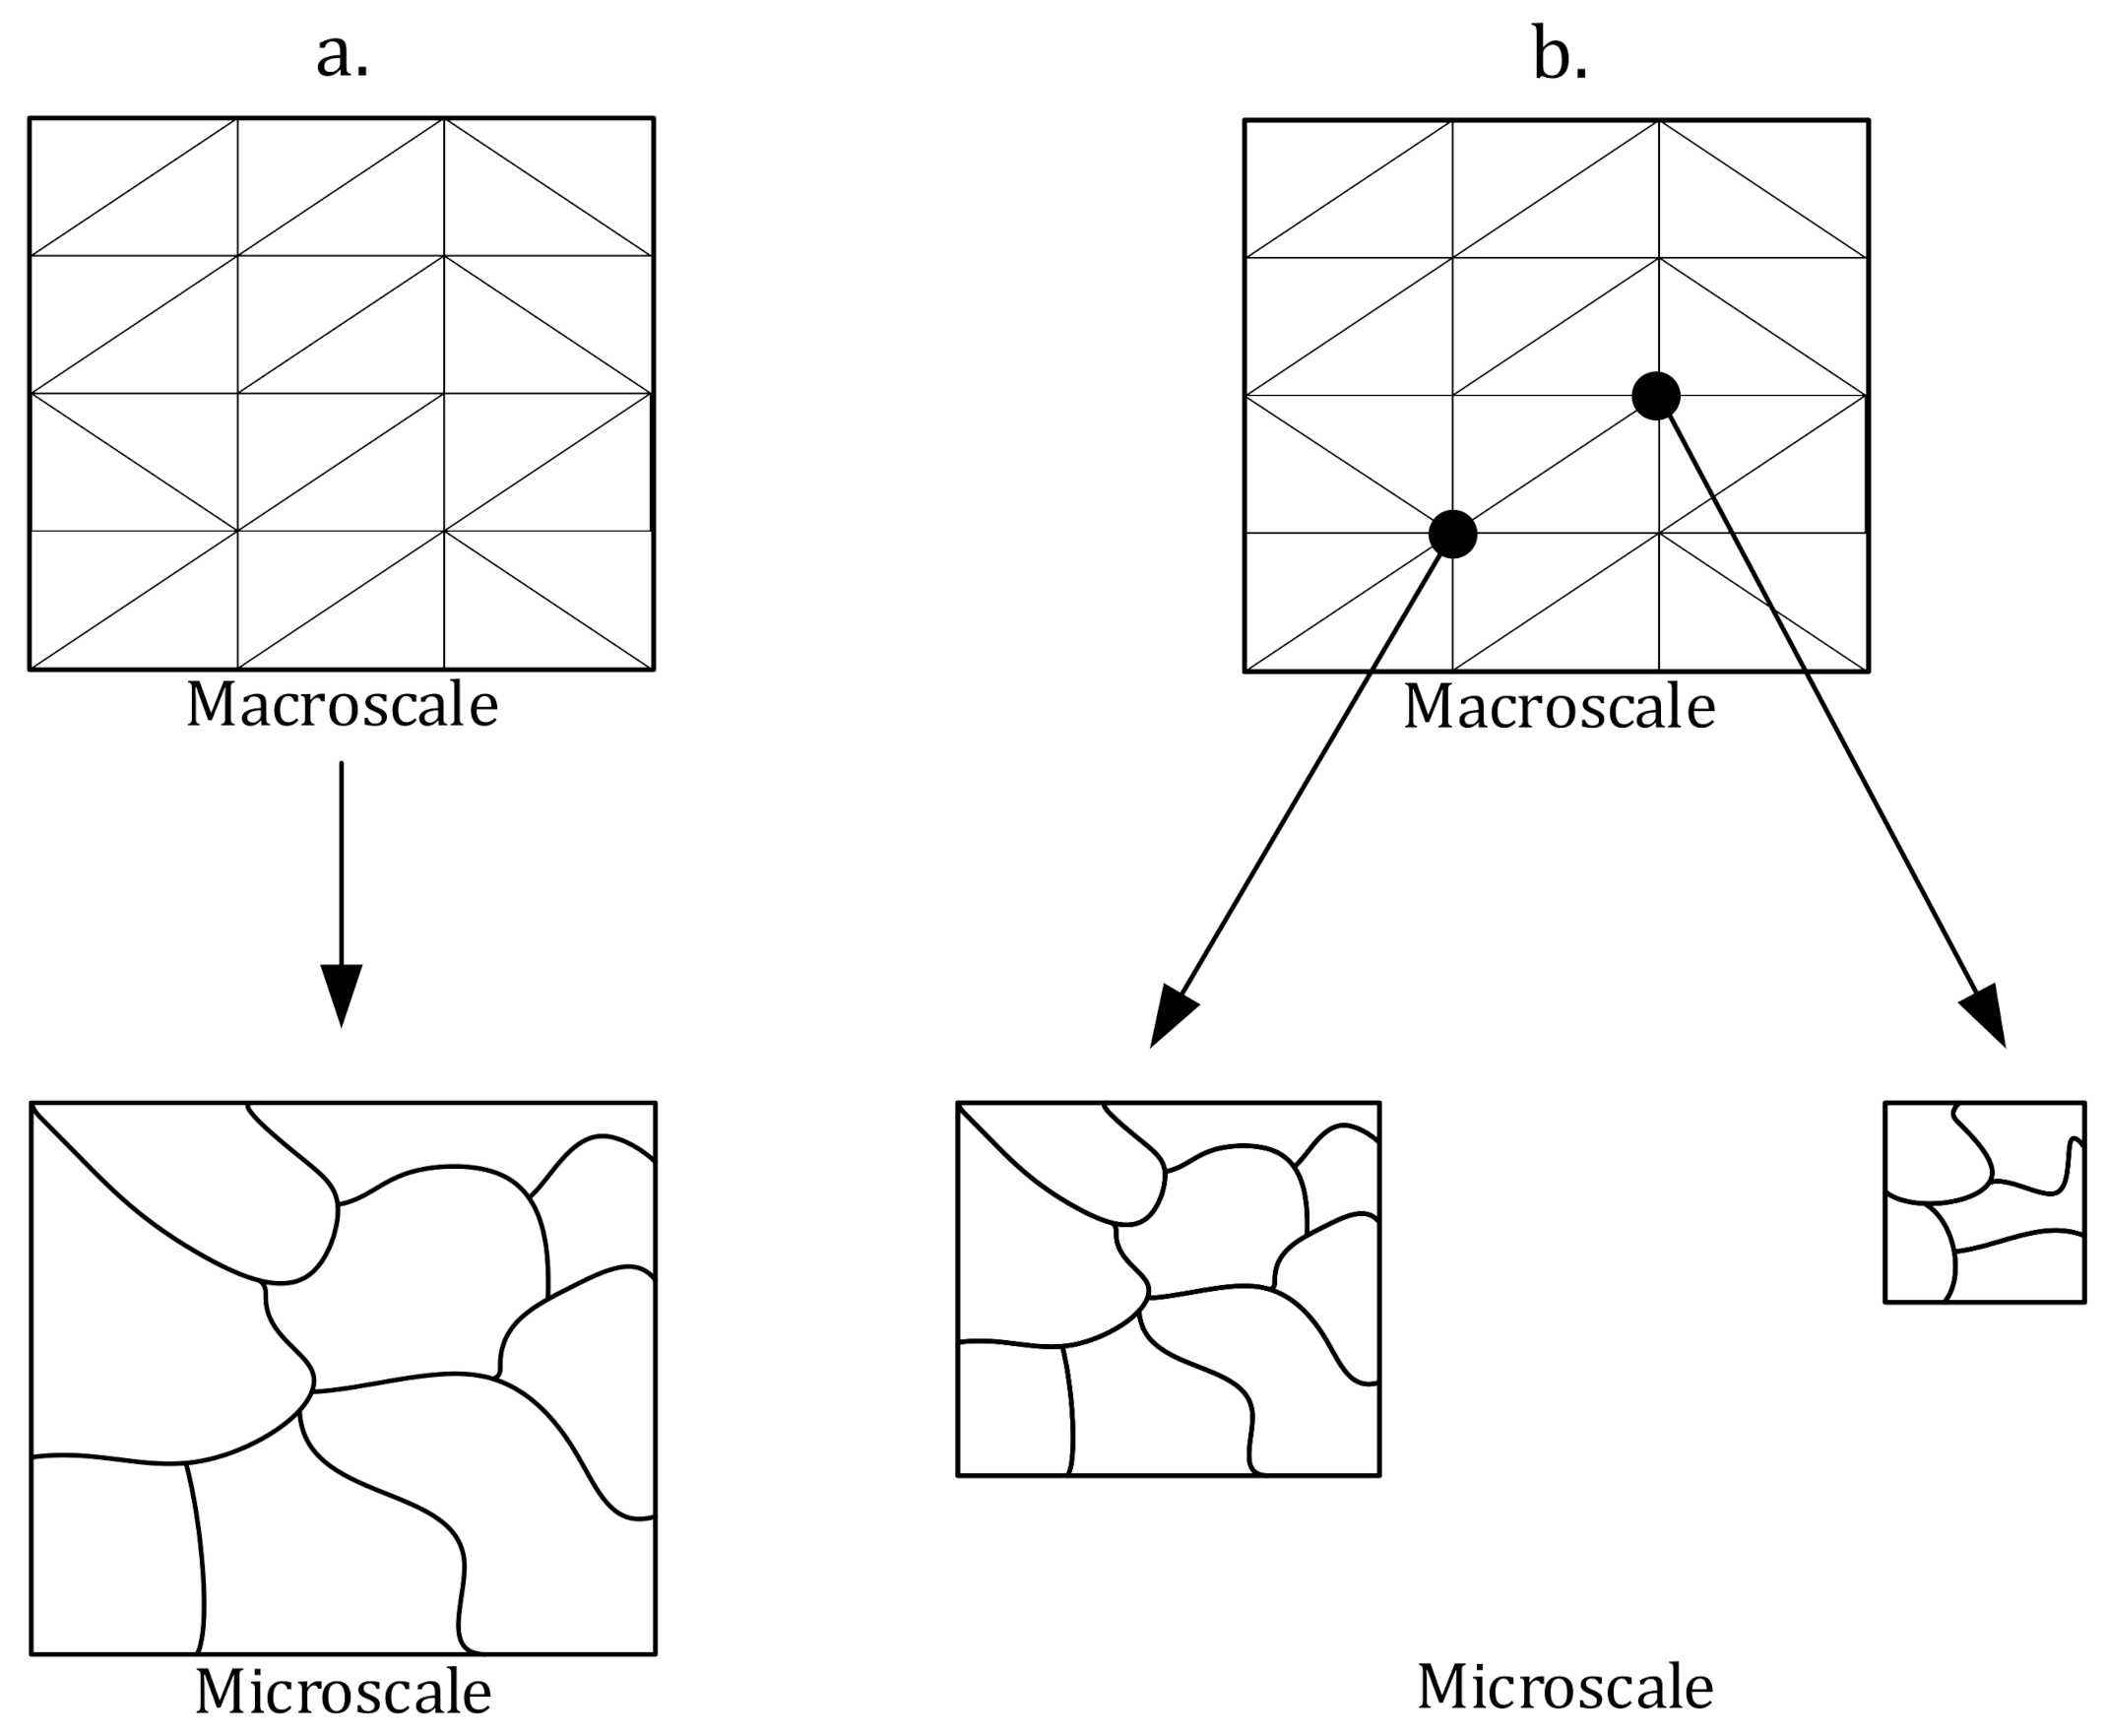
Figure 2. Types of models processed concurrently in multi-scale modeling.
Processes 09 02225 g002
In the first approach, in each iteration computations are performed for two scales: macro and micro. In the second, however, depending on the nature of the task and the size of the domain, for each iteration of the macro scale, there may be many domains in the micro scale, which may result in a dynamic increase in the complexity of the task and thus the time needed to complete it. The approach presented in Figure 2 is a loosely coupled problem (with feedback to coarse scale), which is usually computed in distributed and parallel way. Currently, the most widely used approach in such calculations is a coarse-grained parallel processing. It allows the most efficient use of each of the devices due to the lower overhead on internodal communication, which is crucial from the performance point of view for distributed systems [7,13].
In this work, particular attention is paid to grain growth process using Cellular Automata (CA). According to the current approaches to CA, it parallelizes very well on GPU streaming processors [23,24]. Using this approach the execution time can be improved by several times. Therefore, we planned to use and compare two different types of GPU processors: NVidia Jetson Nano as Edge device and RTX 2080ti in workstation.

2.3. Our Contribution

Most of the current research conducted in the field of numerical computations is related to the use of high power devices (e.g., HPC) or the modification of existing software in order to extend the functionality, eventually improve their efficiency. In this work, we focus on the use of known software approaches in the field o multiscale modelling, in particular grain growth using CA. The main difference between the existing works is therefore the modification of the hardware architecture, in particular the type of computational nodes, the available power of which is modest compared to HPC nodes. It has been proven that moving computations to edge devices, including those supported by a GPU, brings measurable benefits in terms of performance, network communication, and the user experience of using application.

3. Benchmarking

In this section, benchmarking of the system is described. At the beginning, we describe computational task to be solved, i.e., grain growth using CA. Then, we propose edge system architecture and its components. After this preparation, the benchmarking process is performed to obtain execution times and power consumption for different configurations and device types.

3.1. Definition of the Tasks Being Solved

In this work, the task of microstructure grain growth with the use of Cellular Automata (CA) method was used. CA is an abstract system consisting of two interconnected components. The first is a regular, digitalized space, representing the space of the modelled object, otherwise known as the computational domain. The second one is a finite set of states that can be taken by any cell in the domain. Each element filled in this way is called a cell that will communicate with a finite number of other cells defined as neighborhood. This communication, which is local, deterministic, and uniform, determines the global evolution of the system through specific time steps [25]. CA have been used also in other areas, among others, in cryptography and modelling of natural phenomena such as: chemical reactions, forest fires, snowdrifts, social behavior, and population dynamics.
In order to define a microstructure closer to the real cases, different types of neighborhood are used. The two most popular ones are Von Neumann and Moore. The CA method is an iterative process, and its evolution is driven by these neighborhoods. With each iteration, the state of the cells in the domain changes. In this work, we used Von Neumann neighborhood for computational performance and energy consumption assessments. An exemplary development based on Von Neumann neighborhood is presented in Figure 3.
The behavior of the CA at its edges is determined by the boundary condition. Depending on its type, it defines how the neighborhood is determined at the edges of the CA grid. The following boundary conditions are allowed
  • Periodic—cells at the opposite side are considered to be neighbors of a cell at the end of the grid;
  • Absorbing—it is assumed that there are only empty (dead) cells outside the grid.
To sum up, for the the benchmarking process we defined a task of microstructure grain growth based on CA. To execute this task it is necessary to create two domains containing the current and previous state of the automaton. At the beginning, the number of points (nuclei) from which the growth begins is selected as a parameter. The transition rules are defined by Von Neumann neighborhood and are as follows: if the currently processed cell has a zero state (is dead) and there is another one with non-zero state (nuclei, grain) in its neighborhood, then it takes this state. If there is more than one cell with non-zero state in the neighborhood, then the processed cell takes the dominant one. An absorbing boundary condition was applied. These transition rules are presented in Algorithm 1.
Algorithm 1 Cell’s state transition rule using Von Neumann neighborhood and absorbing boundary condition.
  • Require: A , A p r e v , n , m                                  ▹ Current and previous state of CA, respectively; n,m-CA sizes
  •    N n × m                                                                                                                                    ▹ Size of the CA
  •    i d c u r r e n t c e l l i d
  •    X { }                                                                                                                              ▹ State occurrences map
  •   if A p r e v [ i d ] < 1 then
  •     if  i d m > 0 and A p r e v [ i d m ] > 0  then  X { A p r e v [ i d m ] } X { A p r e v [ i d m ] } + 1
  •     end if
  •     if  i d + m < N and A p r e v [ i d + m ] > 0  then  X { A p r e v [ i d + m ] } X { A p r e v [ i d + m ] } + 1
  •     end if
  •     if  ( i d 1 ) / n = i d / n and A p r e v [ i d 1 ] > 0  then  X { A p r e v [ i d 1 ] } X { A p r e v [ i d 1 ] } + 1
  •     end if
  •     if  ( i d + 1 ) / n = i d / n and A p r e v [ i d + 1 ] > 0  then  X { A p r e v [ i d + 1 ] } X { A p r e v [ i d + 1 ] } + 1
  •     end if
  • end if
  • A [ i d ] m a x ( X )                                                                               ▹ Set new state with most frequent state
The state transition rule should be executed as many times as there are cells in the CA domain. The automaton space is represented by two one-dimensional vectors: the previous and current state. For the implementation, C language was used. For parallelization we used CUDA library for computations on GPU, and OpenMP on CPU. The task defined in this way was used in the benchmarking process.

3.2. Architecture of the Edge System

The next step was to identify the components of the edge system and connect them together, thus defining its architecture. Ultimately, this platform is used to execute numerical calculations in the field of multi-scale modelling. In this study, the main focus was to solve grain growth task using CA method. This is a task category that can be parallelized very well using both CPU and GPU. Thus, devices with both CPU and GPU units were used for the edge system construction. However, it should be noted that the process of initializing GPU memory may be inefficient for a small domain size, hence the CPU remains the main computing unit in the designed system.
It was assumed that the edge system consists mainly of devices with low computing power, i.e., RaspberryPi 4B (RPi4B) and NVidia Jetson Nano (later Jetson). There will also be a workstation (WS) as supporting device, equipped with NVidia graphic card. These are computational components used to solve the tasks scheduled by the last element of the architecture-gateway. Its main task is to distribute computations to the devices, return results to clients and monitor the load of each of the system components. Gateway also needs to be aware of the difference between CPU and GPU computations in order to use resources efficiently. Specification of each component is presented in Table 1.
At the moment, the system does not define the minimum and maximum size of the CA. Due to the computational cost of initializing CPU and GPU parallelization, a decision must be made on how to execute the task. The proposed edge system can operate in one of three modes: single-CPU (sequential), multi-CPU (parallel), and GPU (parallel). Combinations of, for example, two of these modes are allowed, but this only applies to WS. There are two reasons for this:
  • RPi4B does not have a GPU unit, so this mode is not available for this device. Although combination of single-CPU and multi-CPU modes can be considered, however any significant benefits should not be expected, due to the availability of only 4 cores;
  • Jetson has memory shared between CPU and GPU units. It is possible to use both of them simultaneously, but it has two drawbacks. First, GPU computing makes sense for a large portion of data. In this case, the memory of 2 GB will be the limiter-it will not be possible to execute similar task at the same time. Second, regardless of the task class, computing on the GPU in CUDA requires at least one CPU core to execute main application (host operations). Only three cores are then available, which makes the simultaneous use of both units inefficient.
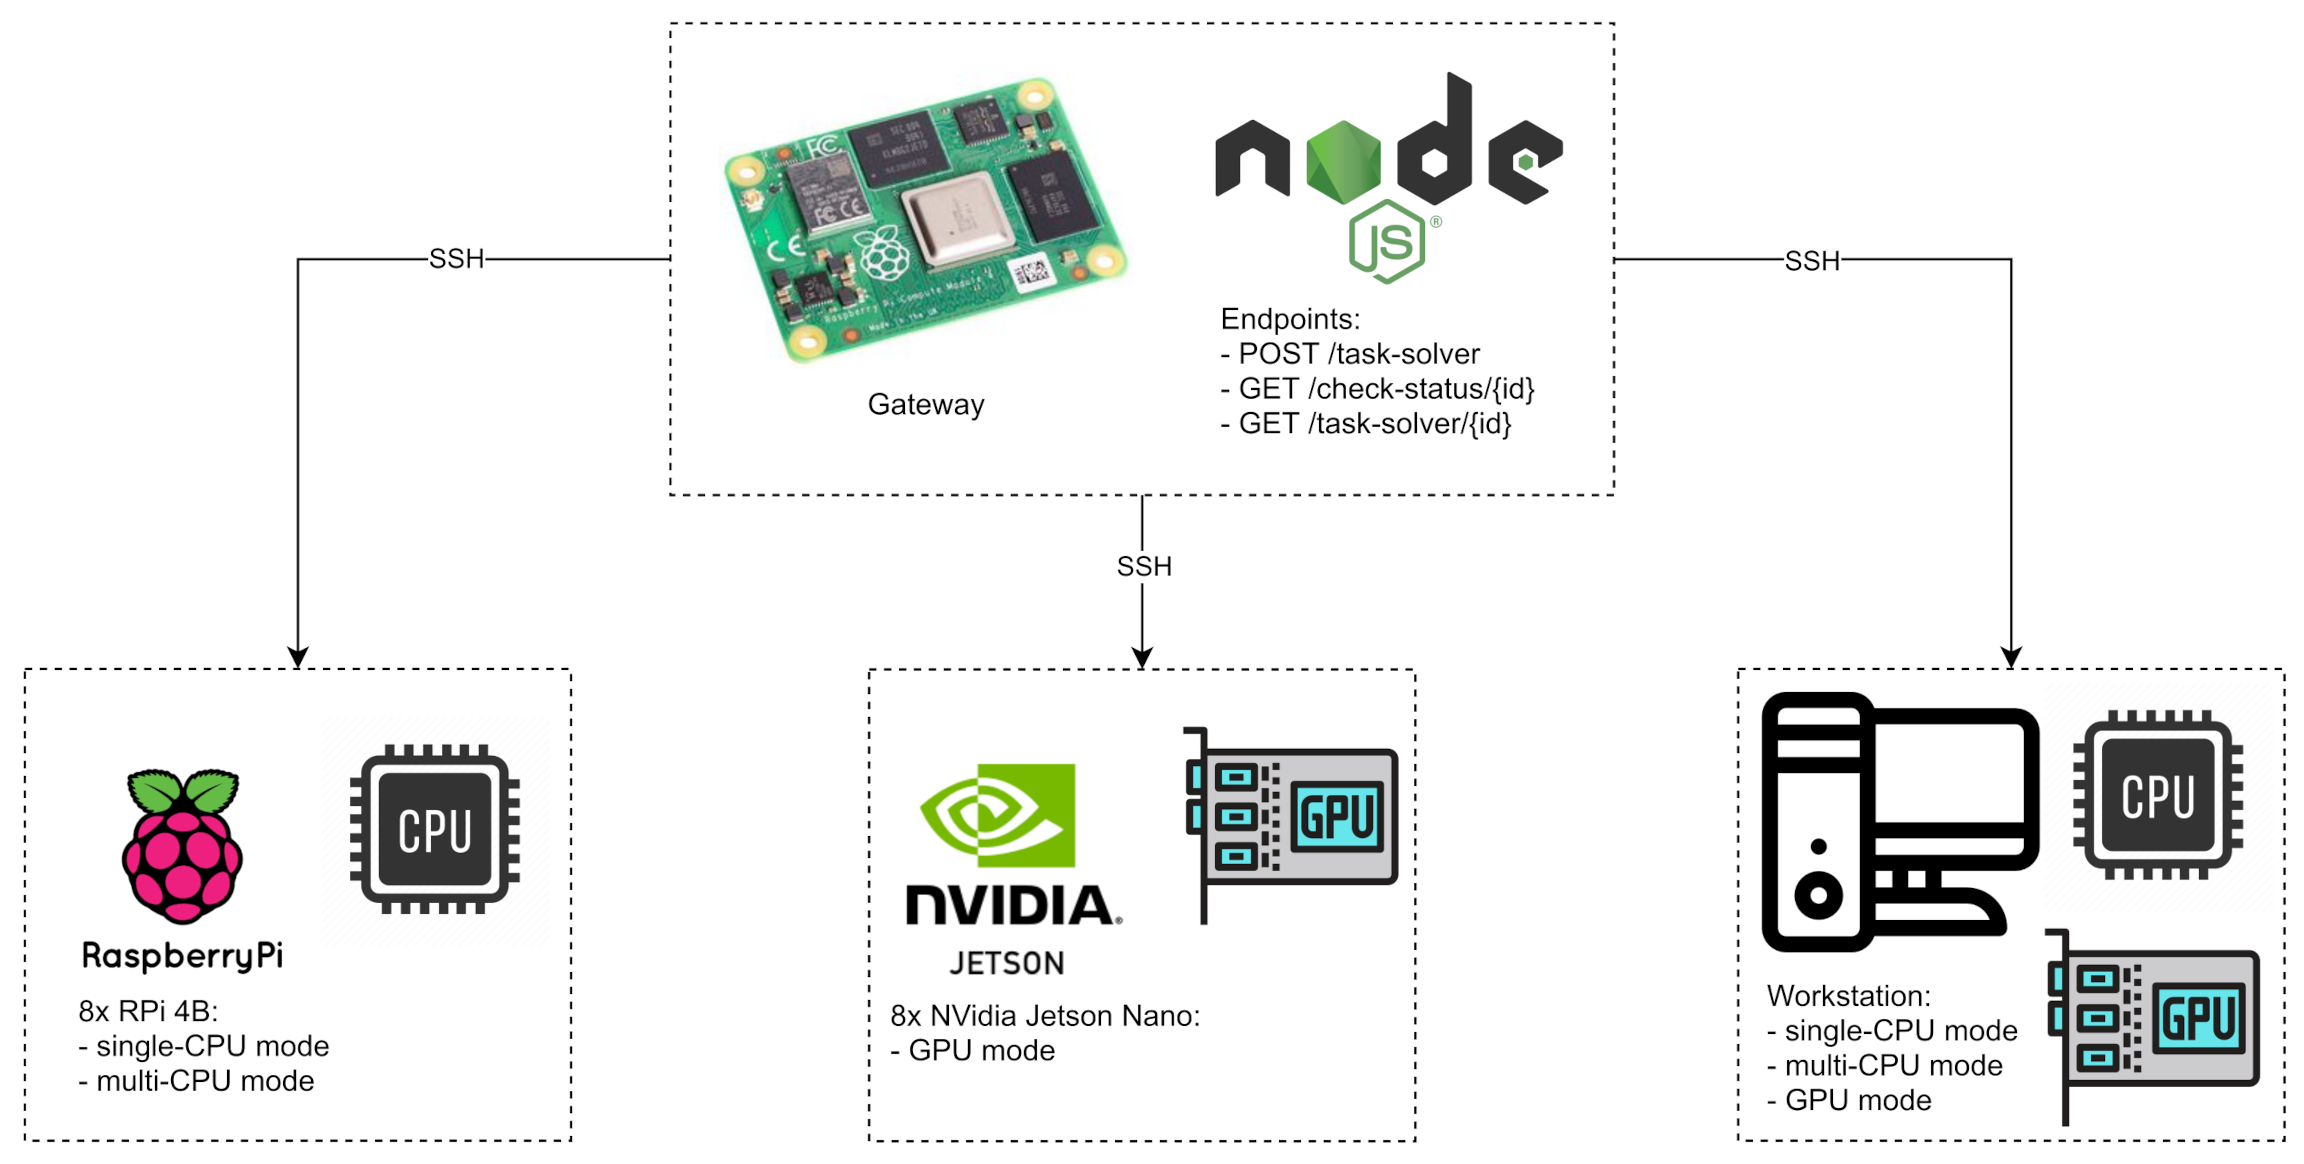
An additional device was used to distribute computations, RaspberryPi Compute Module 4 (RPiCM4), equipped with an expansion board with two network interfaces (NIC). It is a gateway to the computational infrastructure. This devices hosts a web application, implemented using NodeJS and express framework, used to schedule computations. The device performs computations via SSH protocol. In the same way, it checks the state of computations and fetches the results. The application has three Representational State Transfer (REST) endpoints:
  • POST/task-solver—schedules computations on the infrastructure. CA domain size is given as an argument. As a response, it returns the unique id of the requested task;
  • GET/check-status/{id}—checks the status of computations. It can return one of four states: does-not-exist, in-queue, computing, completed;
  • GET/task-solver/{id}—returns the results of computations, if they have been completed. Otherwise, it returns an error.
The described components are used to construct edge computational system, that executes CA-based grain growth tasks. The architecture is presented in Figure 4.
Appropriate applications written in C have been prepared for each device. There are three versions of the app in the entire system, compatible with the operating modes:
  • Sequential—written only with C;
  • Parallel on CPU—for this purpose, OpenMP library was used, which allows the program to be run on multiple cores using #pragma preprocessor directives;
  • Parallel on GPU—CUDA library in version 10.1 was used for implementation. Higher versions are not supported on Jetson platform. Main execution unit is kernel, the single launch of which computes the state transition in one full iteration of CA.
The prepared applications were deployed on devices, in accordance with their intended use, as in Figure 4. The next step is to propose and perform benchmarking process.

3.3. Benchmarking Methodology

The edge system presented in Figure 4 was benchmarked. Due to the fact that the system uses edge and IoT devices for computations, apart from the computation time in relation to the CA domain size, the energy consumption was also measured during task execution. During the measurements, in order to eliminate the randomness of the generated nuclei, it was assumed that the initial state of CA has 1 nuclei, placed in the lower right corner of the CA ( A [ N 1 ] , where N 1 —index of the last CA element).
The benchmarking included measurements for each of the three operating modes. For single-CPU mode, weak scalability was calculated depending on the number of programs running and the execution time depending on the size of the computational domain. In the case of multi-CPU mode, where a single program is running on multiple cores (Single program–multiple data, SPMD), the speedup value for the WS and RPi4B were calculated.
The last GPU-mode requires more attention than the previous ones. On the one hand, the performance factors were calculated, i.e., speedup in relation to the program running on single core and running on maximum number of cores per device. On the other hand, the stream structure of the GPU processor and operations on its memory are important. For this reason, the times of CUDA API procedures calls, their comparison with the kernel function, and differences between RTX2080ti and Jetson, were also analyzed.
For single-CPU mode, the coarse-grained parallel computing approach was used in this study. Full programs were launched, performing numerical calculations of naive grain growth. A single thread dealt with the computation of one automaton. This approach allows the maximum use of resources, without waiting times for communication for synchronization. Therefore, the natural way of efficiency measurement is weak scalability (weak scaling efficiency), which is defined as follows:
E = t p a r ( n , m ) t s e q ( n , m )
where:
  • t p a r —computation time for parallel processing (multiple cores involved);
  • t s e q —computation time for sequential processing (single core involved);
  • n , m —two dimensional domain size.
For multi-CPU and GPU modes with parallel execution, a program based on fine-grained parallel computing, where a single thread will calculate a fragment of the domain and where inter-node synchronization is necessary to obtain the correct result, was prepared and implemented using C programming language with OpenMP library for multi-CPU, and CUDA for GPU modes. Each CA domain has been divided among CPU threads. The maximum number of threads was chosen based on the maximum capabilities of the machines in the edge system. To evaluate the performance of the solution, the metric of strong scalability, called speedup, was used, the value of which was calculated based on the following formula:
S = t s e q ( n , m ) t p a r ( n , m )
where t s e q , t p a r , n and m have the same meaning as in weak scaling efficiency E, presented in Equation (1).

3.3.1. Single-CPU Mode

First, the influence of the device class on the calculation time was examined. For this purpose, a series of consecutive calculations of microstructure growth from 10 × 10 to 8 m × 8 m was performed. All measurements were selected for the 4 m × 4 m domain, because for this case all threads worked under full load and there were no disturbances related to the earlier termination of the remaining calculation processes.
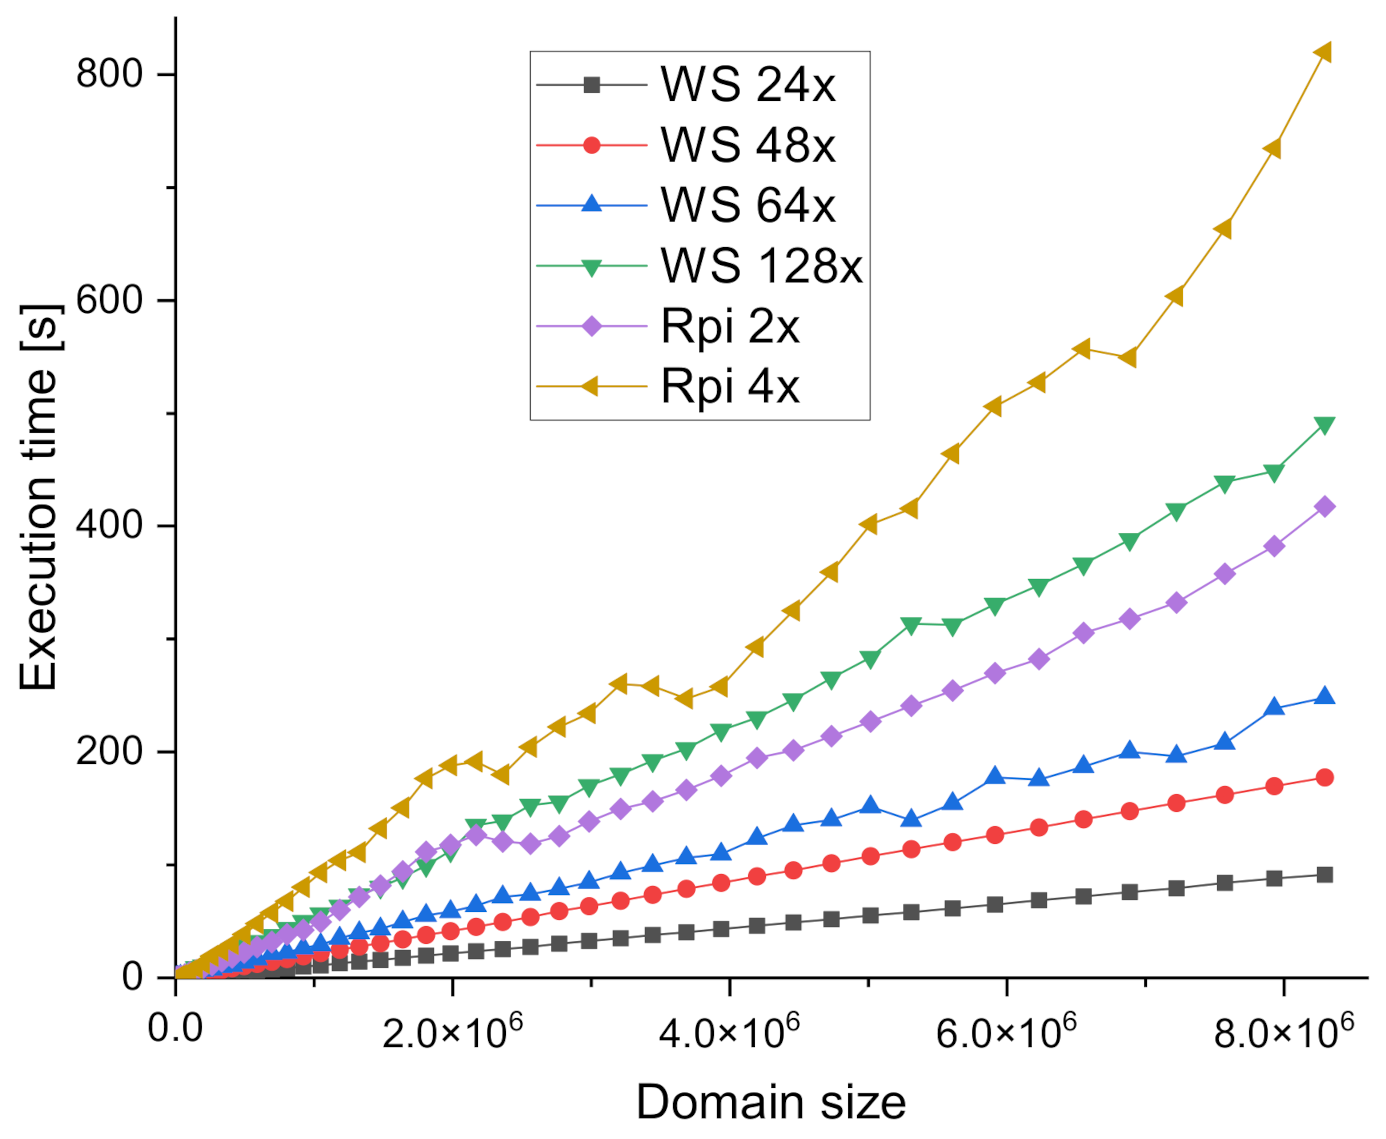
The measurements were made three times: in the case of the workstation, the process was repeated three times, while for the RPi, the calculations were run on four devices at the same time. Computations were made for various load variants. The selected values are mainly related to the physical configuration of the devices. For the workstation, the times for low load (2, 4, and 8 cores), medium (12 cores), full (24 cores), using HyperThreading (48 cores) and overload conditions (64 and 128 cores) were tested. The conditions for RPi were similar: low (1 core), medium (2 cores), full (4 cores), and overload conditions (8 cores). The results are presented for the computing time of a single automaton with the domain size of 400 × 400. The comparison is presented in Figure 5.
Comparing the execution times, it can be seen that the RPi is the slowest in the above list at maximum load. The next ones are the workstation with a configuration of 128 threads, RPi for two threads and a workstation for 64. Moreover, the stability of the computation times for the workstation was compared. After analyzing data from Figure 5 it was noticed that after exceeding 48 threads (number of logical cores for this machine with SMT), the context switching stops being predictable and there are several percent difference in times per iteration which may result in a poorer resource utilization in case of fine-grained problems.
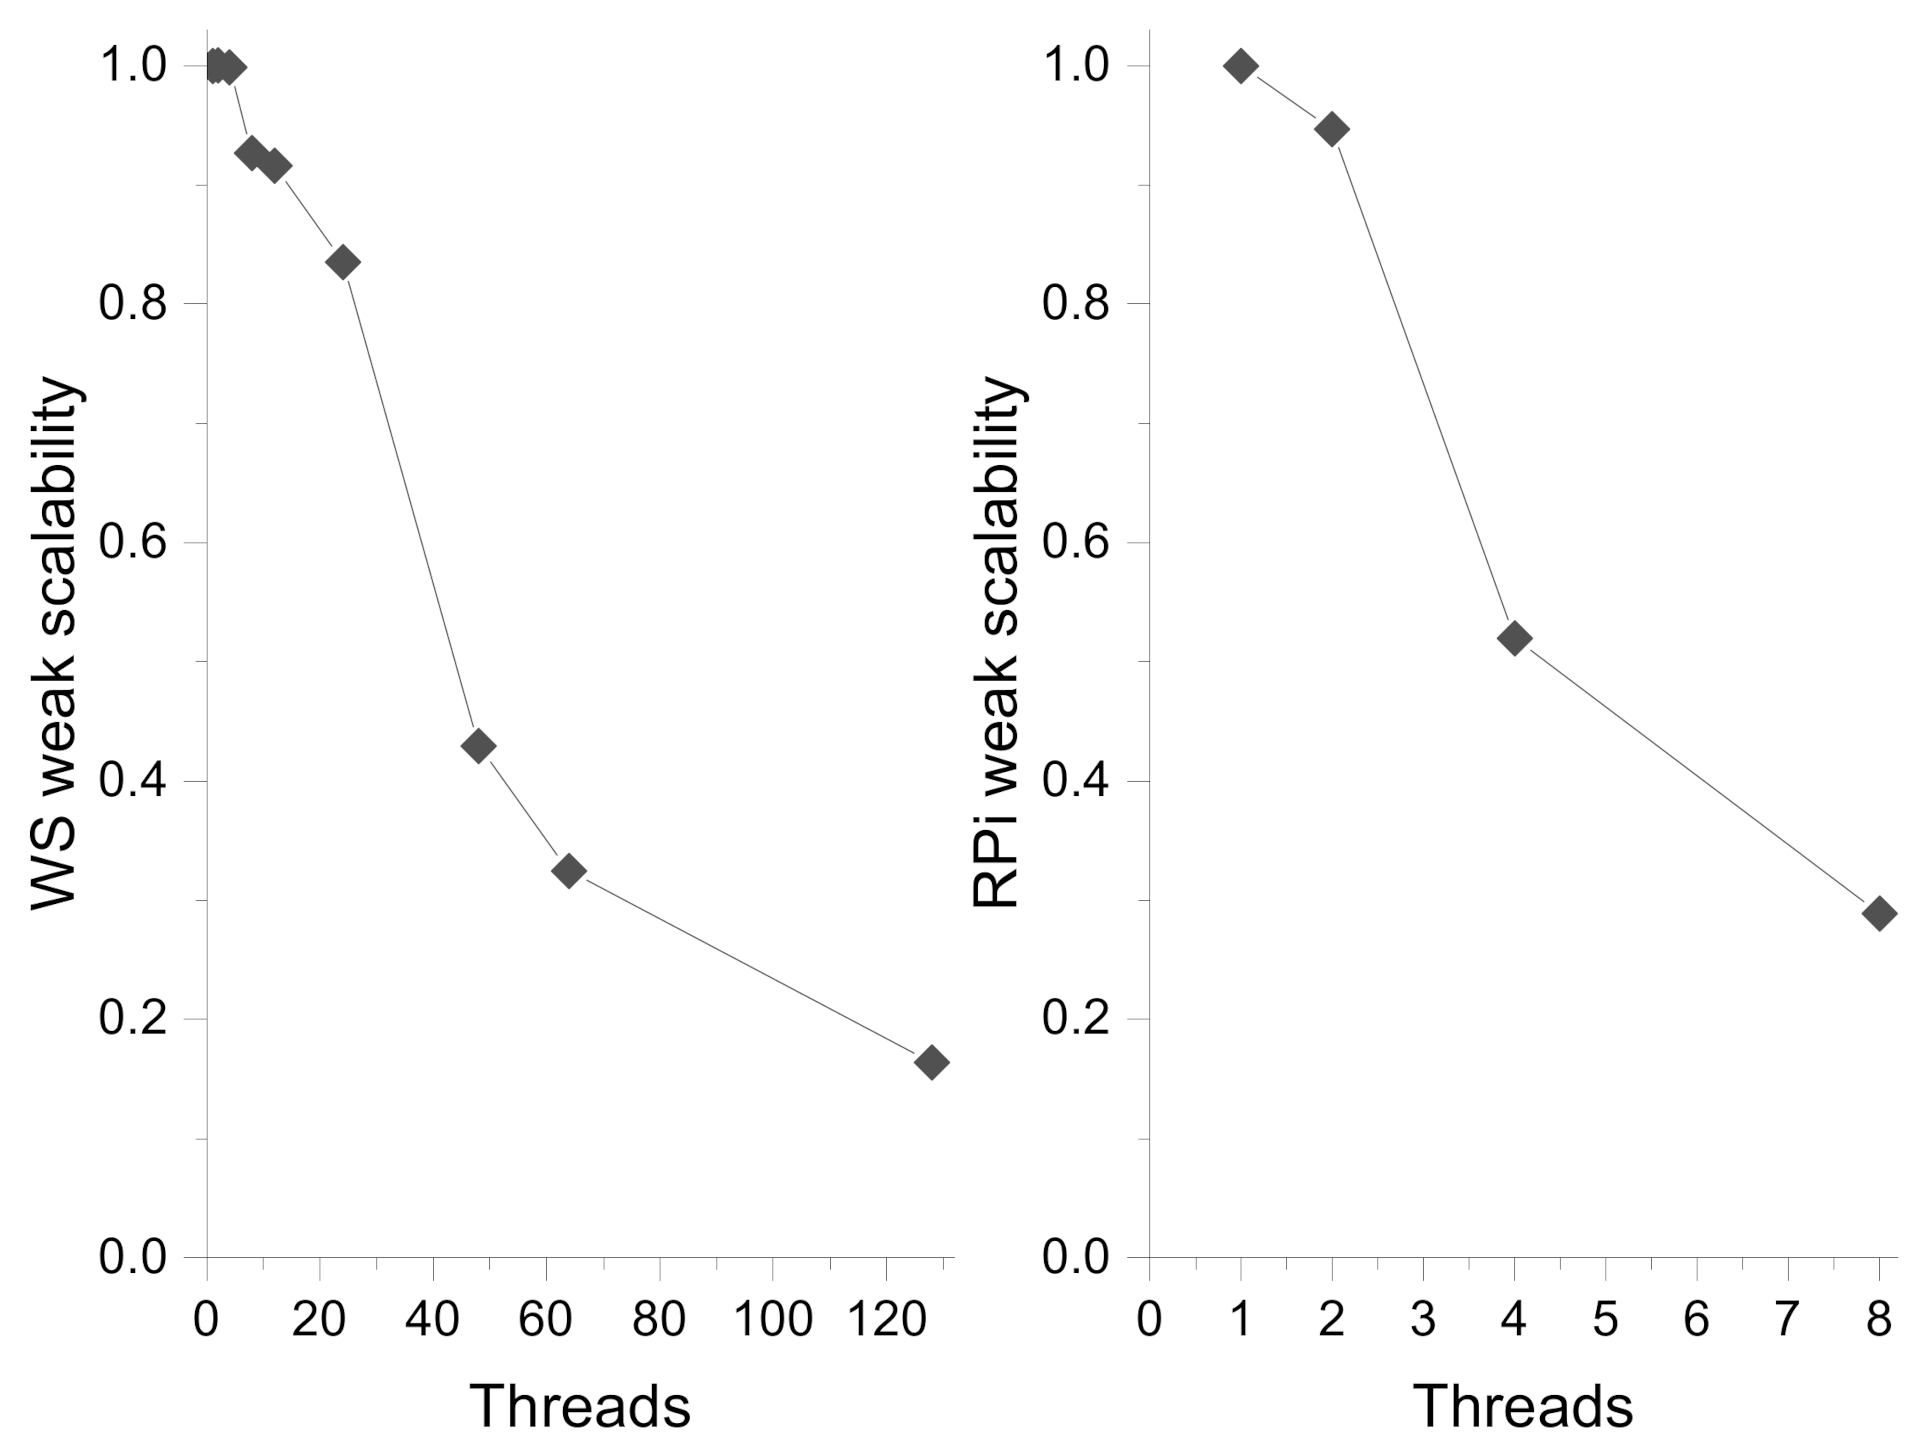
For the obtained measurements, the weak scalability was calculated. Based on Formula (1), the efficiency measurements for the devices participating in the tests were calculated and gathered in form of graphs. The comparison between workstation and RPi is presented in Figure 6.
Usually, any IoT devices also perform other functions in the system, e.g., measuring, sensing, communication tasks with other devices. When loading such devices, it is important not to fully load them in order to stable working of their original functionalities [26]. In this paper we assumed that each of RPi should be loaded with a half of its computational capabilities.

3.3.2. Multi-CPU Mode

The second case of computation that is benchmarked is multi-CPU mode. In this case, computations of the grain growth task were performed, the execution of which was carried out with the simultaneous use of many processors. The task was parallelized using OpenMP library and was run on two types of devices: WS and RPi4B. Due to the construction of Jetson GPU system, it was not used in this mode.
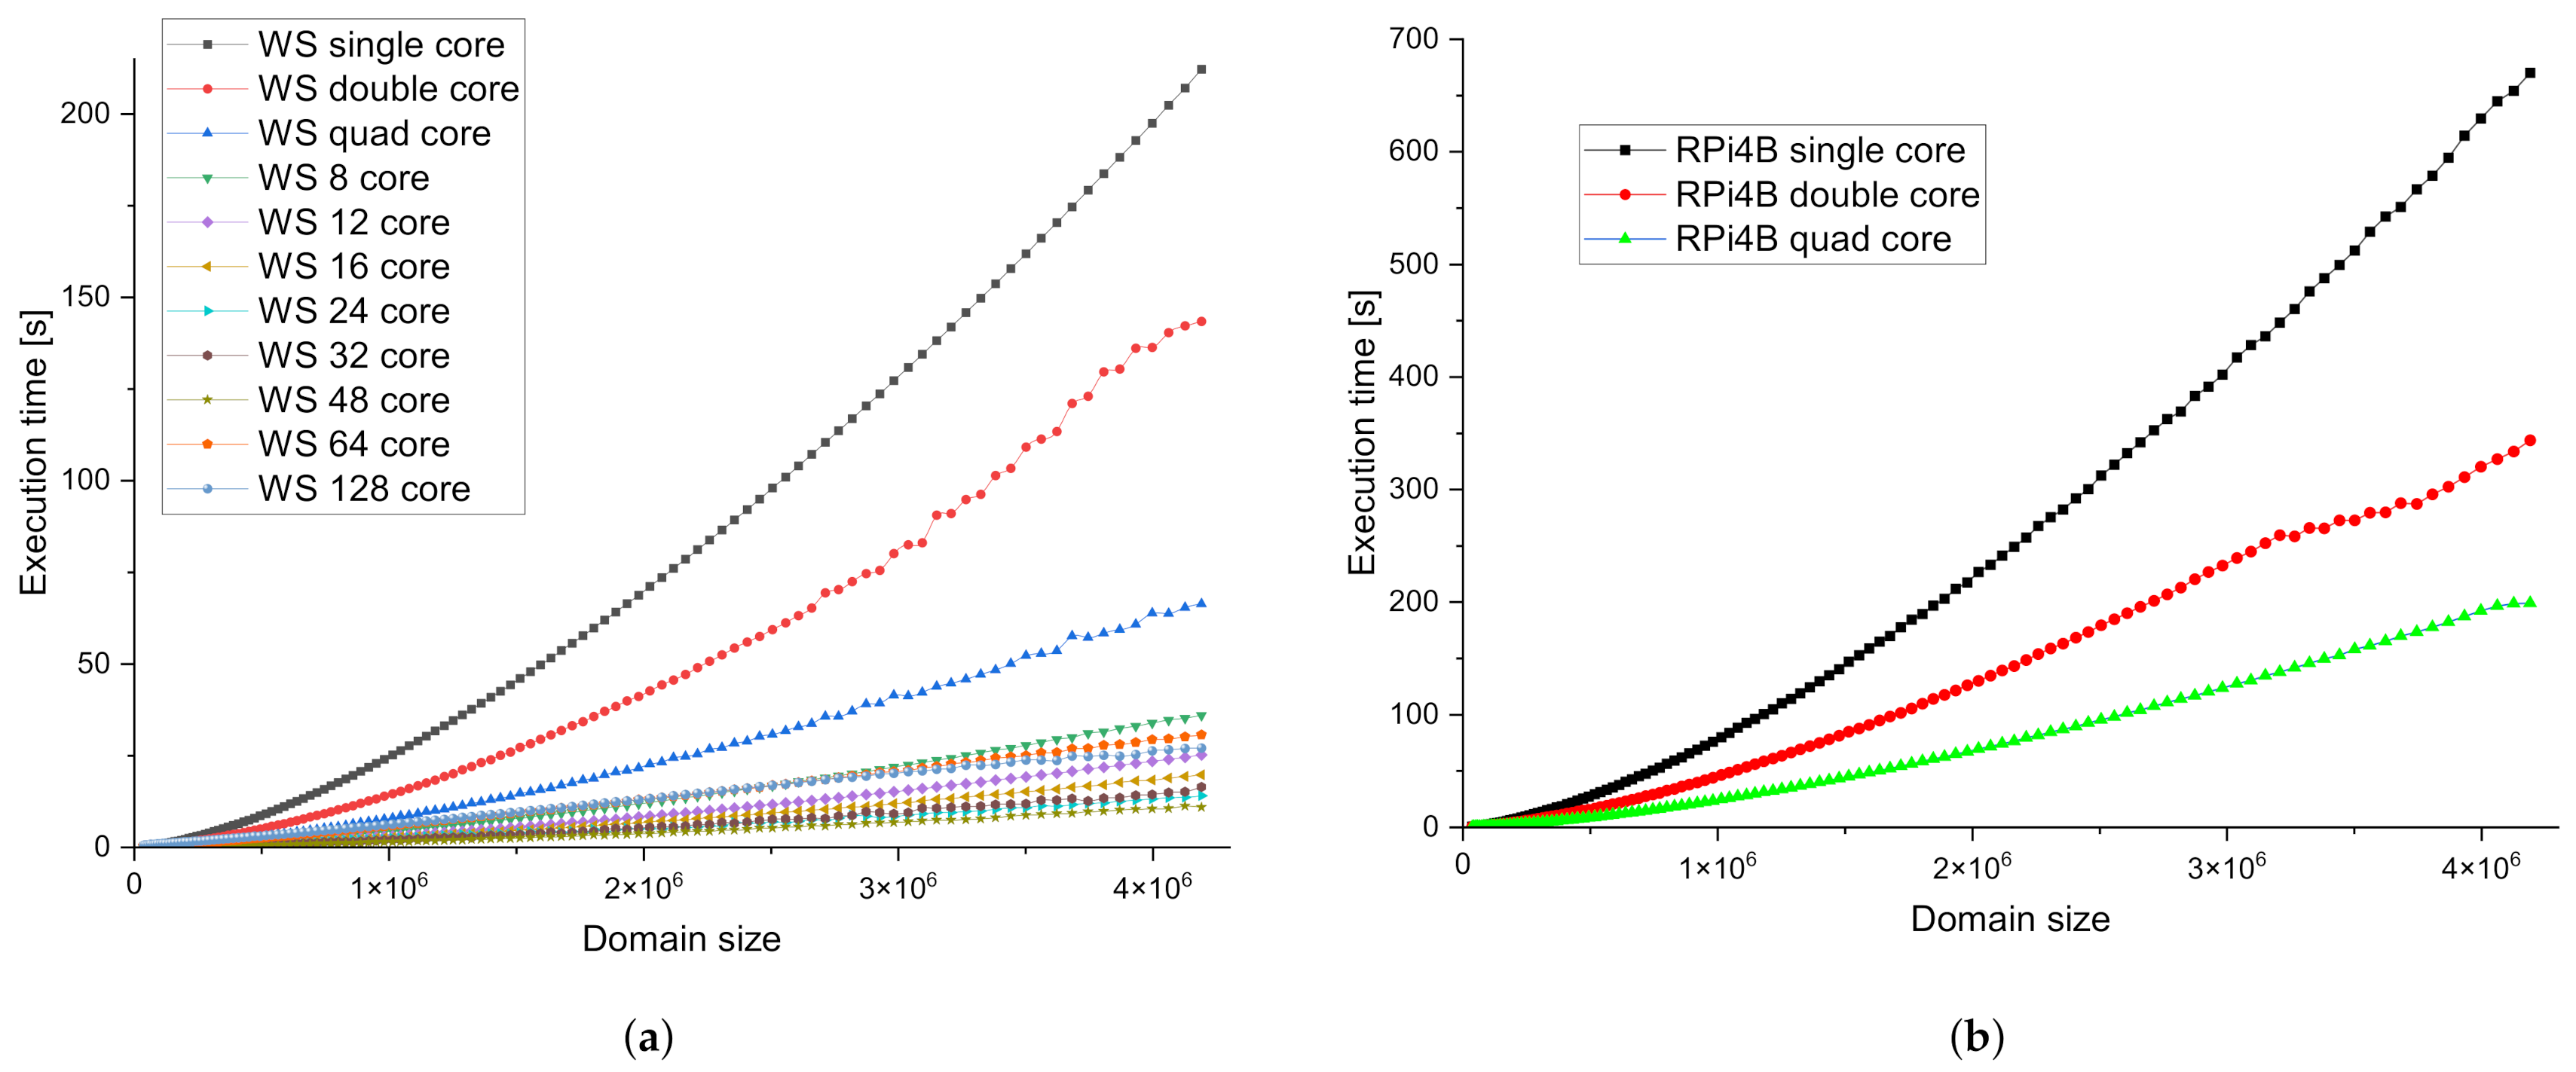
First, computations were made for different sizes of CA with a constant number of processor cores involved in execution. Then, the computations were performed in the same way, changing the number of cores that OpenMP could use. Results of this step was presented in Figure 7.
The best results was obtained for WS using 48 cores, which is the maximum number of logical cores on this device. In the case of RPi, better improvements in execution time can be seen between single and double core computations than between double and quad. This may result from the passive heat radiation from the CPU.
To compare the capabilities of the devices, a strong scalability metric was used, the values of which for WS and RPi4B were calculated using Equation (2). Speedup values were calculated for CA with 2000 × 2000 domain size. The results depending on the number of cores are presented in Figure 8.
According to the speedup results, WS performs best for 48 threads. Small performance drop can be noticed using 32 threads instead of 24 (physical cores). In order to execute tasks efficiently on WS, the scheduler should assign CA computations on 24 or 48 threads. In the case of RPi4B, the best performance is obtained for 8 threads. However, the difference between 4 and 8 threads is very small and executing task with this overhead can in the end lead to thermal issues.

3.3.3. GPU Mode

The last mode used in this work is GPU-mode. In this case, the possibilities of GPU acceleration were used: CA evolution parallelizes well on GPUs [23,24]. For GPU computations, WS with NVidia RTX 2080ti and Jetson Nano with 128 CUDA cores were used. The main difference in implementation, compared to multi-CPU mode, concern the need to allocate additional buffers and memory transfer: Host-to-Device and Device-to-Host. In order to transfer current state to previous state vector between CA iterations, the Device-to-Device memory copy procedure was used.
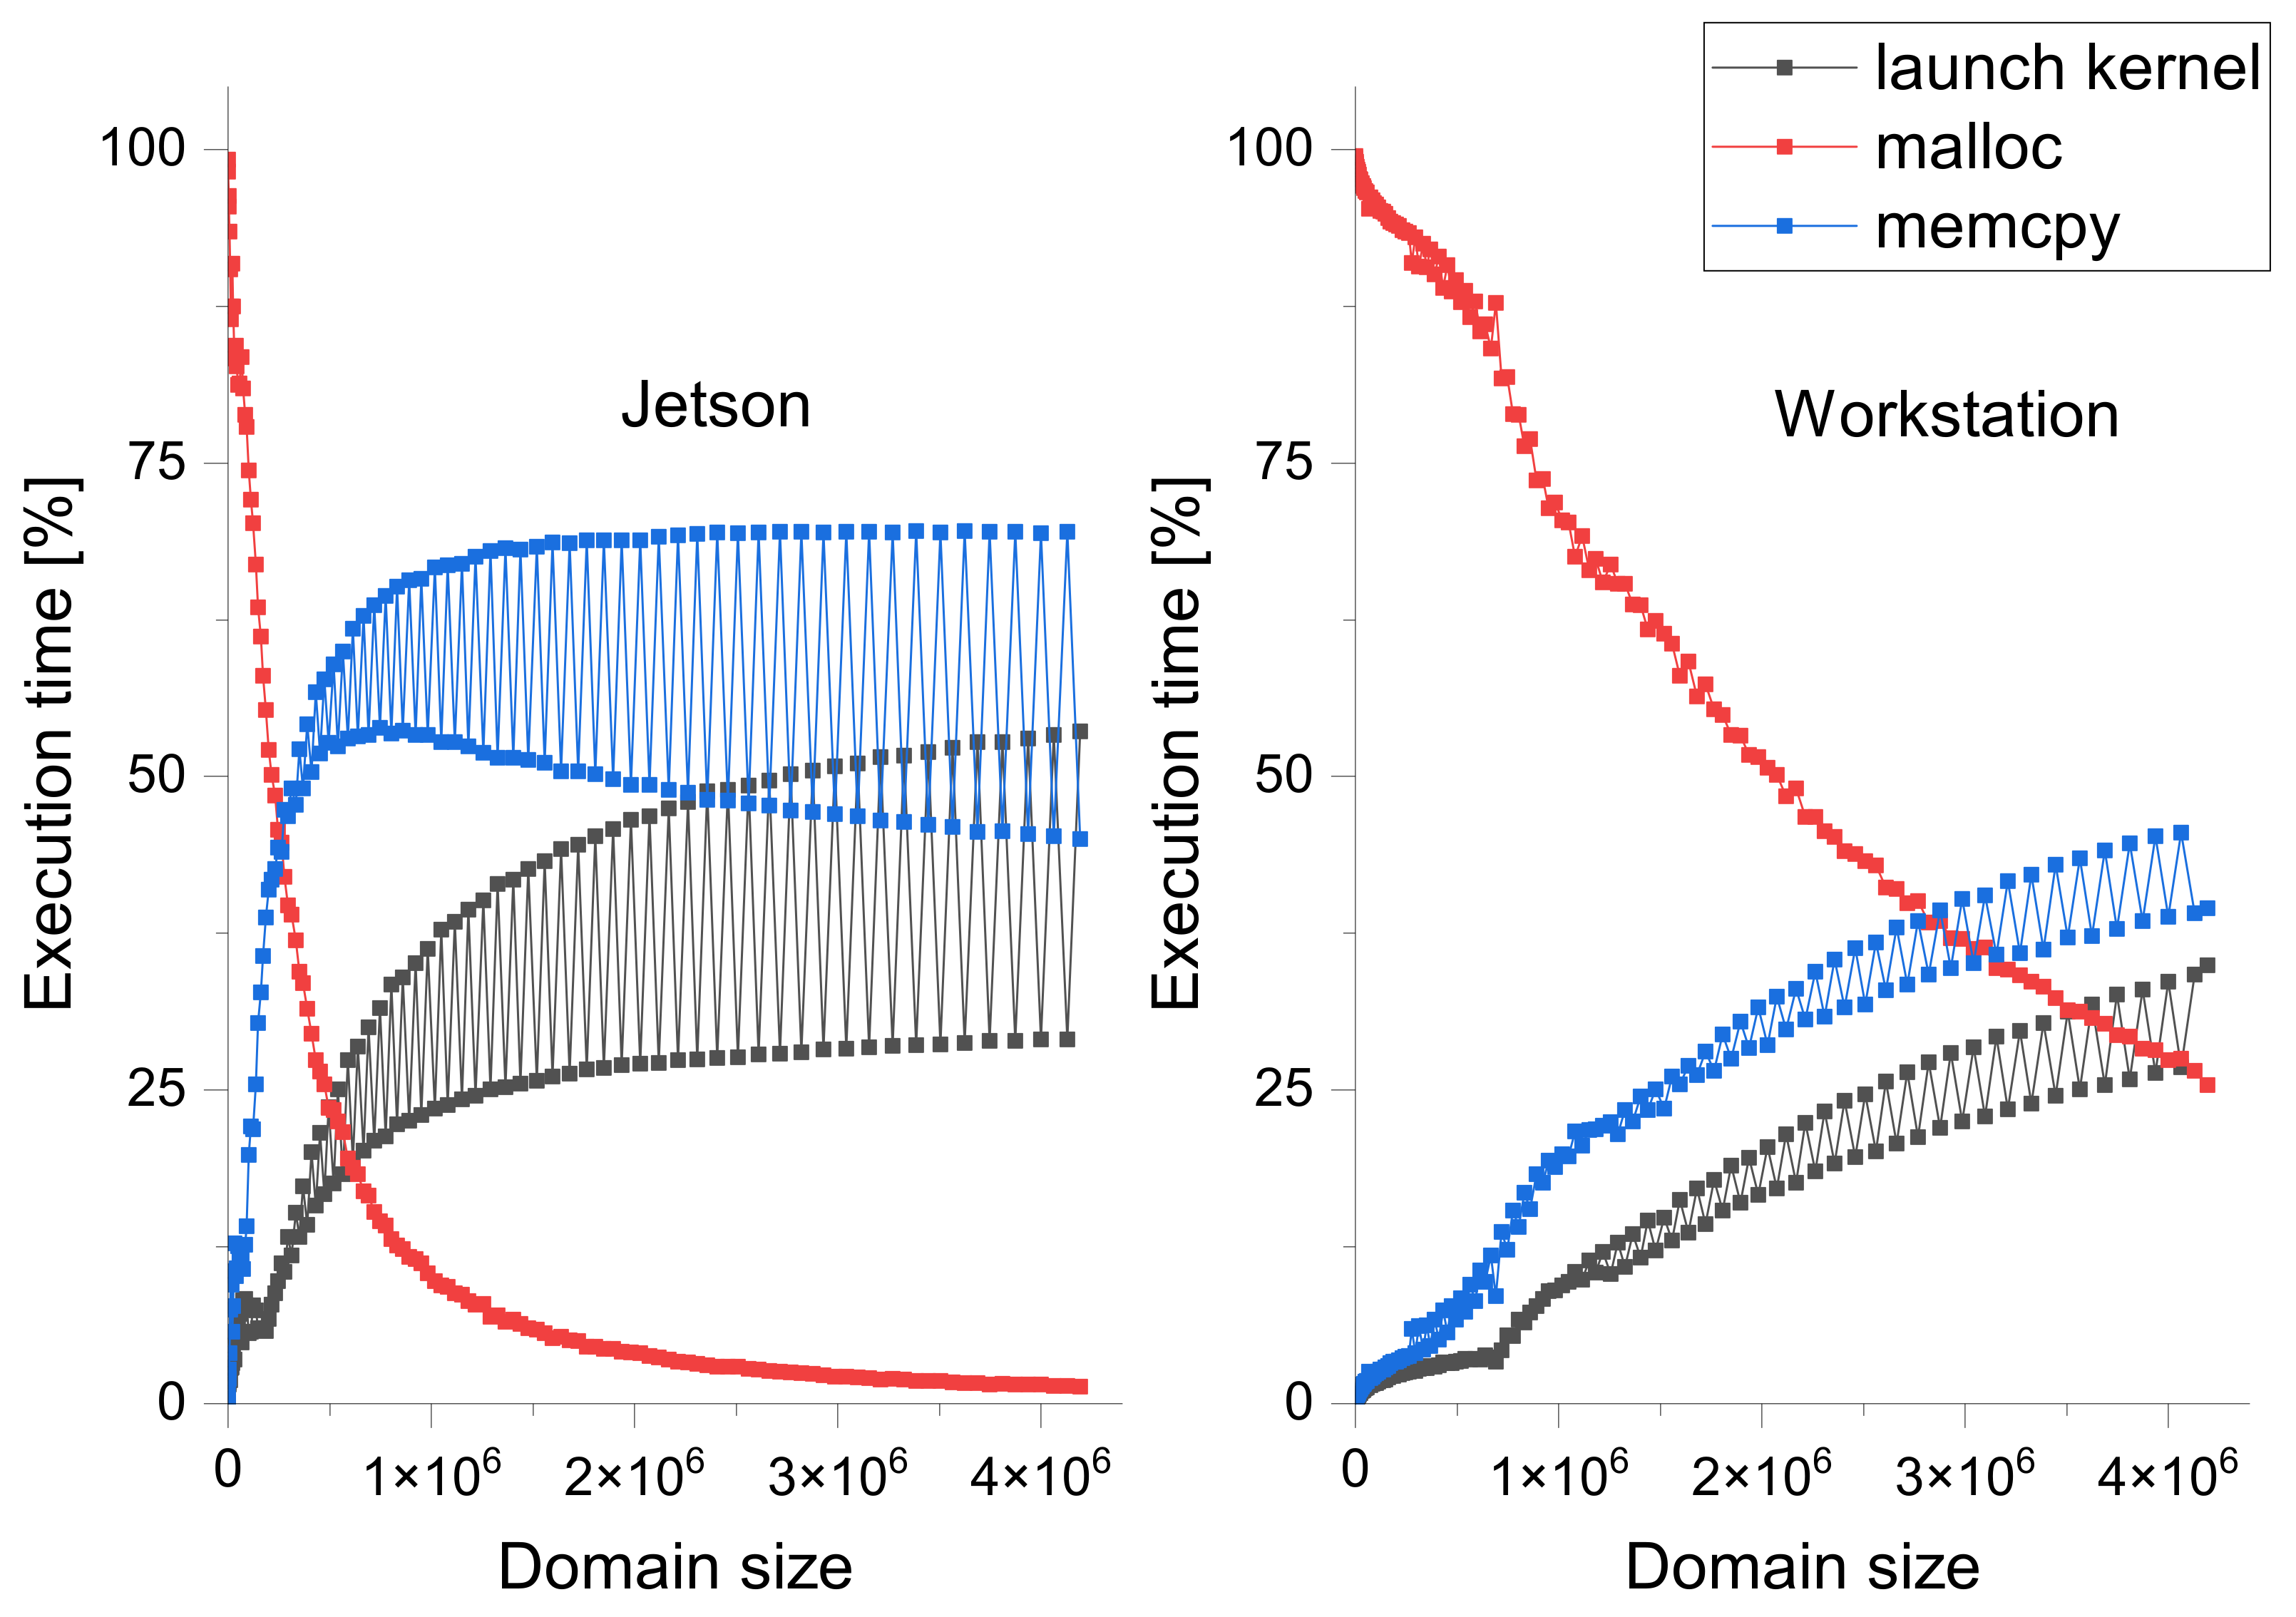
One of the key factors affecting the performance of computations on GPU is memory access. Therefore, the first step was to analyze the use of CUDA API procedures and the performance of kernel function in terms of the share of their execution time. In Figure 9, the percentage and absolute execution times of API and kernel calls depending on the size of CA domain was presented.
Due to the fact that the GPU and RAM memories cannot be interchanged in CUDA, the overhead for memory allocation (malloc procedure) has a significant impact on execution time for CA with small domain sizes. Overhead loses its relevance faster with Jetson due to to aspects: RAM and GPU memories are shared, and Jetson has fewer CUDA cores than RTX2080ti. When scheduling tasks in a heavy load conditions, the size of the machine should be considered: very large CA domains (greater than 4m elements) for WS and [ 1 m ; 4 m ) for Jetson.
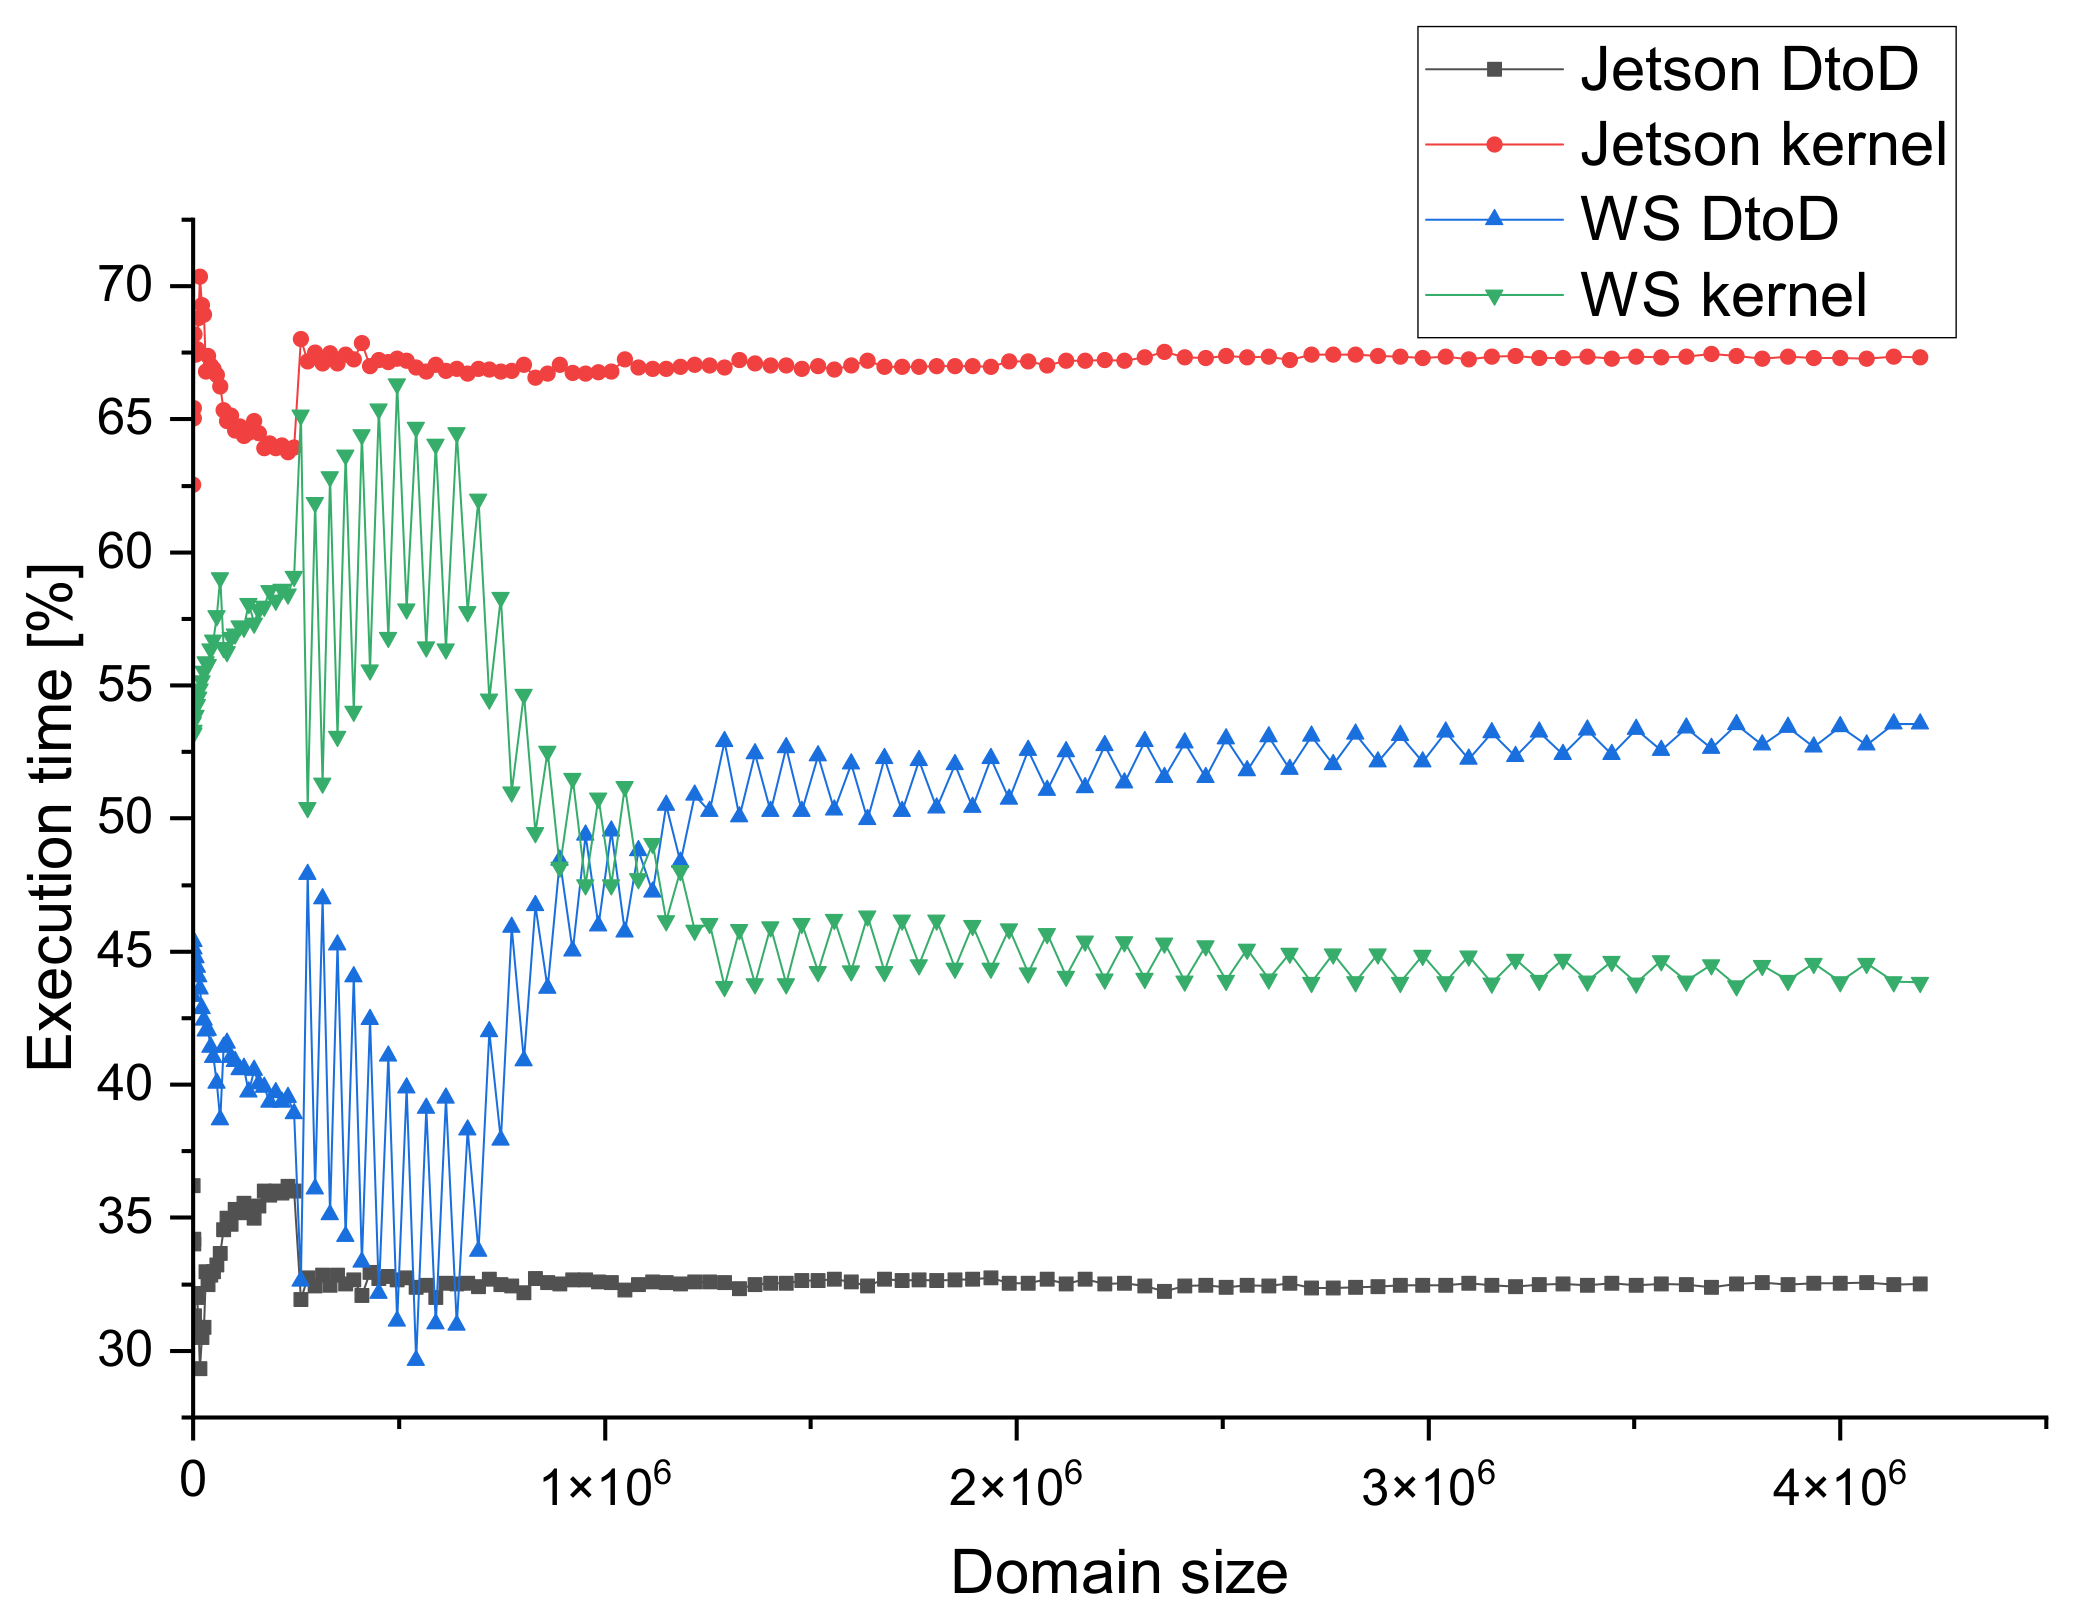
The second key factor of the GPU-mode is the analysis of GPU activities. There are five main operations: Device-to-Device transfer (DtoD), Host-to-Device transfer (HtoD), Device-to-Host transfer (DtoH), and kernel execution. Their relative time of execution for WS and Jetson are presented in Figure 10.
Due to the fact that importance of HtoD and DtoH memory transfer is decreasing significantly very quickly, the values have been omitted in the chart. It can also be noticed that with a large computational domain, a significant portion of the execution time is spent on Device-to-Device memory transfer. It possibly can be optimized by preparing CUDA kernel to perform this operation. Simple case was tested and improvements, without any changes in GPU grid and block sizes, and only 3–5% faster execution occurred.
In Figure 9 and Figure 10 there are fluctuations of the execution time. The main reason for this is the domain size iteration step, which does not have equal value. In every computations, the block size of CUDA thread block was 64. If domain size is not divisible by that number, then such behavior may occur. If the domain scheduled for computations does not have proper size, this parameter should be optimized by scheduler in order to obtain better performance.
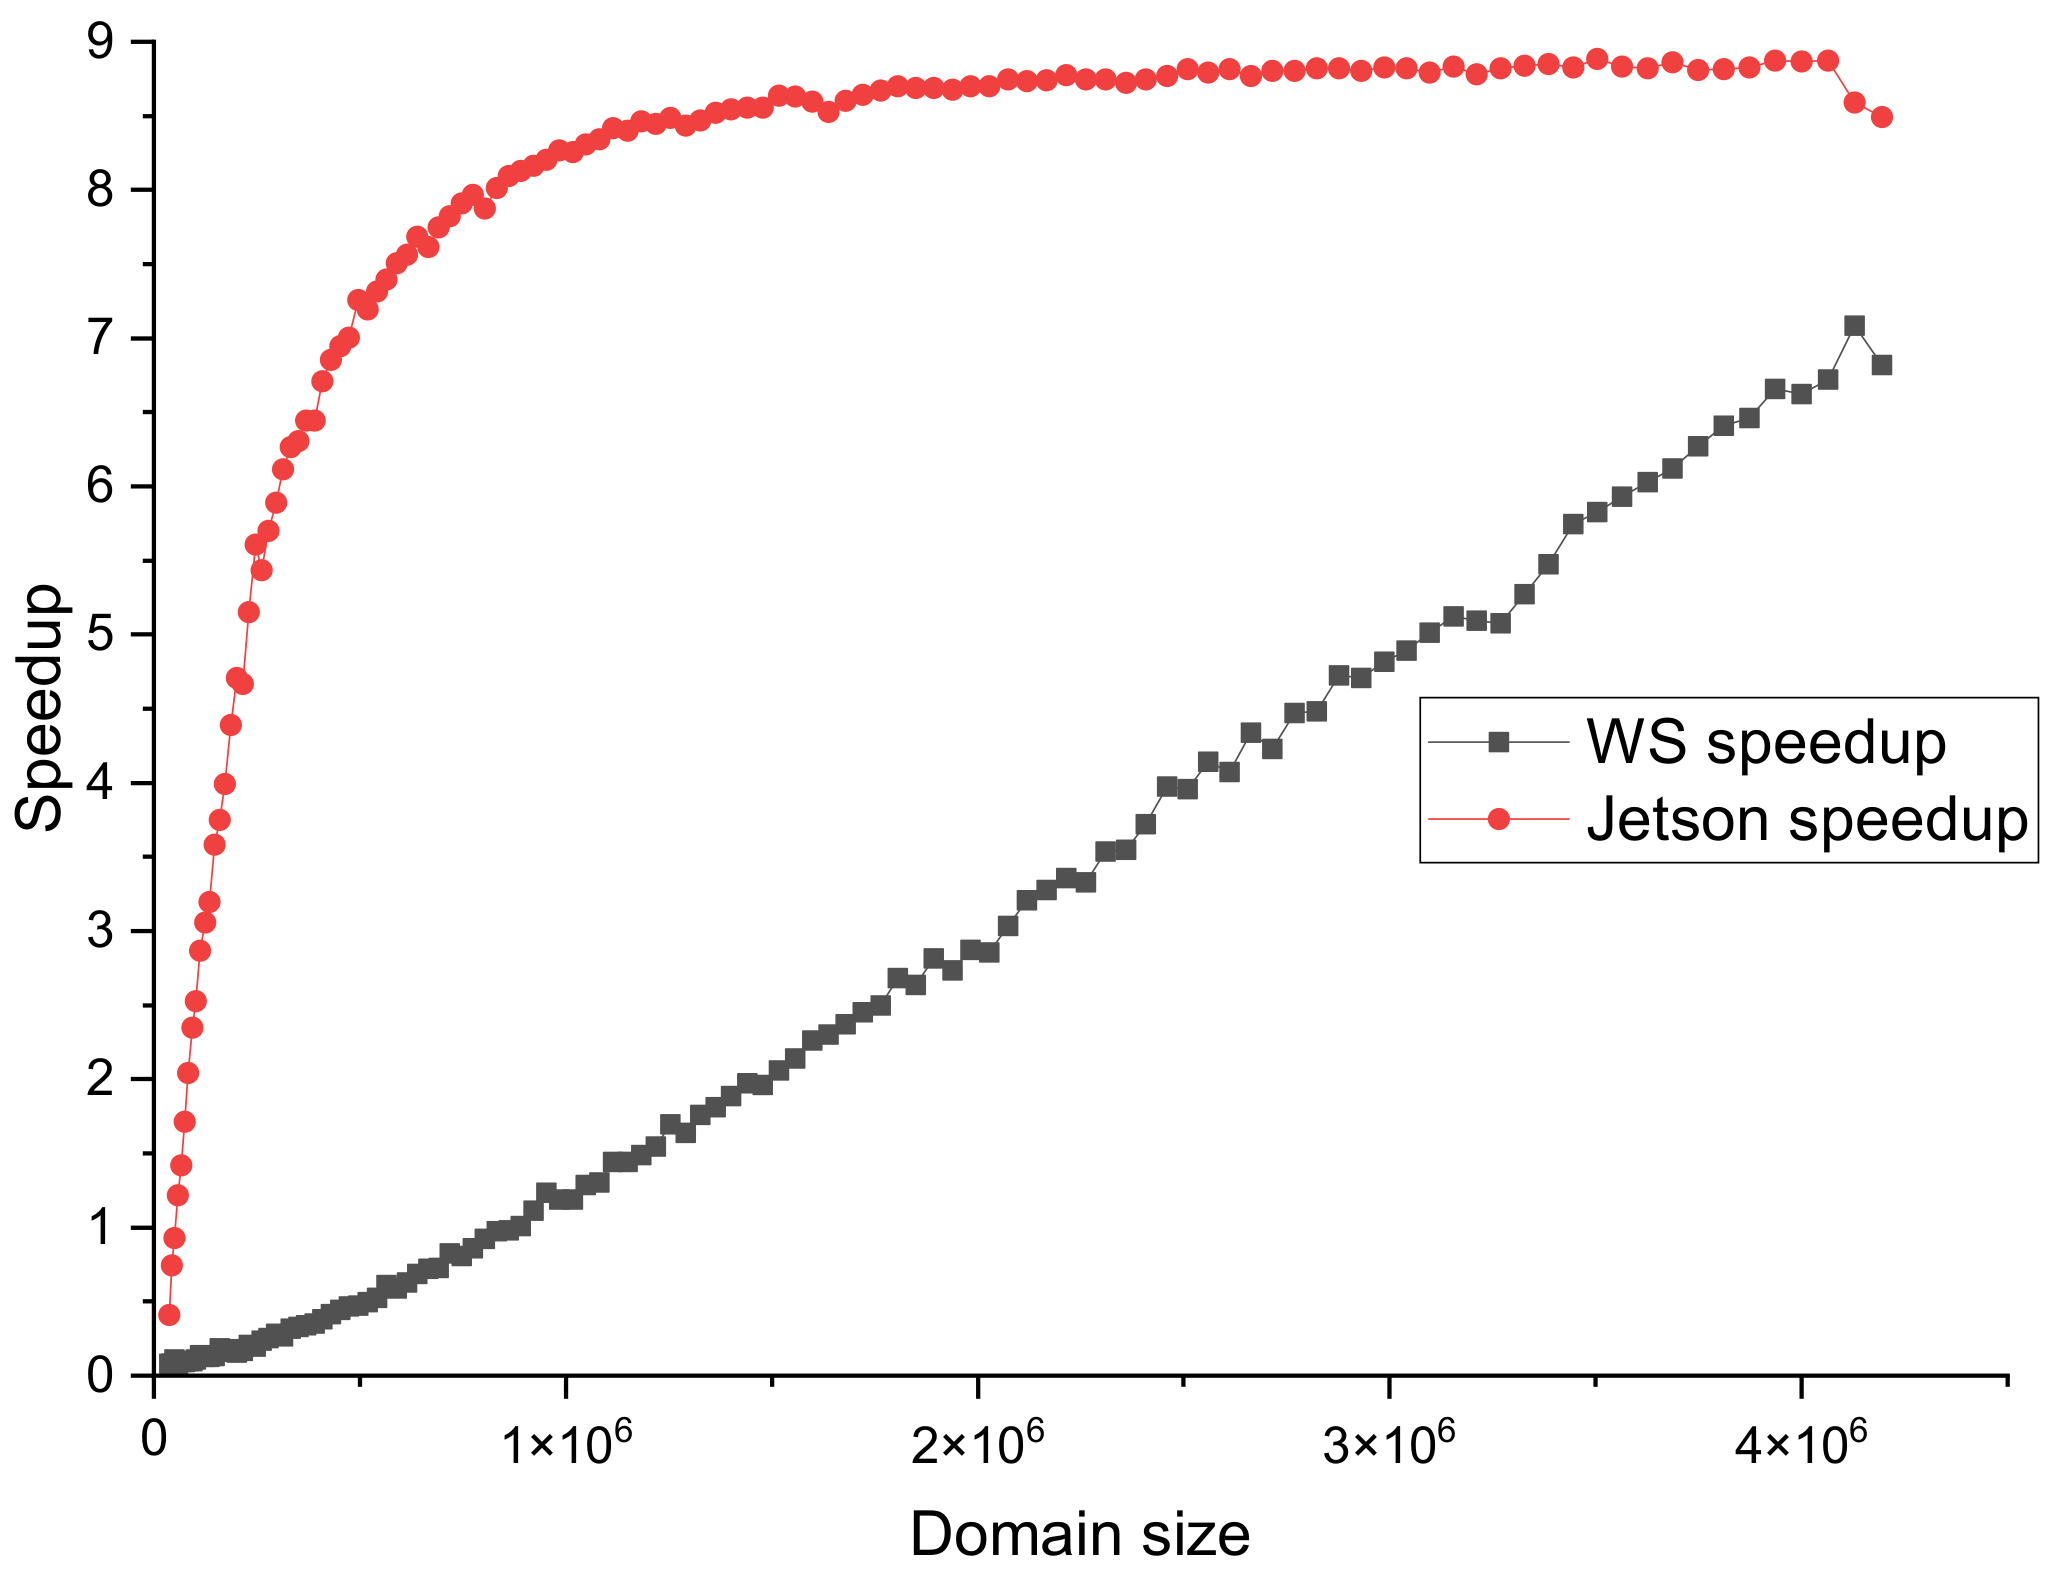
The final step of benchmarking is calculation of the speedup value for GPU-mode compared to the single-CPU mode. The calculations were made for CA of size 2048 × 2048 . Using Formula (2), the calculated speedup value for GPU vs. single-CPU mode is 131.37 for WS, and 32.54 for Jetson. Additionally, GPU-mode execution times were compared to multi-CPU mode using the maximum number of available processors per device: 4 for RPi4B and 24 (48 with HT) for WS. The results are presented in Figure 11.
Noticeable performance improvements for Jetson can be seen till domain consisting of 1m elements. Later on, the number of CUDA cores is a limiting factor. In the case of WS, the difference is much smaller, because for small CA sizes overhead for GPU memory allocation is significant in comparison to multi-CPU mode execution. The speedup still raises, because the CUDA cores bottleneck is not reached by analyzed domain sizes.

3.3.4. Energy Consumption

The study compared the energy efficiency for every device. For this purpose, a watt-meter was used and the power consumption of the power supplies were measured. For the comparison, energy consumption for idle, minimum, average, and maximum machine load were compared. The load is mainly described as the use of the number of physical cores available on the machine. The results are presented in the Table 2 The measurements were calculated as an average value of 10 measurements, each read after 30 s intervals. For RTX2080ti, power draw was measured using nvidia-smi tool.
The minimum loads for both devices apply to a situation where only one physical core is loaded. This is an example of classical sequential processing. In the other cases, the remaining physical cores were involved, and in the case of the working machine, also the logical cores.
Average load refers to using half of the physical cores available on the machine. For RPi microcomputers these are 2 cores, and for workstation 12. In the case of GPUs, average load was calculated for load, where idle and work had an equal share (e.g., small computations, or fast kernel and slow host operations). The same assumption was made for the maximum load, where RPi used 4 and workstation 24 cores (12 physical cores each CPU). For GPUs maximum load occurs when executing program for huge domain (or kernel execution time is much greater than host operations). The load on the machines, exceeding their physical capacity, was also compared, where the context switching begins. For low-power devices, no difference in power consumption was observed, but for a workstation, the inclusion of SMT technology resulted in an average increase in consumption of 5–7%.
Jetson requires more power in peak than RPi4B but offers performance improvements in terms of execution time. Medium power draw is smaller than for RPi, while still maintaining high performance.

4. Load Distribution Metamodel

The performed benchmarking of the computational capabilities and energy efficiency of the devices was used to balance the load distribution in the system. In this work, our main goal was to distribute some of the computations from a heavily loaded workstation to underloaded edge elements in such a way that the computation time remains at least the same or to reduce the total power consumption of these devices. To perform the optimization process, let us first define the appropriate objective function.
Let us consider a system consisting of n devices of two classes: workstation and edge devices in the form of RPi4B and Jetson. If we assume that the time required for the i-th machine to solve the problem is t i and the energy consumption during calculations is P i , then the objective function can be determined as follows:
i = 1 n P i t i m i n
On the basis of the results obtained from the benchmarking and the form of the objective function from Equation (3), it can be seen that the simultaneous minimization of both criteria for i-th machine is not possible. Increasing the load results in faster solving of k computational tasks (or a part of this set), but it causes increase in the power consumed by the devices. On the other hand, minimizing the power consumption leads to a situation in which the system does not compute anything at all, and therefore does not fulfill its function.
The optimization of the system load therefore consists in the appropriate assignment of k computational tasks, in this case the calculation of the growth of microstructures, on n machines. Using the scalability measures and energy consumption for different load levels for WS, RPi4B, and Jetson, we can prepare distribution metamodel, the main goal of which is to perform load balancing, maintaining the dependence determined by Equation (3). In order to illustrate the behavior of the system during the load, a flowchart was prepared as shown in the Figure 12.
The optimization process begins with defining a set of k computational tasks to be performed and n devices on which these tasks will be calculated. Next, all queued tasks are considered with regard to their assignment to the devices. For each task-device pair, the product of power consumption and the time required to complete the task is calculated. In the case of power consumption, the values can be fetched in real time for dynamic load balancing or calculated on the basis of the benchmarking for the static version. Calculation times, on the other hand, are calculated on the basis of the benchmark, using weak scalability and the current load of the device. If a device is found for which the objective function takes a lower value, the k-th task is assigned to the i a s s i g n device. When all tasks are assigned to the devices, the system is reconfigured or the computational process is started, which ends the algorithm.

5. Results, Tests, and Validation

A series of tests were performed to verify the load dissipation optimization algorithm between the workstation and the RPi. Within this series, four scenarios were defined:
  • Multi-CPU mode with WS and RPi4B;
  • GPU mode with WS and Jetson;
  • Multi-CPU + GPU modes with RPi4B and Jetson;
  • Multi-CPU + GPU modes with all devices.
The distribution of the tasks was created using performance and energy consumption measures by scheduler (gateway RPiCM4). Three groups of domain sizes were computed: 15 × 1000 × 1000 , 15 × 2000 × 2000 and 10 × 3000 × 3000 . Scheduler sends the task over SSH protocol only when the device is ready, otherwise task remains in the scheduler queue. Results are presented in Table 3.
The main difference between other solutions are power consumption. GPU acceleration lowers not only the execution time but also power consumption. Comparing scenarios 2 and 3 it can be noticed, that edge components outperform GPU-mode in terms of power consumption. In order to obtain same execution time there should be twice as many edge devices, using 100 W less than with WS. In the case of last two scenarios, the system containing only edge elements can achieve identical computational performance at same power consumption. That proves, that edge devices, Jetson and RPi4B in this case, that their computational performance is relevant for numerical simulation of grain growth using CA method.
Comparing our architecture with other solutions, the main difference is the construction cost. At the moment, RPi4B price is $90 for 4 GB version, and Jetson Nano 2 GB price is $85. Total cost of edge devices are then around $1400 while current WS configuration costs around $5000. If we consider obtained results from Table 3, the performance per money spent is much higher than for WS. Proposed architecture can be efficient not only at operating stage but also during the construction. However, scalability of this solution will be limited by network communication the more nodes the architecture will have.

6. Proposition of Industrial Application

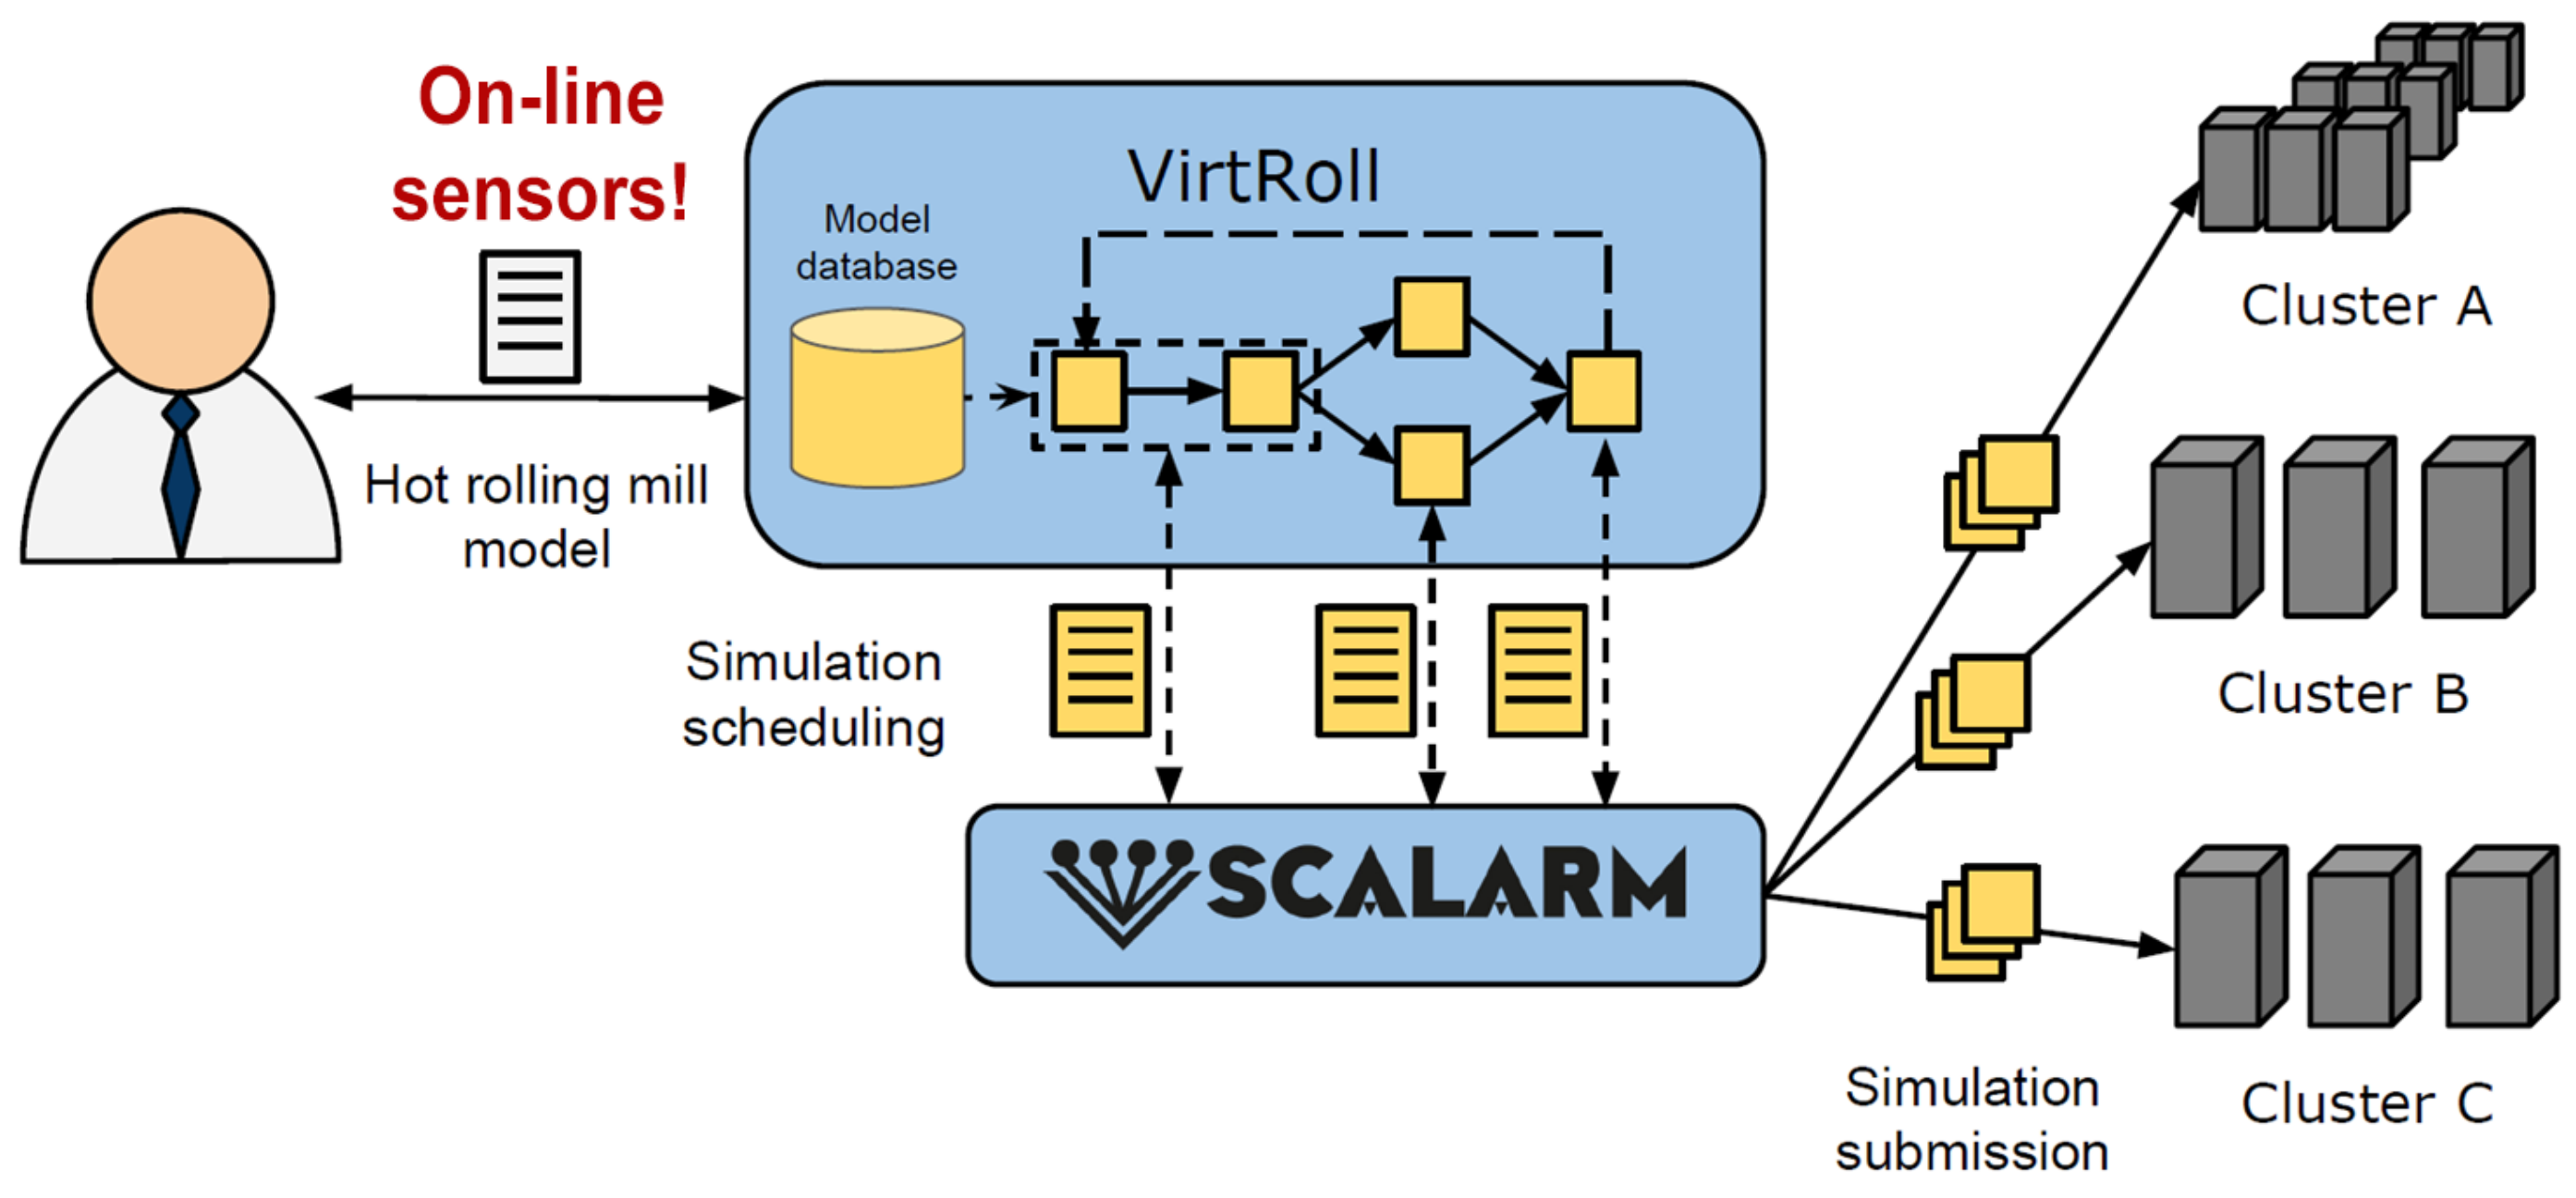
Development of proposed solutions assumes its future usage in Industry 4.0, where not only machine learning methods are applied, but also more sophisticated numerical models have to be used. The first application of the proposed procedure is planned to be used in heavy metal forming industry where we already developed couple computer systems working nowadays in industrial practice [27,28]. We have finally selected application in processes of hot rolling of flat products, which is justified, while the digital twin of the hot rolling line, i.e., VirtRoll system [29], was already developed and can be easily modified and adjusted to new computing purposes. The main objective of the VirtRoll system, as a typical digital twin, was to reflect both the material used in the production process and the process itself with the specific devices and their parameters used for rolling, cooling, or coiling. The system included numerical module able to use information about the material and the devices as input data for Finite Element Method (FEM) used in multiscale simulations. In macro scale FEM was used for modelling of thermo-mechanical aspects such as material plastic deformation (strains, stresses) and heat transfer (temperatures, grain size distribution, dislocation density). In micro scale, FEM was used to solve equations of phase transformation models allowing to predict fraction of four phases, which highly influence material properties, especially in products manufactured from Advanced High Strength Steels [30]. Alternatively, CA models simulating phase transformations can be applied in this place instead of FEM to obtain the same results in similar time or even faster. All numerical models could be also used as a part of optimization procedure to design the parameters of the process to obtain optimal properties of the final products. Moreover, they could be also applied in sensitivity analysis to detect which parameter of the process influences material properties at most. Both of this approaches were multi iterative procedures requiring intensive numerical simulations, thus decision about HPC architecture in the background was crucial. However, the models used in multiscale simulations were quite fast, therefore they could be used closer to devices where on-line sensors with microchips are installed in many places.
The diagram in Figure 13 shows how the VirtRoll system works in the infrastructure equipped with clusters in the background and sensors in front. As our analysis proved it can be justified to select the micro computers at first instead of passing data to clusters through middleware (e.g., Scalarm presented in the diagram), where the latency can be quite high influencing final computing time. Moreover, the models calculated during rolling process could be used efficiently to setup new rolling mill parameters between production of the subsequent metal sheets. At the moment the models are too slow to be used in real time system to control the work of the particular devices, but the replacement of these intensive models with much less sophisticated surrogate models could be a solution to obtain the real time system by using approach for edge computing proposed in this work.

7. Conclusions and Further Work

In this work, we dealt with the application of edge computing in multi-scale computing. The aspects of computing and energy efficiency of Workstation and edge class devices were analyzed and compared. It was possible to measure that for the same energy consumption it is possible to perform computations using over 40 RPi4B, while the computational efficiency is at a similar level for 20 such devices, assuming their 50% load. Although weak scalability for RPi4B is worse than in the case of a workstation, we see its improvement in the installation of additional cooling, passive or active. Moreover, RPi4B can provide additional functionalities for the whole system, which increases their overall usefulness. RPi4B performs well on multi-CPU mode and can be used as a supporting device, when there are not enough computational units in the system. It, however, cannot replace high power units, especially for huge computational domains.
Using Jetson as GPU accelerator increased performance of the system nearly twice, using much less power than WS comparing to only multi-CPU mode. Edge devices can achieve same execution times as Workstation, while using less power. Due to streaming nature of the GPU processor, the final version of the application should also be tested according to the number of threads per block and grid size. The fluctuations in Figure 9 and Figure 10 occurred due to that fact. It can also be seen that for tested domain sizes Jetson spent less percentage of time on memory allocation. Thus, smaller domains (e.g., less than 4 m cells) should be executed on edge device. WS should be involved only in bigger ones in order to obtain best efficiency. It has been proved by the speedup values for GPU vs. multi-CPU.
The work will be further developed, in particular in the context of strong scalability and the inclusion of macroscale calculations in FEM. Other methods, such as Monte Carlo, for microstructure modelling will also be considered in further versions of the system. It is also planned to create a system that will dynamically reconfigure the architecture to make the best use of available resources at the edge of the network. Another improvements of CA implemented on GPU will be developed, including the number of threads per block for CUDA computations. We are also considering application of mutli-GPU computations using CUDA-aware MPI. We will also try to use container orchestrating platforms like Kubernetes. It will allow to dynamically create and schedule computations faster and in automated way. Kubernetes allows its scheduler modifications, so it is possible to implement any scheduling algorithm.

Author Contributions

Methodology, P.H. and Ł.R.; Software, P.H.; Supervision, Ł.R.; Writing–original draft, P.H.; Writing—review & editing, Ł.R. All authors have read and agreed to the published version of the manuscript.

Funding

This research received no external funding.

Institutional Review Board Statement

Not applicable.

Informed Consent Statement

Not applicable.

Data Availability Statement

Not applicable.

Conflicts of Interest

The authors declare no conflict of interest.

References

  1. Top500. Top500 Supecomputers. Available online: https://www.top500.org/ (accessed on 4 February 2021).
  2. RaspberryPi Trading Ltd. RaspberryPi Compute Module 4. 2021. Available online: https://datasheets.raspberrypi.org/cm4/cm4-product-brief.pdf (accessed on 4 February 2021).
  3. Michiels, B.; Fostier, J.; Bogaert, I.; De Zutter, D. Weak Scalability Analysis of the Distributed-Memory Parallel MLFMA. IEEE Trans. Antennas Propag. 2013, 61, 5567–5574. [Google Scholar] [CrossRef] [Green Version]
  4. Bellavista, P.; Foschini, L.; Mora, A. Decentralised Learning in Federated Deployment Environments: A System-Level Survey. ACM Comput. Surv. 2021, 54, 1–38. [Google Scholar] [CrossRef]
  5. Hong, C.H.; Varghese, B. Resource Management in Fog/Edge Computing: A Survey on Architectures, Infrastructure, and Algorithms. ACM Comput. Surv. 2019, 52, 1–37. [Google Scholar] [CrossRef] [Green Version]
  6. Naveen, S.; Kounte, M.R. Key Technologies and challenges in IoT Edge Computing. In Proceedings of the 2019 Third International Conference on I-SMAC (IoT in Social, Mobile, Analytics and Cloud) (I-SMAC), Palladam, India, 12–14 December 2019; pp. 61–65. [Google Scholar] [CrossRef]
  7. Basaran, S.T.; Kurt, G.K.; Chatzimisios, P. Energy-Efficient Over-the-Air Computation Scheme for Densely Deployed IoT Networks. IEEE Trans. Ind. Inform. 2020, 16, 3558–3565. [Google Scholar] [CrossRef]
  8. De Souza, P.S.S.; Rubin, F.P.; Hohemberger, R.; Ferreto, T.C.; Lorenzon, A.F.; Luizelli, M.C.; Rossi, F.D. Detecting abnormal sensors via machine learning: An IoT farming WSN-based architecture case study. Measurement 2020, 164, 108042. [Google Scholar] [CrossRef]
  9. Yang, J.; Xie, Z.; Chen, L.; Liu, M. An acceleration-level visual servoing scheme for robot manipulator with IoT and sensors using recurrent neural network. Measurement 2020, 166, 108137. [Google Scholar] [CrossRef]
  10. Alarifi, A.; Alwadain, A. Killer heuristic optimized convolution neural network-based fall detection with wearable IoT sensor devices. Measurement 2021, 167, 108258. [Google Scholar] [CrossRef]
  11. Castañeda-Miranda, A.; Castaño-Meneses, V.M. Smart frost measurement for anti-disaster intelligent control in greenhouses via embedding IoT and hybrid AI methods. Measurement 2020, 164, 108043. [Google Scholar] [CrossRef]
  12. Grzesik, P.; Mrozek, D. Metagenomic Analysis at the Edge with Jetson Xavier NX. In Computational Science–ICCS 2021; Paszynski, M., Kranzlmüller, D., Krzhizhanovskaya, V.V., Dongarra, J.J., Sloot, P.M., Eds.; Springer International Publishing: Cham, Switzerland, 2021; pp. 500–511. [Google Scholar]
  13. Samie, F.; Tsoutsouras, V.; Bauer, L.; Xydis, S.; Soudris, D.; Henkel, J. Computation offloading and resource allocation for low-power IoT edge devices. In Proceedings of the 2016 IEEE 3rd World Forum on Internet of Things (WF-IoT), Reston, VA, USA, 12–14 December 2016; pp. 7–12. [Google Scholar] [CrossRef] [Green Version]
  14. Xu, X.; Liu, Q.; Luo, Y.; Peng, K.; Zhang, X.; Meng, S.; Qi, L. A computation offloading method over big data for IoT-enabled cloud-edge computing. Future Gener. Comput. Syst. 2019, 95, 522–533. [Google Scholar] [CrossRef]
  15. Ravindra, W.S.; Devi, P. Energy balancing between computation and communication in IoT edge devices using data offloading schemes. In Proceedings of the 2018 Second International Conference on Inventive Communication and Computational Technologies (ICICCT), Coimbatore, India, 20–21 April 2018; pp. 22–25. [Google Scholar] [CrossRef]
  16. Singh, S. Optimize cloud computations using edge computing. In Proceedings of the 2017 International Conference on Big Data, IoT and Data Science (BID), Pune, India, 20–22 December 2017; pp. 49–53. [Google Scholar] [CrossRef]
  17. Alam, M.G.R.; Hassan, M.M.; Uddin, M.Z.; Almogren, A.; Fortino, G. Autonomic computation offloading in mobile edge for IoT applications. Future Gener. Comput. Syst. 2019, 90, 149–157. [Google Scholar] [CrossRef]
  18. Sonkoly, B.; Haja, D.; Németh, B.; Szalay, M.; Czentye, J.; Szabó, R.; Ullah, R.; Kim, B.S.; Toka, L. Scalable edge cloud platforms for IoT services. J. Netw. Comput. Appl. 2020, 170, 102785. [Google Scholar] [CrossRef]
  19. Carvalho, G.; Cabral, B.; Pereira, V.; Bernardino, J. Computation offloading in Edge Computing environments using Artificial Intelligence techniques. Eng. Appl. Artif. Intell. 2020, 95, 103840. [Google Scholar] [CrossRef]
  20. Peng, G.; Wu, H.; Wu, H.; Wolter, K. Constrained Multi-objective Optimization for IoT-enabled Computation Offloading in Collaborative Edge and Cloud Computing. IEEE Internet Things J. 2021, 8, 13723–13736. [Google Scholar] [CrossRef]
  21. Hajder, M.; Nycz, M.; Hajder, P.; Liput, M. Information Security of Weather Monitoring System with Elements of Internet Things. In Security and Trust Issues in the Internet of Things; Taylor & Francis Group: Boca Raton, FL, USA, 2020; pp. 57–84. [Google Scholar]
  22. Hajder, P.; Rauch, L. Reconfiguration of the Multi-channel Communication System with Hierarchical Structure and Distributed Passive Switching. In Computational Science—ICCS 2019, Part II, Proceedings of the 19th Annual International Conference on Computational Science (ICCS), Faro, Portugal, 12–14 June 2019; Lecture Notes in Computer, Science; Rodrigues, J.M.F., Cardoso, P.J.S., Monteiro, J., Lam, R., Krzhizhanovskaya, V.V., Lees, M.H., Dongarra, J.J., Sloot, P.M.A., Eds.; Springer: Berlin/Heidelberg, Germany, 2019; Volume 11537, pp. 502–516. [Google Scholar] [CrossRef]
  23. Zhang, Y.; Zhou, J.; Yin, Y.; Shen, X.; Shehabeldeen, T.A.; Ji, X. GPU-Accelerated Cellular Automaton Model for Grain Growth during Directional Solidification of Nickel-Based Superalloy. Metals 2021, 11, 298. [Google Scholar] [CrossRef]
  24. Zhang, Y.; Zhou, J.; Yin, Y.; Shen, X.; Ji, X. Multi-GPU implementation of a cellular automaton model for dendritic growth of binary alloy. J. Mater. Res. Technol. 2021, 14, 1862–1872. [Google Scholar] [CrossRef]
  25. Delorme, M.; Mazoyer, J. (Eds.) An Introduction to Cellular Automata. In Cellular Automata: A Parallel Model; Springer: Dordrecht, The Netherlands, 1999; pp. 5–49. [Google Scholar] [CrossRef]
  26. Buyya, R.; Srirama, S.N. Fog and Edge Computing: Principles and Paradigms; Wiley: Hoboken, NJ, USA, 2019. [Google Scholar]
  27. Rauch, L.; Madej, L.; Weglarczyk, S.; Pietrzyk, M.; Kuziak, R. System for design of the manufacturing process of connecting parts for automotive industry. Arch. Civ. Mech. Eng. 2008, 8, 157–165. [Google Scholar] [CrossRef]
  28. Rauch, L.; Sztangret, L.; Pietrzyk, M. Computer System for Identification of Material Models on the basis of Plastometrictests. Archives of Metallurgy and Materials. Arch. Metall. Mater. 2013, 58, 737–743. [Google Scholar] [CrossRef] [Green Version]
  29. Kitowski, J.; Wiatr, K.; Bala, P.; Borcz, M.; Czyzewski, A.; Dutka, L.; Kluszczynski, R.; Kotus, J.; Kustra, P.; Meyer, N.; et al. Development of Domain-Specific Solutions within the Polish Infrastructure for Advanced Scientific Research. In Parallel Processing and Applied Mathematics (PPAM 2013), Part I, Proceedings of the 10th International Conference on Parallel Processing and Applied Mathematics (PPAM), Warsaw, Poland, 8–11 September 2013; Lecture Notes in Computer Science; Wyrzykowski, R., Dongarra, J., Karczewski, K., Wasniewski, J., Eds.; Springer: Berlin/Heidelberg, Germany, 2014; Volume 8384, pp. 237–250. [Google Scholar] [CrossRef]
  30. Rauch, L.; Szeliga, D.; Bachniak, D.; Bzowski, K.; Slota, R.; Pietrzyk, M.; Kitowski, J. Identification of Multi-inclusion Statistically Similar Representative Volume Element for Advanced High Strength Steels by Using Data Farming Approach. Procedia Comput. Sci. 2015, 51, 924–933. [Google Scholar] [CrossRef] [Green Version]
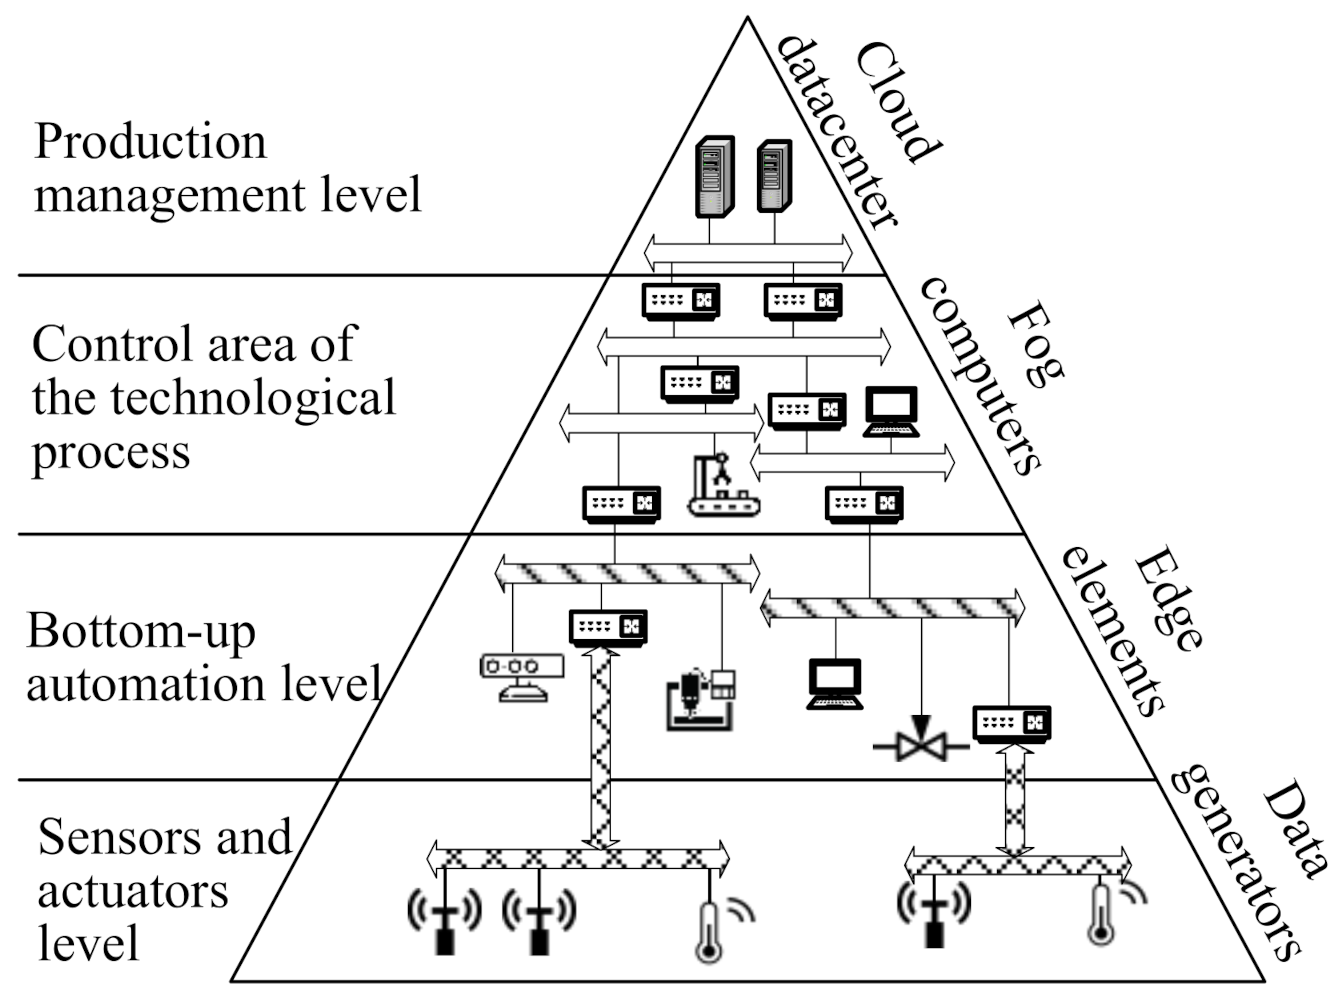
Figure 1. Architecture of the IIS using IIoT elements and Cloud-Fog-Edge paradigm.
Processes 09 02225 g001
Figure 3. CA evolution using Von Neumann neighborhood.
Processes 09 02225 g003
Figure 4. Computational edge system architecture.
Processes 09 02225 g004
Figure 5. Cellular automaton computing time depending on domain size and device configuration.
Processes 09 02225 g005
Figure 6. Weak scalability for the workstation and RPi depending on the number of threads. Automaton size: 4 m × 4 m.
Processes 09 02225 g006
Figure 7. Execution times of CA-based grain growth for multi-CPU mode using OpenMP library. (a) Execution time for WS; (b) Execution time for RPi4B.
Processes 09 02225 g007
Figure 8. Speedup in multi-CPU mode for WS and RPi4B.
Processes 09 02225 g008
Figure 9. Relative execution time of CUDA API procedures.
Processes 09 02225 g009
Figure 10. Relative execution times of GPU activities.
Processes 09 02225 g010
Figure 11. Speedup for GPU mode vs. multi-CPU mode.
Processes 09 02225 g011
Figure 12. Load balancing algorithm.
Processes 09 02225 g012
Figure 13. Architecture of the VirtRoll system integrated with on-line sensors.
Processes 09 02225 g013
Table 1. Parameters of the hardware used in proposed edge system architecture.
ParameterWorkstationRaspberryPi 4BNVidia Jetson Nano 2 GBRaspberryPi CM4
CPUx86, 2× Intel Xeon Silver 4214 CPU 2.20 GHzARM v8, Broadcom BCM2711, Cortex-A72 1.5 GHzARM Cortex-A57 1.43 GHzARM v8, Broadcom BCM2711, Cortex-A72 1.5 GHz
No. cores12 physical, 24 logical per socket4 physical4 physical4 physical
RAM12 × 16 GB (192 total) DDR4 with ECC4 GB LPDDR42 GB LPDDR44 GB LPDDR4 with on-die ECC
GPUNVidia Turing, RTX2080ti 11 GB, 4352 CUDA cores, clock: 1350 MHzNoneNVidia Maxwell, 1280 CUDA cores, clock: 640 MHzNone
NIC2 × 10 GB ethernet1 GB ethernet1 GB ethernet2 × 1 GB ethernet
OSUbuntu Server 20.04 x64Ubuntu Server 20.04 aarch64Ubuntu 18.04 aarch64, dedicatedUbuntu Server 20.04 aarch64
Other
Table 2. Table captions should be placed above the tables.
DeviceIdle [W]Min Load [W]Medium Load [W]Max Load [W]Peak [W]
RPi4B3.54.45.06.26.4
Jetson1.12.44.57.68.4
RTX2080ti296592186210
WS CPU137.0182.0248.5291.3304.2
WS CPU + GPU137.0258.1366.0488.6532.3
Table 3. Table captions should be placed above the tables.
No. ScenarioTime [s]Power [W]
1507.5431
276.8306
3158.0108
436.2482
Publisher’s Note: MDPI stays neutral with regard to jurisdictional claims in published maps and institutional affiliations.