
Viscoelastic Behavior of an Epoxy Resin Modified with Recycled Waste Particles Analyzed through a Fractional Model


Abstract
:1. Introduction
2. Materials and Methods
2.1. Raw Materials
2.1.1. Epoxy Resin (SX 8)
2.1.2. Waste Glass Powder
2.1.3. Waste Rubber Powder
- Natural and synthetic rubbers;
- Fillers (carbon black, silica, chalk, or carbon);
- Reinforcing materials (metals and textiles);
- Plasticisers (oils and resins);
- Vulcanising agents (sulphur and zinc oxide);
- Additives.
2.2. Composites Manufacturing
2.3. Viscoelastic Characterization
2.3.1. Relaxation Test
2.3.2. Dynamic Mechanical Thermal Analysis (DMTA)
3. Fractional Viscoelastic Model
4. Results and Discussions
5. Conclusions
Author Contributions
Funding
Conflicts of Interest
Abbreviations
| DMTA | Dynamic Mechanical Thermal Analysis |
| DMA | Dynamic Mechanical Analyzer |
| W.G. | Waste Glass |
| W.R. | Waste Rubber |
References
- Mansour, G.; Tsongas, K.; Tzetzis, D. Investigation of the dynamic mechanical properties of epoxy resins modified with elastomers. Compos. Part B Eng. 2016, 94, 152–159. [Google Scholar] [CrossRef]
- Wan, L.Y.; Chen, L.P.; Xie, X.L.; Li, Z.P.; Fan, H.Q. Damping properties of a novel soft core and hard shell PBA/PMMA composite hydrosol based on interpenetrating polymer networks. Iran. Polym. J. 2011, 20, 659–669. [Google Scholar]
- Jalili, M.M.; Mousavi, S.Y.; Pirayeshfar, A.S. Flexural free vibration as a non-destructive test for evaluation of viscoelastic properties of polymeric composites in bending direction. Iran. Polym. J. 2008, 23, 327–333. [Google Scholar] [CrossRef] [Green Version]
- Singh, M.P.; Moreschi, L.M. Optimal placement of dampers for passive response control. Earthq. Eng. Struct. Dyn. 2002, 31, 955–976. [Google Scholar] [CrossRef]
- Shukla, A.K.; Datta, T.K. Optimal use of viscoelastic dampers in building frames for seismic force. J. Struct. Eng. 1999, 125, 401–409. [Google Scholar] [CrossRef]
- Lee, S.H.; Son, D.I.; Kim, J.; Min, K.W. Optimal design of viscoelastic dampers using eigenvalue assignment. Earthq. Eng. Struct. Dyn. 2004, 125, 521–542. [Google Scholar] [CrossRef]
- Singh, M.P.; Verma, N.P.; Moreschi, L.M. Seismic analysis and design with Maxwell dampers. J. Eng. Mech. 2003, 129, 273–282. [Google Scholar] [CrossRef]
- Galucio, A.C.; Deu, J.F.; Ohayon, R. Finite element formulation of viscoelastic sandwich beams using fractional derivative operators. Comput. Mech. 2004, 33, 282–291. [Google Scholar] [CrossRef] [Green Version]
- Matsagar, V.A.; Jangid, R.S. Viscoelastic damper connected to adjacent structures involving seismic isolation. J. Civ. Eng. Manag. 2005, 11, 309–322. [Google Scholar] [CrossRef]
- Badagliacco, D.; Colinas-Armijo, N.; Valenza, A. Evaluation of the temperature effect on the fractional linear viscoelastic model for an epoxy resin. AIP Conf. Proc. 2016, 1736, 4567–4590. [Google Scholar]
- Blair, G.W.S.; Caffyn, J.E. An Application of the Theory of Quasi-Properties to the Treatment of Anomalous Strain-Stress Relations. Philos. Mag. 1949, 40, 80–94. [Google Scholar] [CrossRef]
- Nutting, P.G. A new general law deformation. J. Frankl. Inst. 1921, 191, 678–685. [Google Scholar] [CrossRef]
- Gemant, A. A method of analyzing experimental results obtained by elasto-viscous bodies. Physics 1936, 7, 311–317. [Google Scholar] [CrossRef]
- Tarasov, V.E. Review of some promising fractional physical models. Int. J. Mod. Phys. B 2013, 27, 1330005. [Google Scholar] [CrossRef] [Green Version]
- Heymans, N.; Bauwens, J.C. Fractal rheological models and fractional differential equations for viscoelastic behavior. Rheol. Acta 1994, 33, 210–219. [Google Scholar] [CrossRef]
- Oeser, M.; Pellinien, T. Computational framework for common visco-elastic models in engineering based on the theory of rheology. Comput. Geotech. 2012, 42, 145–156. [Google Scholar] [CrossRef]
- Soczkiewicz, E. Application of fractional calculus in the theory of viscoelasticity. Mol. Quantum Acoust. 2002, 23, 397–404. [Google Scholar]
- Papoulia, K.D.; Panoskaltsis, V.P.; Kurup, N.V.; Korovajchuk, I. Rheological representation of fractional order viscoelastic material models. Rheol. Acta 2010, 49, 381–400. [Google Scholar] [CrossRef]
- Adolfsson, K.; Enelund, N.; Larsonn, S. Adaptive discretization of fractional order viscoelasticity using sparse time history. Comput. Meth. Appl. Mech. Eng. 2004, 193, 4567–4590. [Google Scholar] [CrossRef]
- Di Paola, M.; Heuer, R.; Pirrotta, A. Fractional visco-elastic Euler—Bernoulli beam. Int. J. Solids Struct. 2013, 50, 3505–3510. [Google Scholar] [CrossRef] [Green Version]
- SX8 EVO. Mates Italy Srl; Product Data Sheet: Segrate, Italy. Available online: https://fileserver.mates.it/Prodotti/2Matrici/TDS/Resine/Mates/SX8EVODS.pdf (accessed on 7 February 2021).
- Megna, B.; Badagliacco, D.; Sanfilippo, C.; Valenza, A. Physical and Mechanical Properties of Sustainable Hydraulic Mortar Based on Marble Slurry with Waste Glass. Recycling 2021, 6, 37. [Google Scholar] [CrossRef]
- Continental, Compressibility and Strength Behaviour of Sand—Tyre Chip Mixtures. 2013. Available online: www.continental-tires.com (accessed on 6 September 2021).
- Evans, A.; Evans, R. The Composition of a Tyre: Typical Components—WRAP. 2006. Available online: https://pdf4pro.com/view/the-composition-of-a-tyre-typical-components-wrap-466a21.html (accessed on 6 September 2021).
- Mohajerani, A.; Burnett, L.; Smith, J.V.; Markovski, S.; Rodwell, G.; Rahman, M.T.; Kurmus, H.; Mirzababaei, M.; Arulrajah, A.; Horpibulsuk, S.; et al. Recycling waste rubber tyres in construction materials and associated environmental considerations: A review. Resour. Conserv. Recycl. 2020, 155, 104679. [Google Scholar] [CrossRef]
- ASTM. ASTM D 4065-12 Standard Practice for Plastics: Dynamic Mechanical Properties: Determination and Report of Procedures; ASTM International: West Conshohocken, PA, USA, 2012. [Google Scholar]
- Zang, Z.; Klein, P.; Friedrich, K. Dynamic mechanical properties of PTFE based short carbon fibre reinforced composites: Experiment and artificial neural network prediction. Compos. Sci. Technol. 2002, 62, 1001–1009. [Google Scholar] [CrossRef]
- Fiore, V.; Di Bella, G.; Scalici, T.; Valenza, A. Effect of Plasma Treatment on Mechanical and Thermal Properties of Marble Powder/Epoxy Composites. Polym. Compos. 2016, 39, 309–317. [Google Scholar] [CrossRef]
- Cataldo, E.; Di Lorenzo, S.; Fiore, V.; Maurici, M.; Nicoletti, F.; Pirrotta, A.; Scaffaro, R.; Valenza, A. Bending test for capturing the vivid behavior of giant reeds, returned through a proper fractional visco-elastic model. Mech. Mater. 2015, 89, 159–168. [Google Scholar] [CrossRef]


| SX8 EVO Epoxy Resin System | |
|---|---|
| Density [g/cm] | 1.2 |
| Viscosity at C [mPas] | 550 |
| Gel Time at C [h] | 3 |
| Tensile modulus [GPa] | 2.7 |
| Tensile strength [MPa] | 60 |
| Sample | [] | |
|---|---|---|
| Neat | 0.0607 ± 0.0018 | 3628 ± 174 |
| W.G. 2% | 0.0504 ± 0.0040 | 3643 ± 40 |
| W.G. 5% | 0.0469 ± 0.0027 | 4030 ± 120 |
| W.G. 10% | 0.0416 ± 0.0026 | 5053 ± 173 |
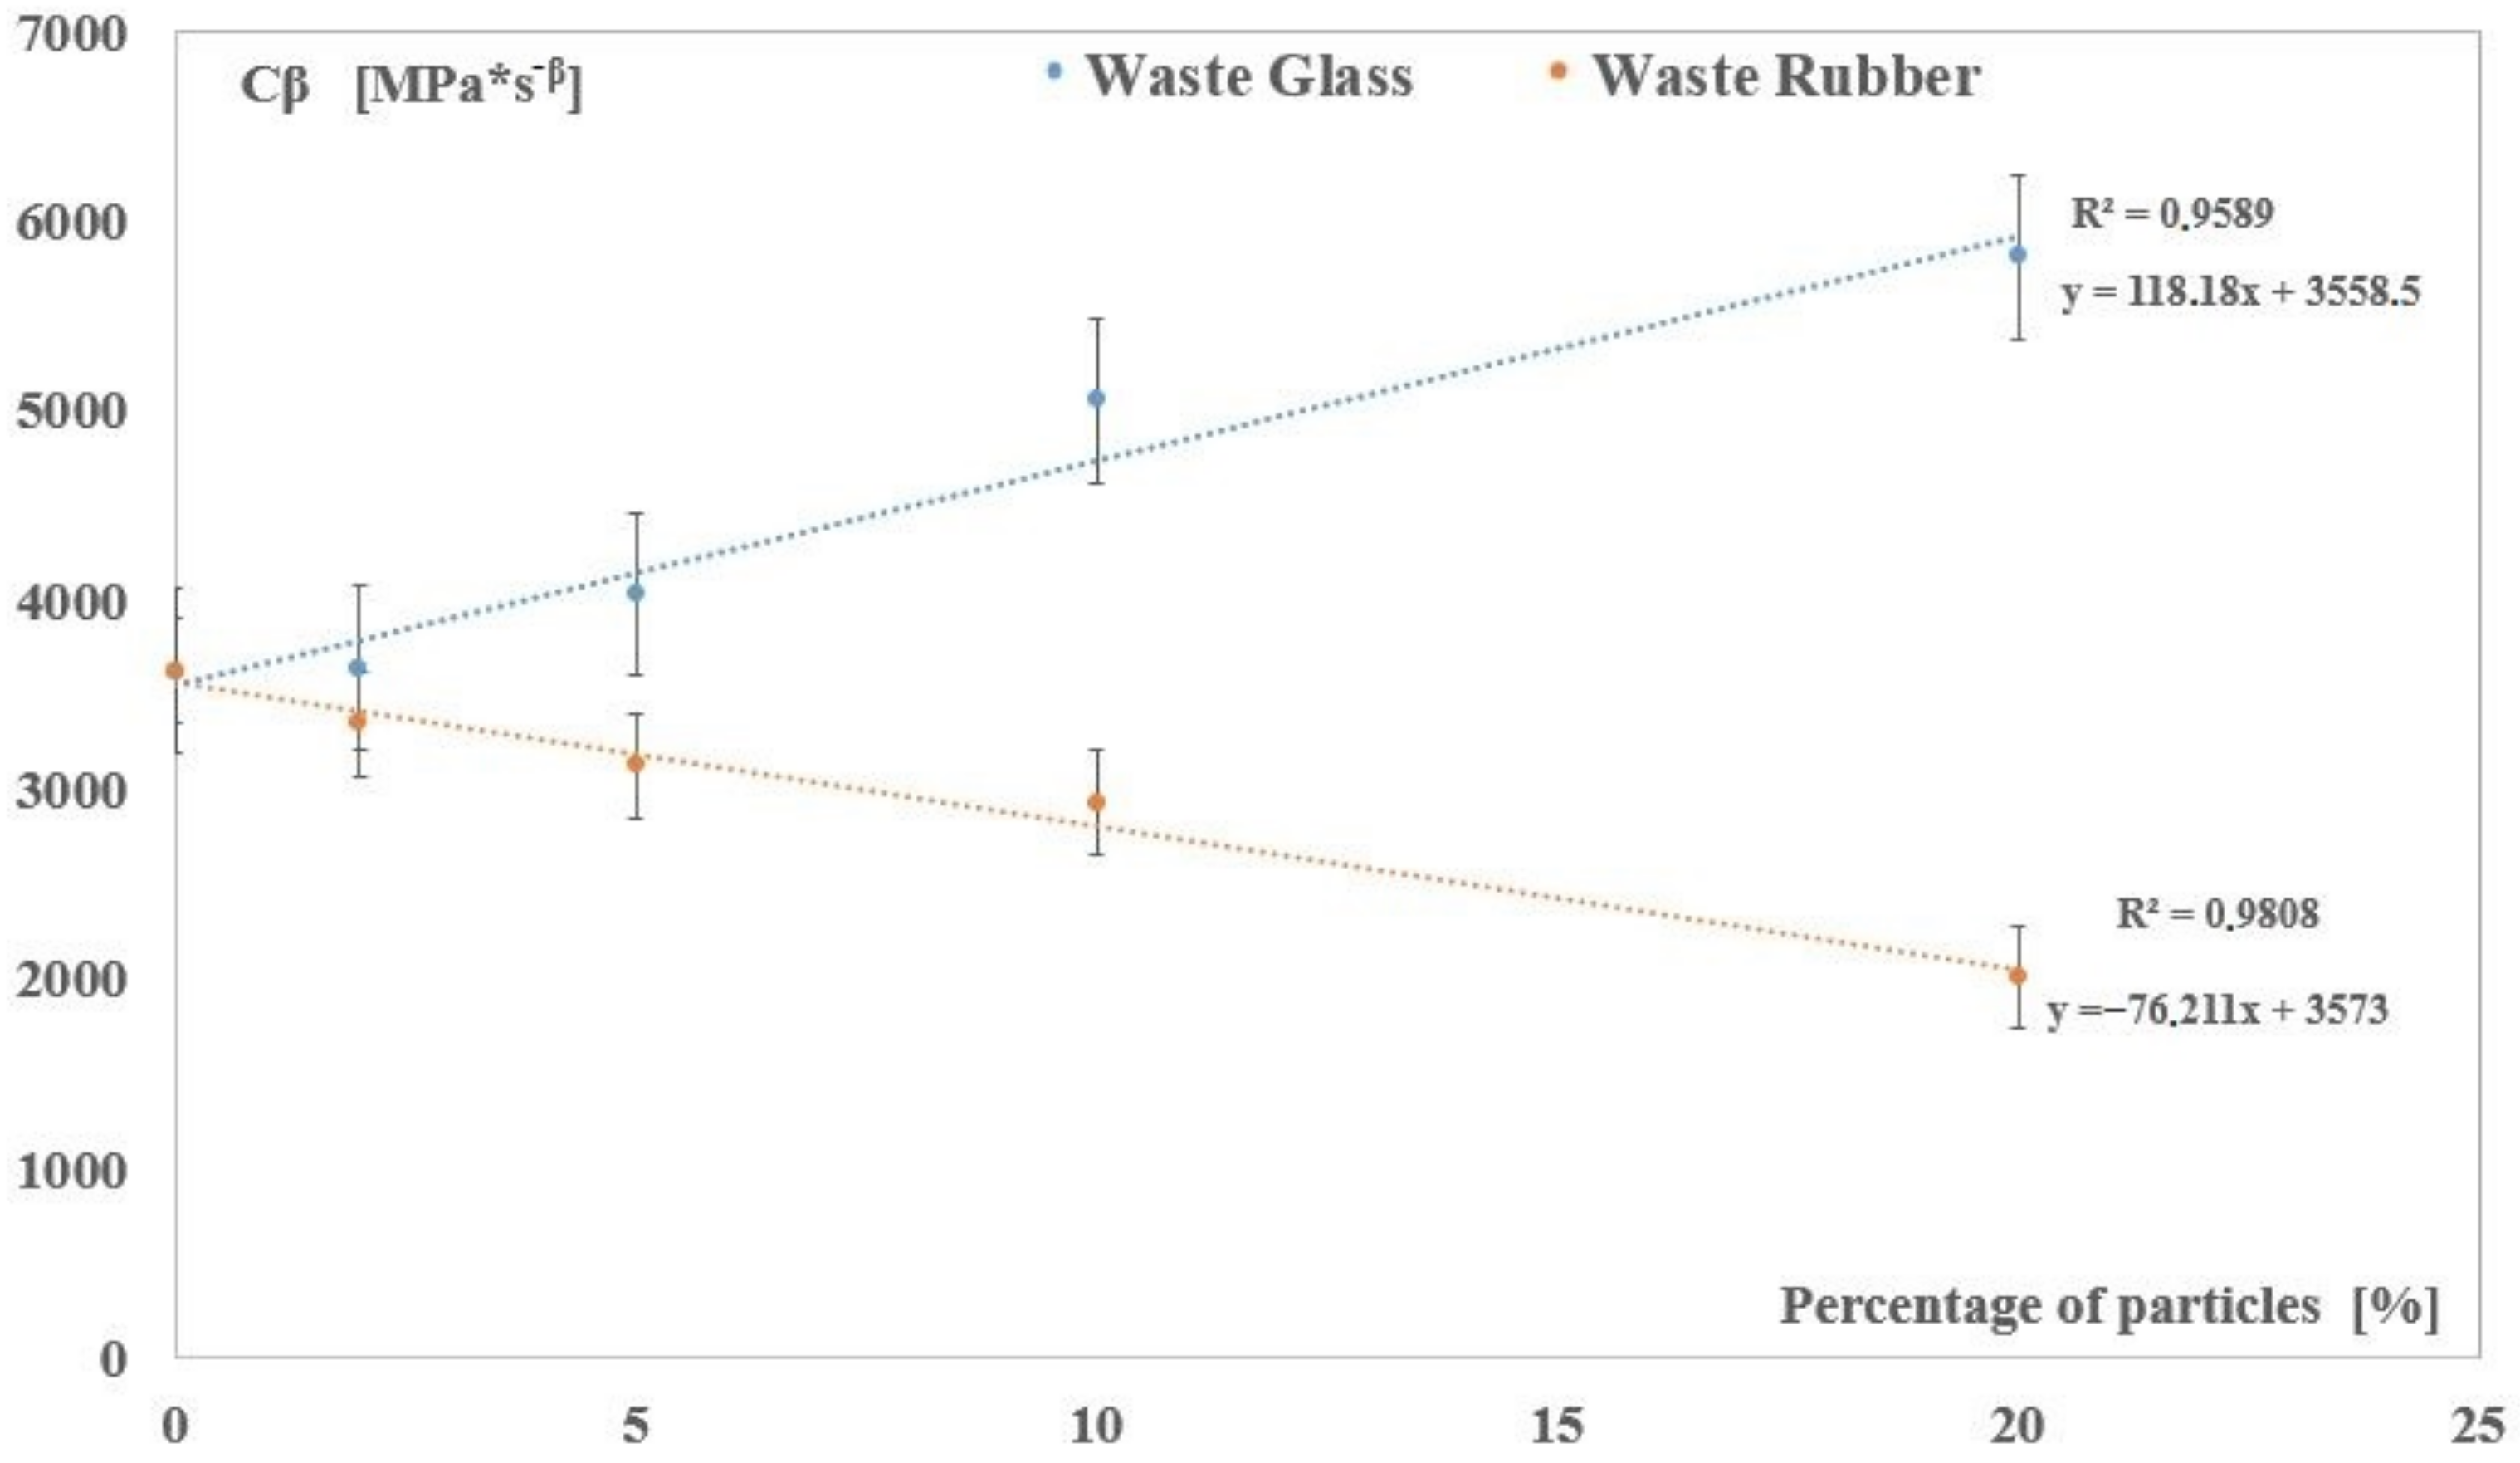
| W.G. 20% | 0.0412 ± 0.0056 | 5810 ± 280 |
| W.R. 2% | 0.0050 ± 0.0016 | 3346 ± 166 |
| W.R. 5% | 0.0525 ± 0.0034 | 3127 ± 60 |
| W.R. 10% | 0.0512 ± 0.0062 | 2933 ± 159 |
| W.R. 20% | 0.0706 ± 0.0016 | 2012 ± 123 |
| Sample | [MPa] | [MPa] | [MPa] | [] | |
|---|---|---|---|---|---|
| Neat | 2905 ± 24.7 | 2905 ± 21.21 | 84.8 ± 3.11 | 81.3 ± 0.035 | 1.187 ± 0.014 |
| W.G. 2% | 3050 ± 191 | 3060 ± 212.1 | 93.6 ± 4.95 | 83.1 ± 0.283 | 1.206 ± 0.011 |
| W.G. 5% | 3190 ± 400 | 3185 ± 397.1 | 105.2 ± 14.1 | 82 ± 0.775 | 1.180 ± 0.030 |
| W.G. 10% | 3770 ± 91.7 | 3770 ± 84.8 | 107.4 ± 22.1 | 83.4 ± 0.707 | 1.160 ± 0.009 |
| W.G. 20% | 4490 ± 4.69 | 4485 ± 7.07 | 147.5 ± 4.95 | 80.3 ± 0.177 | 1.077 ± 0.012 |
| W.R. 2% | 2670 ± 96.6 | 2670 ± 95.4 | 71.1 ± 4.12 | 80.9 ± 0.679 | 1.229 ± 0.007 |
| W.R. 5% | 2535 ± 112 | 2535 ± 106.9 | 68.4 ± 7.36 | 79.0 ± 0.278 | 1.179 ± 0.021 |
| W.R. 10% | 2330 ± 68.8 | 2325 ± 70.2 | 61.3 ± 2.45 | 76.9 ± 0.626 | 1.176 ± 0.002 |
| W.R. 20% | 1630 ± 120 | 1630 ± 121.0 | 37.0 ± 5.95 | 78.8 ± 0.375 | 1.056 ± 0.012 |
Publisher’s Note: MDPI stays neutral with regard to jurisdictional claims in published maps and institutional affiliations. |
© 2021 by the authors. Licensee MDPI, Basel, Switzerland. This article is an open access article distributed under the terms and conditions of the Creative Commons Attribution (CC BY) license (https://creativecommons.org/licenses/by/4.0/).
Share and Cite
Badagliacco, D.; Valenza, A. Viscoelastic Behavior of an Epoxy Resin Modified with Recycled Waste Particles Analyzed through a Fractional Model. Processes 2021, 9, 1826. https://doi.org/10.3390/pr9101826
Badagliacco D, Valenza A. Viscoelastic Behavior of an Epoxy Resin Modified with Recycled Waste Particles Analyzed through a Fractional Model. Processes. 2021; 9(10):1826. https://doi.org/10.3390/pr9101826
Chicago/Turabian StyleBadagliacco, Dionisio, and Antonino Valenza. 2021. "Viscoelastic Behavior of an Epoxy Resin Modified with Recycled Waste Particles Analyzed through a Fractional Model" Processes 9, no. 10: 1826. https://doi.org/10.3390/pr9101826
APA StyleBadagliacco, D., & Valenza, A. (2021). Viscoelastic Behavior of an Epoxy Resin Modified with Recycled Waste Particles Analyzed through a Fractional Model. Processes, 9(10), 1826. https://doi.org/10.3390/pr9101826