1. Introduction
Superparamagnetic nanoparticles are a group of materials that have received significant attention because of their unique physical properties, distinctive magnetic properties, and high magnetic susceptibility [
1,
2]. Fe
3O
4 nanoparticles, representing these superparamagnetic nanoparticles, are of interest in various high-tech fields, and specifically in medical science applications including biosensors [
3], detection of cancer cells [
4,
5], magnetic resonance imaging (MRI) [
6], drug delivery systems [
7], hyperthermia treatment [
8], next-generation separation material processes such as membrane filtration [
9] and membrane adsorption [
10], as well as eco-friendly inorganic pigments [
11,
12]. The utility of Fe
3O
4 is enhanced by conferring new functionality to the material itself. Therefore, to achieve new functions for innovative purposes, specific functional groups are appended the surface of the material via surface treatment; this allows the construction of organic/inorganic complexes and modification of the surface properties [
13]. Thus, surface treatment is the basis for imparting special functions to particles or expanding the scope of application [
14]. The functional groups formed by surface treatment serve as activation sites for the complexation of heterogeneous materials on the particle surface, or provide a function that enables bonding with a specific organic structure. Representative functional groups formed on the particle surface by surface treatment include hydroxyl, amine, and carboxyl groups. Among them, negatively charged carboxyl groups have high affinity for cations [
15]. For this reason, studies have reported the introduction of carboxyl groups on the surface of Fe
3O
4, and applied carboxyl-functionalized Fe
3O
4 in various fields. Barick et al. reported the development of carboxyl-decorated Fe
3O
4 nanoparticles for MRI and hyperthermia applications [
16]. In that study, carboxyl groups were introduced onto the surface of glycin-functionalized Fe
3O
4 to provide monodispersity, colloidal stability, and biocompatibility in aqueous and physiological media. After surface treatment, the Fe
3O
4 nanoparticles exhibited suitable colloidal stability in aqueous and physiological media due to the increased electrostatic repulsive force induced by the carboxyl groups on the surface, and it was confirmed that these particles exhibited resistance to bovine serum albumin (BSA) protein due to the negative surface charge. Functionalized Fe
3O
4 was also confirmed to be appropriate for application in various biomolecule/drug conjugates due to the high density of the surface functional groups. Kim et al. investigated the carboxyl functionalization of Fe
3O
4 nanoparticles for oligonucleotide immobilization [
17]. Fe
3O
4 nanoparticles were functionalized with two types of reagents: 3-thiopheneacetic acid (3TA) and meso-2,3-dimercaptosuccinic acid (DMSA). After surface treatment, the hydrophilic properties of Fe
3O
4 were improved owing to the large amount of carboxyl groups formed on the surface, and high dispersibility in aqueous solution was demonstrated. Moreover, oligonucleotides were more efficiently immobilized on these particles than on Fe
3O
4 without surface treatment, and it was confirmed that DMSA was the most stable carboxylic chelate for effectively bonding and immobilizing the oligonucleotides. Tian et al. modified Fe
3O
4 with PAA and applied as nano additives to investigate the effect on the fluid loss and rheology of water-based drilling fluids (WBDF) [
18]. After the surface modification, WBDF had enhanced filtration properties by decreased fluid loss about 31.8% and dense filter cake by incorporating 0.1 wt % of Fe
3O
4/PAA nanoparticles.
In the case of Fe
3O
4 nanoparticles, the internal structural characteristics of the particles may change due to changes in the surface charge of the internal particles via surface treatment. Therefore, the correlation between the structural changes and physical properties of cluster nanoparticles due to the surface treatment has been widely investigated. Marín et al. reported the influence of the surface treatment of Fe
3O
4 nanoparticles on the magnetic properties [
19]. The surface of the Fe
3O
4 nanoparticles was treated using two types of salts, and the change in the magnetic properties after surface treatment was considered. After surface treatment, negatively charged carboxyl groups were formed on the surface of the particles, and the magnetic properties of the Fe
3O
4 nanoparticles changed according to the surface modifier. Radoń et al. investigated the influence of organic modifiers on the structure and optical properties of Fe
3O
4 nanoparticles synthesized by a co-precipitation method [
20]. After surface treatment, the size of the Fe
3O
4 nanoparticles decreased due to the influence of the organic modifiers; the modified nanoparticles exhibited low crystallinity and volume size, and a high optical bandgap energy. The results confirmed that the particle size, shape, and optical properties were changed by surface treatment using organic modifiers. Thus, these prior studies consistently illustrate changes in the structure and properties of Fe
3O
4 nanoparticles via surface treatment. However, most of these prior studies have not focused on the specific change of structure and properties according to condition of surface functionalization such as amounts of surface modifier. For this reason, this study focused on the structural changes of Fe
3O
4 nanoparticles cluster structure synthesized by polyol method according to the amounts of carboxyl precursor, and the effect of the changes on the characteristics of Fe
3O
4.
In this study, the effect of surface treatment with carboxyl groups on the characteristics of Fe3O4 nanoparticles with cluster structure is reported. Fe3O4 nanoparticles are surface modified with various contents of polyacrylic acid (PAA), a representative polymer precursor. The correlation between the surface treatment conditions and morphological change of the particles and the formation of functional groups on the particle surface is discussed. Additionally, the effect of surface modification on the dispersibility of the particles in aqueous solution and on the surface properties with variation of the synthesis conditions is discussed. The color variations associated with changes in the cluster morphology and carboxylation are discussed based on optical analysis, and the change in the physical magnetic properties are evaluated. Therefore, the optimal conditions for carboxylation of Fe3O4 nanoparticles to achieve the desired optical and magnetic properties, as well as aqueous dispersibility, are presented by comprehensive analysis of the characteristics arising from controlled surface modification.
2. Materials and Methods
2.1. Materials
Ferric chloride hexahydrate (FeCl3·6H2O, >97.0%, Samchun Pure Chemical Co., Ltd., Gyeonggi-do, Korea), sodium acetate (NaOAc, >99.5%, Sigma Aldrich, St. Louis, MO, USA), ethylene glycol (EG, >99.5%, Samchun Pure Chemical Co., Ltd., Gyeonggi-do, Korea), and polyacrylic acid (PAA, average Mw ~450,000, Sigma Aldrich, St. Louis, MO, USA) were purchased from the named suppliers and were used without further purification.
2.2. Synthesis of Fe3O4 Magnetic Nanoparticles
Fe
3O
4 nanoparticles (approximately 300 nm in size) were synthesized by the polyol method proposed in a previous study [
21]. FeCl
3·6H
2O (45 g) was dissolved in distilled water by stirring at room temperature for 1 h. The solution was poured into a 3 L three-neck round-bottom flask containing NaOAc (0.5 M) and EG (1000 mL). The mixture was completely mixed at 100 rpm for approximately 1 h using a mechanical stirrer and was continuously agitated at its boiling point for 18 h. The agitation was stopped when the mixture changed from yellow-brown to black, and the mixture was cooled naturally to room temperature. The synthesized Fe
3O
4 particles were separated from the liquid using an external magnet. The separated particles were rinsed 5 times by ultrasonication for 7 min with ethanol and distilled water.
2.3. Surface Modification of Fe3O4 Nanoparticles Using PAA Solutions
PAA solutions with various concentrations were prepared to modify the surface of the Fe3O4 particles. The PAA solutions (100 mL; 1, 3, 5, and 10 wt %) were prepared by dissolving the required amount of PAA in distilled water by stirring at 300–600 rpm, depending on the viscosity, using a magnetic stirrer. The as-prepared Fe3O4 nanoparticles (1 g) were mixed with the PAA solutions. Each suspension was transferred into a three-neck round-bottom flask and agitated at 300 rpm for 30 min. The mixture was allowed to react at 75 °C for 4 h while maintaining agitation. Thereafter, the mixture was allowed to cool naturally to room temperature. The reacted particles were separated by collection using an external magnet, and the residue was washed several times using distilled water.
2.4. Characterization
The surface characteristics of the samples modified with various PAA contents were analyzed using Fourier-transform infrared (FTIR) spectroscopy (IRAffinity-1, Shimadzu, Kyoto, Japan). The zeta potential, particle size distribution (PSD), and polydispersity index (PDI) of the samples were measured by the dynamic light scattering method (Zetasizer Nano ZSP, Malvern Instrument Ltd., Malvern, WR, UK) to analyze the changes in the surface charge and dispersion properties before and after modification. The change in the microstructure of the Fe3O4 particles after modification was observed using a scanning electron microscope (SEM) (S-4700, HITACHI, Tokyo, Japan) and transmission electron microscope (TEM) (Tecnai G2 F30 S-Twin, FEI, Eindhoven, Netherlands). The surface chemistry of samples was analyzed by the X-ray photoelectron spectroscope (XPS) (Sigma Probe, Thermo VG Scientific, Waltham, MA, USA) with an X-ray source using monochromatic Al Kα (1486.6 eV) under vacuum (<5×10⁻¹⁰ mbar). The Fe3O4 particles were fixed to the sample holder using carbon tape. All binding energies were calibrated with inherent carbon peak (C 1s, 284.8 eV). Peaks of the Fe 2p, C 1s, and O 1s spectra were fitted using a 30% Lorentzian and 70% Gaussian peak shape after the subtraction with use of the Shirley background using CasaXPS software. The CIE L*, a*, and b* color parameter measurements were performed using UV-visible spectroscopy (UV2600, Shimadzu, Kyoto, Japan). A vibrating sample magnetometer (VSM) (Lake Shore 7400, Lake Shore Cryotronics, Inc., Westerville, OH, USA) was used to measure the magnetic parameters of the as-prepared and modified particles at −10 to +10 kOe.
3. Results and Discussion
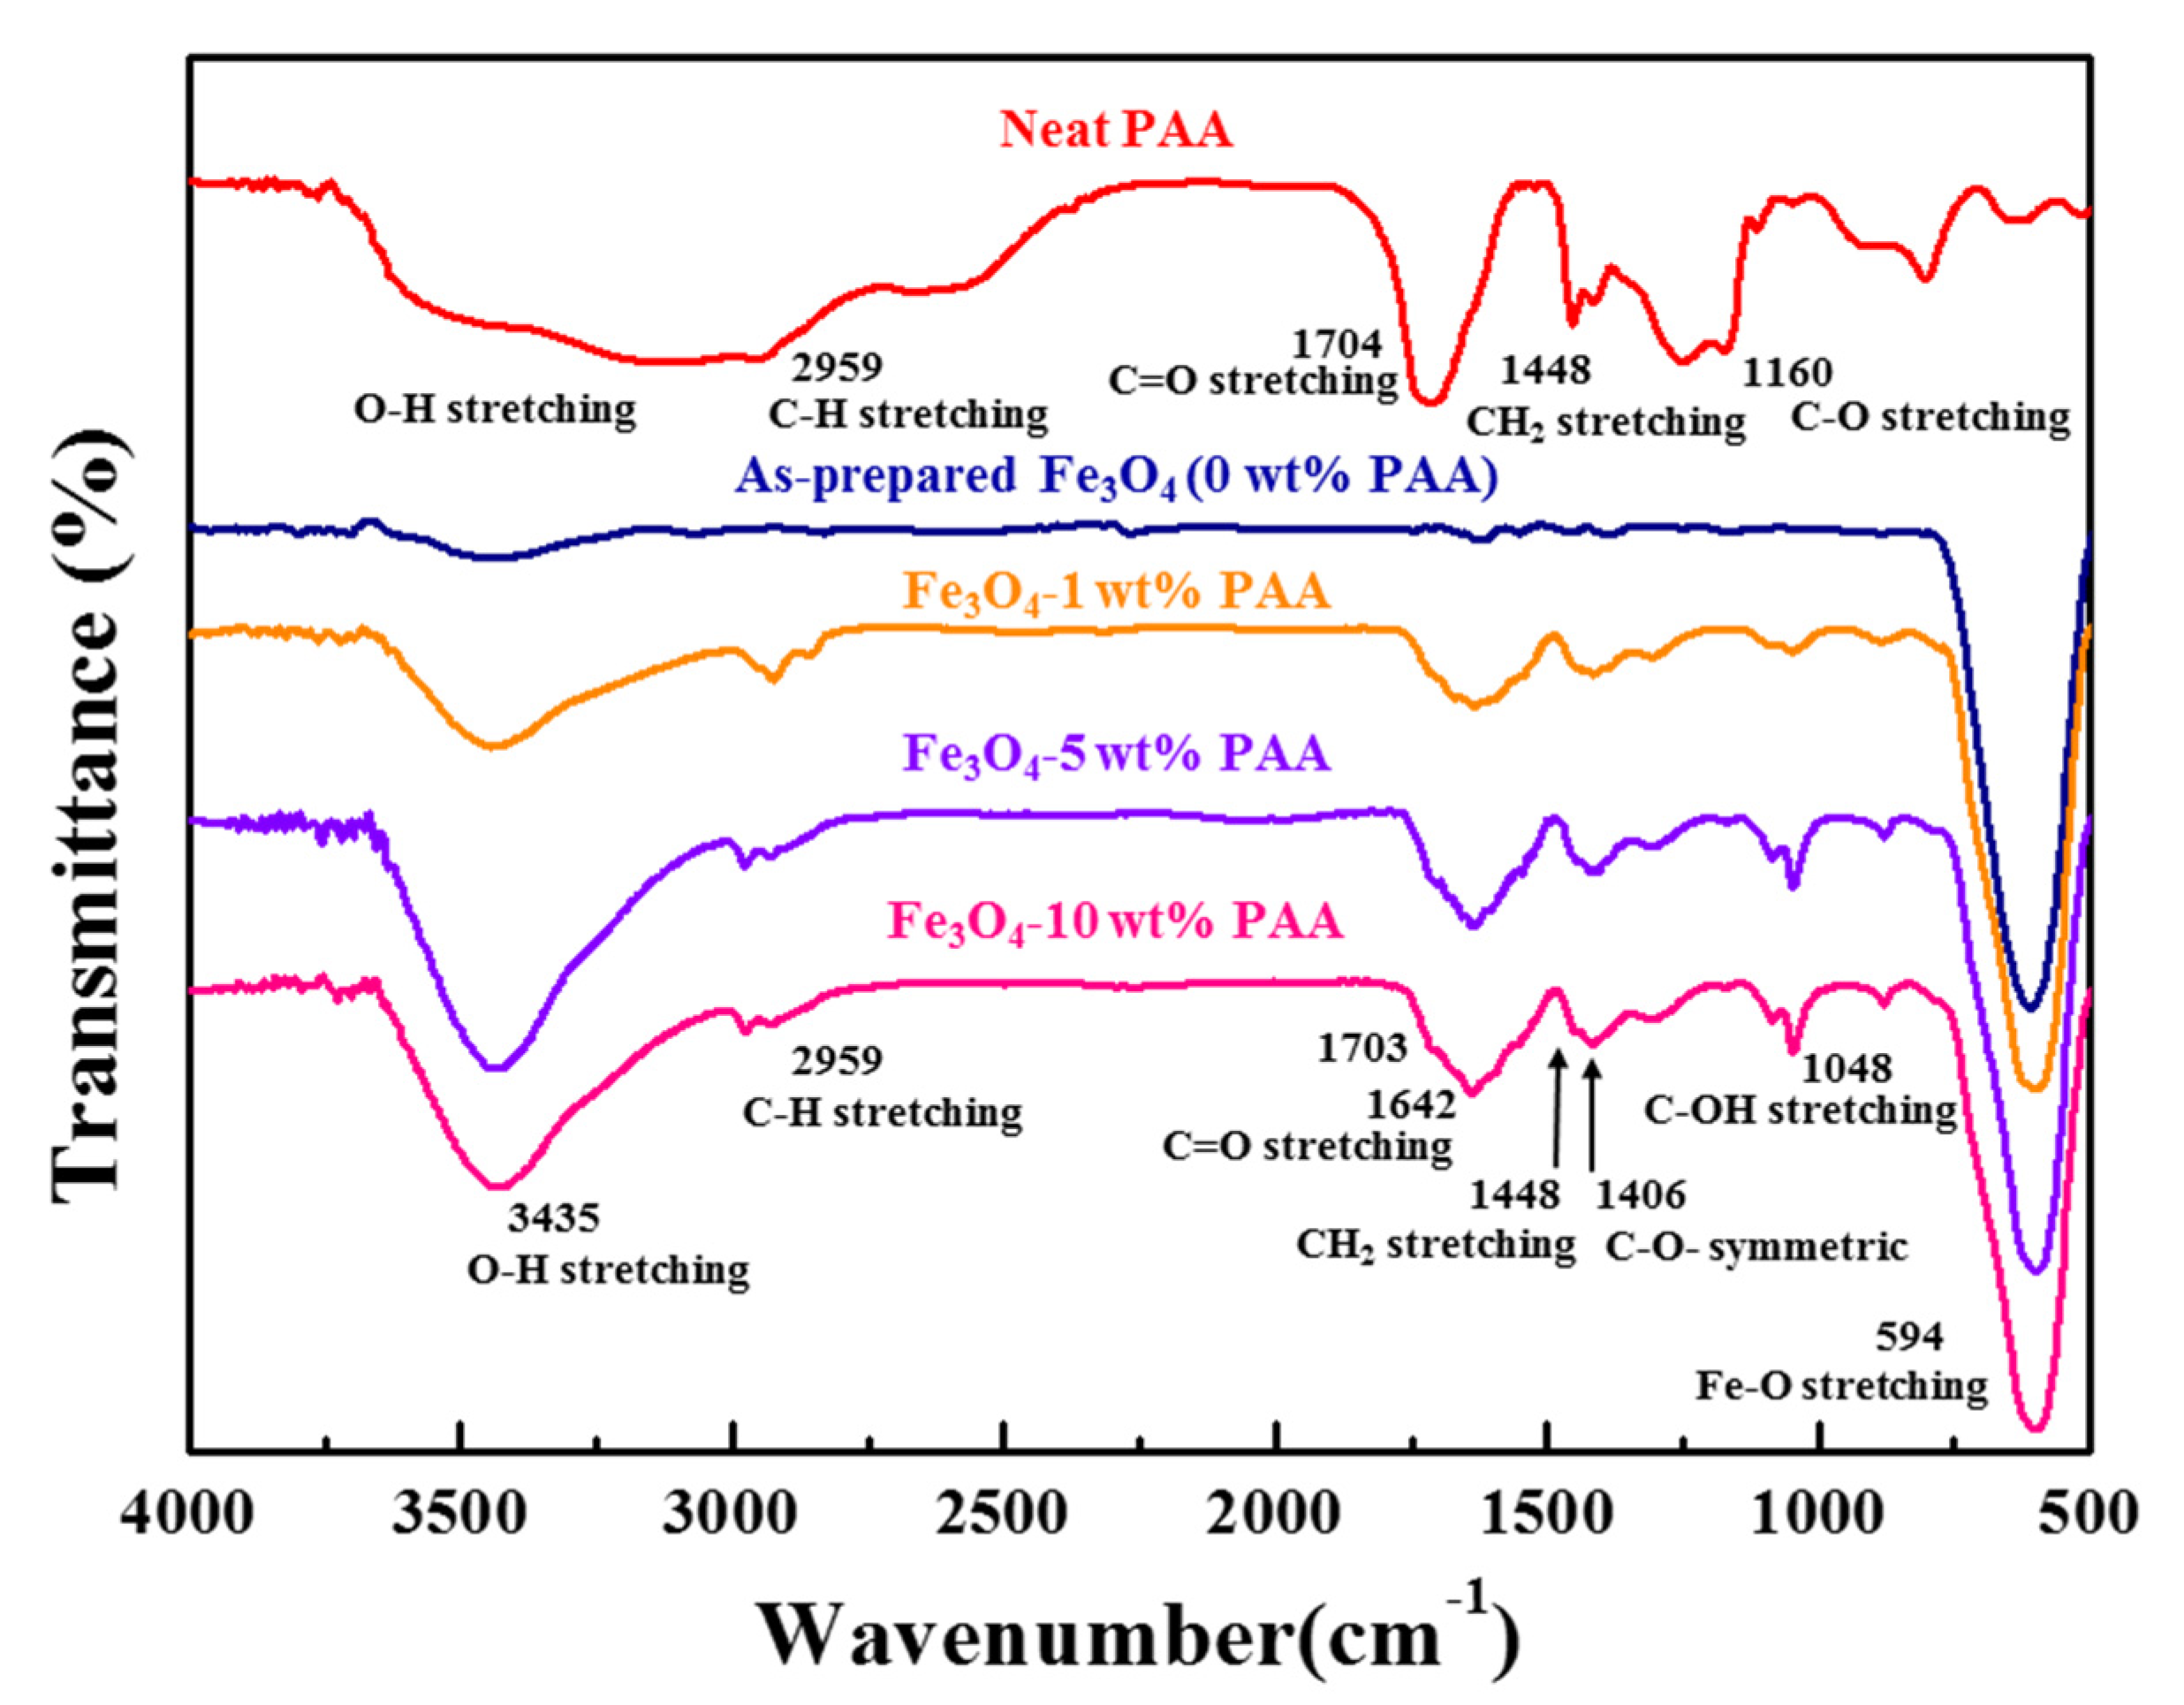
The FTIR spectra of as-prepared Fe
3O
4 and Fe
3O
4 modified using 1, 5, and 10 wt % PAA are shown in
Figure 1. In the spectrum of neat PAA, the peaks were observed at 1448 and 2959 cm
−1 attributed to CH
2 stretching and C–H stretching modes, respectively. In addition, the peaks ascribed to C–O and C=O stretching modes in carboxyl groups were observed at 1160 and 1704 cm
−1, respectively [
22]. Near the range of 2760–3744 cm
−1, the broad peak associated with the O–H stretching mode was observed. The spectra of Fe
3O
4 samples show the peak of the Fe–O stretching vibration at 594 cm
−1, confirming that the particles were based on iron oxide [
23]. After surface modification with PAA, new peaks associated with CH
2 stretching and C–H stretching modes were observed at 1448 and 2959 cm
−1, respectively. These peaks are ascribed to the organic polymer structure of PAA, the precursor. Other new peaks associated with the C–O symmetric stretching mode were observed at 1048 and 1406 cm
−1. The peaks assigned to the C–OH stretching mode and C=O stretching mode were observed at 1048, 1642, and 1704 cm
−1, respectively. In addition, the broad peak observed near 3435 cm
−1 was associated with the O–H stretching mode. These peaks are attributed to carboxylic acid or carboxyl groups at the terminal of the PAA structure [
24,
25]. It is deduced that the surface was successfully modified, where the organic structures of PAA caused a change in the particle surface due to the reaction between the Fe
3O
4 nanoparticles and the precursor PAA, based on observation of the new peaks in the spectrum of the treated particles.
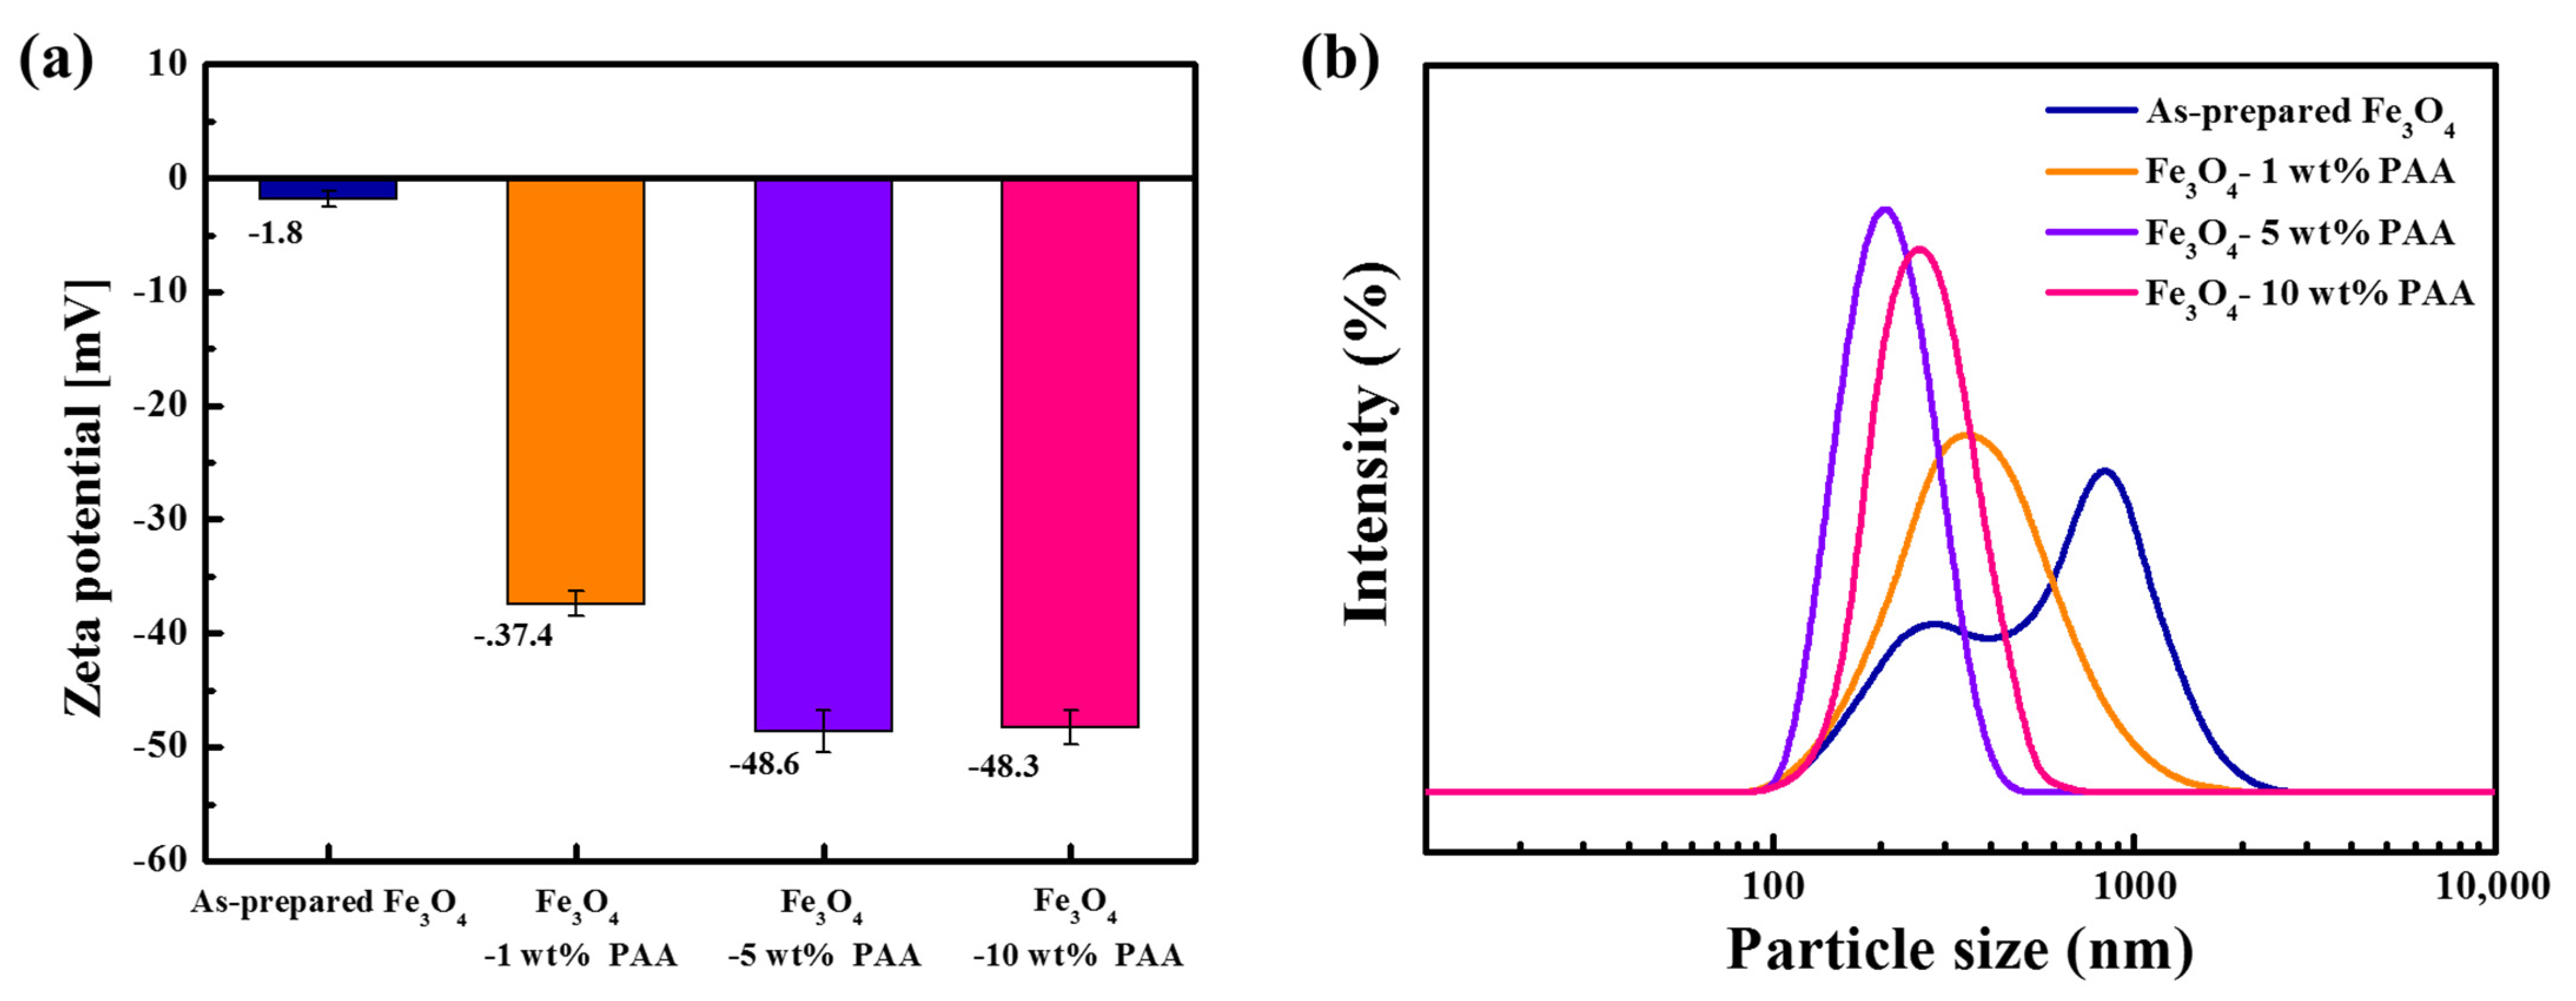
Figure 2 shows the results of the zeta potential and PSD measurements for as-prepared Fe
3O
4 and Fe
3O
4 modified with PAA. The zeta potential of as-prepared Fe
3O
4 was measured to be −1.8 mV. The zeta potential of PAA-modified Fe
3O
4 was −37.4 mV (1 wt %), −48.6 mV (5 wt %), and −48.3 mV (10 wt %). The zeta potential decreased as the PAA content increased, and the zeta potentials of Fe
3O
4 modified with 5 wt % and 10 wt % PAA were similar. The FTIR spectra (
Figure 1), which contain information about the bonds on the particle surface, showed a change in the intensity of the adsorption of specific bonds as the precursor content changed. The peaks of the carboxyl groups of Fe
3O
4 modified with 5 wt % PAA were more intense than those of the particles modified with 1 wt % PAA. However, there were no significant differences in the intensity at the same wavenumber for the particles modified with 5 and 10 wt % PAA. The rate of change of the negative zeta potential also reflects this behavior.
The parabolic particle size distribution curve in
Figure 2b indicates a bimodal particle size for as-prepared Fe
3O
4. The parabola had a broad distribution, and two peaks were observed at 271 and 838 nm. This indicates polydispersity of the particles, attributed to aggregation between the particles due to their inherent low surface charge and high surface energy derived from their small particle size and clustered structure. After surface modification, the parabola exhibited a monomodal shape, with a narrower distribution compared to that of as-prepared Fe
3O
4. In addition, the measured average particle size decreased. The average sizes after surface modification were 340 nm (1 wt %), 202 nm (5 wt %), and 256 nm (10 wt %). The peak shifted to a smaller particle size and the distribution became narrow as the PAA content increased.
The PDIs of as-prepared Fe
3O
4 and Fe
3O
4 modified with PAA are listed in
Table 1. The PDI value for as-prepared Fe
3O
4 (0 wt % PAA) was 0.785 and that of Fe
3O
4 modified using PAA was 0.493 (1 wt %), 0.168 (5 wt %), and 0.212 (10 wt %). A smaller PDI value indicates that the particles were monodisperse. After surface modification, the PDI value decreased compared to that of as-prepared Fe
3O
4, and decreased as the content of PAA increased. It could be inferred that the dispersion of the Fe
3O
4 particles was enhanced by the inter-particle repulsive force from the carboxyl groups formed by surface modification. The PDI of Fe
3O
4 modified with 10 wt % PAA was higher than that of Fe
3O
4 modified with 5 wt % PAA. This trend is consistent with the results of the zeta potential and PSD analyses. As shown in
Figure 2, the zeta potential of 10 wt % PAA-treated Fe
3O
4 was a similar value to that of 5 wt % PAA-treated Fe
3O
4, but the former had a larger average particle size and broader distribution. This is inferred to be due to the effects that appear on the particle surface, such as over-saturation with carboxyl groups or structural factors related to the particles. Consequently, the PDI values followed a trend similar to those of the zeta potential measurement as the PAA content changed.
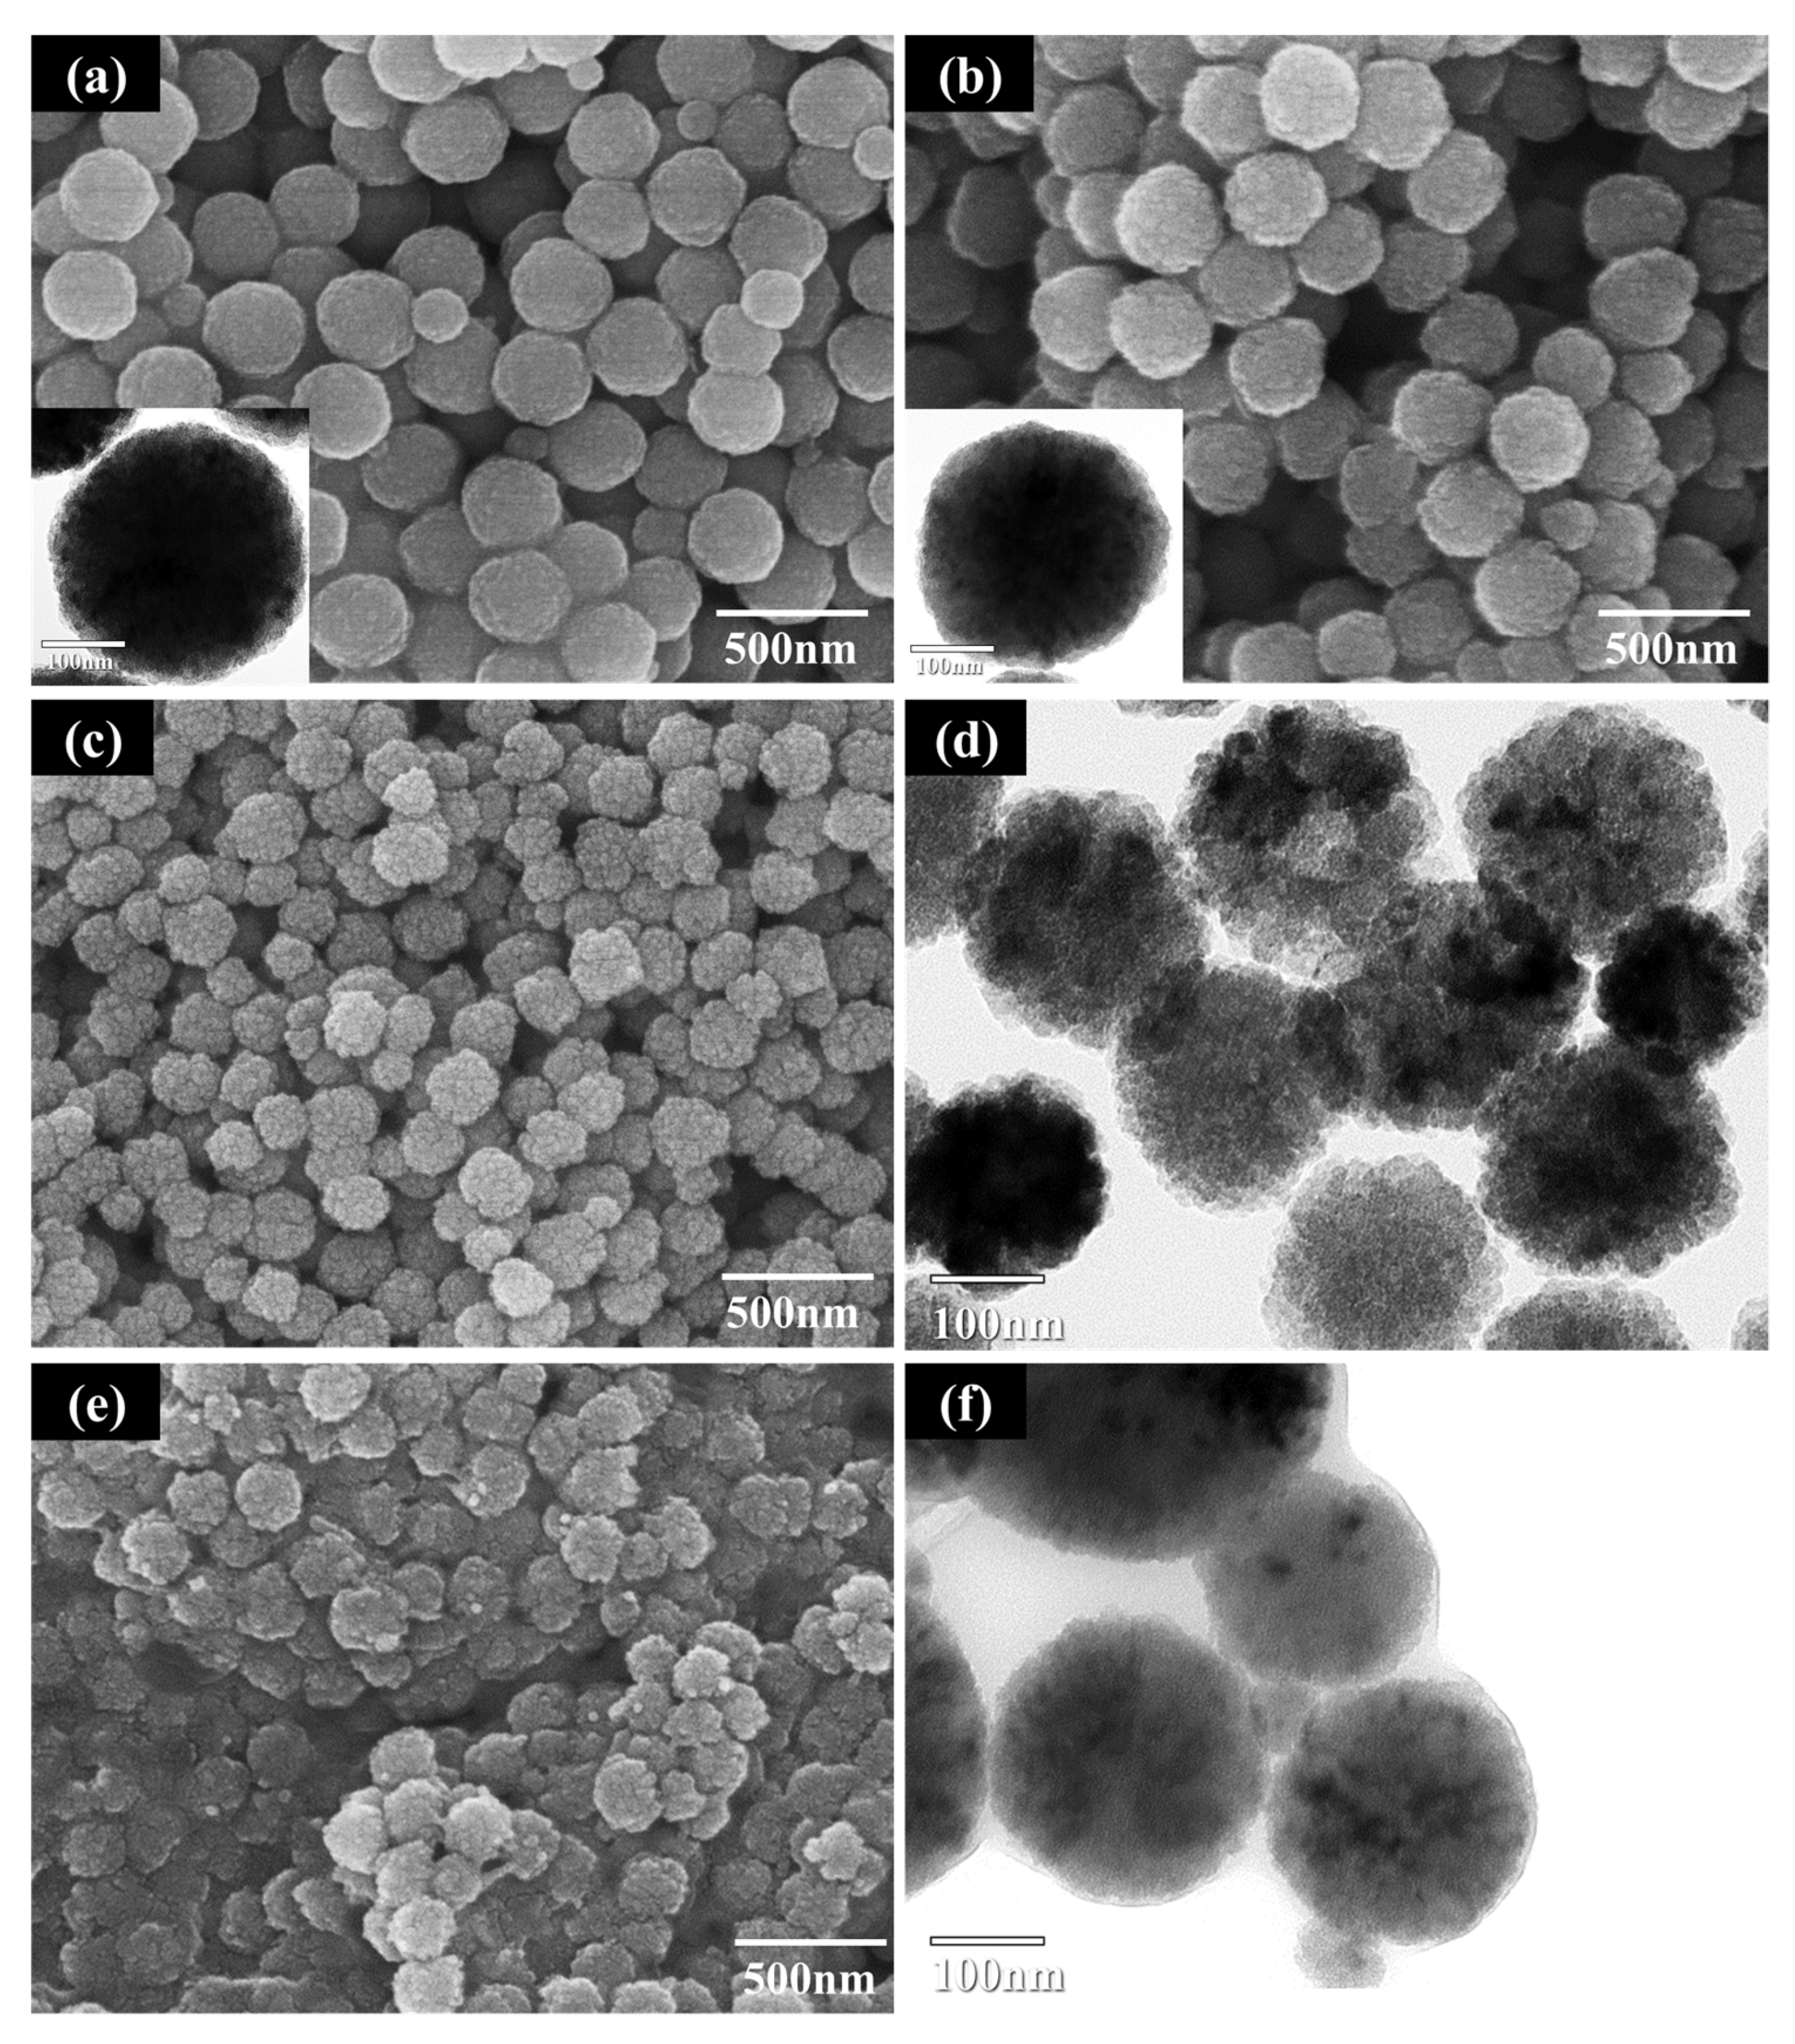
The FE-SEM and TEM images of as-prepared Fe
3O
4 and Fe
3O
4 modified using PAA with various contents are presented in
Figure 3. As shown in
Figure 3a, the as-prepared Fe
3O
4 particles exhibited a spherical shape of approximately 300 nm in size. The particles dissociated after surface modification with 1 wt % PAA (
Figure 3b), attributed to separation of the primary particles comprising the cluster by electrostatic repulsion derived from the influence of the external carboxyl precursor. In the case of the particles modified using over 5 wt % PAA, the dissociation of the particles was more extensive and the density of the outer part of the particles decreased. This was confirmed from the TEM images in
Figure 3d,f. When the amount of precursor exceeded the critical value, separation of the primary particles from the surface of the cluster was accelerated. In comparison, partial agglomeration of the Fe
3O
4 particles was observed in the SEM and TEM images in
Figure 3e,f, consistent with the PSD measurements. The parabolic size distribution curve of 10 wt % PAA-treated Fe
3O
4 (
Figure 2b) revealed a broader distribution and larger average particle size compared to that of 5 wt % PAA-treated Fe
3O
4. In addition, an unspecified layer was formed on the particle surface, attributed to agglomeration of the particles owing to the bridging flocculation induced by excess PAA deposited on the surface [
26,
27].
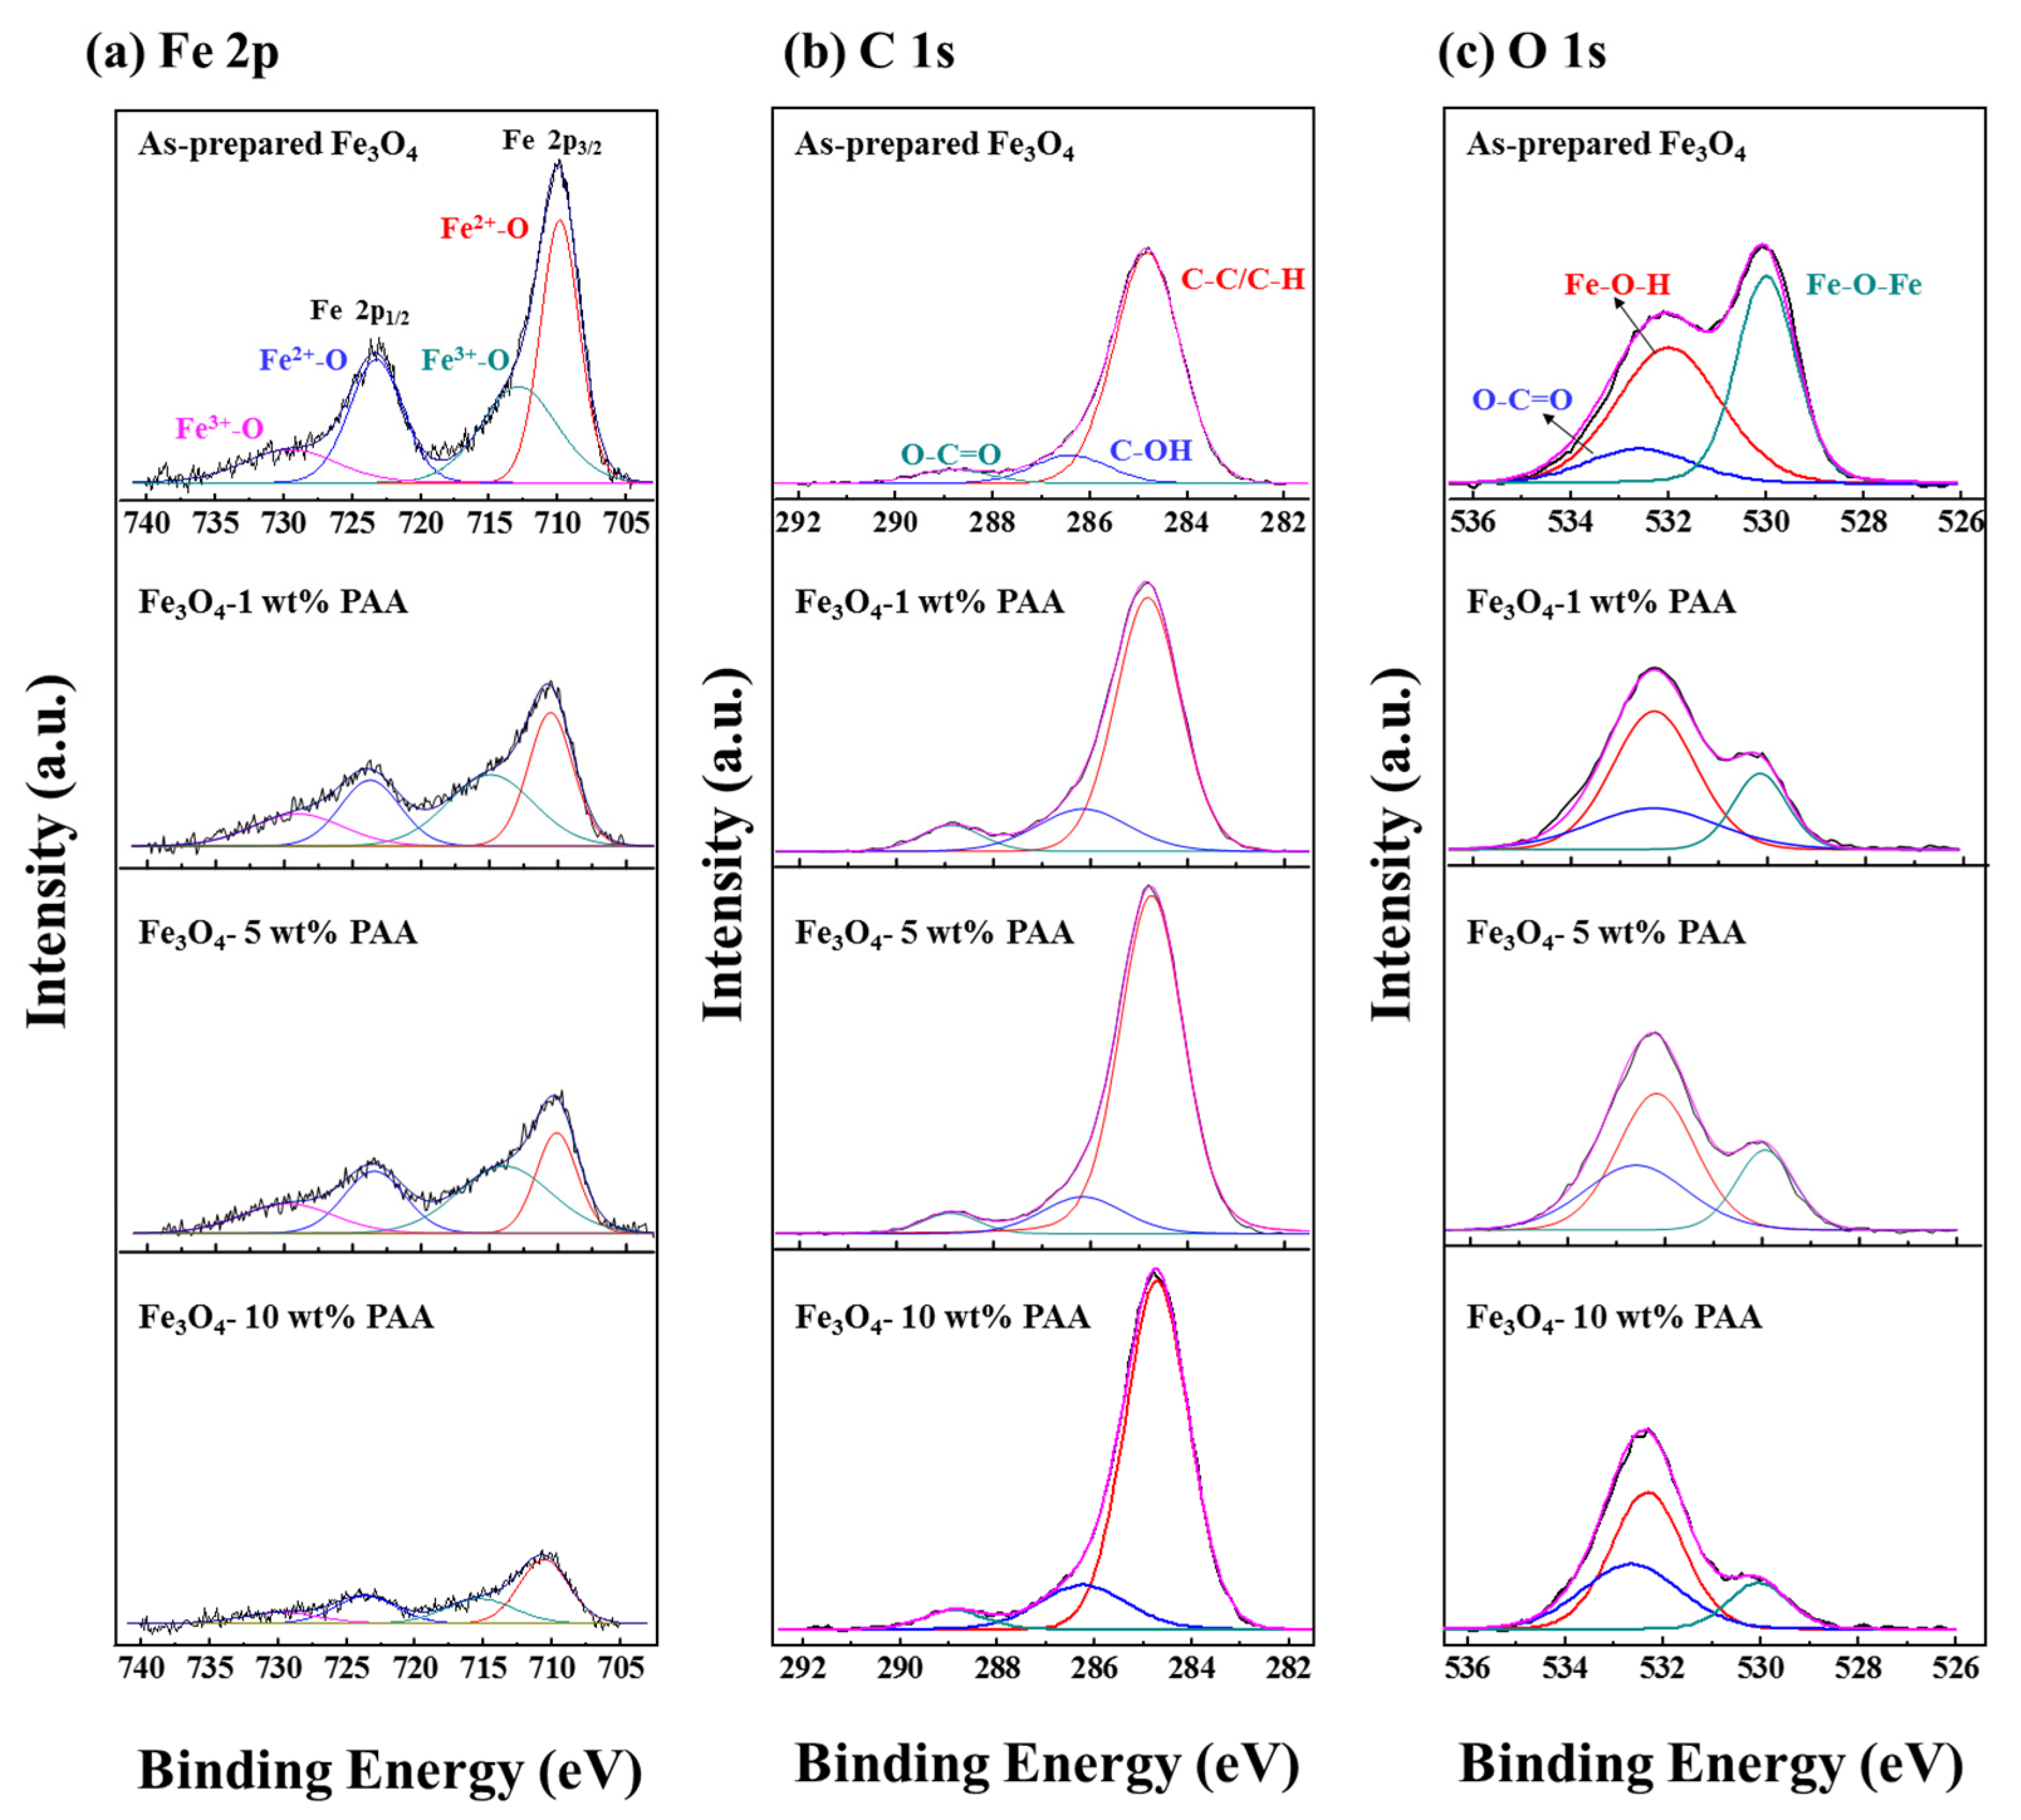
The high resolution XPS spectra were measured for Fe 2p, C 1s, and O 1s of as-prepared Fe
3O
4 and Fe
3O
4 modified using various PAA contents (
Figure 4). The spectra of Fe 2p exhibited two peaks at 710.1 and 723.5 eV corresponded to Fe 2p 3/2 and Fe 2p 1/2, respectively [
28]. The spectra were deconvoluted into four component peaks located at 709.8 and 723.3 eV (Fe
3+–O), 712.8 and 729.5 eV (Fe
2+–O). According to previous studies, it has been reported that the satellite peak at 719.0 eV related to Fe
3+ in γ-Fe
2O
3 is not observed in the Fe 2p spectra of Fe
3O
4 [
29,
30,
31,
32]. All the Fe 2p spectra obtained in this study do not have the satellite peak at 719.0 eV even after surface modification using PAA (
Figure 4a). For this reason, it is deduced that the addition of PAA does not influence to oxidation of Fe
3O
4 to γ-Fe
2O
3.
After the surface modification using PAA, changes on the spectra were observed in the XPS results of Fe 2p, C 1s, and O 1s. Intensity of the peaks for the Fe 2p 3/2 and Fe 2p 1/2 decreased as the PAA content increased. In the spectra of C 1s, intensity of the peaks at 284.8 and 288.4 eV increased as the increase in PAA content. The peaks are related to C–C/C–H and O–C=O, respectively [
33,
34]. In the
Figure 4c, the spectra of O 1s are consisted of three component peaks located at 531.1, 532.0, and 532.5 eV corresponded to Fe–O–Fe, Fe–O–H, and O–C=O, respectively [
31]. As the PAA content increased, the spectra of O 1s exhibited the similar tendency with the spectra of Fe 2p and C 1s. Intensity of Fe–O–Fe peak increased and that of O–C=O peak decreased as the PAA content changed from 1 wt % to 10 wt %. Consequently, the peaks related to carboxyl group increased and the peaks about the Fe
3O
4 relatively decreased as the PAA content increased. It is considered to the influence of carboxyl groups formed on the surface of the particles by surface modification using PAA as shown in the results of above analyses.
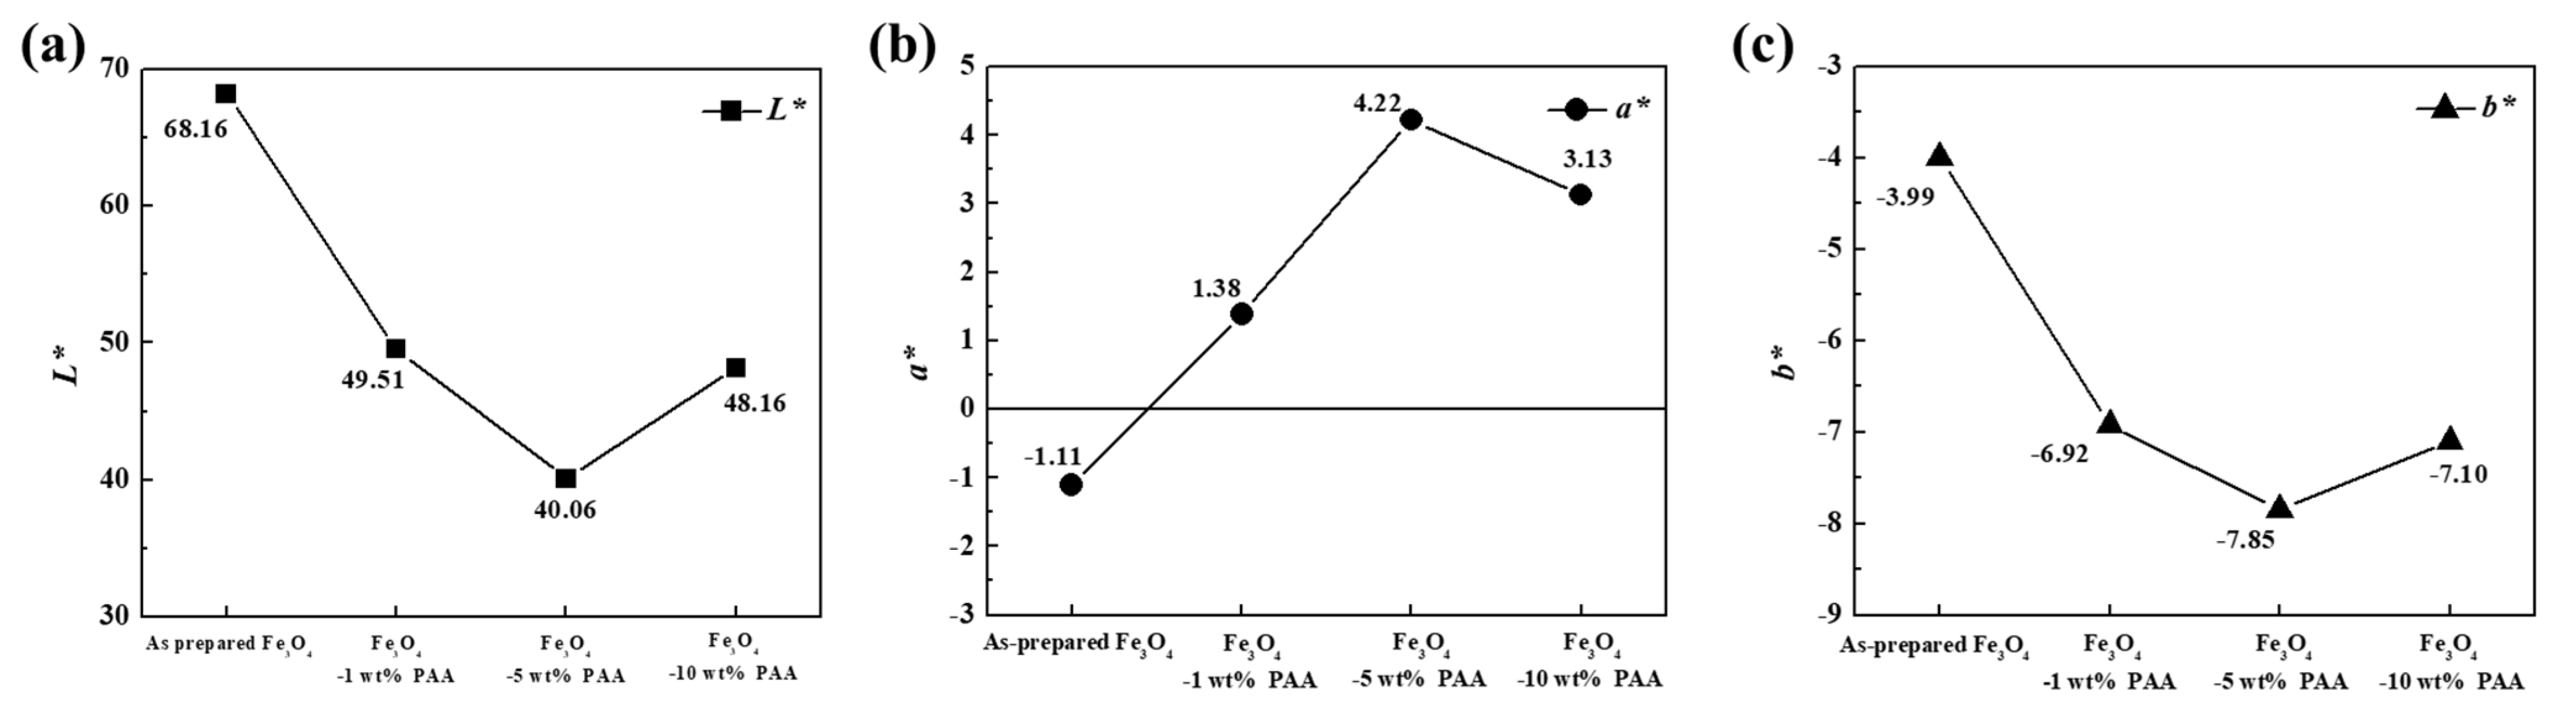
The L*, a*, and b* values for the particles calculated from the CIE Lab color coordinates are presented in
Figure 5 and
Table 2. The three parameters L*, a*, and b* correspond to the brightness, red/green, and yellow/blue color intensities, respectively. The L*, a*, and b* values were in the range of 40.06–68.16, −1.11–4.22, and −7.10–3.99, respectively. For all Fe
3O
4–PAA samples, the L* and b* values were lower and a* values were higher than for the Fe
3O
4 sample before modification. This means that the brightness of the samples decreased and the color of the samples changed to red and blue. The L* and b* values decreased as the PAA content increased in the range of 0–5 wt %. In the same range, the value of a* changed to a positive value and increased with an increase in the PAA content. This is attributed to the acceleration of dissociation of the cluster particles owing to the electrostatic repulsion of the carboxyl groups. However, the opposite tendency was observed for all values at 10 wt % PAA content. The increase in the L* value is due to the opaque layer formed on the surface of the particles, as shown in
Figure 3d-1 [
35]. The reversal of the a* and b* values is inferred to be due to particle agglomeration, which is attributed to bridging flocculation caused by excessive PAA adsorbed on the particle surface.
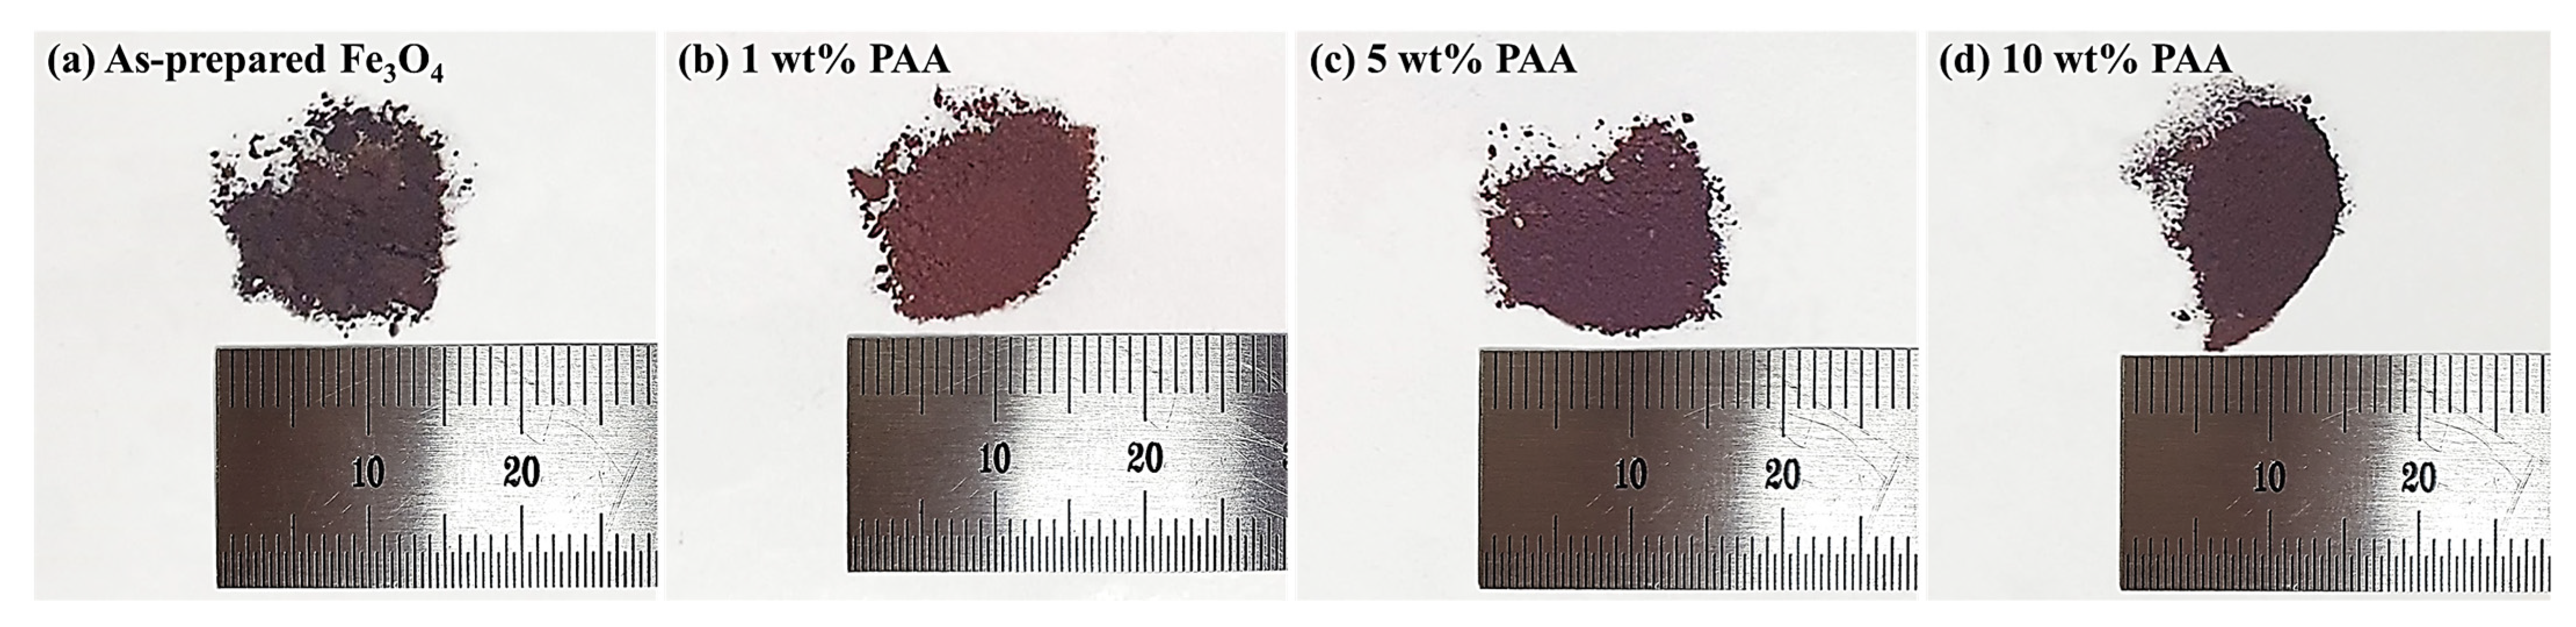
Images of as-prepared Fe
3O
4 and modified particles are presented in
Figure 6. The images show that the color of the samples changed after surface modification using PAA. The color of the modified particles was different from the dark brown color of as-prepared Fe
3O
4, where the color change was dependent on the PAA content. Fe
3O
4–1 wt % PAA exhibited a reddish-brown color compared to as-prepared Fe
3O
4. The color of Fe
3O
4–5 wt % PAA and Fe
3O
4–10 wt % PAA was close to purple. The observed color changes are consistent with the CIE Lab coordinates in
Figure 5 and
Table 2. This indicates that the optical properties of the particles can be adjusted by changing the structure of the particles through surface modification using PAA.
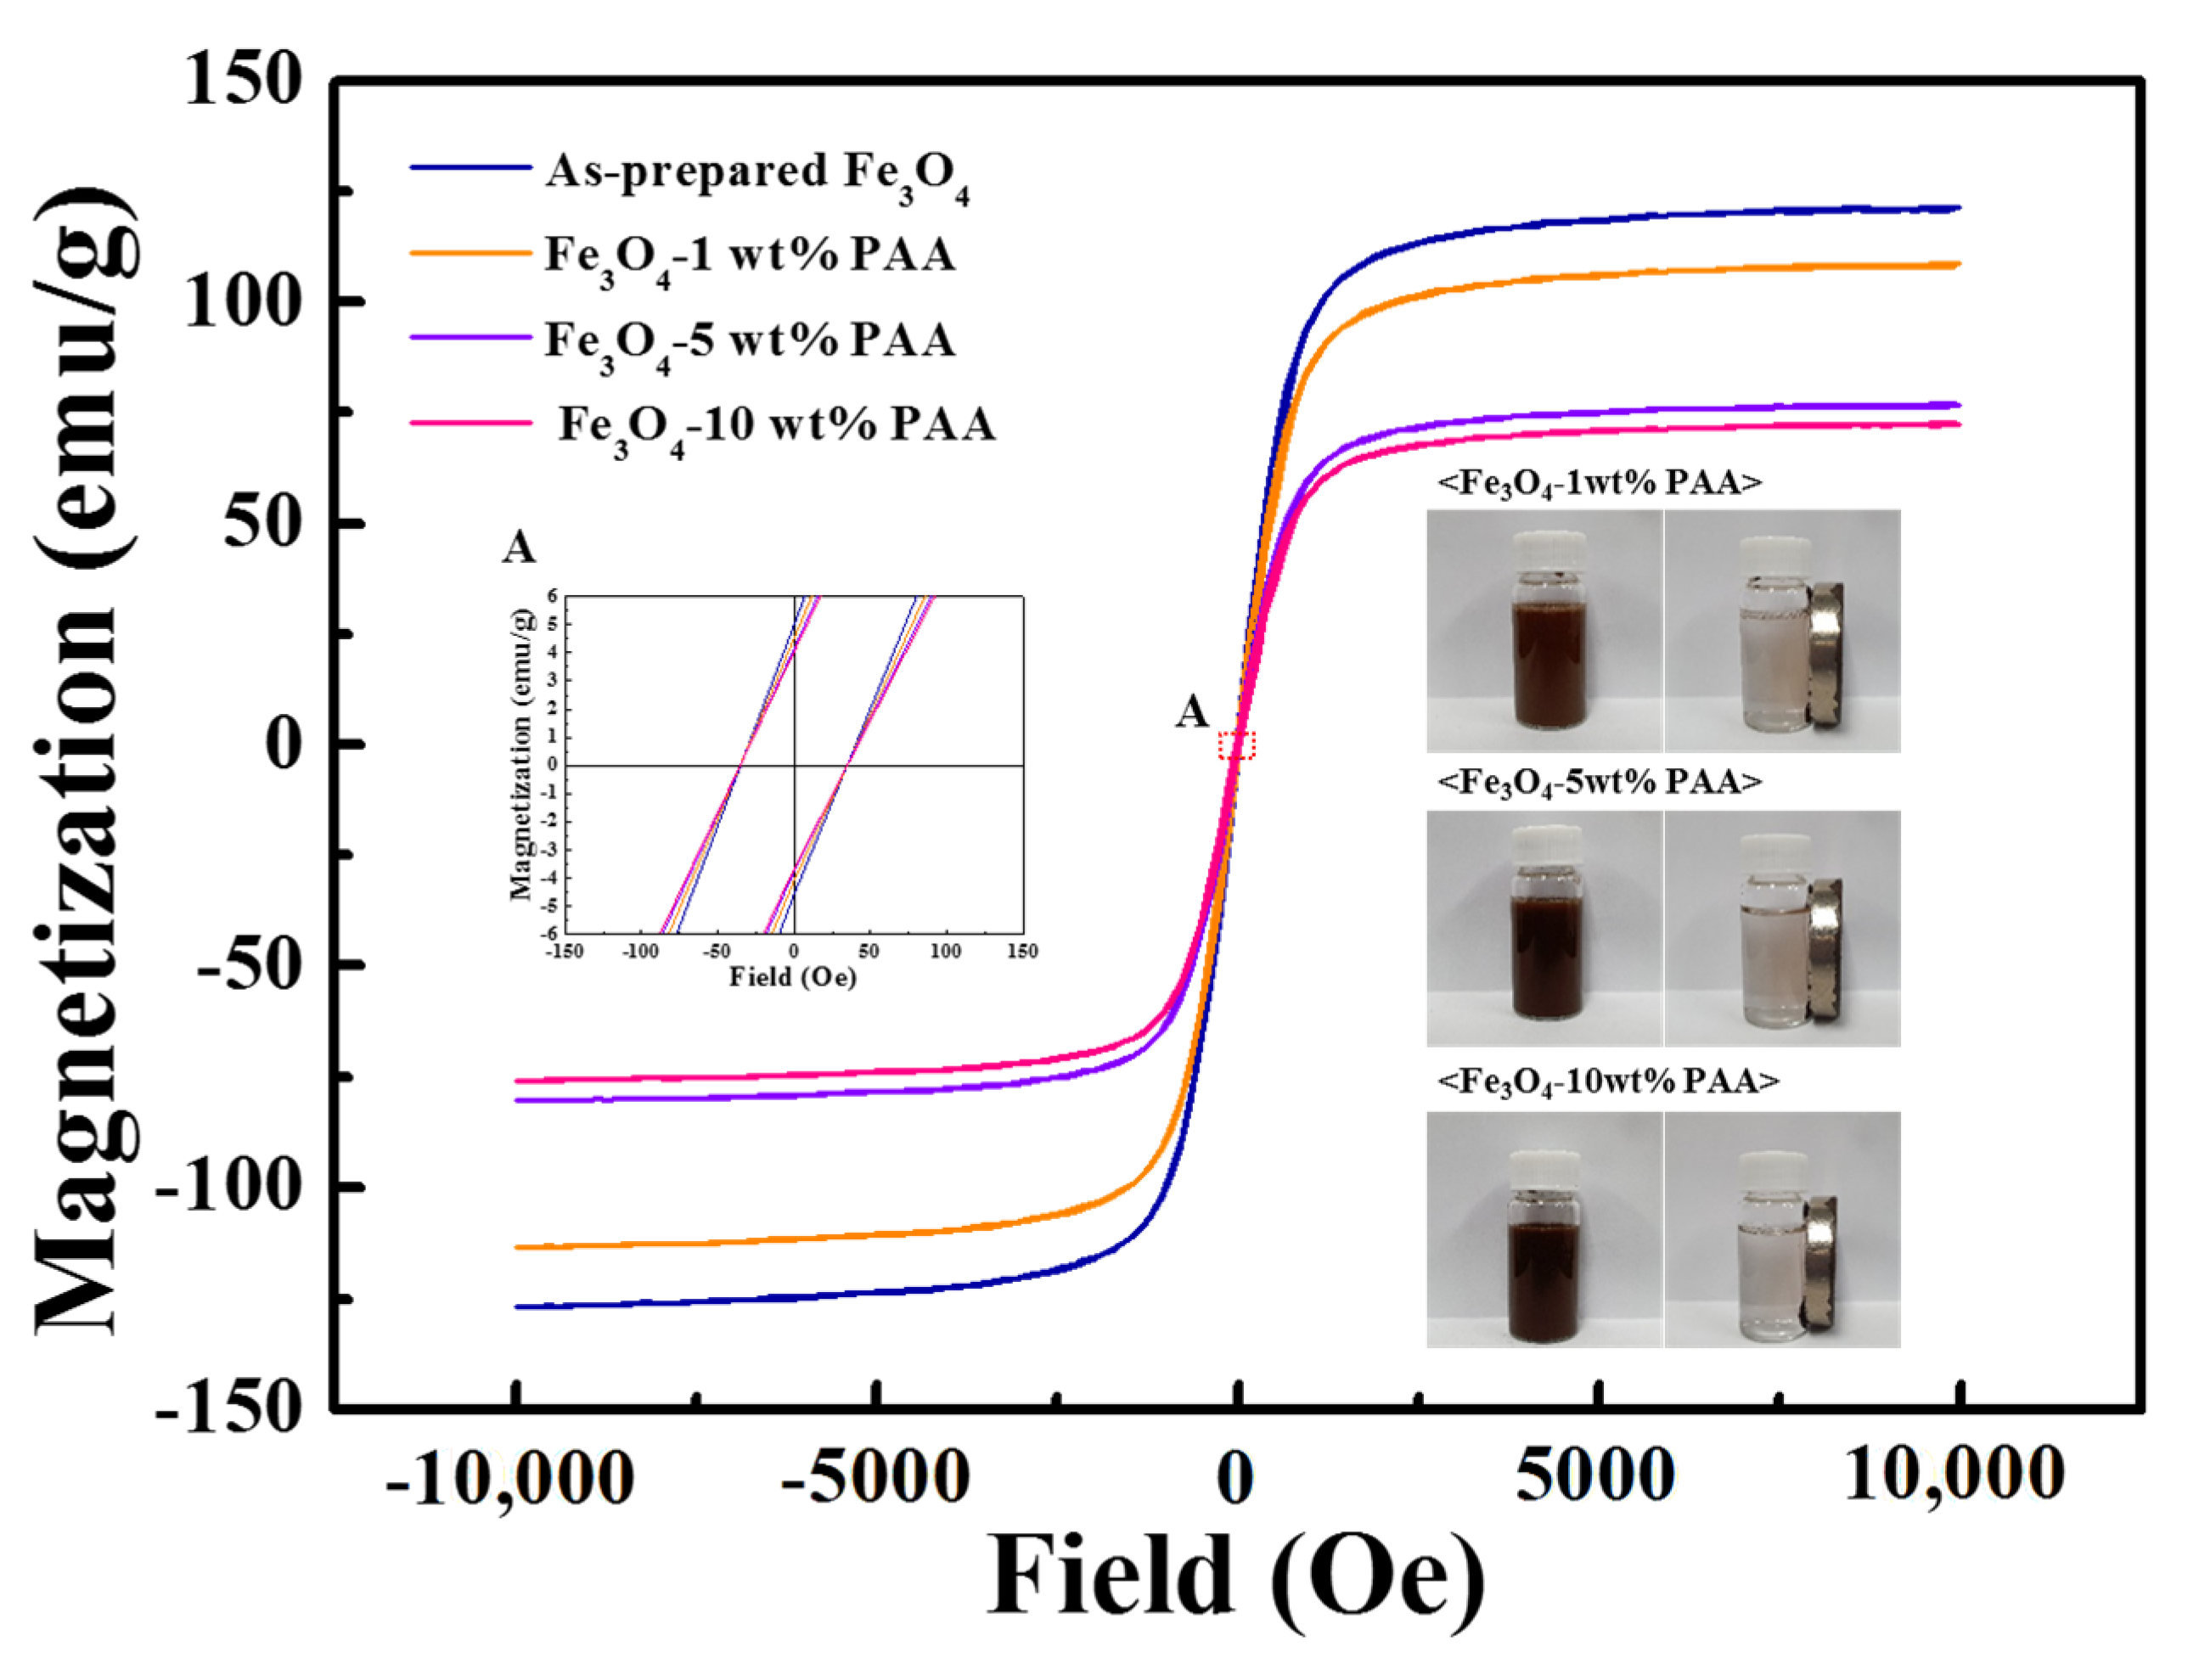
The magnetic properties of as-prepared Fe
3O
4 and Fe
3O
4 modified using various PAA contents were analyzed using VSM. From the magnetization curves in
Figure 7, it was determined that all samples had extremely low (nearly zero) remanence (
Mr) and coercivity (
H). In addition, in the liquid state, the samples maintained the dispersed state in the absence of an external magnetic field and could be separated from the liquid under an external applied magnetic field (images in
Figure 7). It is deduced that Fe
3O
4 has superparamagnetic properties, and the Fe
3O
4–PAA samples also exhibit this property even after surface modification. The saturation magnetization (
Ms) of the as-prepared Fe
3O
4 and Fe
3O
4 modified using 1, 5, and 10 wt % PAA was quantified to be 120.85, 108.11, 76.54, and 72.22 emu/g, respectively. The
Ms value of Fe
3O
4−PAA decreased by 40.2% compared with that before surface modification. This can be attributed to the decrease in the density owing to dissociation of the particles. It was also inferred that the
Ms value of Fe
3O
4−10 wt % PAA decreased because of the increase in the particle weight due to the formation of the surface layer. It was confirmed that the magnetic properties were affected by changes in the structural factors of the Fe
3O
4 nanoparticles due to surface modification.


