Article

Effective Analysis of Different Gas Diffusers on Bubble Hydrodynamics in Bubble Column and Airlift Reactors towards Mass Transfer Enhancement

1
Department of Environmental Engineering, Faculty of Engineering, Chulalongkorn University, Bangkok 10330, Thailand
2
Faculty of Hydrology and Water Resources Engineering, Institute of Technology of Cambodia, Phnom Penh 12156, Cambodia
3
Water and Environment Research Unit, Research and Innovation Center, Institute of Technology of Cambodia, Phnom Penh 12156, Cambodia
4
Research Unit on Technology for Oil Spill and Contamination Management, Chulalongkorn University, Bangkok 10330, Thailand
5
Research Program on Development of Technology and Management Guideline for Green Community, Center of Excellence on Hazardous Substance Management (HSM), Bangkok 10330, Thailand
6
Research Network of NANOTEC-CU on Environmental, Department of Environmental Engineering, Chulalongkorn University, Bangkok 10330, Thailand
7
Center of Excellence in Particle and Materials Processing Technology, Department of Chemical Engineering, Faculty of Engineering, Chulalongkorn University, Bangkok 10330, Thailand
*
Author to whom correspondence should be addressed.
Processes 2021, 9(10), 1765; https://doi.org/10.3390/pr9101765
Submission received: 20 August 2021 / Revised: 22 September 2021 / Accepted: 28 September 2021 / Published: 1 October 2021

Abstract

:
Even bubble column reactors (BCR) and airlift reactors (ALR) have been developed in terms of various related aspects towards mass transfer enhancement, the effective analysis of gas diffuser types on mass transfer and gas–liquid hydrodynamic characteristics is still limited. Therefore, the present study aims to analyze the relative effect of different types of air diffusers on bubble hydrodynamics and mass transfer performance to understand their behaviors and define the best type. The experiments were conducted by varying different diffuser types, reactor types (BCR and ALR), and superficial gas velocity (Vg) (0.12 to 1.00 cm/s). Five air diffusers including commercial fine sand (F-sand) and coarse sand (C-sand) diffusers, and acrylic perforated diffusers with orifice sizes of 0.3 mm (H-0.3), 0.6 mm (H-0.6), and 1.2 mm (H-1.2), were used in this study. For every condition, it was analyzed in terms of bubble hydrodynamics and oxygen mass transfer coefficient (KLa). Lastly, the selected diffusers that provided the highest KLa coefficient were evaluated with a solid media addition case. The results of both reactor classes showed that F-sand, the smallest orifice diffuser, showed the smallest air bubbles (3.14–4.90 mm) compared to other diffusers, followed by C-sand, which larger about 22–28% on average than F-sand. ALR exhibited a better ability to maintain smaller bubbles than BCR. Moreover, F-sand and C-sand diffusers showed a slower rising velocity through their smaller bubbles and the tiny bubble recirculation in ALR. Using F-sand in ALR, the rising velocity is about 1.60–2.58 dm/s, which is slower than that in BCR about 39–54%. F-sand and C-sand were also found as the significant diffusers in terms of interfacial area and gas hold-up. Then, the KLa coefficient was estimated in every diffuser and reactor under the varying of Vg. Up to 270% higher KLa value was achieved from the use of F-sand and C-sand compared to other types due to their smaller bubbles generated/maintained and longer bubble retention time through slower rising velocity. After adding 10% ring shape plastic media into the reactors with F-sand and C-sand diffusers, a better performance was achieved in terms of KLa coefficient (up to 39%) as well as gas hold-up and liquid mixing. Lastly, ALR also had a larger portion of mixed flow pattern than BCR. This eventually promoted mass transfer by enhancing the mixed flow regime.

1. Introduction

Gas–liquid and gas–liquid–solid contactors are commonly used in chemical, biological, and biochemical industries [1]. It is estimated about a quarter of the chemical process occurs between gas and liquid phases [2]. Bubble column reactor (BCR) and airlift reactor (ALR) are the two types of multi-phase reactors often applied to introduce gas and liquid phases together as mass transfer process due to various benefits including efficient mixing behaviors, high mass transfer rate, compactness, and lower operation and maintenance costs [3]. Even these reactor classes have received much attention from researchers and industrial sectors, various challenges have to be overcome to further enhance mass transfer performance as well as oxygen transfer efficiency from gas to liquid phases due to the high oxygen demand in the liquid aspect. Reactor development has been investigated with a tremendous effort in terms of gas–liquid hydrodynamics through configuration and structure modification for improving mass transfer performance [4].
Bun et al. (2020) [5] just recently developed the new multiphase reactor in order to enhance oxygen transfer performance by adding a vertical baffle to produce liquid circulation flow and slant baffles in the riser compartment to extend bubble retention time and improve bubble distributions in the reactor. As a result, a newly developed reactor could increase the oxygen transfer coefficient (KLa) up to 28–97% compared to conventional reactors. This improvement can be observed due to the extension of bubble residence in reactor resulting in decrease bubble rising velocity about 39% to 52% over regular one [6]. Plus, Nikakhtari and Hill (2005) [7] were successful at improving the KLa coefficient 3.7 times higher than the unpacked system by using a small amount of nylon mesh packing inserted in the riser compartment of the external loop ALR. Moreover, the packing reactor could enhance mass transfer performance due to increasing gas hold-up, decreasing bubble size, and decreasing the liquid circulation.
Based on two-film theory [8], the KLa coefficient is the combination between liquid-side mass transfer (KL) and specific interfacial area (a). KL coefficient is mainly related to the thickness of liquid film while interfacial area parameter links to the gas hold-up and bubble size [9]. Learning from this mass transfer theory and literature from recent reviews, bubble size distribution (BSD) is the local variable to be considered in order to investigate the gas–liquid contact development as well as mass transfer enhancement. For this purpose, our recent publication examined the effect of additional solid media on bubble hydrodynamics for intensifying the oxygen mass transfer [10]. Adding plastic media into BCR and ALR resulted in enhancing the KLa coefficient up to 31–56% compared to the non-addition cases. Bubble distribution in the reactors with plastic media was found in a smaller size than without media adding up to 29%.
Aiming to develop these multiphase reactors for more mass transfer enhancement, effective study, as well as optimization of gas diffuser types, was investigated in the present work. Gas diffuser or sparger is another important device for developing multiphase reactor as dramatically dominates BSD and bubble rising velocity in the reactor [11]. It governs overall bubble hydrodynamic parameters and liquid flow characteristics as well as mass transfer performance. Therefore, examine different gas diffusers for gas–liquid contactor development is crucial for optimizing the reactor performance [4]. Moreover, liquid mixing characteristics in both reactor classes will be examined in order to understand the behind mechanism at different conditions as well [6,7,12].
The objective of this study is to analyze gas–liquid dynamics and mass transfer performance in BCR and ALR under the operation of different gas diffuser types and plastic media additions. Three main scopes of work will be addressed to make a critical analysis of gas–liquid hydrodynamics and mass transfer in multiphase reactors with different gas diffusers and plastic media additions including mass transfer performance estimation, liquid flow behaviors analysis using residence time distribution (RTD) methodology, and bubble hydrodynamics analysis using a photographic technique.

2. Materials and Methods

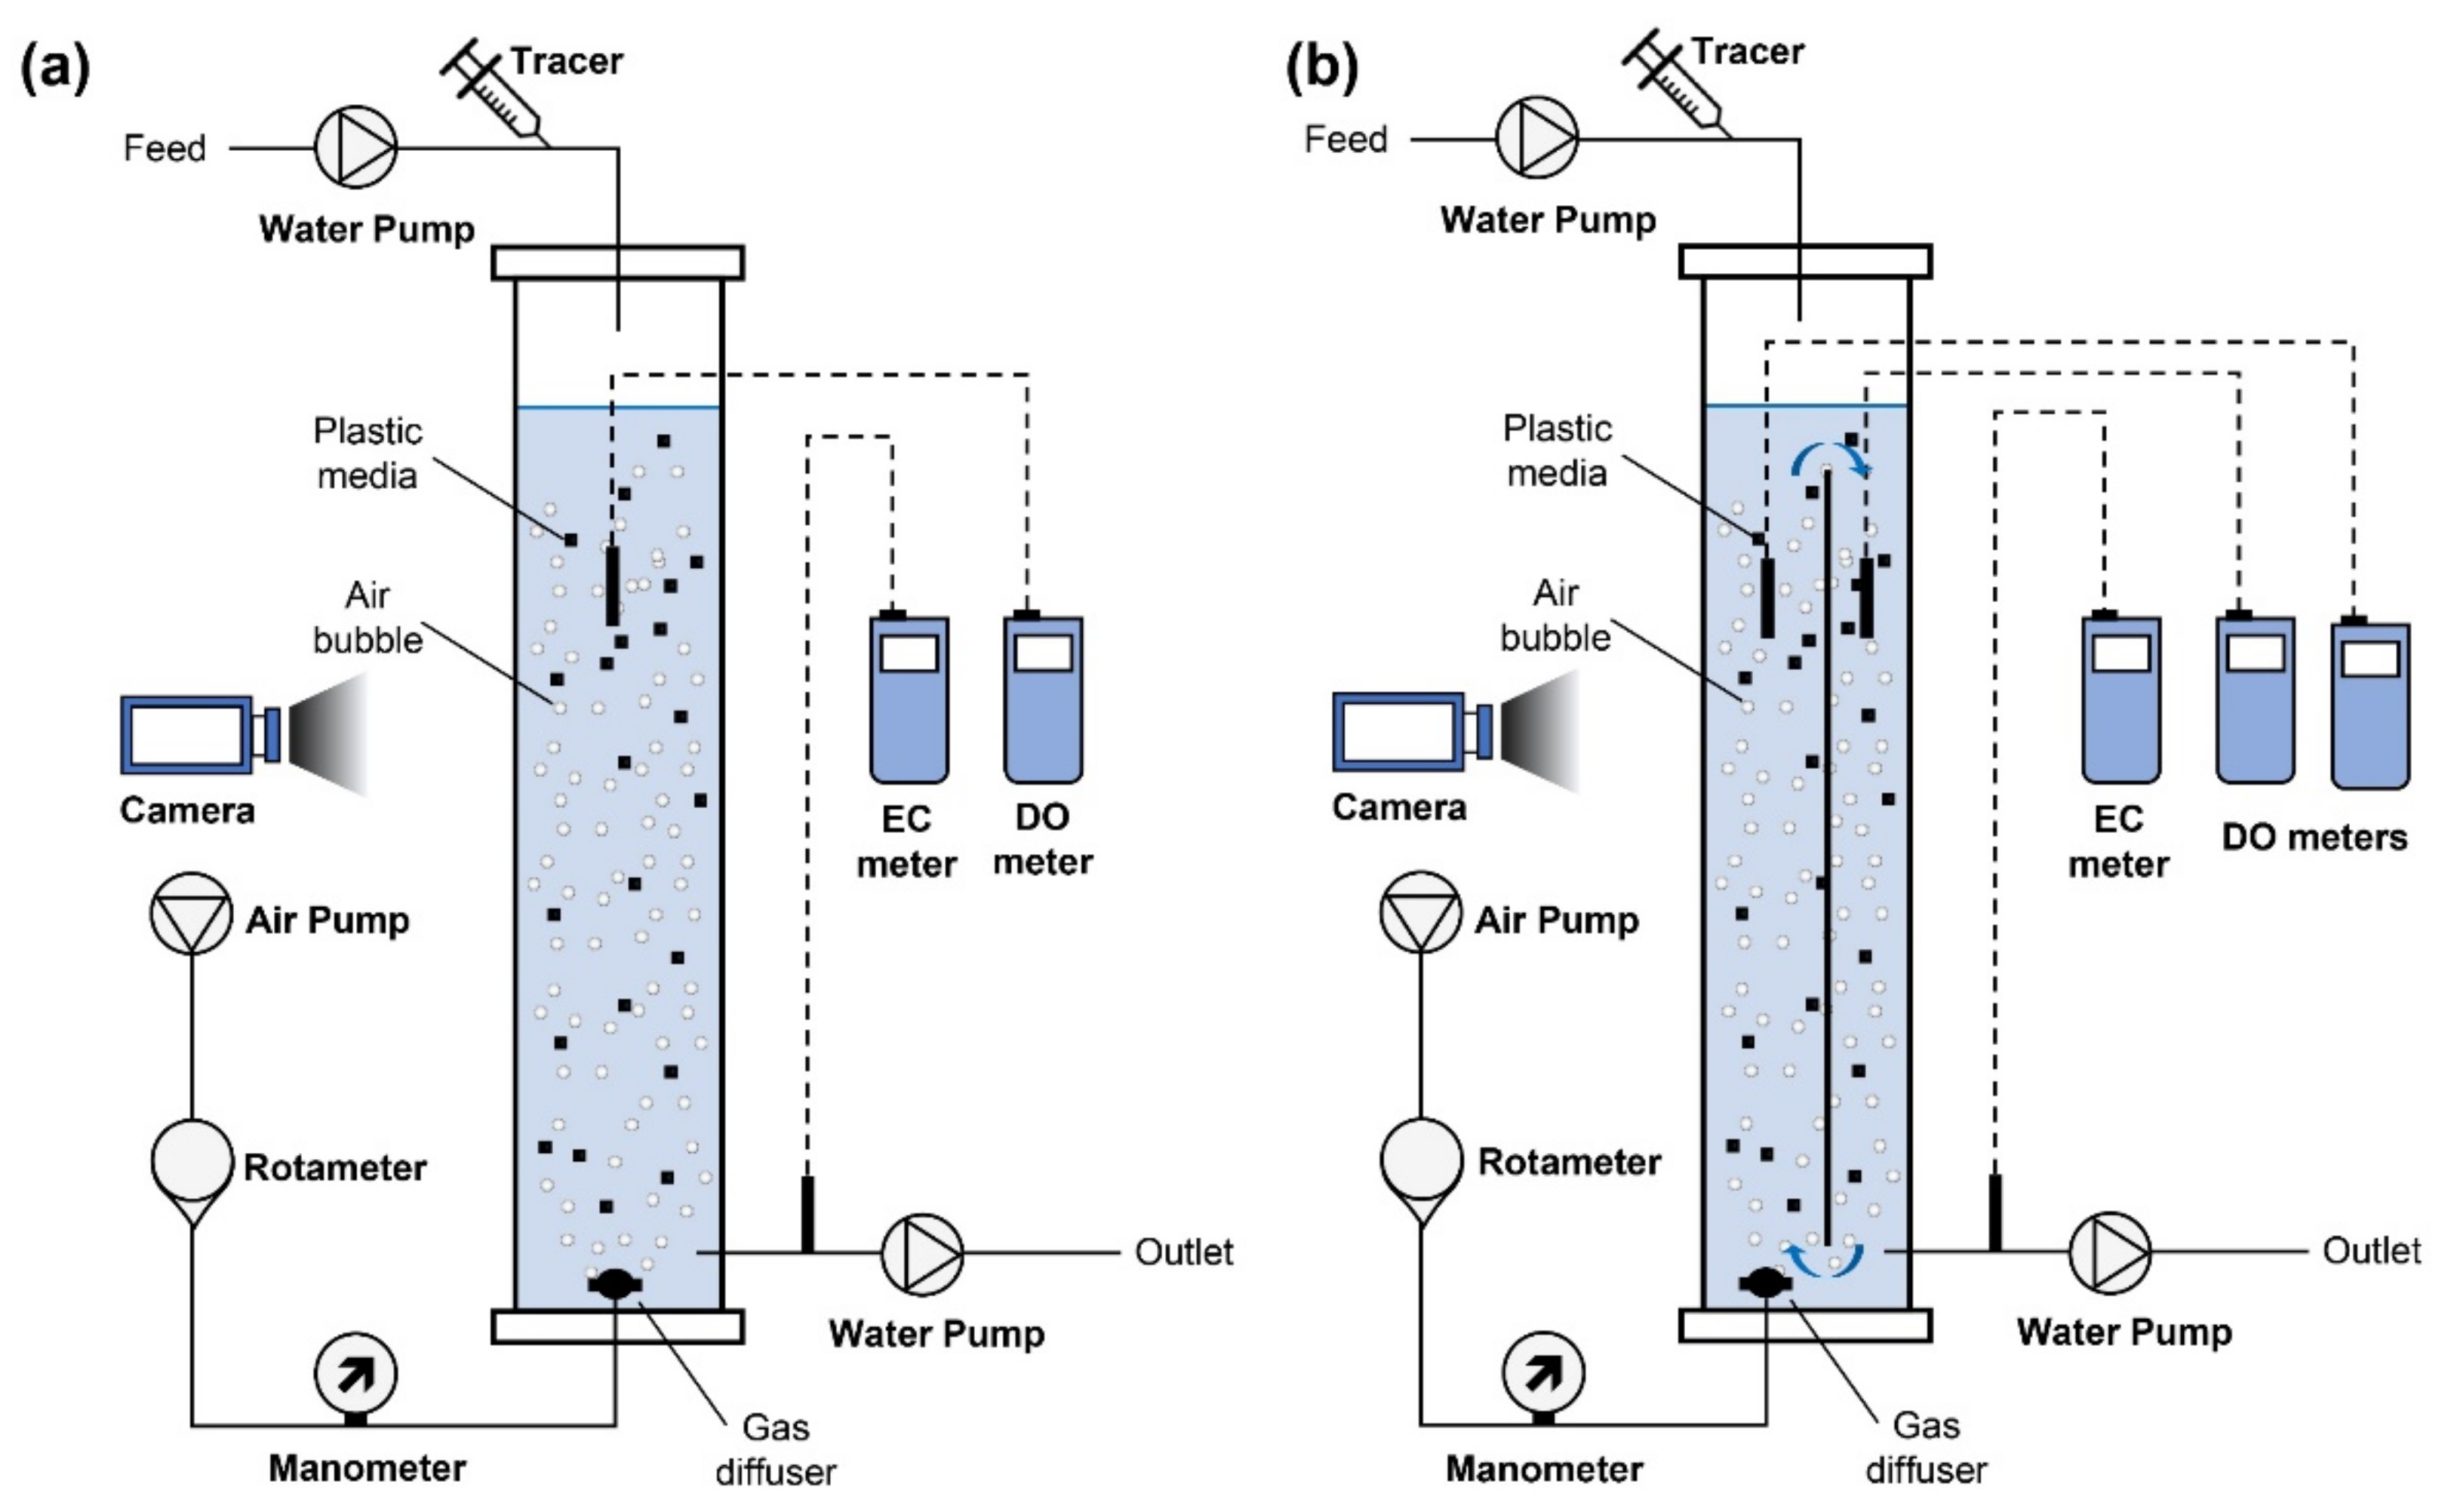
2.1. Experimental Set-Up
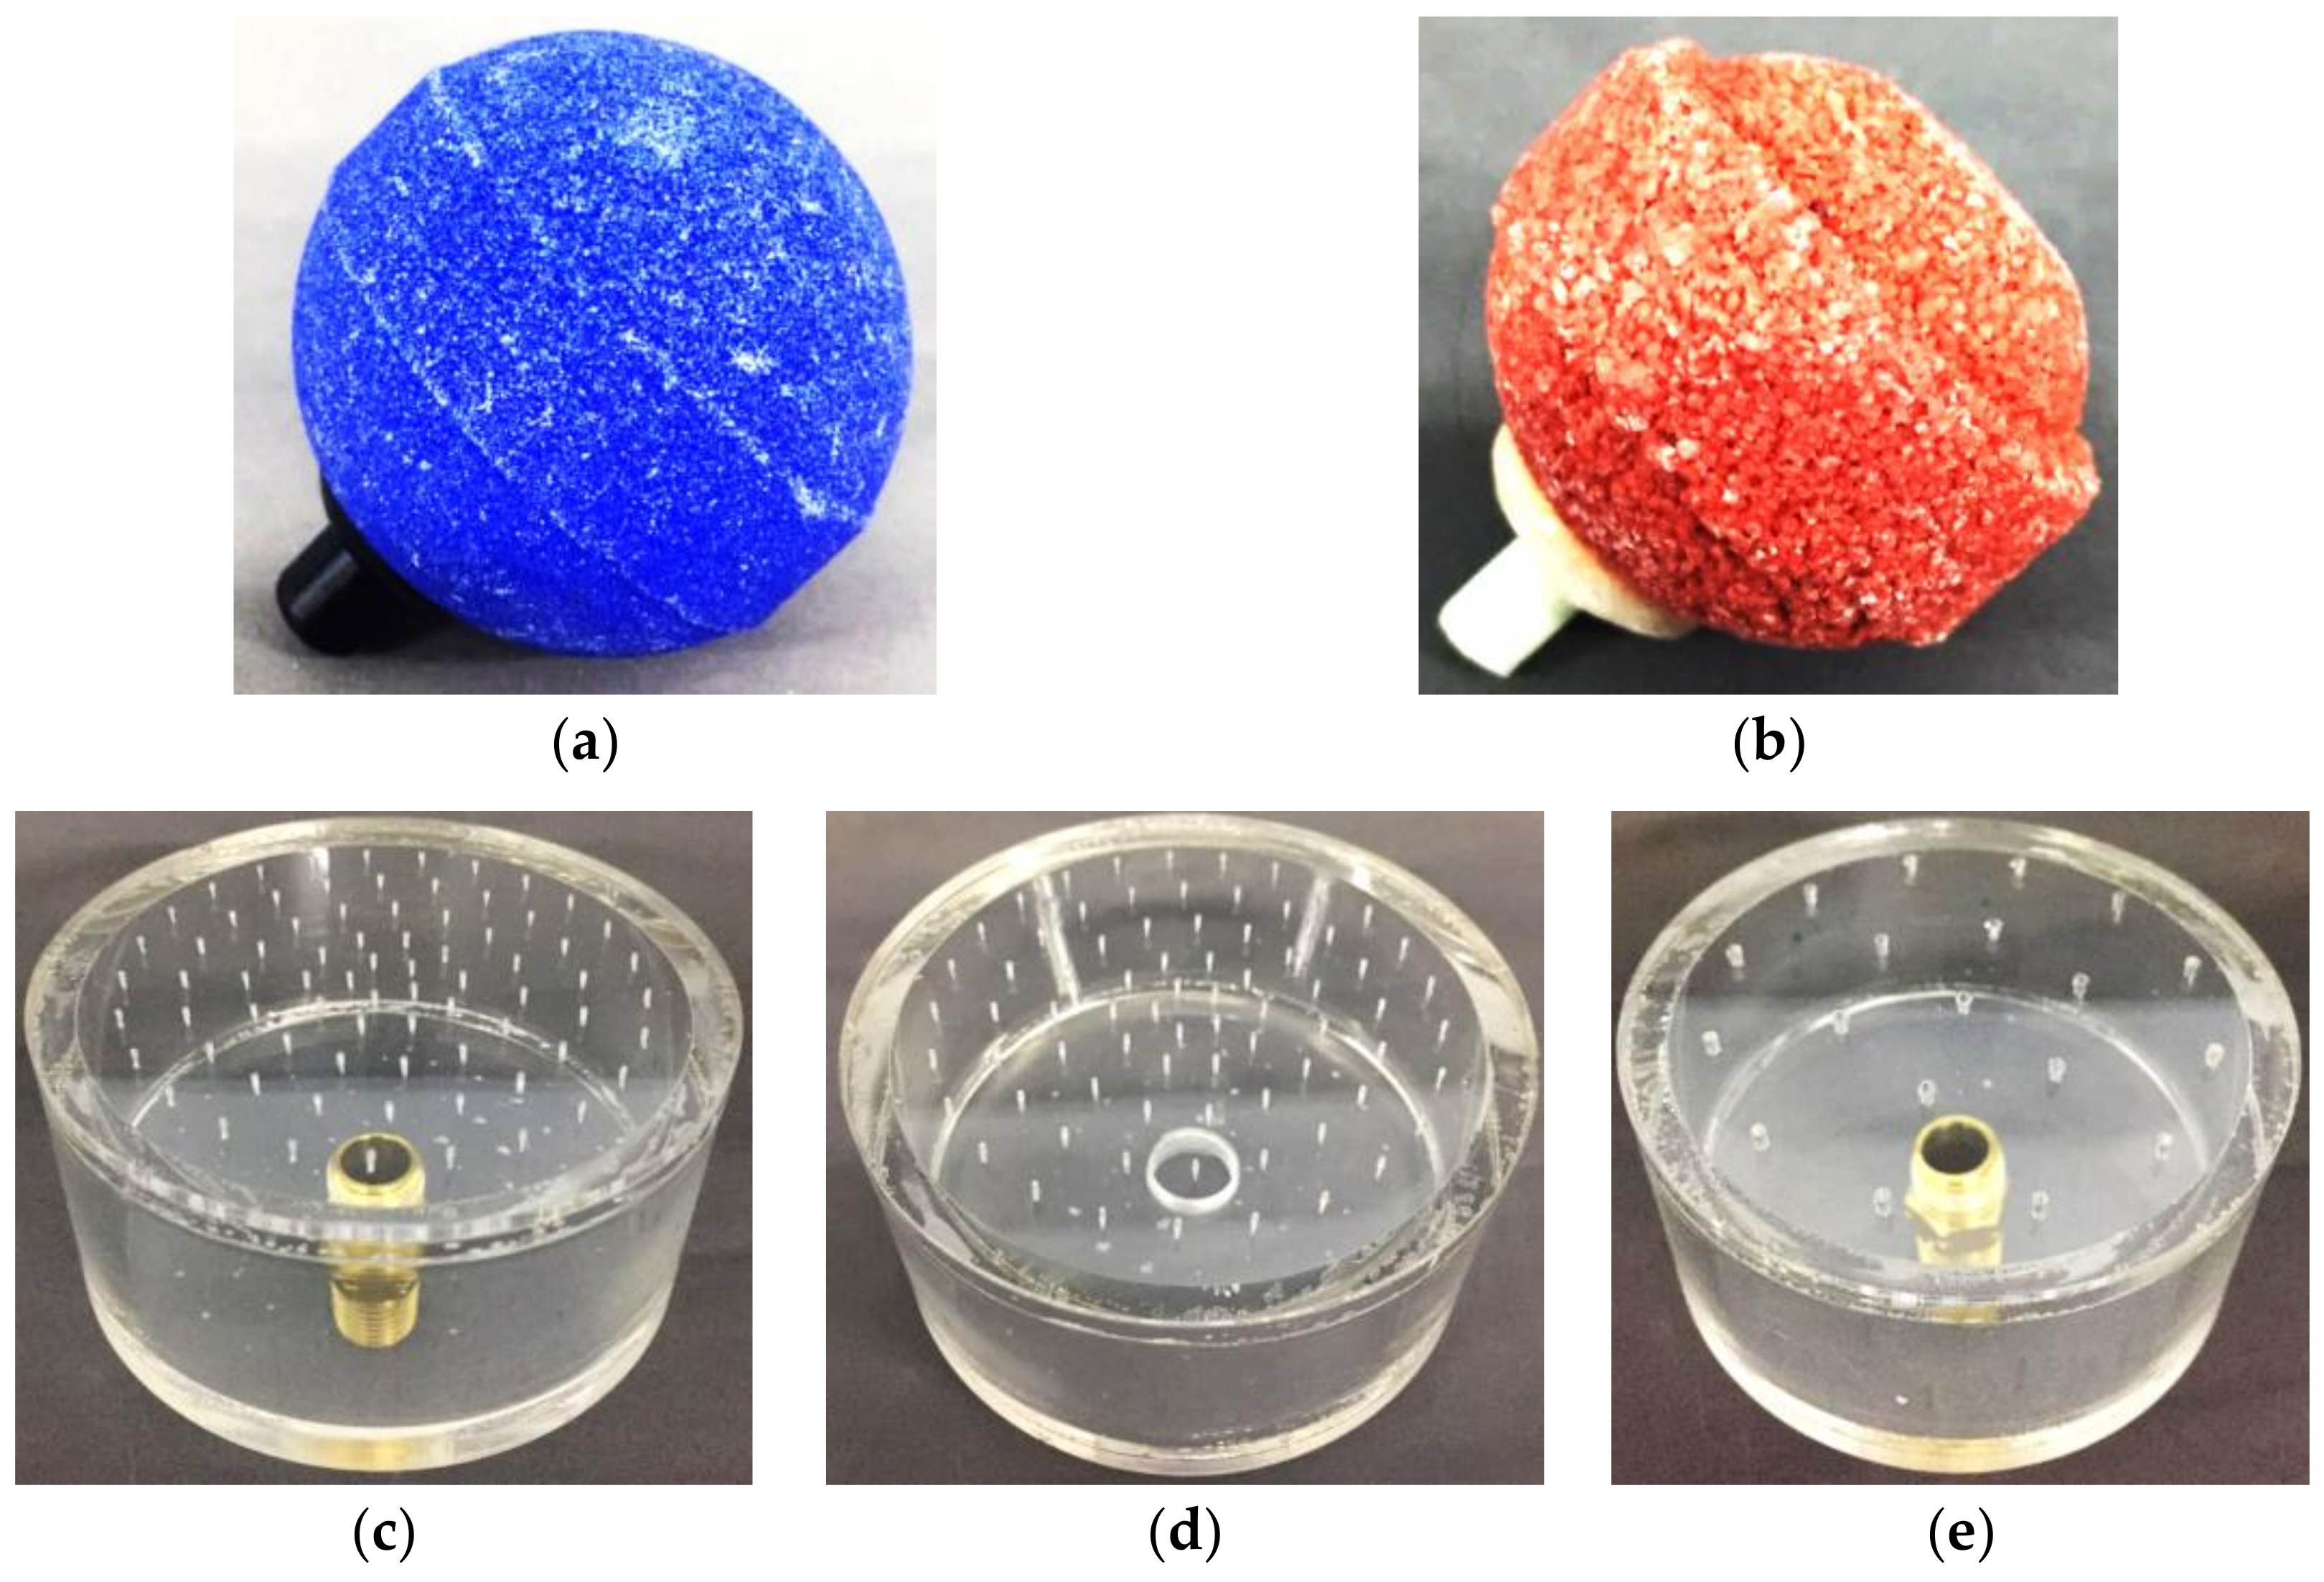
Two gas–liquid reactors, i.e., BCR and ALR, were constructed with clear acrylic material for examining the oxygen mass transfer performances, fluid flow behaviors, and bubble hydrodynamics. A cylinder column with 0.2 m in diameter and 1 m in height, designed to carry 22 L of liquid, was used BCR as illustrated in Figure 1a. The same column reactor was internally modified by a vertical split baffle with recirculation area and gas separator for ALR (see Figure 1b). The ratio of downcomer-to-riser cross-sectional area (Ad/Ar) was approximately 0.41. Both reactors were designed in similar geometry and the same liquid volume for comparative benefit. Air was injected at the column bottom using an air pump (model Resun LP-100). Its flow was then regulated by a valve and rotameter (model DWYER®) before passing through a gas diffuser. The manometer was also connected for measuring the power consumption through pressure drop of different gas diffusers, as shown in Figure 1. All experiments were conducted at room temperature, 25 ± 2 °C.

2.2. Gas Diffusers

A gas diffuser or sparger is an air bubble distribution device used to introduce gas into liquid through single or multiple holes by creating dispersed bubbles. In this study, five different diffusers were selected and designed to examine their influences on oxygen mass transfer performance as well as gas–liquid hydrodynamics in both BCR and ALR. All investigated diffusers are varied by their material, configuration, number of holes, holes size, and pitch area, as detail in their geometric properties in Table 1.
Two commercial sphere shapes diffusers with 6.4 cm in diameter fabricated from natural fine and coarse sand were used and called F-sand (see Figure 2a) and C-sand (see Figure 2b), respectively. Three other diffusers were designed and constructed by cylinder acrylic material and punched multiple orifices at the top plate with 0.3 cm in thickness and 6 cm in diameter, as showed in Figure 2. For a comparative purpose, all investigated diffusers are presented in the same active surface, 39 cm2. The same number of orifices with different pith areas was arranged to investigate the effect of the total orifice surface. The same pitch area with a different number of orifices was used to evaluate the influent of the number of orifices. All five different diffusers are arranged for having different orifice diameters such as F-sand and C-sand orderly have a nominal pore size of fine and coarse orifice size approximately range 0.08–0.15 mm and 0.20–0.25 mm [13], respectively. Orifice diameters of H-0.3, H-0.6, and H-1.2 diffusers are 0.3, 0.6, and 1.2 mm, respectively.

2.3. Solid Media

The solid plastic media with ring shape was used in this study as previously found to be the most significant for improving KLa value in BCR and ALR [4,9]. It was applied after the best gas diffuser was obtained in order to validate the oxygen mass transfer performance under the optimum condition of solid media addition and gas diffuser. Polypropylene solid particle with a density of 946 kg/m3 was employed. The benefits of these particles are low density and do not accumulate at the reactor bottom. Consequently, unnecessary bubble coalescence can be avoided.

2.4. Bubble Hydrodynamics Analysis

2.4.1. Bubble Size and Rising Velocity

The bubble hydrodynamic parameters including bubble diameter (DB) and terminal rising velocity (UB) were measured by using slow-motion photography techniques integrated with image processing, as detailed in our previous publication [9]. Slow-motion videos were firstly captured bubble rising with 240 frames per second in 1080p HD. It was then cropped before starting to improve image quality and diameter measurement by using ImageJ computer software. It should be noted that the analysis was conducted in both BCR and ALR with the change of superficial gas velocity (Vg) between 0.12 and 1.00 cm/s.
Bubble diameter (DB) was calculated from 100 bubbles in the reactor which were randomly measured from captured images at the middle of the water height. Number of sample size was statistically designed as suggested by various research works [6,14]. Assuming the bubble is an oblate ellipse, equivalent diameter (DB) was determined using major axis (E) and minor axis (e), as shown in Equation (1) [15,16]. Then, Sauter’s mean bubble diameter (D32) was calculated using Equation (2) [17].
D B = E B 2   e B 3
D 32 = i = 1 N D Bi 3 i = 1 N D Bi 2
U B = Δ D t frame
Bubble rising velocity (UB) was determined from the movement of bubbles in the reactor by using frame stepping the slow-motion video forwards and backward with Equation (3), where ΔD is the bubble movement distance between two frames and tframe is the time between those frames [18].

2.4.2. Specific Interfacial Area (a) and Gas Hold-Up

Specific interfacial area (a) was calculated through the ratio of total air bubble surface and total reactor volume [10]. Hence, the interfacial area determination formula is expressed in Equation (4),
a = f B   ×   H L U B   ×   π   D B 2 V L + N B V B ,
where fB is the bubble formation frequency, HL is the liquid height, VL is liquid volume, NB is the number of bubbles, and VB is a single bubble volume [18,19,20].
The gas hold-up is the gas fraction present in gas–liquid or gas–liquid–solid systems when solids are used. It was calculated from the gas volume (Vg), liquid volume (VL), and solid volume (Vs) [21], as expressed in Equation (5). The value of gas hold-up could be directly measured experimentally and calculated by comparing the height of liquid surface levels before (HL) and after supplying gas flow (HTotal) as defined in Equation (6).
ε g = V g V L + V g + V s
ε g = H Total   H L H Total

2.5. Mass Transfer Coefficient (KLa) and Power Consumption Estimation

The KLa coefficient is the key parameter for evaluating the performance of the gas–liquid contactor. The dynamic concept was examined through the measurement of dissolved oxygen (DO) concentration along the aeration time [22]. The experiments were started from the deoxygenated system by reducing an initial DO level in water using a chemical reaction of dissolved sodium sulfite (Na2SO3). After DO concentration reached a certain level, the reoxygenation process was started by dissolving oxygen from the air into the liquid phase. The KLa coefficient was then calculated from the DO concentration between ≤10% and ≥80% of the saturated level [23]. DO meter model DO5512SD (accuracy ± 0.4 mg/L at temperature 23 ± 5 °C) was used to measure the variation of DO concentration in water. Under ideal-mixing, the KLa coefficient was determined by Equation (7) [9].
dC dt = K L a ( C   *   C )
Power consumption used to operate the air compressor was determined using air flow rate (Qg) and total pressure drop (ΔPTotal) of static liquid height and air spargers, as expressed in Equation (8) [24].
P = Q g   Δ P Total

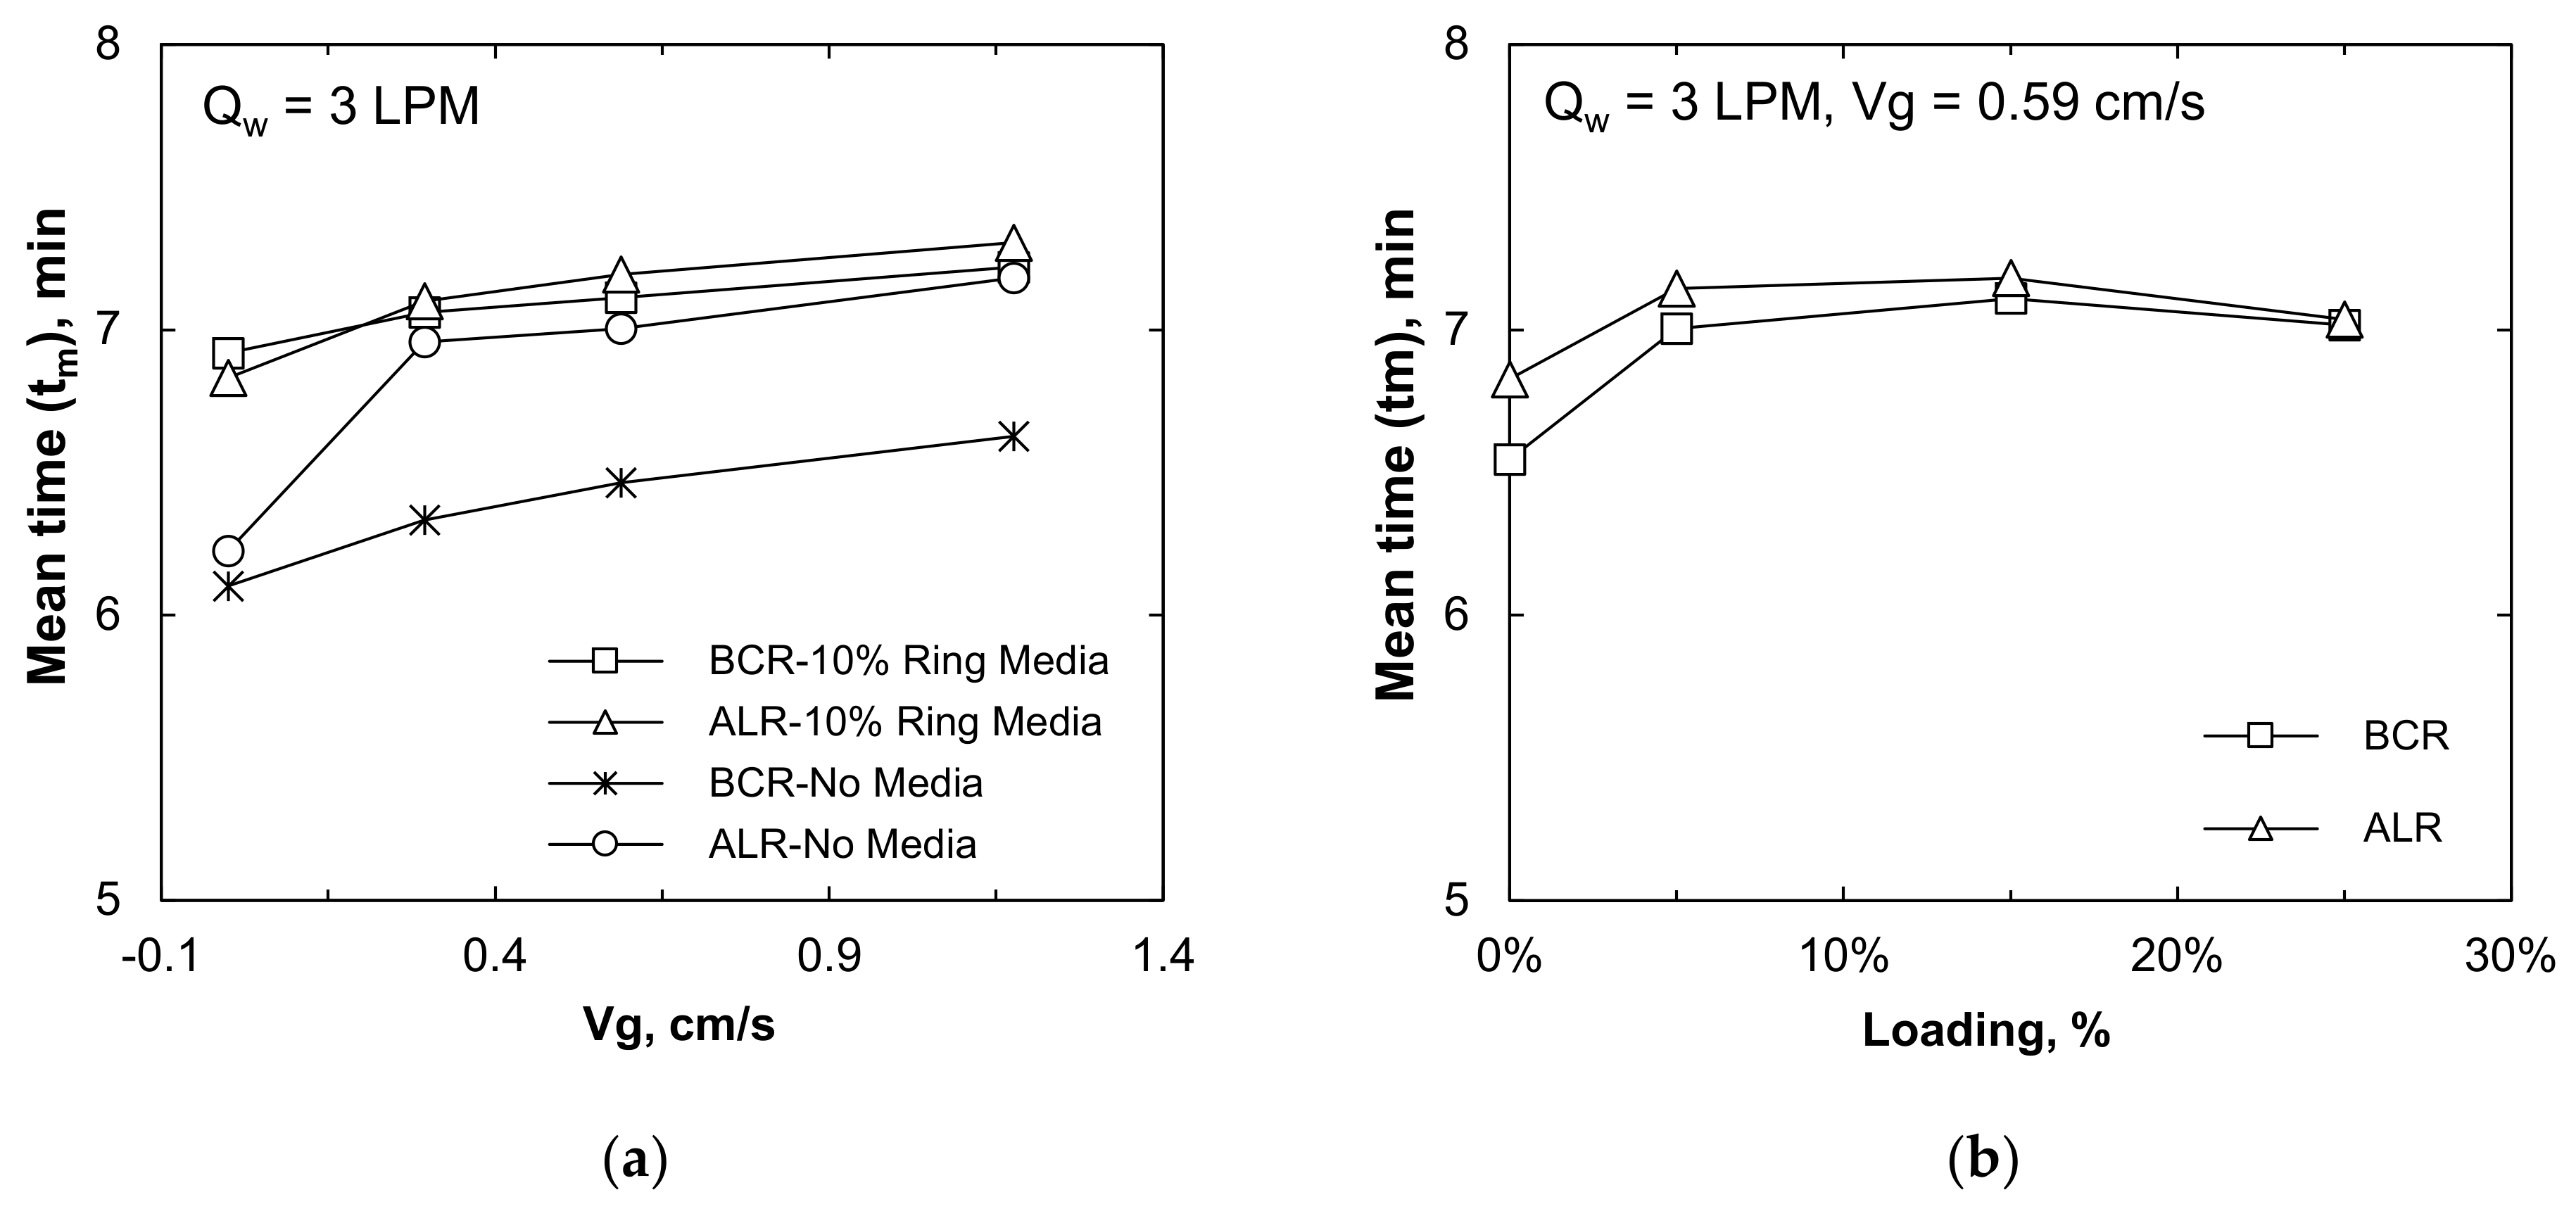
2.6. Residence Time Distribution (RTD) Technique

As discussed by Bun et al. (2019) [10], the performance of the multiphase contactor is not only related to the gas-phase dynamic, but the liquid phase also has a significant effect through mixing behavior. Hence, the experiments were conducted to understand the liquid flow pattern. RTD of liquid was analyzed by injecting a pulse of liquid tracer, sodium chloride, at the gas–liquid inlet and recorded conductivity at the outlet (see Figure 1). The conductivi-ty probe was connected to a conductivity meter (model LUTRON CD-4317SD with accuracy ± 2% and resolution 0.1 μS at temperature 23 °C ± 5 °C). The mean residence time (tm) of liquid was calculated based on the concentration of tracer as shown in Equation (9), where Ci is the tracer concentration at the time i. The mean residence time will be compared with the theoretical residence time, ttheory, calculated using Equation (10) in order to analyze the dead liquid portion inside each column where Qw is the liquid flow rate [25]. The variance of the tm was computed using Equation (11) for further analysis.
t m =   t i   C i   Δ t i     C i   Δ t i
t theory =   V w     Q w  
σ 2       t i   t m 2   C i   Δ t i   C i   Δ t i =   t i 2   C i   Δ t i   C i   Δ t i   t m 2
In addition, the liquid age distribution (E(t)) was calculated from the concentration of the tracer profile as shown in Equation (12). It was plotted as a function of time to analyze the liquid flow pattern using the compartment model [26].
E t = C t 0 C t   dt
The tank-in-series model is also used to analyze the mixing performance of the column. The number of tank-in-series (NTank) was calculated using Equation (13). When the NTank is unity, it indicates the perfect mixing flow regime in the column. The higher of NTank implies more of the plug flow regime inside the system [26].
N Tank =   t m 2 σ 2

3. Results and Discussion

As mentioned earlier, the present study was mainly divided into three aspect analyses. Analysis of gas-dynamic characteristics under different types of diffusers in BCR and ALR was firstly investigated, followed by mass transfer performance determination. After optimum gas diffuser was defined, its local gas–liquid hydrodynamics, i.e., oxygen mass transfer, gas hold-up, and liquid flow pattern, were evaluated with the optimum condition of solid media addition previously found.

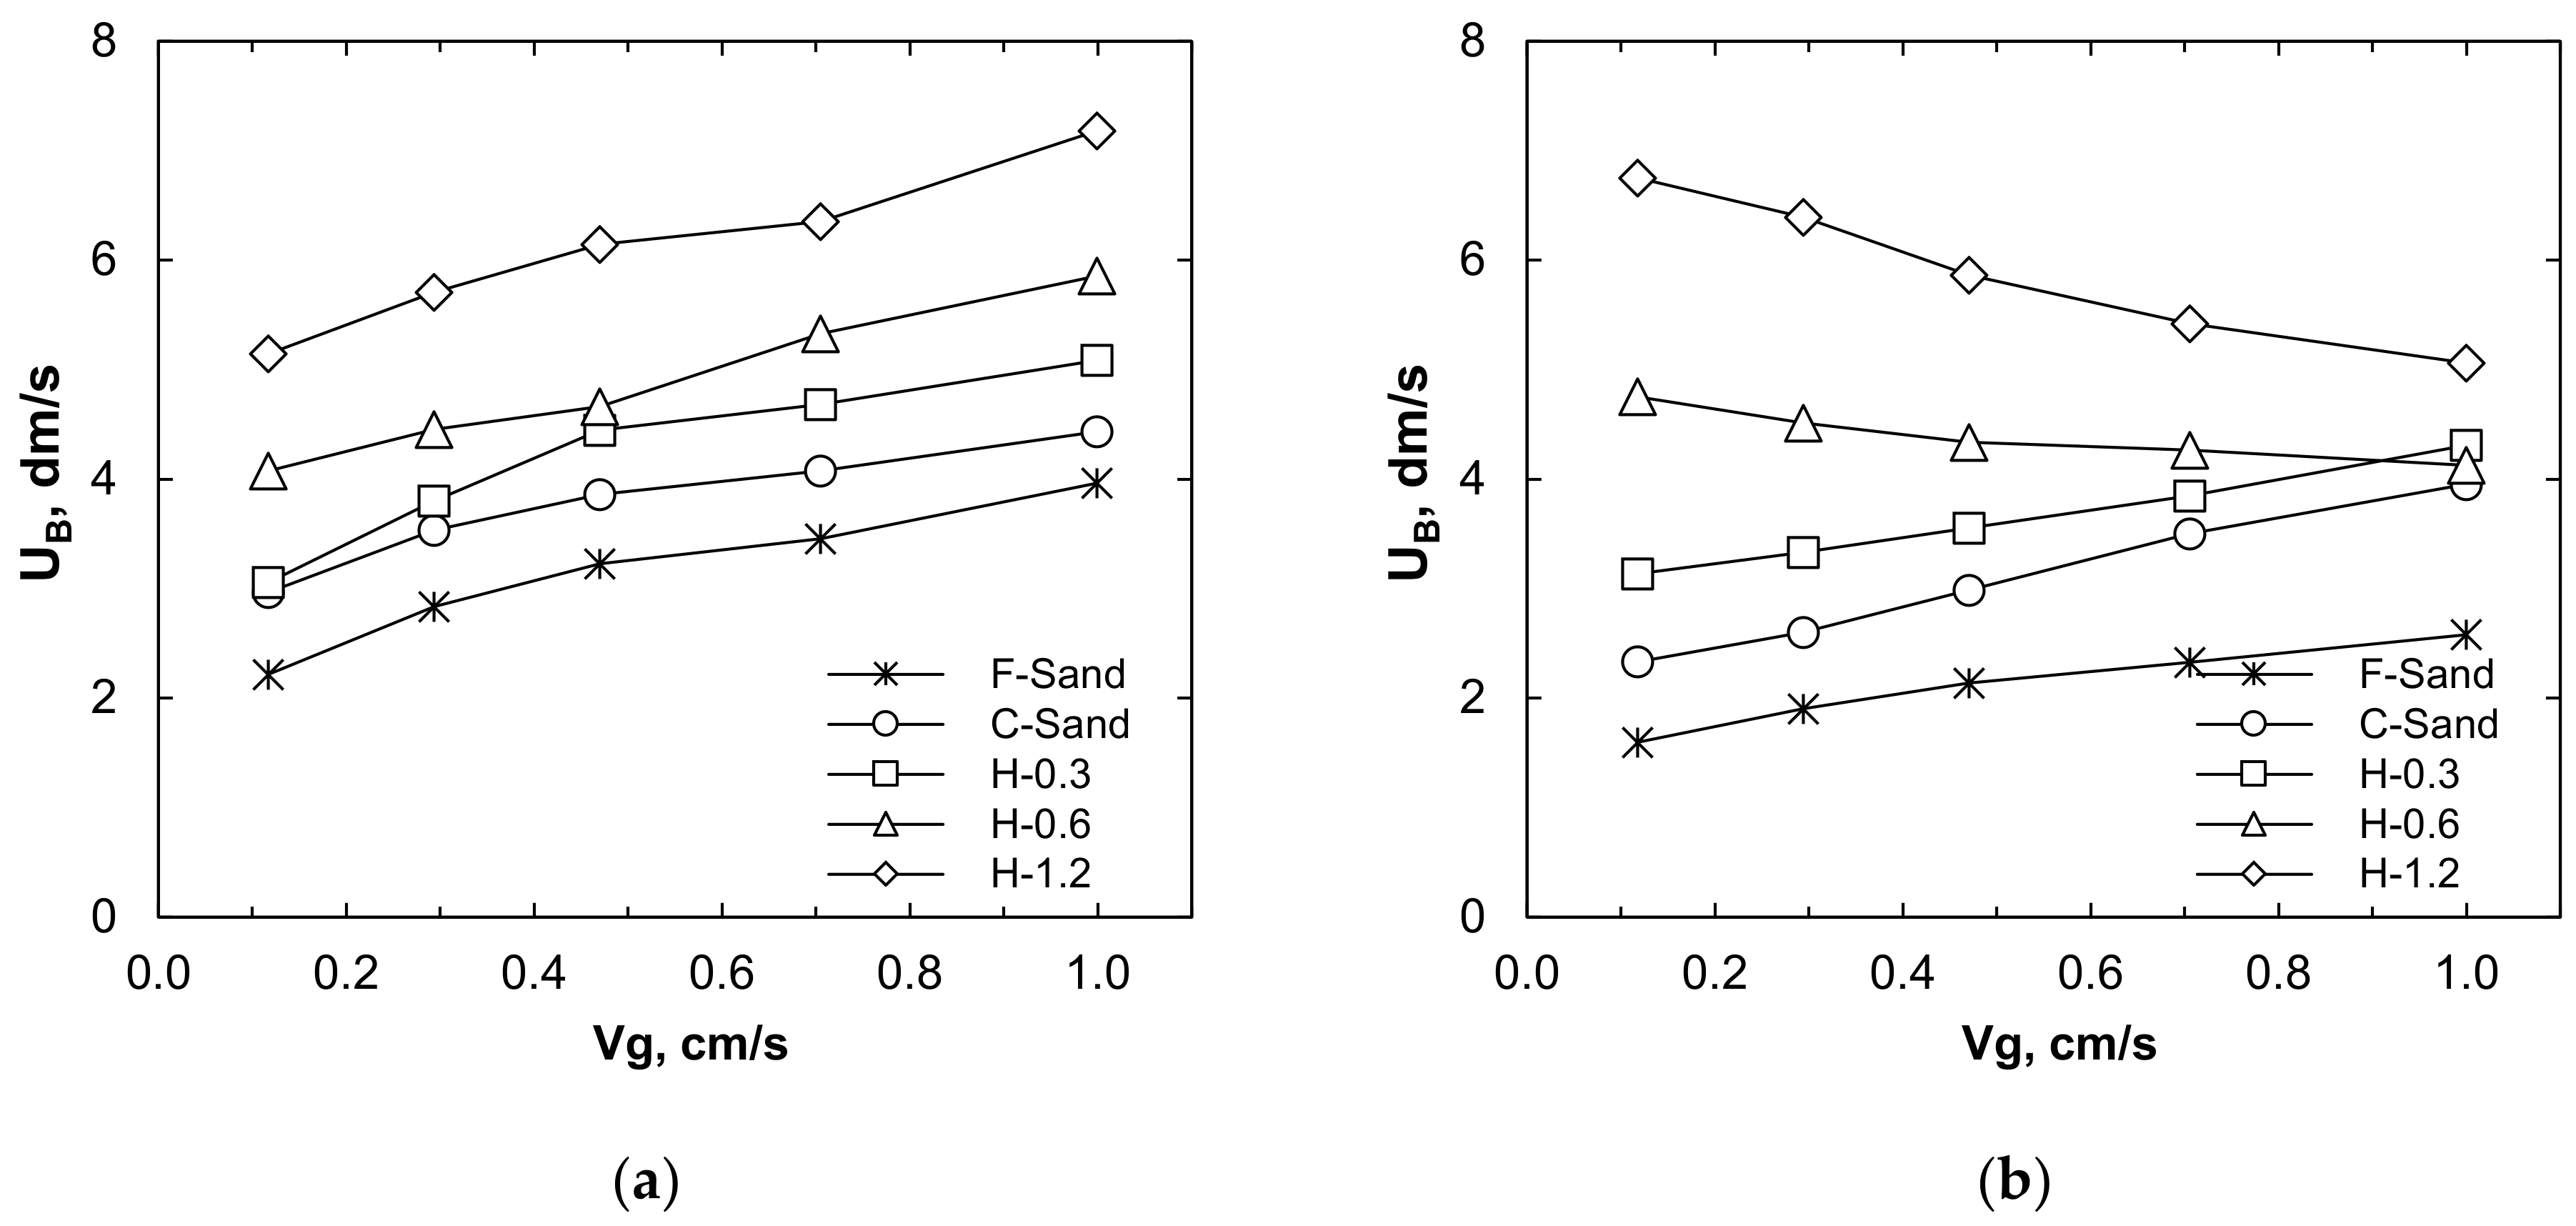
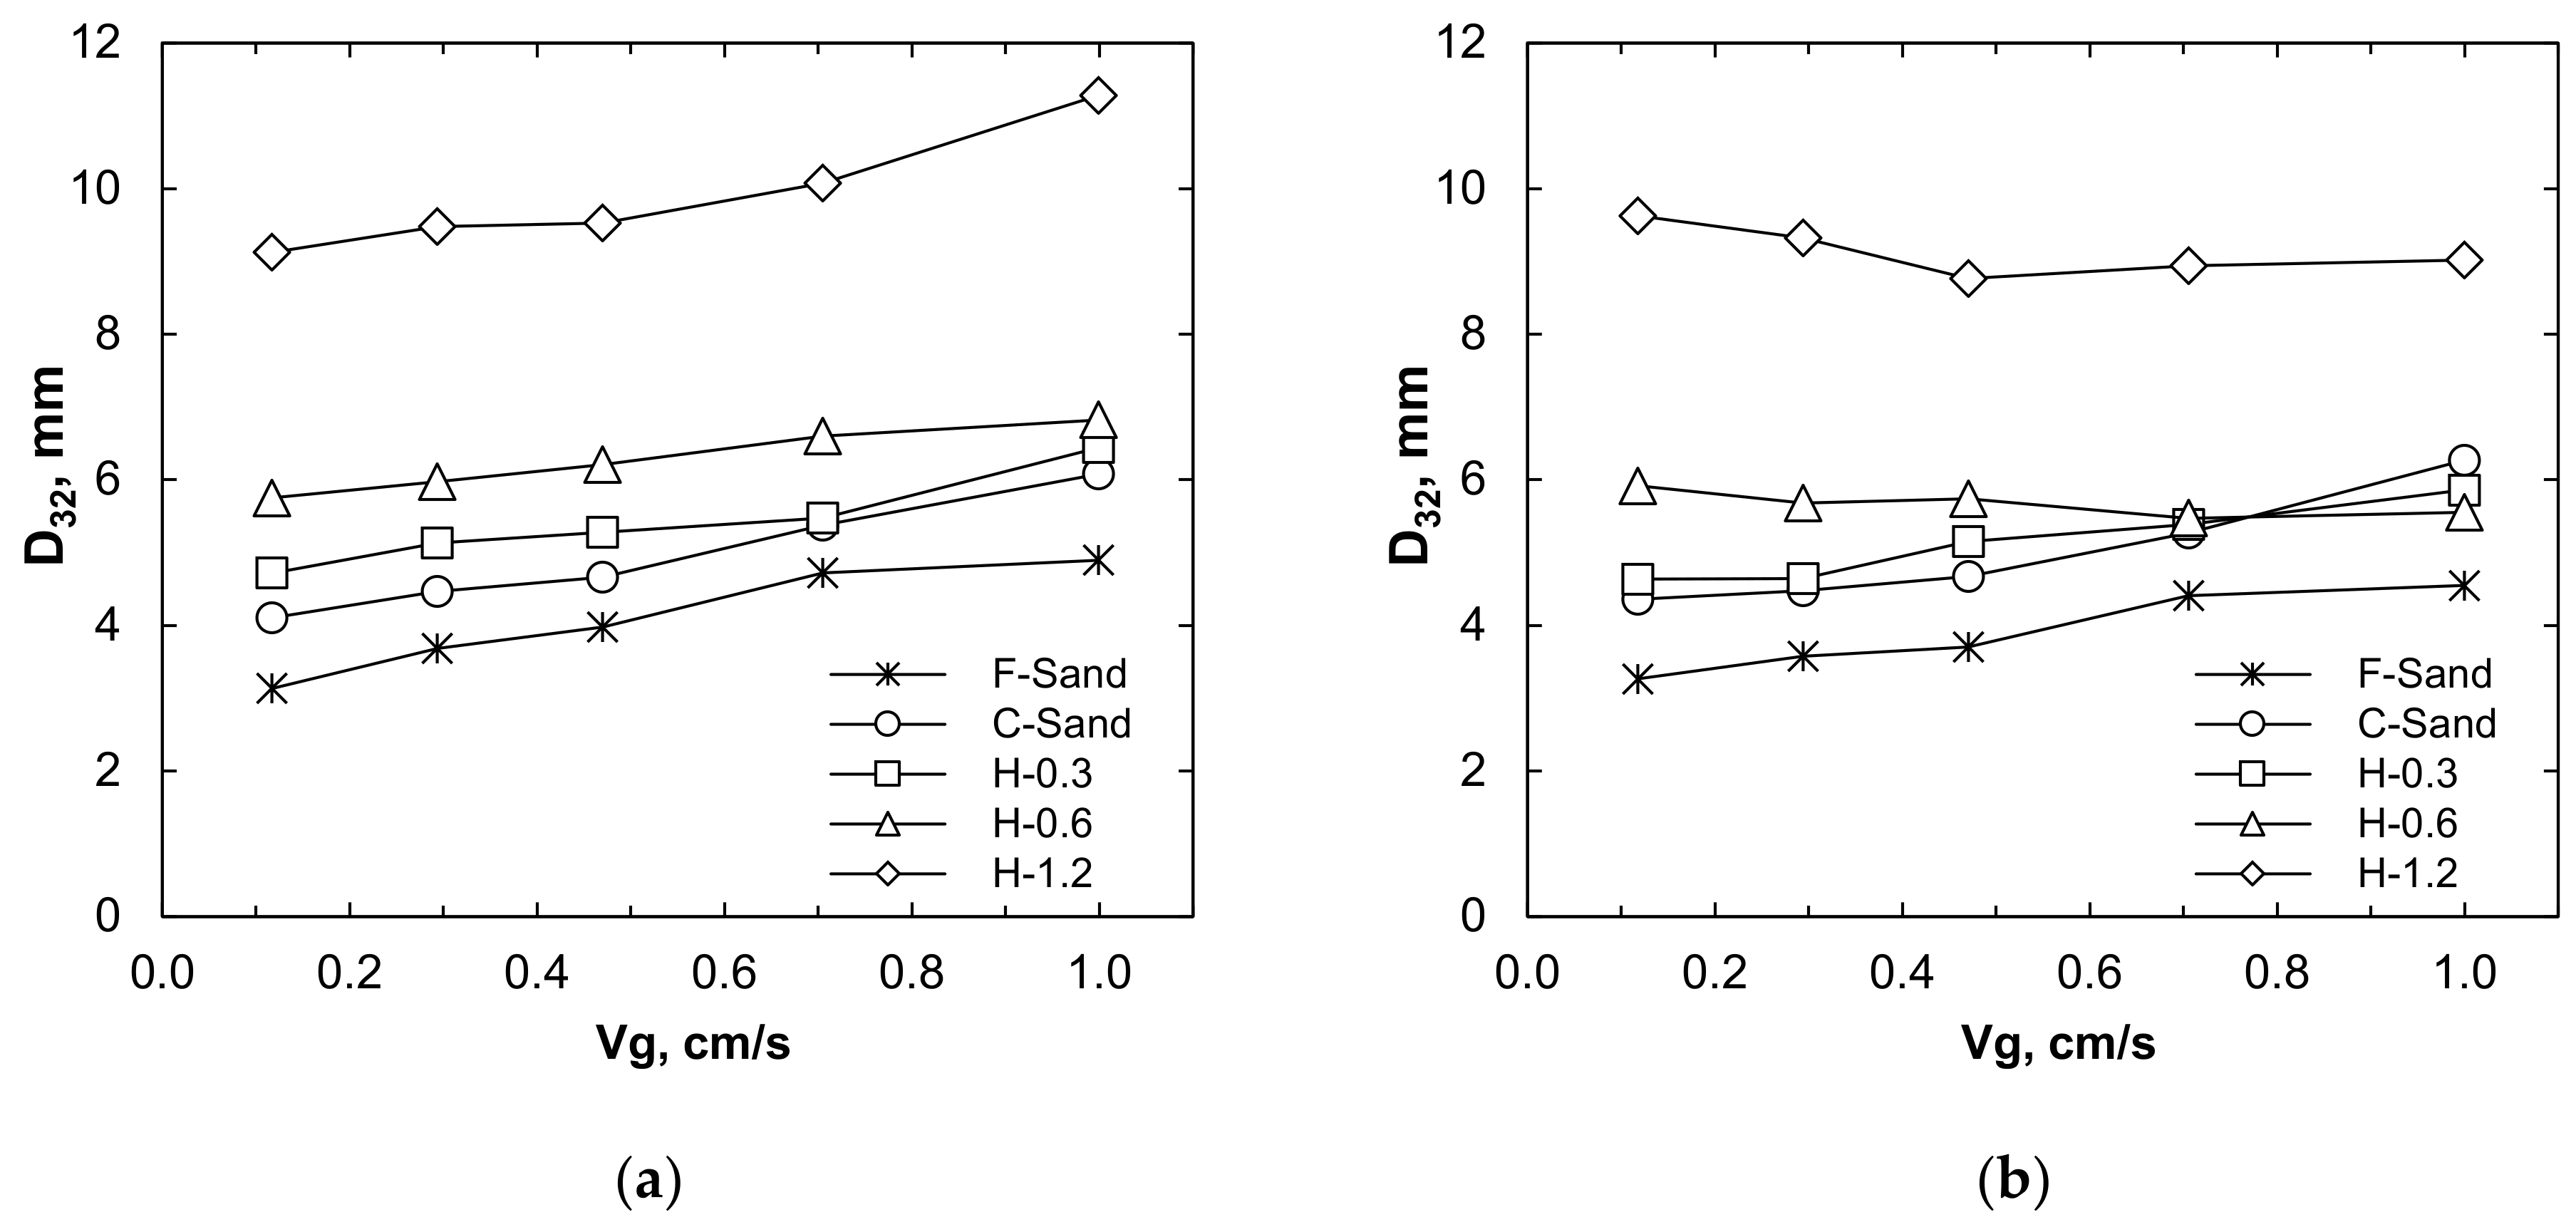
3.1. Bubble Diameter (D32) and Rising Velocity (UB)

Figure 3 illustrated the bubble size as Sauter’s mean value at different investigated diffusers and gas velocity (Vg) in both BCR and ALR. In BCR, it can be observed that the air bubbles distribute between 3.14 and 11.28 mm, while larger bubbles were obtained in the higher gas flow, regardless of diffuser classes due to the bubble coalesce and high-pressure promotion at a higher flow (see Figure 3a) [24,27]. In general observation, smaller bubbles were observed from the use of a smaller orifice size diffuser (see Table 1) through the bubble formation phenomena. Bubble size distributions of using H-1.2 diffuser (largest orifice diameter) clearly showed the largest diameter, 9.13–11.28 mm, compared to other diffusers. It is due to the size of bubbles generated by those air diffusers. H-1.2 diffuse has the largest orifice size, while F-sand has the smallest one, which resulted in the smallest bubble size, 3.14–4.90 mm, as discussed by previous studies [4,27].
Similar trends were noted in ALR for small orifice diffusers, F-sand, C-sand, and H-0.3, higher Vg resulted in larger bubbles, 3.27–6.27 mm (see Figure 3b). However, this confirmation cannot govern while using larger orifice diffusers, H-0.6 and H-1.2. Installing H-0.6, D32 values dropped from 5.92 to 5.55 mm, while from 9.63 to 9.02 mm was observed in H-1.2 diffuser usage, with the gas flow increased from 0.12 to 9.02 cm/s, respectively. These contrasts were possibly due to the flow regime in ALR operation compared to BCR through recirculation flow and bubble hydrodynamics produced by larger orifice diffusers. Based on the result, it can be observed that using diffusers with larger orifice diameters produces large air bubbles as previously mentioned. However, the bubble break-up rates in ALR may increase at higher Vg (>0.12 cm/s) compared to BCR, as discussed by Kalaga et al. (2017) [28] since the cross-sectional area in ALR was decreased and there is a flow recirculation between riser and downcomer compartments in ALR. It was observed that using ALR with larger orifice diffusers and higher gas flow, the small bubbles were circulated from downcomer to riser compartments, caused smaller bubbles measurement as well as a decrease in D32 value, as shown in a captured photo in Figure 4.
In bubble hydrodynamics analysis, the terminal rising velocity (UB) of bubbles is another important parameter for investigating the internal movement of air in the reactor. The UB value was measured by the displacement of bubbles at a certain distance using captured video. The result of UB at different diffuser classes in both reactors was illustrated in Figure 5 with the variation of Vg between 0.12 and 1.00 cm/s, ranges from 2.22 to 7.18 dm/s. It was noted that the pattern UB of each diffuser usage in BCR is the same as the D32 value, the H-1.2 diffuser resulted in fasted rising velocity, followed by H-0.6, H-0.3, C-sand, and F-sand, orderly (see Figure 5a). The patterns of these UB results can interpret through bubble size in each operation condition. Smaller bubbles (3.14–4.90 mm) regulated by the F-sand diffuser led to having a lower UB value than larger bubbles of using other diffusers. Larger bubbles, basically from larger orifice diffusers, have higher UB as explained through the relationship between gas–liquid contact time and oxygen transfer efficiency [11,29].
In ALR, the values of UB distributes between 1.6 and 6.75 dm/s. It increases with Vg for all investigated diffusers, except for the two largest orifice diffusers, H-0.6 and H-1.2. Higher gas flow resulted in faster-rising velocity was remarked from 1.6 to 4.31 dm/s of the studied Vg using F-sand, C-sand, and H-0.3 diffusers. The rising velocity of these three diffusers is lower than those of BCR, approximately 0.47–1.39 dm/s, which is not proportional to the change of bubble diameters. It means that the rising velocity of the bubbles in these rectors is not totally related to bubble size, especially in ALR. Sastaravet et al. (2014) [9] indicated that the bubbles in BCR were basically associated with the balance of surface tension and buoyancy force; however, it may not govern in ALR. Bun et al. (2019) [10] discussed that it can be influenced by the geometric effect. Hence, another factor besides bubble size distribution, the gas–liquid mixing behaviors in ALR may cause the back-mixing resulted from higher superficial gas velocity in the riser compartment and circulated flow from the downcomer to the riser. As can be seen in Figure 4, air bubbles in ALR show a full scatter distribution in the riser compartment, which may lead to the extension of bubble streamflow as well as bubble terminal rising velocity. For the application of H-06 and H-1.2 diffusers, recently mentioned phenomena together with the bubble size effect, which are the main reasons allowing to enlarge Vg resulted in lower UB, proportionally.

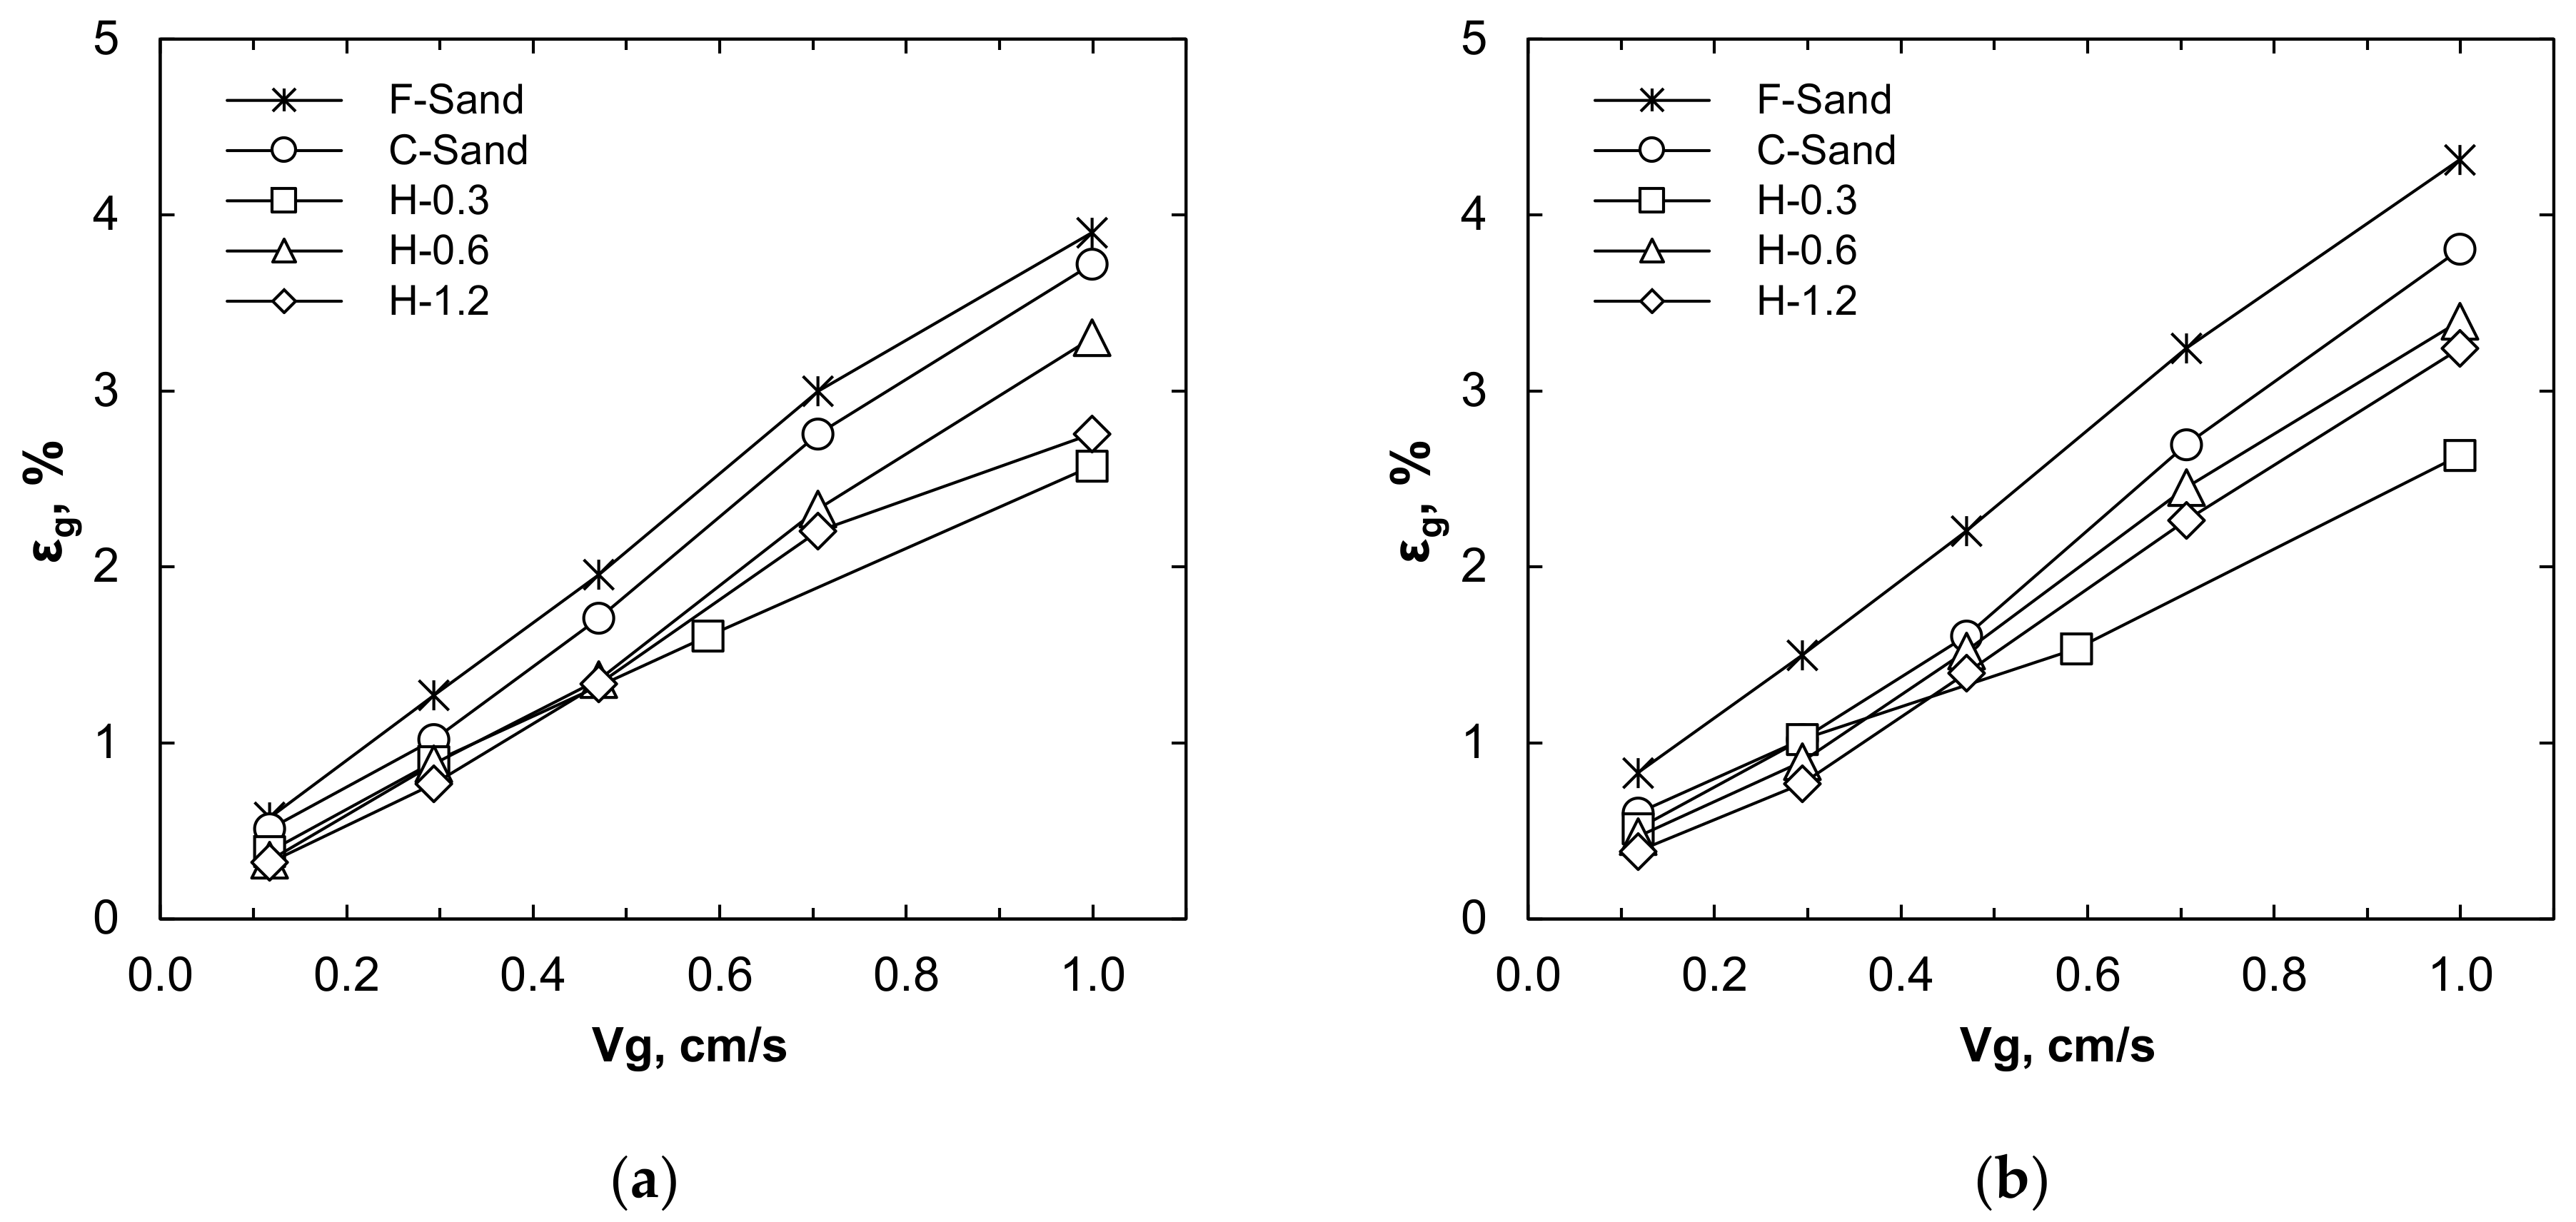
3.2. Specific Interfacial Area (a) and Gas Hold-Up (εg)

Based on the result of bubble size distribution (Figure 3) and rising velocity (Figure 5), a local and commercial diffuser, F-sand, showed the lowest value, followed by C-sand diffuser, compared to the other three diffusers, which may possibly provide a highest bubble interfacial area (a) value as well as gas hold-up (εg) [9]. Hence, it was analyzed in this section in order to understand the characteristics of bubble hydrodynamics. The results of both reactors were illustrated in Figure 6, which is the ratio between bubble surface of air and total volume of both gas and liquid. The interfacial area increases with gas flow, nonetheless of diffuser types [30], range from 1.70 to 33.31 m−1 and 1.15 to 55.75 m−1 in BCR and ALR, respectively. In both reactors, it can be observed that the F-sand diffuser provides the highest value, orderly followed by C-sand, H-0.3, H-0.6, and H-1.2. In BCR, F-sand has an interfacial area of about 23.05 ± 12.08 m−1, which is higher than that using C-sand, H-0.3, H-0.6, and H-1.2 about 7.21, 10.25, 13.37, and 17.68 m−1 in average, respectively.
In a similar pattern, F-sand resulted in a clear significance in ALR (37.18 ± 20.88 m−1), which is higher than using C-sand, H-0.3, H-0.6, and H-1.2 about 16.77, 21.21, 23.67, and 30.57 m−1 in average, respectively. It can be remarked that interfacial area in function with Vg mainly follows power-law relationship ranging the slop value between 0.52 and 0.66, as expressed in Equations (14)–(17) [10]. The interfacial area values from the use of C-sand, H-0.3, H-0.6, and H-1.2 diffusers in both reactors have similar patterns and trends, i.e., BCR (1.70–24.71 m−1) and ALR (1.15–29.71 m−1). However, a remarkable difference from the use of F-sand was observed as in ALR as the value higher than BCR about 49–67%. These differences are caused by the ability to maintain the bubble size from coalescence after increasing Vg as well as the recirculation phenomena in ALR that allow the small air bubbles and liquid to circulate between downcomer and riser compartments.
a F-sand-BCR = 34.23Vg0.52          (R2 = 0.995),
a C-sand-BCR = 25.61Vg0.66          (R2 = 0.994),
a F-sand-ALR = 56.99Vg0.57          (R2 = 0.993),
a C-sand-ALR = 31.79Vg0.59          (R2 = 0.967),
Figure 7 showed the measured values of gas hold-up, which is one of the actual parameters of bubble hydrodynamics as detected through the gas fraction of gas over total (gas and liquid) volumes. It means that the gas holp-up variable will express the amount of gas in the system. It can be remarked that F-sand and C-sand still led to the higher gas hold-up among the investigated diffusers in both reactors. In BCR, F-sand and C-sand ranged from 0.58% to 3.90% and 0.51% to 3.72%, respectively, while 0.83–4.32% (F-sand) and 0.60–3.81% (C-sand) were achieved from ALR. These results can be explained due to the smaller and slower rising bubbles in the reactors. It showed that using F-sand and C-sand diffusers provided more tiny bubbles as well as slow rising velocity, resulting in more bubbles stay in the liquid (higher bubble interfacial area and gas hold-up) and increase the exposure time of gas transferring to the liquid phase. These gas diffusers may provide better mass transfer performance, such as oxygen mass transfer coefficient (KLa). Therefore, analysis of oxygen transfer efficiency is required in order to understand the strong relationship between bubble hydrodynamics and mass transfer performance with different air diffusers.

3.3. Mass Transfer Coefficient (KLa)

Different bubble hydrodynamic characteristics were observed under the operation of various investigated gas diffusers. F-sand diffuser followed by C-sand showed a remarkable performance in terms of bubble size, rising velocity, interfacial area, and gas hold-up among all diffusers examined. Therefore, oxygen mass transfer behaviors are analyzed in this section. The result was illustrated in Figure 8 with different air diffusers and ranging Vg of 0.12–1.00 cm/s in both reactors. KLa coefficient value distributes between 4.68 and 63.00 hr−1 in BCR while in ALR ranges from 3.89 to 69.12 hr−1. Better KLa coefficient was achieved at higher Vg [9,31].
In both investigated contactors, F-sand and C-sand diffusers exhibited a superior KLa value compared to the other three types, i.e., H-0.3, H-0.6, and H-1.2. In BCR, F-sand type could provide a KLa coefficient from 13.32 to 63.00 hr−1 at certain Vg, which is about 61–131% and 122–185% better than (H-0.3 and H-0.6) and H-1.2, respectively. C-sand type is the second-highest diffuser, which distributed KLa coefficient between 10.01 and 56.88 hr−1 of the studied Vg range. These results can be explained through the bubble hydrodynamic characteristics provided by each diffuser previously discussed. A greater value of KLa coefficient of F-sand and C-sand is basically due to the smaller air bubbles generated by these diffusers and longer bubble retention time in the liquid through slower rising velocity, as understandable justification of two-film theory [7] and recent investigation of Bun et al. (2019) [10].
In the ALR contactor, F-sand diffuse also gave the highest KLa value, regardless of Vg, range from 14.40 to 69.12 hr−1, followed by C-sand (12.24–58.68 hr−1) at the studied Vg range. F-sand type resulted in a better KLa coefficient approximately 66–135% over H-0.3 and H-0.6 diffusers and 146–270% compared to H-1.2. Between the BCR and ALR reactors, the KLa values from the use of H-0.3, H-0.6, and H-1.2 are comparable. However, the significantly greater performance of ALR in terms of the KLa coefficient was remarked using F-sand. F-sand in ALR could maintain a smaller bubble size up to 8% and increase the bubble retention time in the reactor through decreasing rising velocity up to 54% compared to BCR operation, consequently, it resulted in an enhanced KLa value of 9% ± 1% for every Vg condition studied.
In conclusion of oxygen mass transfer, F-sand and C-sand showed significantly higher performance in terms of KLa coefficient in both reactors compared to the other three types examined up to 270%. Moreover, the KLa coefficient in the ALR of the F-sand diffuser resulted in up to 10% higher than in BCR. This result distribution can account for the behaviors of each diffuser as well as each reactor class in terms of bubble hydrodynamics, e.g., bubble size, rising velocity, etc. However, even F-sand and C-sand were found as the better diffuser classes, it does not mean excess values achieved were obtained freely. Smaller orifice diffusers may consume higher energy through excessive pressure drops. Therefore, the unit volume power consumption (P/V) should be investigated in order to understand the KLa performance at the different power supplies in each air diffuser.

3.4. Power Consumption

Unit volume power consumption (P/V) was illustrated with the KLa coefficient (see Figure 9). The P/V value ranged between 12.39 and 22.43 W/m3 responding to the studied Vg range from 0.12 to 1.00 cm/s. Better KLa value can be reached from the higher P/V value as expected. The result from both reactors still displays a good performance of F-sand and C-sand even under the same power supply. It means that these two diffusers could offer a better oxygen transfer performance without extra energy.
It can be taken note of two patterns of KLa coefficient of F-sand and C-sand between ≤0.59 cm/s (or ≤100 W/m3) and >0.59 cm/s (or >100 W/m3) in both reactors. At≤ 0.59 cm/s or ≤100 W/m3, F-sand and C-sand gave almost the same KLa value under the same P/V supply. However, F-sand appeared better than C-sand after increasing gas flow >0.59 cm/s or >100 W/m3. Moreover, the correlations between the KLa coefficient (in hr−1) and P/V (in W/m3) were simulated as power low relationship for F-sand and C-sand in both reactors, as expressed in Equations (18)–(21). The slop values found are comparable with the previous study [32], KLa~(P/V)0.61.
KLa F-sand-BCR = 2.50 (P/V)0.60          (R2 = 0.998),
KLa C-sand-BCR = 1.92 (P/V)0.65          (R2 = 0.984),
KLa F-sand-ALR = 2.58 (P/V)0.61          (R2 = 0.998),
KLa C-sand-ALR = 2.62 (P/V)0.59          (R2 = 0.996),
Based on the result of this section, it can be concluded that even F-sand was found to give a higher KLa coefficient over C-sand diffuser at the same Vg, F-sand also proportionally consumes higher energy at low gas flow (≤0.59 cm/s), but at higher gas flow (>0.59 cm/s), F-sand provided better performance compared to C-sand under the same power supply. This result can be used as the design criteria of F-sand and C-sand applications in the future for optimizing between power as the input and oxygen transfer as the output.

3.5. Effect of Plastic Media Addition Using Optimum Diffusers

Following the depth analysis of bubble hydrodynamic characteristics and oxygen mass transfer performance with the various Vg value of the investigated air diffusers in BCR and ALR, the optimum gas diffuser can be selected in terms of oxygen transfer coefficient (KLa) and power consumption with their internal gas-phase dynamics analysis. F-sand and C-sand showed an ability to produce or/and maintain the smaller bubble size and to increase bubble-water contact time through decreasing bubble rising velocity. Consequently, the specific interfacial area and gas hold-up from these two diffusers are enlarged showing a good bubble hydrodynamic performance in the gas–liquid contactors. Hence, it was expected that these bubble hydrodynamic behaviors may still contribute a good performance after adding the optimum condition of solid media, previously found in our previous publication [9]. The evaluation study of plastic media addition with the optimum gas diffusers, F-sand and C-sand, was then analyzed in this section.

3.5.1. Mass Transfer Coefficient

This part was designed to determine the effect of ring shape plastic solid media addition which provided a positive performance of bubble hydrodynamics parameter towards enhancing the oxygen mass transfer performance. Oxygen transfer parameters were necessary for projecting reactor performance. Firstly, it was examined the impact of the addition solid loading on the KLa coefficient with all air diffuser classes. Figure 10a,b shows the KLa value at 0.59 cm/s of Vg for ranging solid media loading from 0% to 20% in BCR and ALR. In BCR, the KLa value reached the maximum for all diffusers at 10% solid loading (see Figure 10a). At this 10% condition, the F-sand diffuser could improve KLa from 41.0 hr−1 (non-additive case) to 51.1 hr−1 (~20% improvement), followed by C-sand. It was enhanced from 38.9 hr−1 to 44.6 hr−1 (~13% improvement). H-0.3, H-0.6, and H-1.2 also showed an improvement value between 14% and 37%. For ALR, similar trends were observed for small orifice diffuser types, i.e., F-sand, C-sand, and H-0.3. Maximum KLa value could be observed at 10% solid loading (see Figure 10b). Under the optimum condition, F-sand diffuser class could enhance the KLa coefficient from 44.6 hr−1 to 56.2 hr−1 (~21% improvement), while C-sand could enhance from 36.4 hr−1 to 43.9 hr−1 (~17.2% improvement). Therefore, it can be concluded that 10% solid loading is the optimum condition of ring media addition to maximizing the KLa coefficient for F-sand and C-sand diffusers in both reactors.
Oxygen mass transfer after adding solid media under optimum condition was plotted in Figure 10c,d at different Vg values. KLa value increased with Vg for both reactors. Superficial gas velocity is the most significant parameter and a better KLa coefficient can be acquired after increasing Vg. It can be basically noted that providing additional plastic media expressed a better performance, regardless of diffuser and reactor types. In BCR, the KLa value could be improved over the non-addition case by about 27–39% and 19–36% by using F-sand and C-sand, respectively. However, about 8–21% and 9–26% enhancement was orderly observed from the use of F-sand and C-sand in ALR. In conclusion, adding solid media in a multi-phase reactor enhanced the oxygen mass transfer coefficient (KLa) performance compared to the non-addition case for all selective gas diffusers and studied range superficial gas velocity. F-sand was defined as the best gas diffuser class for improving the KLa value in both BCR and ALR.

3.5.2. Gas Hold-Up

As mentioned, gas hold-up depends mainly on the gas velocity, physical properties of the liquid, and type of gas sparger [21]. Solid media is widely applied in a three-phase reactor, therefore, its effect on gas hold-up is an important aspect. A comparative study of solid media addition and non-addition one on gas hold-up was illustrated in Figure 11. From this plot, there is a clear trend of successive rise in intensity of gas hold-up while it was increased the superficial gas velocity with both gas diffusers. Theoretically, the huge amount of fluid was risen by increasing air volume into gas–liquid contactor. F-sand diffuser which has the smallest size of orifice diameter provided the largest gas hold-up compared to those of C-sand for both contactors. This outcome is contrary to the finding of Yunos et al. (2017) [33], the bigger orifice gas diffuser provided hug gas hold-up in the bubble column. It seems possible due to the F-sand diffuser has a higher number of holes compared to the C-sand diffuser at the same active surface area (see Table 1).
It is also clearly confirmed by the smallest bubble size (D32) of F-sand compared to those of C-sand as well (see Figure 3). Hence, a higher number of holes of the diffuser contributes to higher gas hold-up. Adding 10% (v/v) solid media in both reactors resulted in enhancing gas hold-up up to 44–57% using C-sand, and up to 10–25% using F-sand diffuser, compared to the non-addition ones (see Figure 9), as demonstrated by existed study that gas hold-up increased with the presence of ring-shape particles [4]. This observation may support the hypothesis that the addition of solid plastic media at an optimum condition led to an increased amount of gas hold-up in gas–liquid contactors. This result can be explained by the fact that increasing bubble retention time in a liquid system, leading to a high number of bubbles and gas hold-up.

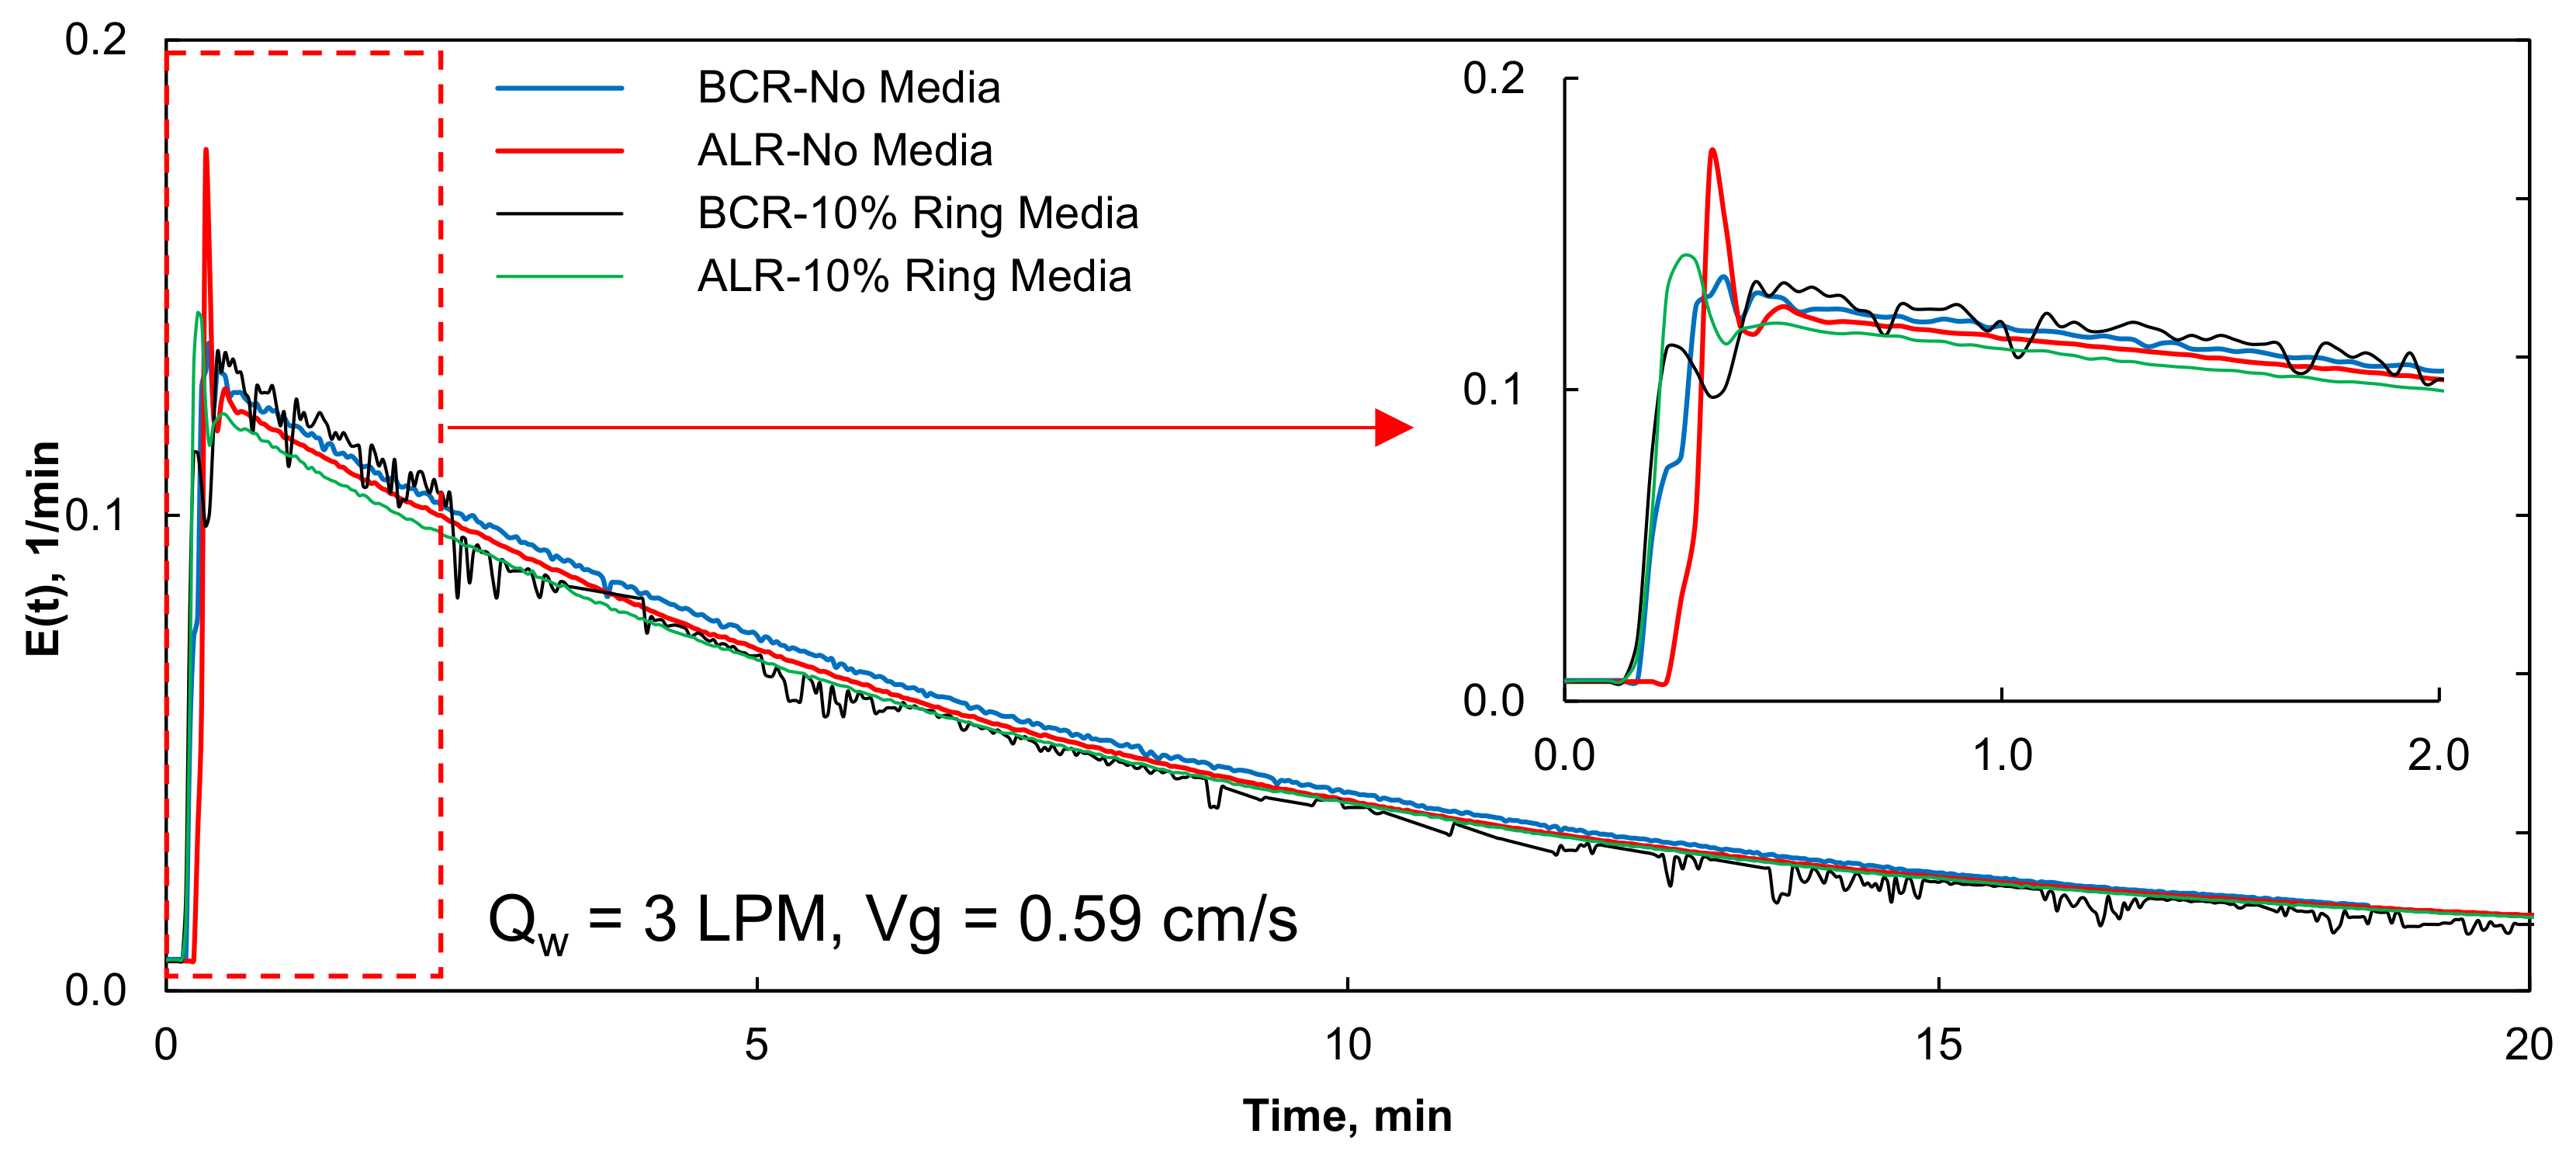
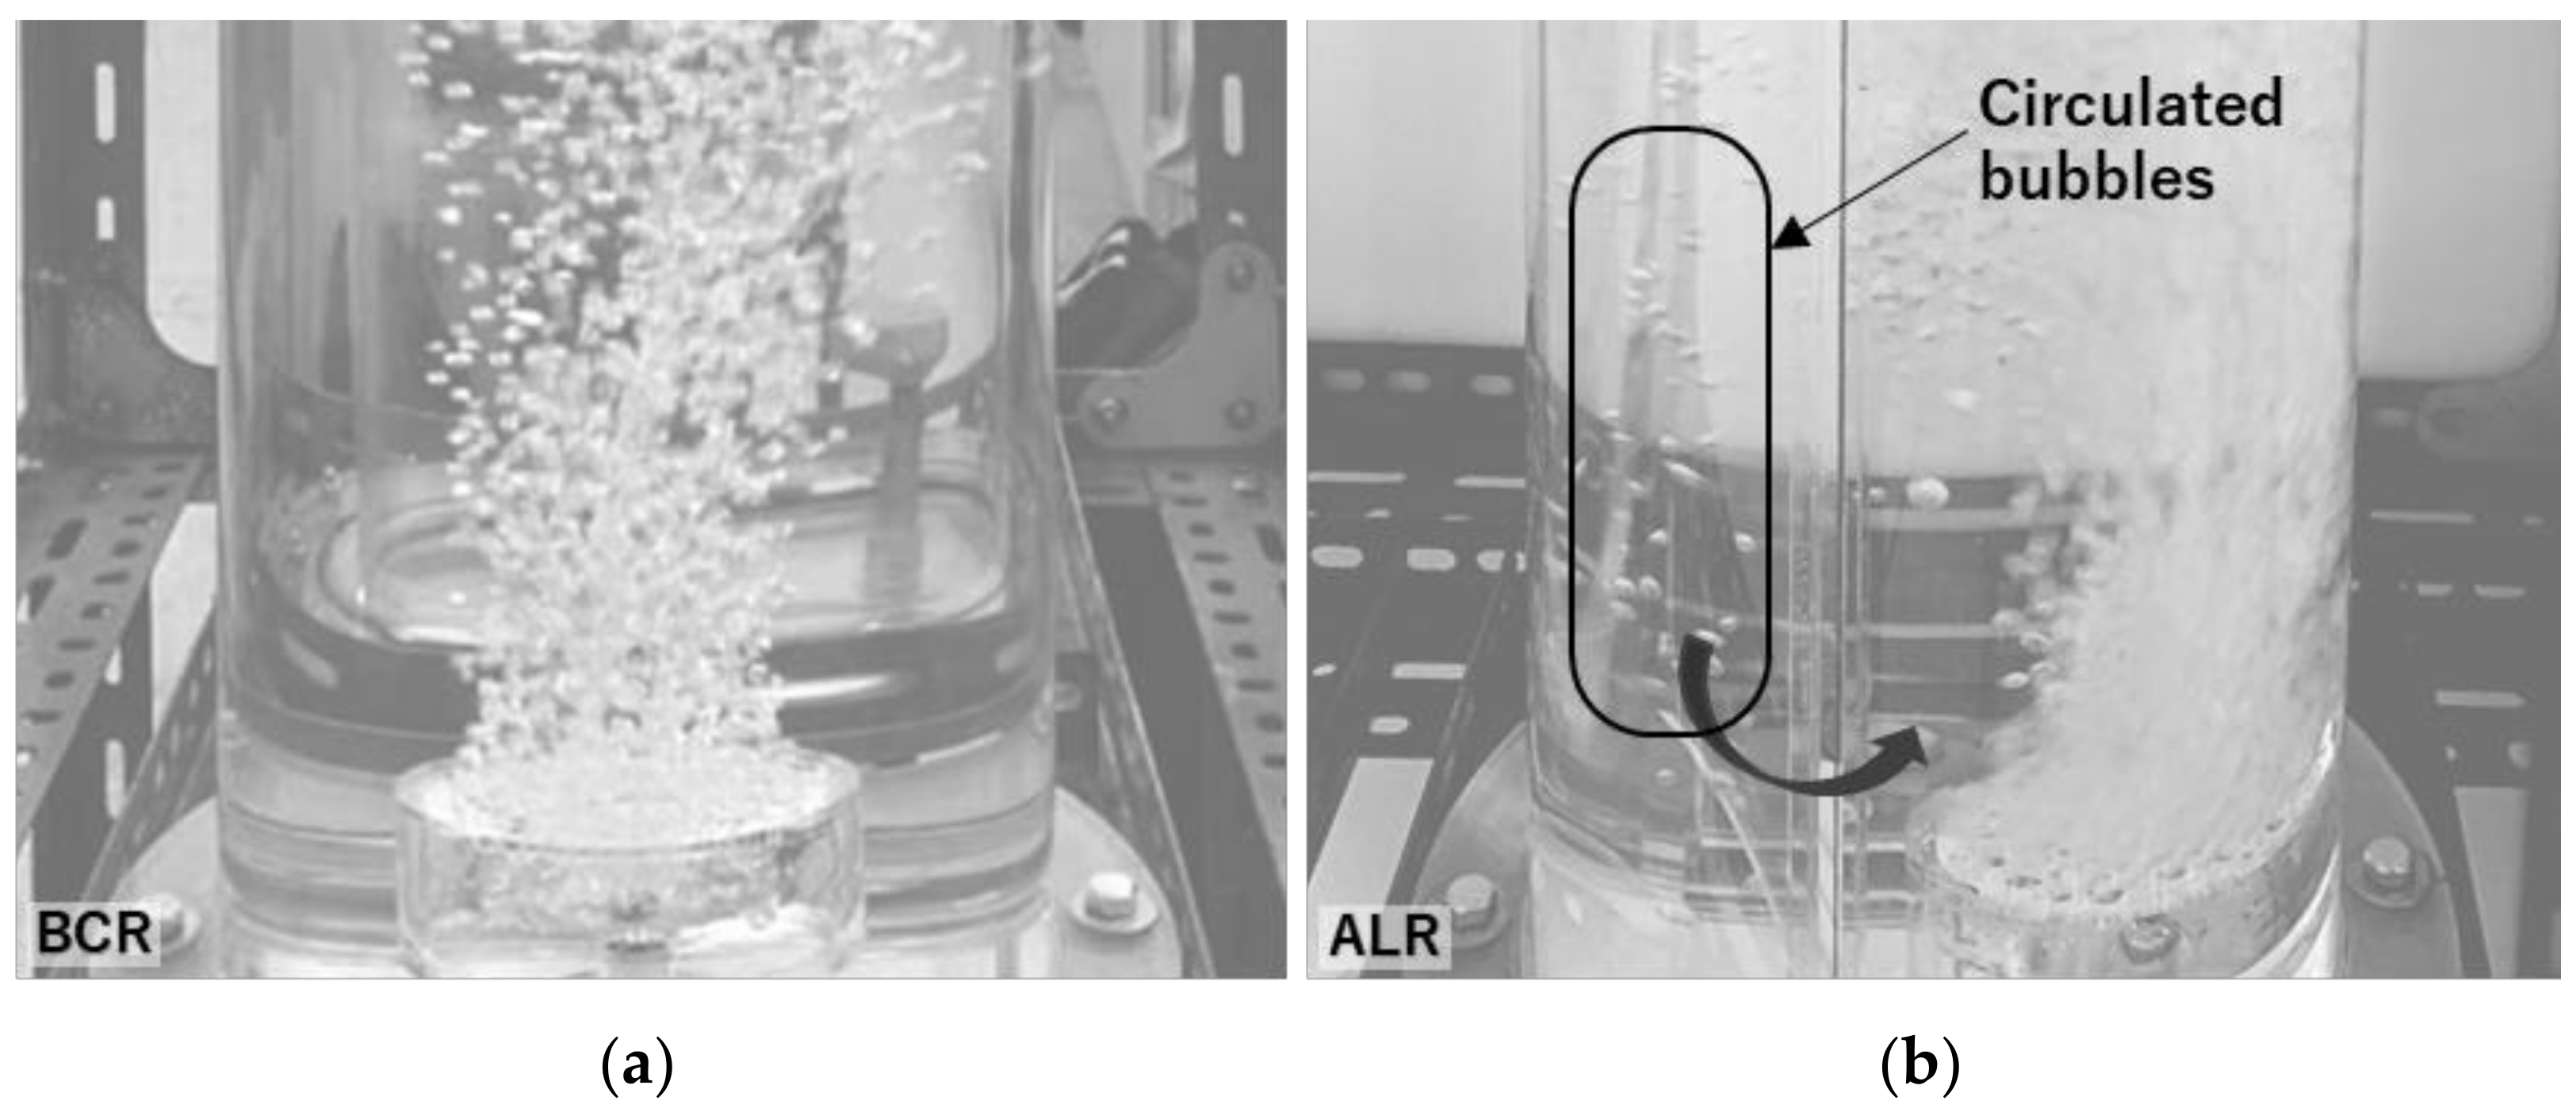
3.5.3. Liquid Flow Pattern

The purpose of this part is to determine the effect of column types, the presence of solid media, and the solid media concentration on the liquid flow pattern in BCR and ALR. Firstly, the mean residence times of the reactors were initially analyzed as shown in Figure 12 a,b. Figure 12a shows the effect of superficial gas velocity on the mean residence time for both BCR and ALR. When the gas was not injected into the reactors (superficial velocity equal to 0), the mean residence times for both BCR and ALR were approximately the same. However, with the gas throughput inside the reactors, the mean residence time of 6.9–7.1 min was acquired for ALR while the BCR was only 6.3–6.6 min. As the theoretical residence times of both reactors were 7.33 min, it indicates that the ALR had a smaller portion of the dead zone inside the reactor than the BCR since its mean residence time was closer to the theoretical ones. It was due to the fact that the geometry and the sparger position of ALR that divided the reactor into riser and downcomer zone support the circulation of liquid inside the reactor than the BCR, resulting in a higher effective mass transfer area inside the reactor and KLa [5,6]. Moreover, the increase in the superficial velocity also raised the mean residence time for both reactors. This indicates that the higher gas superficial velocity promotes the liquid circulation inside both columns and reduces their dead zones due to the increase in bubble numbers and velocities.
The presence of solid media in both columns also affected the mean residence time inside the columns, especially for the BCR. As presented in Figure 12a, the residence time rose from 6.3–6.6 to 7.0–7.2 min when the 10% v/v of media was added into the column. This indicates that the presence of solid reduced a significant portion of the dead zone inside the BCR column. This effect was also observed for the ALR but with a lesser impact. The presence of solid media inside the columns was presumed to reduce the dead zone of liquid inside the columns due to the fluidized bed regime of solid media that moved randomly throughout the column. The movement also improved the gas dispersion inside the column since bubbles had to rise tortuously through the fluidized bed of the media [4]. These effects increased the effective mass transfer area inside the column and therefore promoted the KLa for both BCR and ALR, where the effects were strong in the BCR column since there was a larger portion of the dead zone inside the BCR than the ALR. However, when the solid media was added further than 10% v/v as shown in Figure 12b, the residence time started to decline from their maximum values. The less fluidized regime was presumed to be responsible for this phenomenon since the bed was too dense to move when comparing to the lower concentration of solid.
Further analysis of the liquid flow pattern was carried out by plotting the exit age distribution or E(t) curve as a function of time as shown in Figure 13. According to the E(t) curve analysis using the compartment model [26], the liquid flow pattern in both BCR and ALR behaved closely to the perfectly mixed tank with a very short lag time of 0.4 min or less. This lag time indicated the plug flow area between the trace injection and measurement point, including the reactor internals, piping, and fitting. The major difference between BCR and ALR without the presence of solid media was the peak of the curve for the ALR at the time of 0.4 min which was significantly higher than the BCR. This indicated that there was a certain portion of liquid in the ALR that exited the column rapidly and behaved as a by-passing liquid that had less than 0.4 min to contact with the gas. The portion of this by-passing liquid was expected to be the fluid that ran into the column at the top, flowed through the downcomer zone, and suddenly exited the column at the bottom of the column. These by-pass behaviors were not strongly observed in the BCR due to the difference in their geometries.
The presence of solid affected both ALR and BCR similarly. Firstly, the presence of solid reduced the peak of the by-passing curve, especially for ALR. Secondly, the presence of solid decreased the lag time of both BCR and ALR as it reduced the plug flow area inside the column. These effects happened due to the stronger turbulence movement of liquid that had to move tortuously around the fluidized solid inside the column. Consequently, the expected perfect-mix regime was enhanced leading to a better contactor between gas and liquid and improved the KLa. In addition, by computing the volume of each flow type (Mixed flow, plug flow, and dead volume) using the compartment model theory as well as the tank-in-series model, further analysis can be achieved. Table 2 shows the calculated result according to the compartment model and tank-in series model.
Table 2 indicates that, regardless of column types, the increase in superficial velocity (Vg) decreased the dead volume portion and the plug flow portion but promoted the mixed flow portion inside the column. This result was consistent with the number of tanks (NTank) in the tank-in-series model where the increase in Vg resulted in the decrease in NTank indicating that better mixing was achieved. This increase in the mixed flow portion supported the fact mentioned earlier regarding the stronger circulation of liquid inside the column. Moreover, when comparing the BCR and ALR without solid, the BCR had a larger portion of dead volume and a smaller plug flow portion than the ALR which was consistent with their geometries. The tank-in-series model also supported the compartment model since the NTank of ALR was smaller than the BCR, indicating that the ALR had a better mixing performance and volume when comparing with the BCR. Therefore, the KLa of ALR was significantly higher than the BCR even though the same Vg was used.
When the solid media was introduced, it can be seen that the dead volume, as well as the plug flow portion, was significantly reduced while the mixed flow portion was promoted for both BCR and ALR. The NTank of the tank-in-series model for the columns with the presence of media also decreased with the loading concentration of media. Hence, the presence of media affected the flow pattern inside both columns by promoting the mixed flow regime and eventually raised the KLa. However, with the excessive amount of media adding into the columns (more than 10% in this case), the effect could be reversed as it increased the dead zone portion inside the columns. This find-out supported the fact that the solid media escalated the mixed flow of liquid inside the column and enhanced the KLa due to the movement of fluidized solid.

4. Conclusions

The main purpose of this work is to study the effect of different air diffuser types on bubble hydrodynamic characteristics and oxygen mass transfer performance. The experiments were conducted in bubble column and airlift rectors with five different air diffusers, i.e., F-sand, C-sand, H-0.3, H-0.6, and H-1.2, under the variation of superficial gas velocity (Vg) between 0.12 and 1.00 cm/s. The present study was mainly divided into three parts including effective analysis of air diffuser classes: (i) on bubble hydrodynamics such as bubble size, rising velocity, interfacial area, and gas hold-up, (ii) on oxygen mass transfer parameters such as KLa coefficient and power consumption, and (iii) evaluate the performance of reactors using the selected diffusers providing the highest KLa value with solid media addition. The significant results were summarised below:
  • Smaller bubbles were observed from the smaller orifice size diffusers, regardless of BCR or ALR. In both reactors, bubble size distributed between 3.14 and 11.28 mm of the Vg range studied. F-sand, the smallest orifice diffuser, illustrated the significantly smallest air bubble compared to other diffusers, followed by C-sand. Bubble sizes produced/maintained by F-sand in BCR and ALR were 3.14–4.90 mm and 3.27–4.55 mm, respectively. These bubble size results achieved are smaller than that of C-sand by about 22–28% on average. Moreover, ALR showed an ability to maintain smaller bubbles in the riser than BCR by about 3–8% at Vg ≥ 0.29 cm/s.
  • In terms of bubble rising velocity, it ranges between 2.22 to 7.18 dm/s in both reactors, studied Vg range, and air diffusers. F-sand followed by the C-sand diffuser showed the slowest rising velocity due to a smaller bubble size and recirculated smaller bubbles between riser and downcomer compartments in ALR. F-sand and C-sand in ALR orderly provided the rising velocity 1.60–2.58 dm/s and 2.33–3.95 dm/s, which are slower than that in BCR by about 39–54% and 12–36%, respectively. Consequently, bubble interfacial area and gas hold-up were also analyzed and the results clearly showed that higher interfacial area and gas hold-up values were achieved from the use of F-sand diffusers, followed by C-sand type.
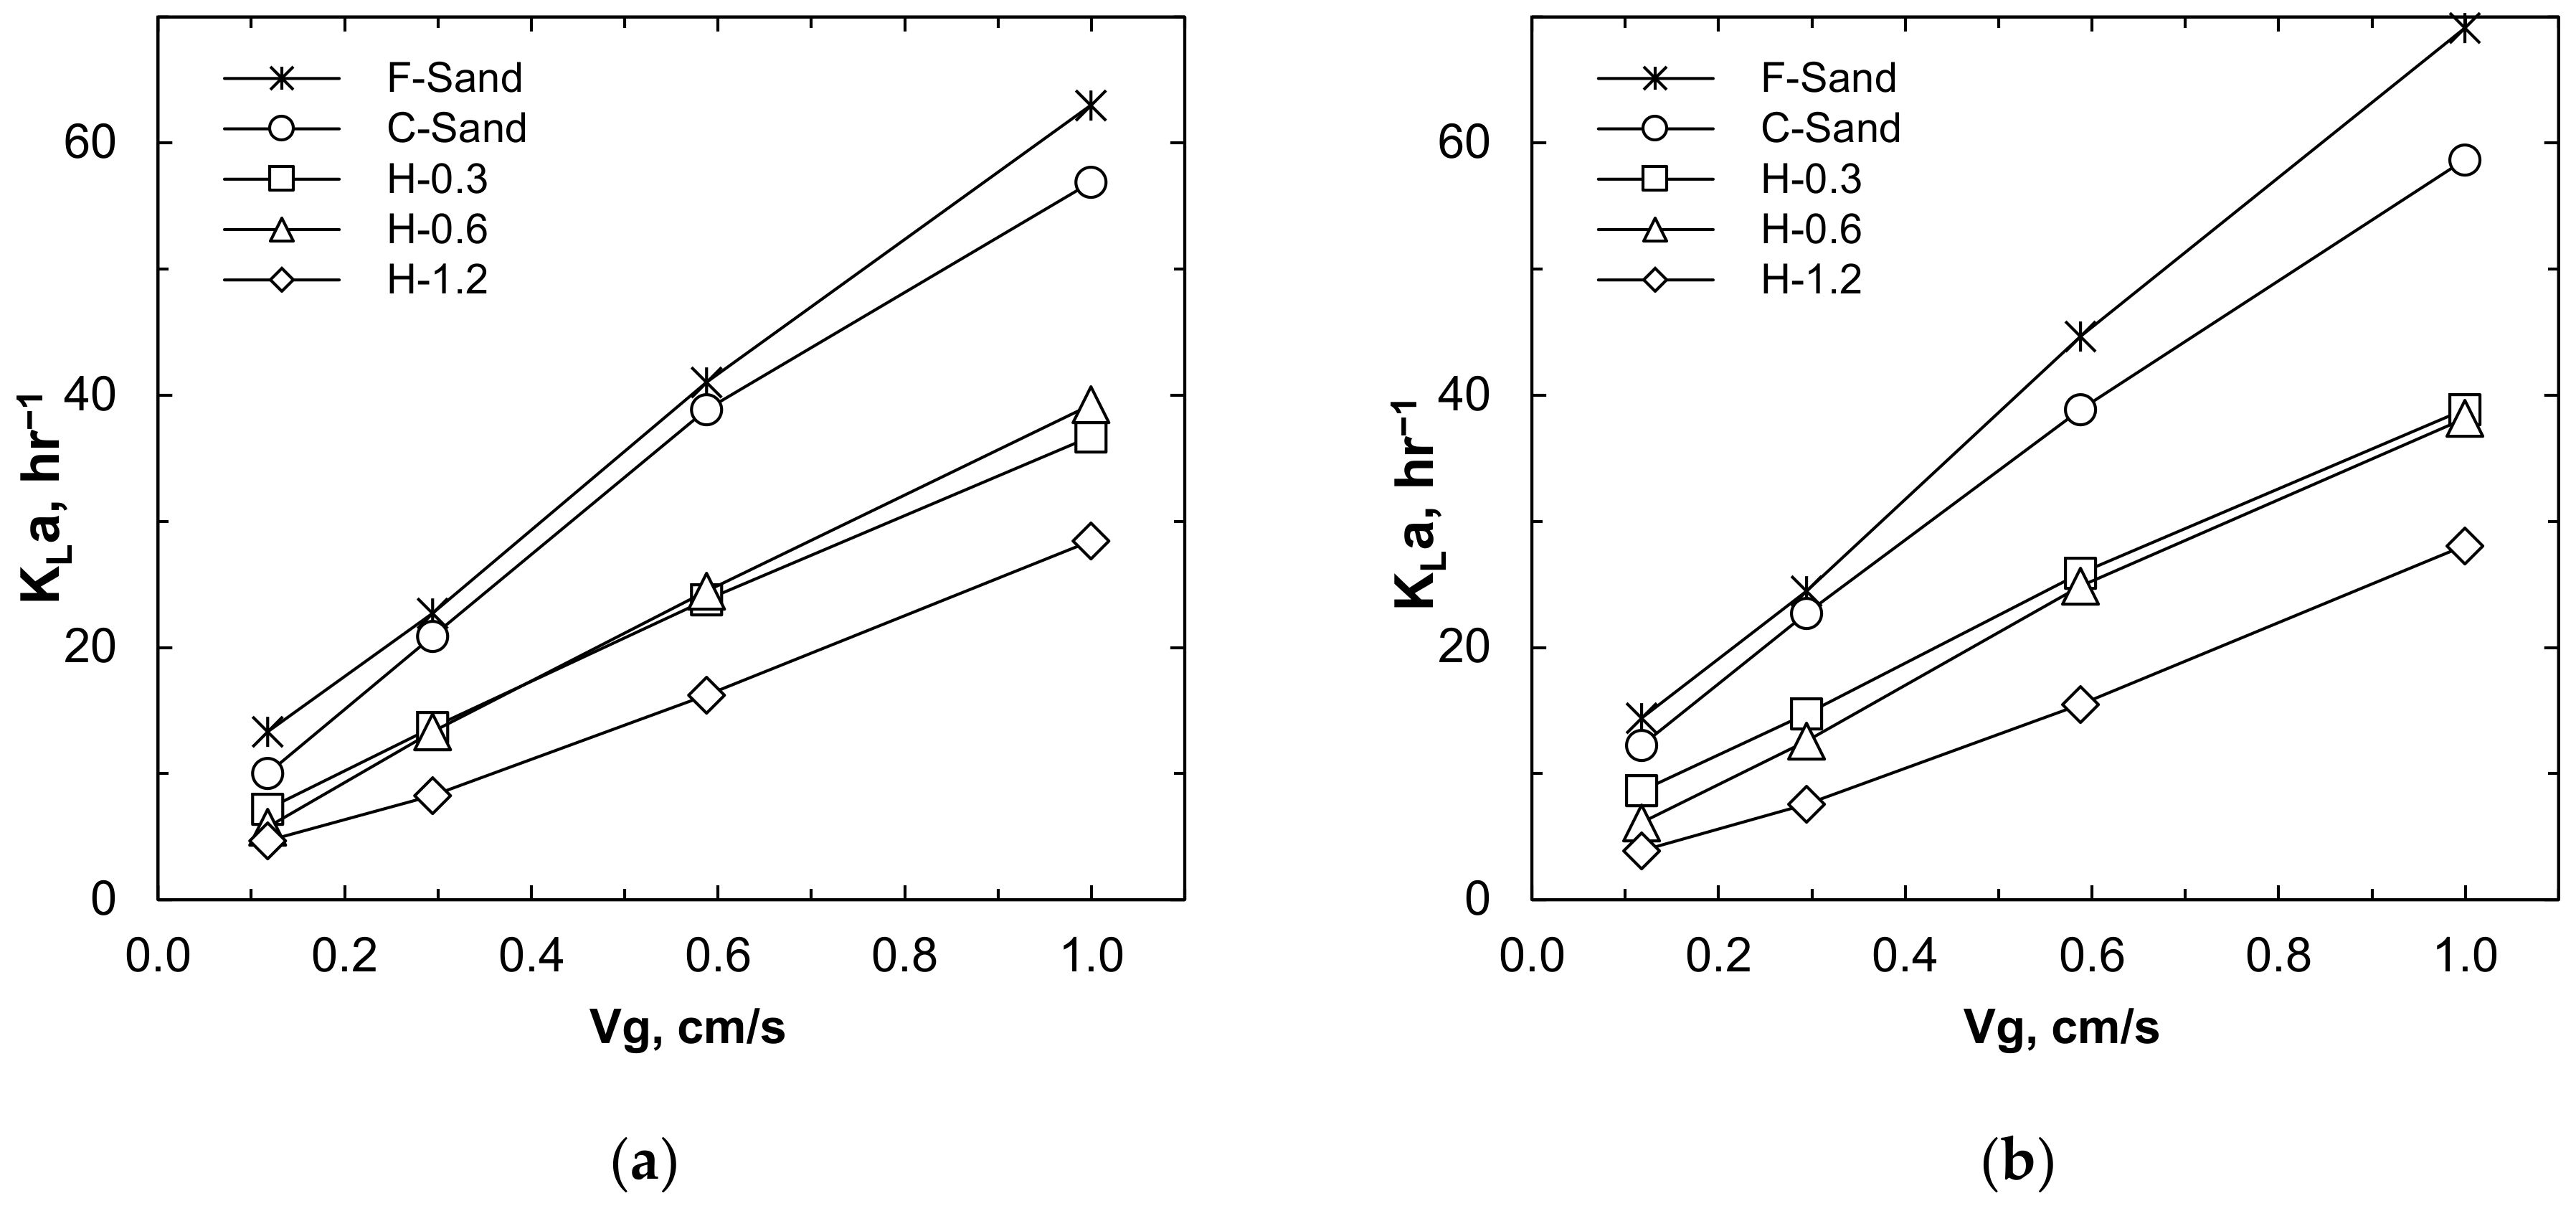
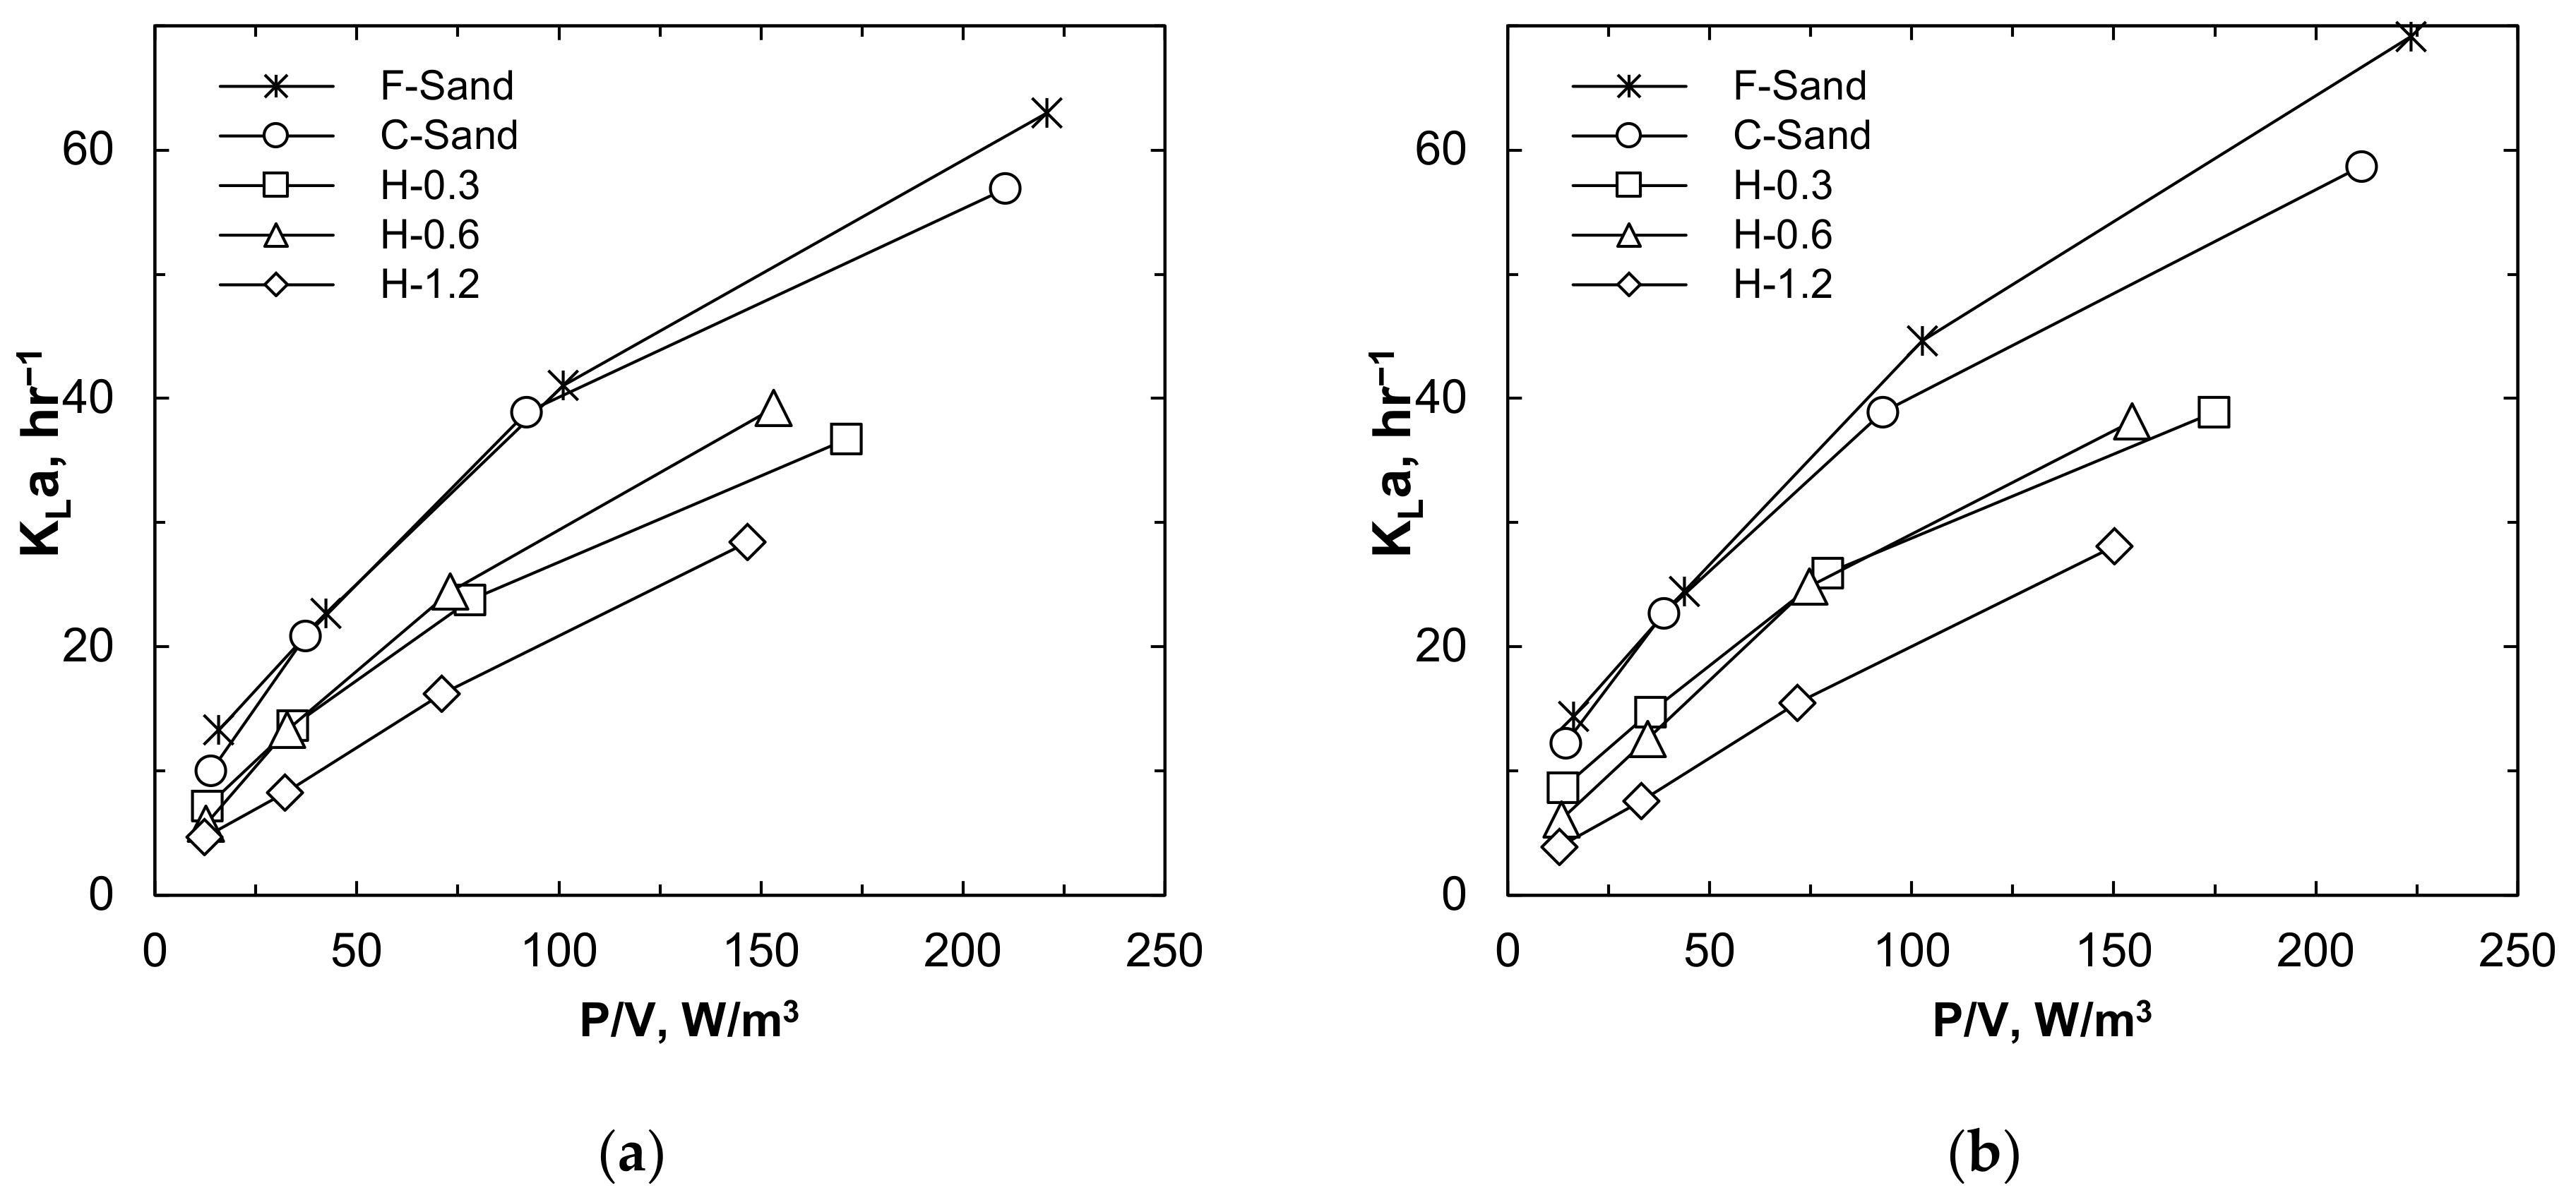
  • KLa coefficient ranged from 4.68 to 63.00 hr−1 of BCR and 3.89 to 69.12 hr−1 of ALR was obtained in this study condition. F-sand and C-sand exhibited a higher KLa value over other diffuser types. Up to 270% higher KLa coefficient in both reactors can be obtained from F-sand and C-sand compared to others. These significant outcomes can be explained through their better bubble hydrodynamics. Plus 10% higher KLa value in ALR using F-sand over C-sand can be demosntrated. Additionally, the power consumption from the use of F-sand is also higher than C-sand at low Vg (≤0.59 cm/s). It means that if the same power per unit volume is provided to F-sand and C-sand, a comparable value of the KLa coefficient will be acquired. However, a better KLa coefficient will be achieved from F-sand over C-sand even the same power consumption is supplied under the higher Vg (>0.59 cm/s).
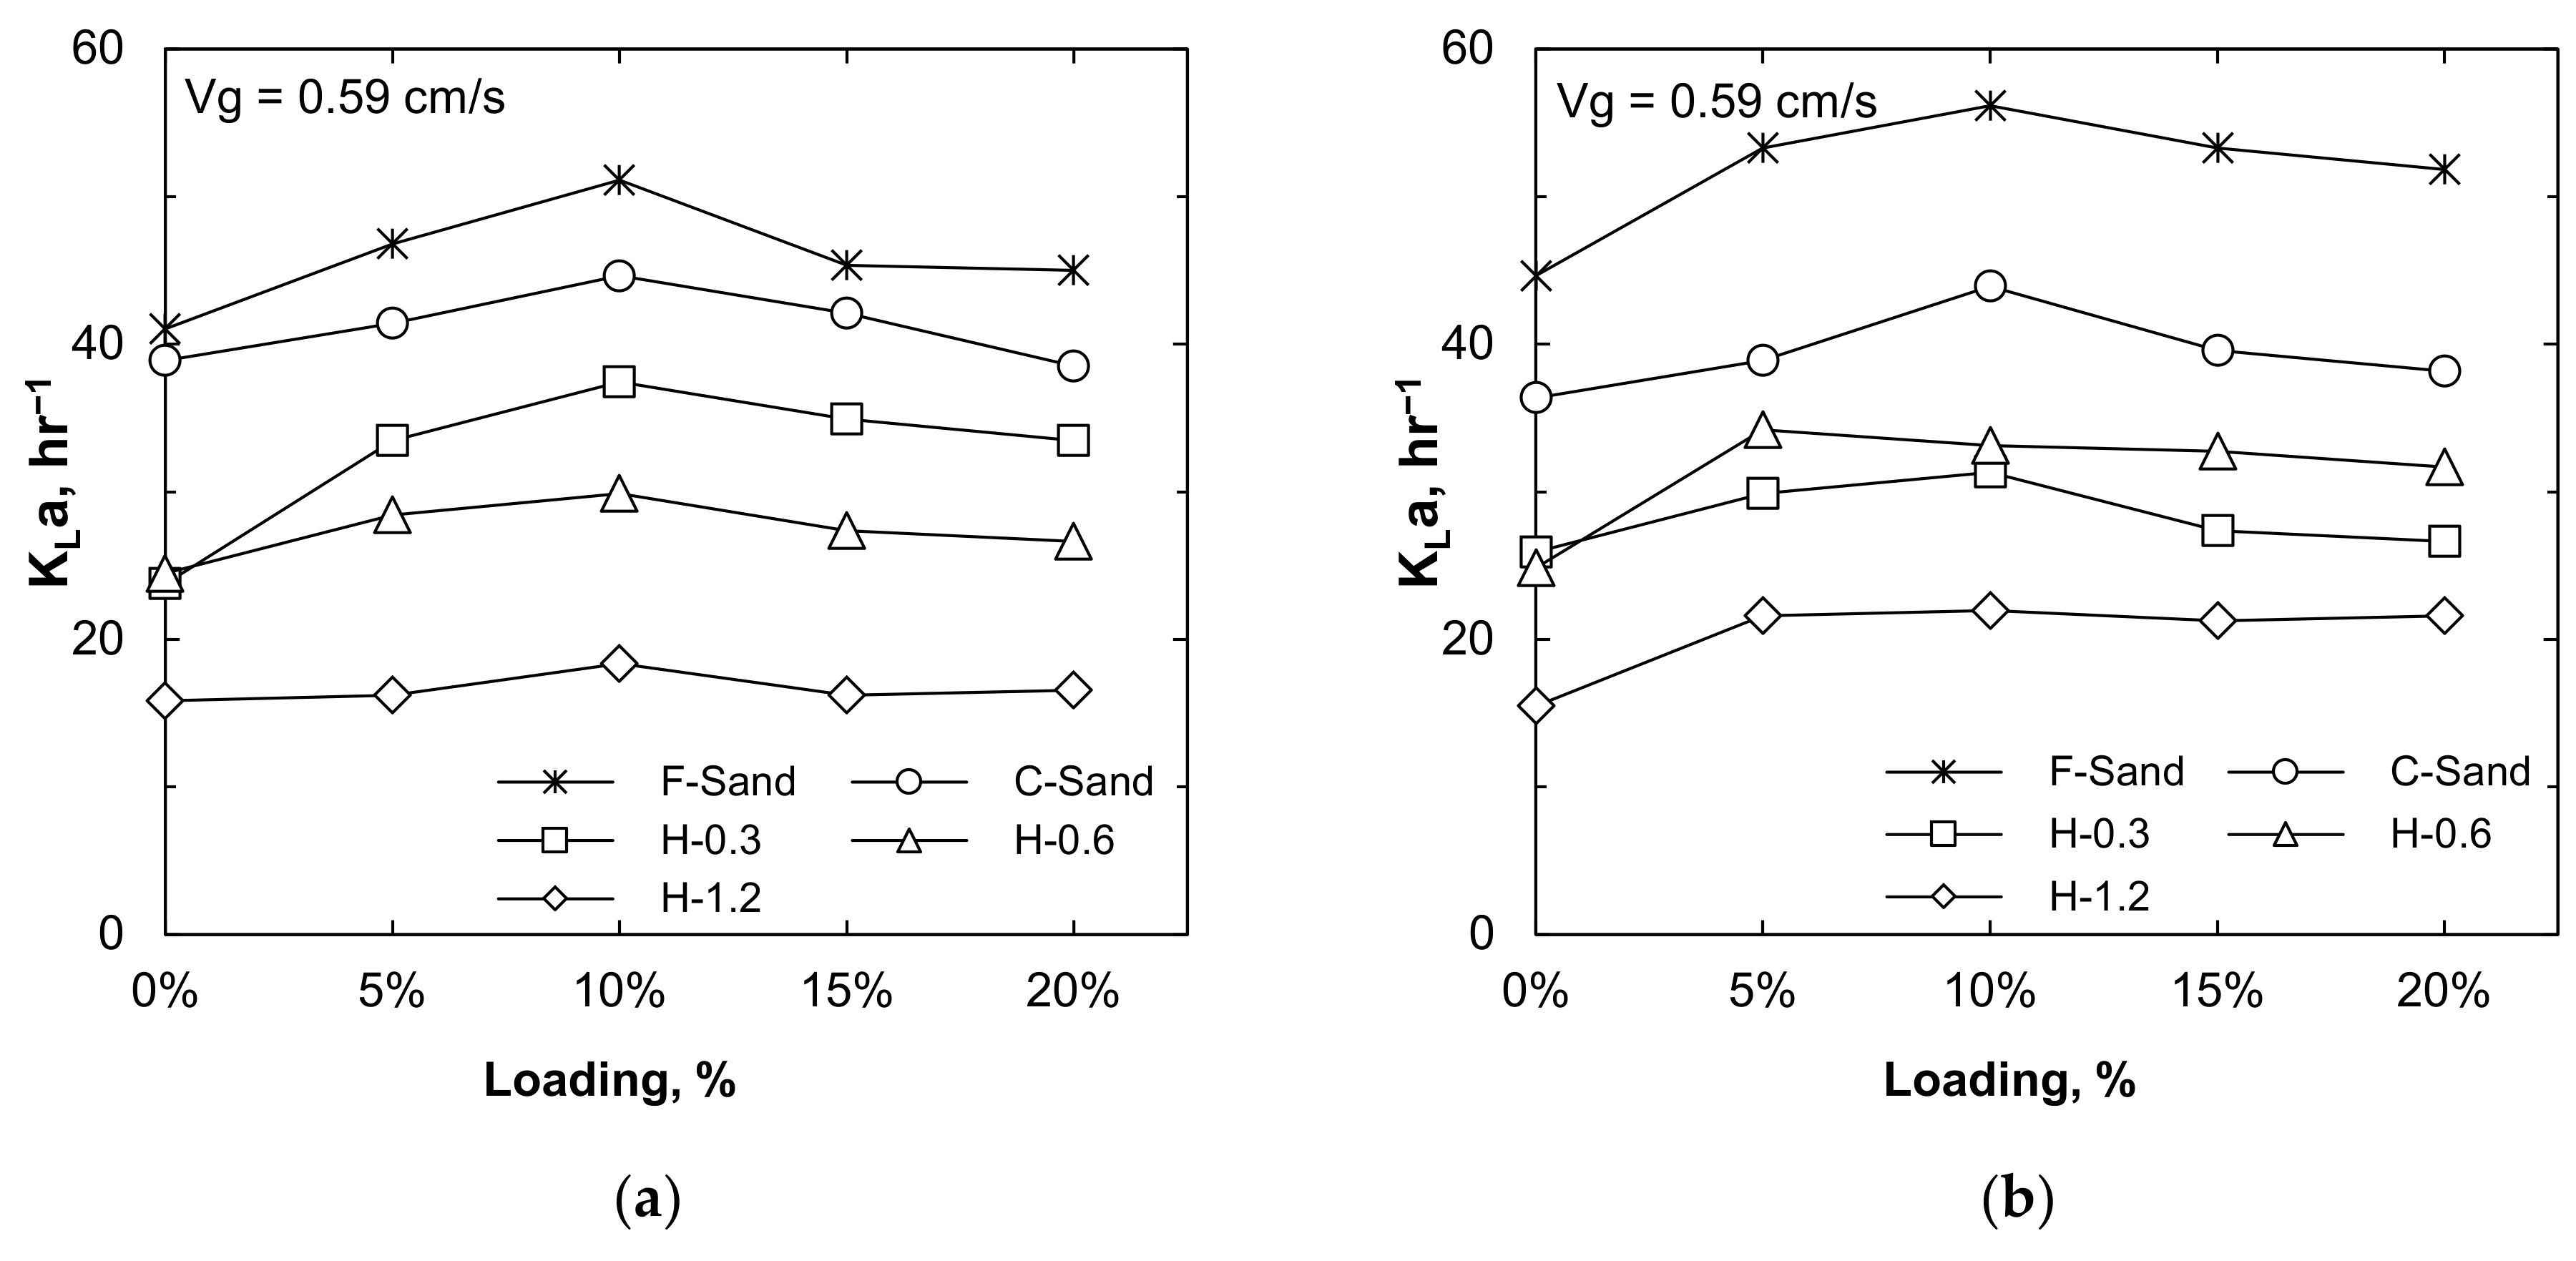
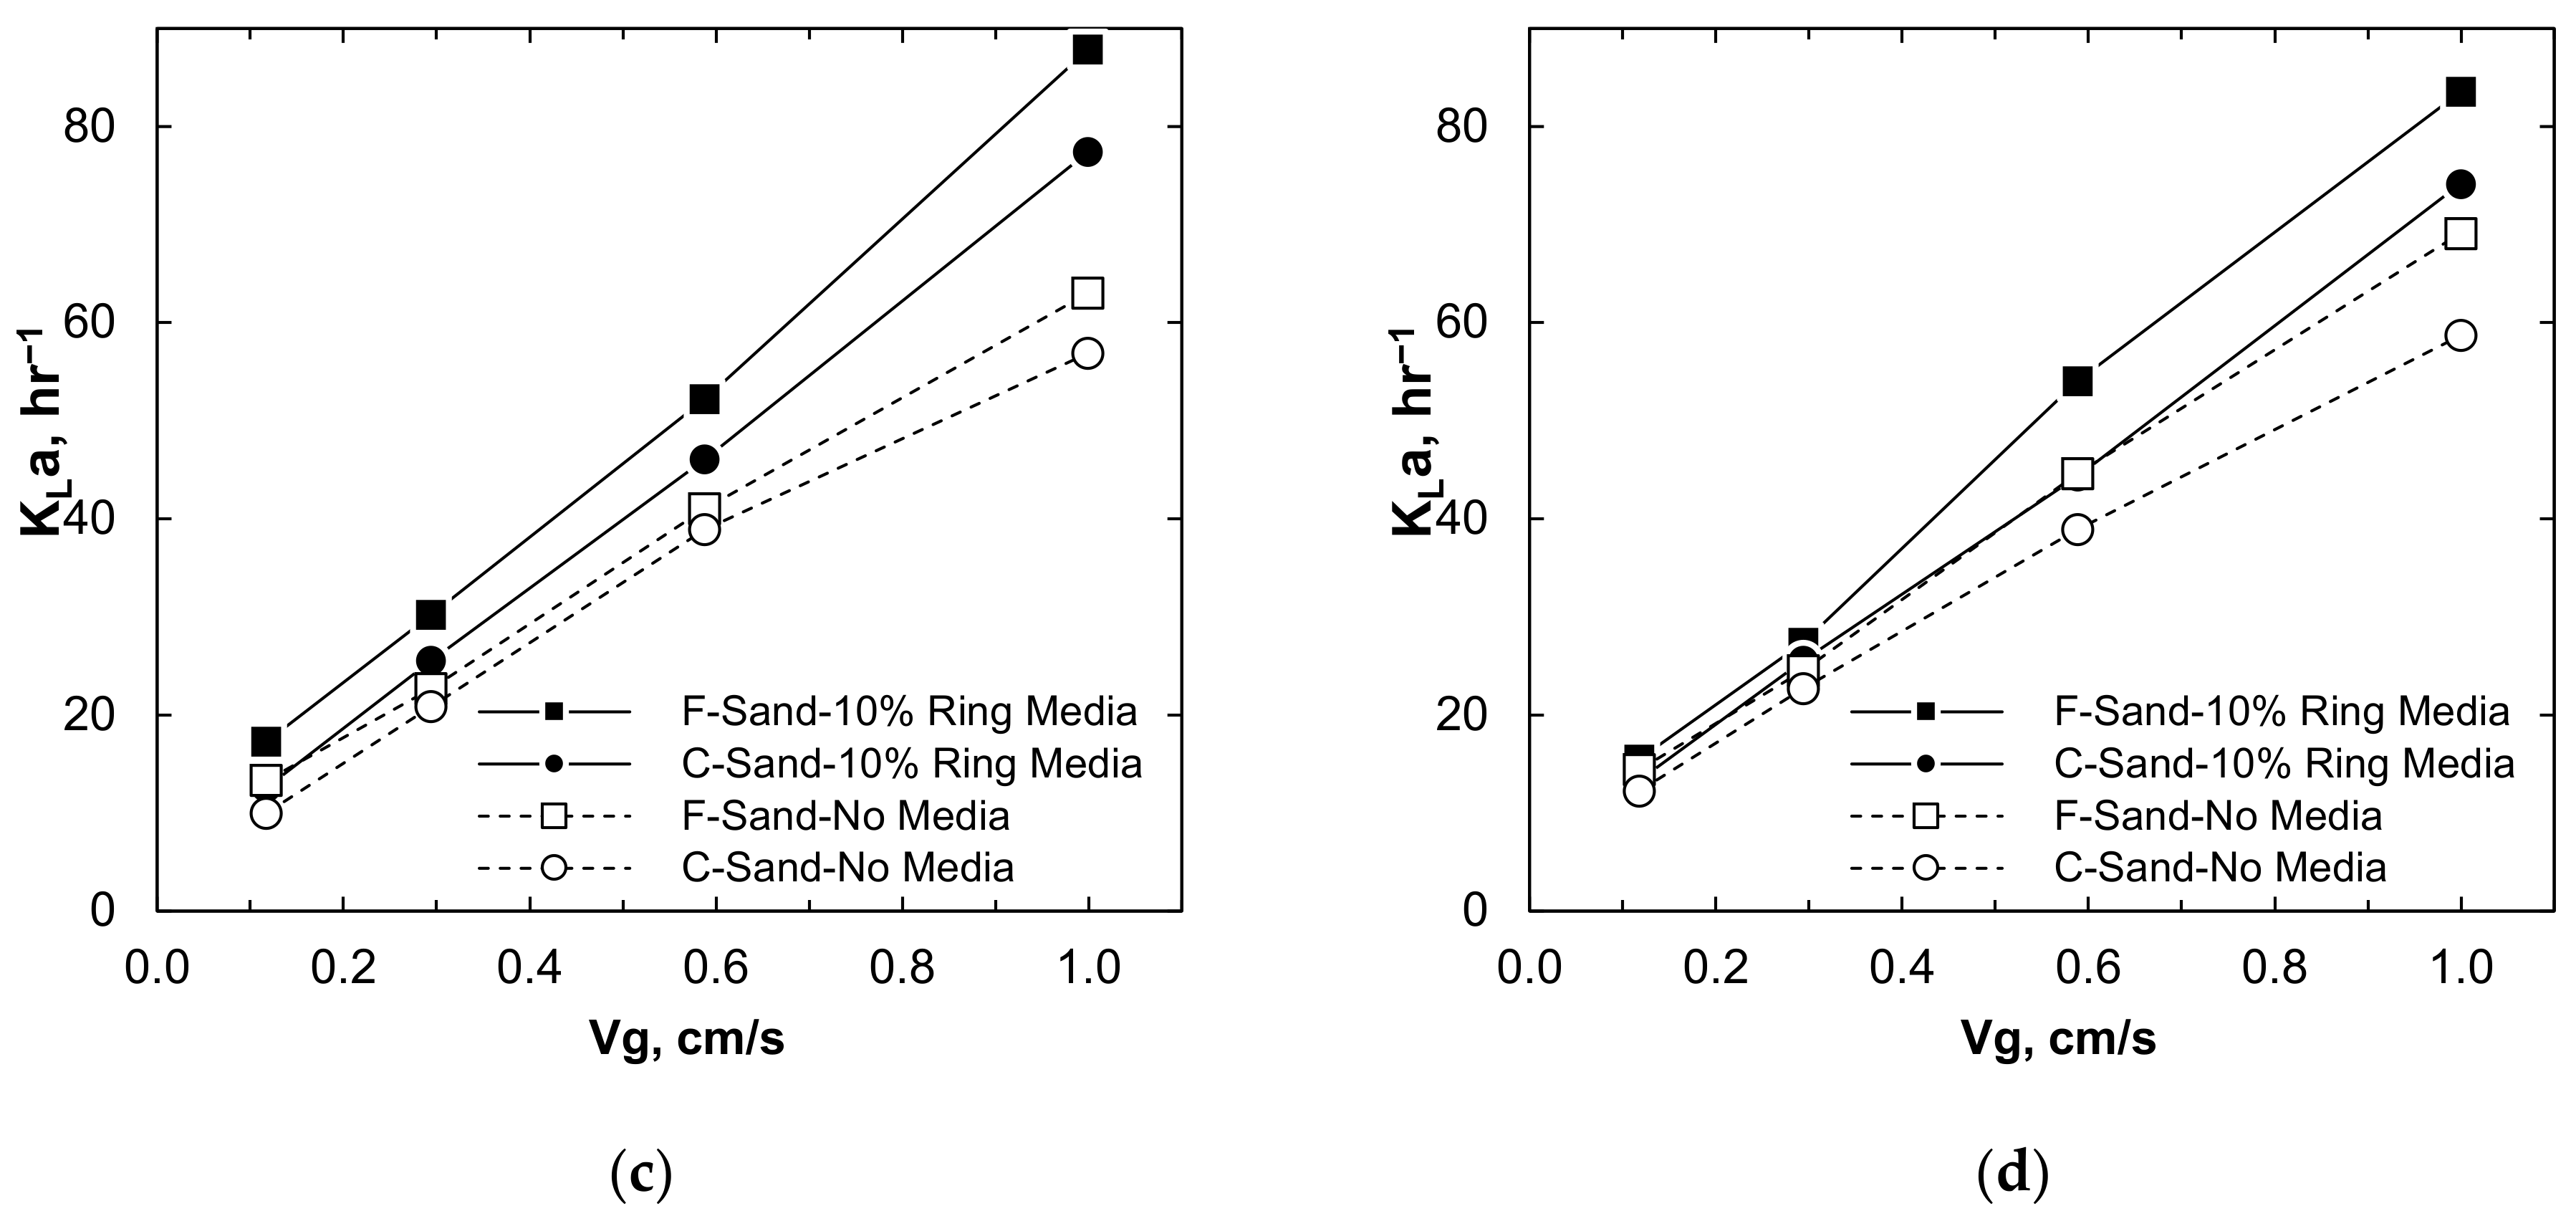
  • F-sand and C-sand were considered as the optimum diffusers for enhancing oxygen transfer, their performance with additional plastic media were evaluated. The result showed that 10% solid loading, whichever was found as the optimum one in our previous work [5], was also found as the optimum condition for F-sand and C-sand in both reactors. A remarkable KLa value improvement from 8% to 39% was come by adding plastic media. Their gas hold-up and liquid pattern behaviors without and with solid media addition were also analyzed.
  • Lastly, the flow pattern inside the column had a significant effect on the mass transfer in the column. With the increase in mixed flow inside the column, the KLa was enhanced. The geometry of ALR had a better performance in promoting the mixed flow regime than the BCR due to the separation between riser and downcomer zone. The addition of solid also promoted the mixed flow regime due to the movement of the solid inside the column.
Even the performances of various diffusers were examined in terms of bubbles distributions, fluid flow behaviors, and oxygen transfer coefficient, it was conducted in conventional laboratory-scale classes, i.e., bubble column and airlift reactors. Various reactor types commonly used in industries should be investigated together with the findings of this work to maximize the mass transfer and for overcoming its real-scale application.

Author Contributions

Conceptualization, P.H., P.P. and K.W.; methodology, P.H., S.B. and K.W.; formal analysis, P.H., S.B., P.P. and K.W.; investigation, P.H.; writing—original draft preparation, P.H. and S.B.; writing—review and editing, S.B., P.P. and K.W.; supervision, S.B., P.P. and K.W. All authors have read and agreed to the published version of the manuscript.

Funding

This research was supported by the ASEAN University Network/Southeast Asia Engineering Education Development Network (AUN/SEED-Net) Program of the Japan International Cooperation Agency (JICA) through the Collaborative Research (CR) Program. It was also supported by the Research Network NANOTECH (RNN) program of the National Nanotechnology Center (NANOTEC), NSTDA, Ministry of Science and Technology, Thailand.

Institutional Review Board Statement

Not applicable.

Informed Consent Statement

Not applicable.

Acknowledgments

The authors gratefully acknowledge the Environmental Engineering Department of Chulalongkorn University and the National Nanotechnology Center for the supports of research materials and experimental analysis. The authors also acknowledge the Water Environment Laboratory (WE Lab) of the Institute of Technology of Cambodia (ITC) for analysis support.

Conflicts of Interest

The authors declare no conflict of interest.

Nomenclature

Symbols
aSpecific interfacial area [m−1]
CConcentration[g m−1]
DBBubble diameter [m]
D32Sauter mean bubble diameter [m]
HHeight[m]
KLaVolumetric oxygen mass transfer coefficient[s−1]
KLLiquid side mass transfer coefficient [m s−1]
NTankNumber of tanks [#]
PPower[W]
QFlow rate [m3 s−1]
QwLiquid or water flow rate [m3 s−1]
tTime[s]
tmMean residence time [s]
ttheoTheoretical residence time [s]
UBTerminal rising velocity [m s−1]
VVolume [m3]
VgSuperficial gas velocity [m s−1]
Greek Symbols
εGas hold-up [-]
σ2Variance[s2]
ΔPTotalTotal pressure drop [Pa]
Sub- and Superscripts
BAir bubble
gGas phase
wWater or liquid phase
SSolid phase
*Equilibrium state

References

  1. Jakobsen, H.A.; Lindborg, H.; Dorao, C.A. Modeling of Bubble Column Reactors: Progress and Limitations. Ind. Eng. Chem. Res. 2005, 44, 5107–5151. [Google Scholar] [CrossRef]
  2. Cachaza, E.M.; Díaz, M.E.; Montes, F.J.; Galán, M.A. Simultaneous Computational Fluid Dynamics (CFD) Simulation of the Hydrodynamics and Mass Transfer in a Partially Aerated Bubble Column. Ind. Eng. Chem. Res. 2009, 48, 8685–8696. [Google Scholar] [CrossRef]
  3. Chisti, M.; Moo-Young, M. Airlift reactors: Characteristics, applications and design considerations. Chem. Eng. Commun. 1987, 60, 195–242. [Google Scholar] [CrossRef]
  4. Wongwailikhit, K.; Warunyuwong, P.; Chawaloesphonsiya, N.; Dietrich, N.; Hébrard, G.; Painmanakul, P. Gas Sparger Orifice Sizes and Solid Particle Characteristics in a Bubble Column—Relative Effect on Hydrodynamics and Mass Transfer. Chem. Eng. Technol. 2017, 41, 461–468. [Google Scholar] [CrossRef]
  5. Bun, S.; Chawaloesphonsiya, N.; Ham, P.; Wongwailikhit, K.; Chaiwiwatworakul, P.; Painmanakul, P. Experimental and empirical investigation of mass transfer enhancement in multi-scale modified airlift reactors. Multiscale Multidiscip. Model. Exp. Des. 2019, 3, 89–101. [Google Scholar] [CrossRef]
  6. Bun, S.; Chawaloesphonsiya, N.; Nakajima, F.; Tobino, T.; Painmanakul, P. Comparative study of local gas-liquid hydrody-namics and mass transfer between conventional and modified airlift reactors. J. Environ. Chem. Eng. 2019, 7, 103206. [Google Scholar] [CrossRef]
  7. Nikakhtari, H.; Hill, G.A. Enhanced oxygen mass transfer in an external loop airlift bioreactor using a packed bed. Ind. Eng. Chem. Res. 2005, 44, 1067–1072. [Google Scholar] [CrossRef]
  8. Chisti, Y.; Jauregui-Haza, U.J. Oxygen transfer and mixing in mechanically agitated airlift bioreactors. Biochem. Eng. J. 2002, 10, 143–153. [Google Scholar] [CrossRef] [Green Version]
  9. Zheng, Z.; Chen, Y.; Zhan, X.; Gao, M.; Wang, Z. Mass transfer intensification in a novel airlift reactor assembly with helical sieve plates. Chem. Eng. J. 2018, 342, 61–70. [Google Scholar] [CrossRef]
  10. Sastaravet, P.; Bun, S.; Wongwailikhit, K.; Chawaloesphonsiya, N.; Fujii, M.; Painmanakul, P. Relative Effect of Additional Solid Media on Bubble Hydrodynamics in Bubble Column and Airlift Reactors towards Mass Transfer Enhancement. Processes 2020, 8, 713. [Google Scholar] [CrossRef]
  11. Kulkarni, A.V.; Joshi, J.B. Design and selection of sparger for bubble column reactor. Part I: Performance of different spargers. Chem. Eng. Res. Des. 2011, 89, 1972–1985. [Google Scholar] [CrossRef]
  12. Gouveia, E.; Hokka, C.; Badino-Jr, A. The effects of geometry and operational conditions on gas holdup, liquid circulation and mass transfer in an airlift reactor. Braz. J. Chem. Eng. 2003, 20, 363–374. [Google Scholar] [CrossRef]
  13. Sastaravet, P.; Chuenchaem, C.; Thaphet, N.; Chawaloesphonsiya, N.; Painmanakul, P. Comparative Study of Mass Transfer and Bubble Hydrodynamic Parameters in Bubble Column Reactor: Physical Configurations and Operating Conditions. Environ. Eng. Res. 2014, 19, 345–354. [Google Scholar] [CrossRef]
  14. Kanaris, A.G.; Pavlidis, T.I.; Chatzidafni, A.P.; Mouza, A.A. The Effects of the Properties of Gases on the Design of Bubble Columns Equipped with a Fine Pore Sparger. ChemEngineering 2018, 2, 11. [Google Scholar] [CrossRef]
  15. Zhang, X.; Guo, K.; Qi, W.; Zhang, T.; Liu, C. Gas holdup, bubble behaviour, and mass transfer characteristics in a two-stage internal loop airlift reactor with different screens. Can. J. Chem. Eng. 2017, 95, 1202–1212. [Google Scholar] [CrossRef]
  16. Jia, X.; Hu, W.; Yuan, X.; Yu, K. Effect of surfactant type on interfacial area and liquid mass transfer for CO2 absorption in a bubble column. Chin. J. Chem. Eng. 2015, 23, 476–481. [Google Scholar] [CrossRef]
  17. Kracht, W.; Gomez, C.; Finch, J. Controlling bubble size using a frit and sleeve sparger. Miner. Eng. 2008, 21, 660–663. [Google Scholar] [CrossRef]
  18. Painmanakul, P.; Loubiere, K.; Hébrard, G.; Mietton-Peuchot, M.; Roustan, M. Effect of surfactants on liquid-side mass transfer coefficients. Chem. Eng. Sci. 2005, 60, 6480–6491. [Google Scholar] [CrossRef] [Green Version]
  19. Painmanakul, P.; Hébrard, G. Effect of different contaminants on the α-factor: Local experimental method and modeling. Chem. Eng. Res. Des. 2008, 86, 1207–1215. [Google Scholar] [CrossRef]
  20. Painmanakul, P.; Loubiere, K.; Hebrard, G.; Buffiere, P. Study of different membrane spargers used in waste water treatment: Characterisation and performance. Chem. Eng. Process. Process. Intensif. 2004, 43, 1347–1359. [Google Scholar] [CrossRef] [Green Version]
  21. Hebrard, G.; Zeng, J.; Loubiere, K. Effect of surfactants on liquid side mass transfer coefficients: A new insight. Chem. Eng. J. 2009, 148, 132–138. [Google Scholar] [CrossRef] [Green Version]
  22. Christi, M.Y. Airlift Bioreactors: Experimental Techniques of Investigation Into Bioreactors; Elsevier Applied Science: London, UK, 1989. [Google Scholar]
  23. He, Z.; Petiraksakul, A.; Meesapya, W. Oxygen-Transfer measurement in clean water. J. KMITNB 2003, 13, 14–19. [Google Scholar]
  24. Bouaifi, M.; Hebrard, G.; Bastoul, D.; Roustan, M. A comparative study of gas hold-up, bubble size, interfacial area and mass transfer coefficients in stirred gas–liquid reactors and bubble columns. Chem. Eng. Process. Process. Intensif. 2001, 40, 97–111. [Google Scholar] [CrossRef]
  25. Fogler, H.S. Elements of Chemical Reaction Engineering, 4th ed.; Pearson Education: London, UK, 2006. [Google Scholar]
  26. Levenspiel, O. Chemical Reaction Engineering; John Wiley & Sons: Hoboken, NJ, USA, 1998. [Google Scholar]
  27. Li, X.; Li, G.; Segovia-Hernandez, J.G. Modeling and Simulation of Hydrodynamic Bubble-Liquid Turbulent Flows in Bubble-Column Reactors. Chem. Eng. Technol. 2016, 39, 2380–2388. [Google Scholar] [CrossRef]
  28. Kalaga, D.V.; Pant, H.J.; Dalvi, S.V.; Joshi, J.B.; Roy, S. Investigation of hydrodynamics in bubble column with internals using radioactive particle tracking (RPT). AIChE J. 2017, 63, 4881–4894. [Google Scholar] [CrossRef]
  29. Al Ba’Ba’A, H.B.; Amano, R.S. A study of optimum aeration efficiency of a lab-scale air-diffused system. Water Environ. J. 2017, 31, 432–439. [Google Scholar] [CrossRef]
  30. Albdiri, A.D.Z.; Ojha, A.; Al-Dahhan, M.; Zmat, A.D. Study of Local Gas Holdup and Specific Interfacial Area in a Split-Column Airlift Bioreactor Using Sphosticated 4-Point Optical Probe for Culturing Microlgae/Cyanobacteria. Chem. Eng. Commun. 2014, 202, 892–898. [Google Scholar] [CrossRef]
  31. Yang, T.; Geng, S.; Yang, C.; Huang, Q. Hydrodynamics and mass transfer in an internal airlift slurry reactor for process intensification. Chem. Eng. Sci. 2018, 184, 126–133. [Google Scholar] [CrossRef]
  32. Bun, S.; Wongwailikhit, K.; Chawaloesphonsiya, N.; Lohwacharin, J.; Ham, P.; Painmanakul, P. Development of modified airlift reactor (MALR) for improving oxygen transfer: Optimize design and operation condition using ‘design of experiment’ methodology. Environ. Technol. 2019, 41, 2670–2682. [Google Scholar] [CrossRef]
  33. Yunos, M.A.S.M.; Halim, N.K.A.; Hussain, S.A. Investigations of bubble size, gas hold-up, and bubble rise velocity in quad-rilateral bubble column using high-speed camera. Am. J. Eng. Technol. Soc. 2017, 4, 1–18. [Google Scholar]
Figure 1. Experiment set-up of: (a) bubble column reactor (BCR); and (b) airlift reactor (ALR).
Processes 09 01765 g001
Figure 2. Five different gas diffusers used in this study: (a) F-sand, (b) C-sand, (c) H-0.3, (d) H-0.6, and (e) H-1.2.
Processes 09 01765 g002
Figure 3. Bubble size (D32) at different gas diffusers and Vg in: (a) BCR; and (b) ALR.
Processes 09 01765 g003
Figure 4. Captured images of bubble distribution at the bottom of both reactors in: (a) BCR; and (b) ALR.
Processes 09 01765 g004
Figure 5. Bubble rising velocity (UB) at different gas diffusers and Vg in: (a) BCR; and (b) ALR.
Processes 09 01765 g005
Figure 6. Specific interfacial area (a) at different gas diffusers and Vg in: (a) BCR; and (b) ALR.
Processes 09 01765 g006
Figure 7. Gas hold-up (εg) at different gas diffusers and Vg in: (a) BCR; and (b) ALR.
Processes 09 01765 g007
Figure 8. KLa coefficient at different gas diffusers and Vg in: (a) BCR; and (b) ALR.
Processes 09 01765 g008
Figure 9. Values of KLa coefficient at different gas diffusers and unit volume power consumption (P/V) in: (a) BCR; and (b) ALR.
Processes 09 01765 g009
Figure 10. KLa coefficient at different solid loading rates and diffuser types in (a) BCR and (b) ALR; KLa coefficient with and without solid media addition in (c) BCR and (d) ALR.
Processes 09 01765 g010aProcesses 09 01765 g010b
Figure 11. Gas hold-up (εg) with and without solid media addition in: (a) BCR; and (b) ALR.
Processes 09 01765 g011
Figure 12. Mean residence time values using F-sand diffuser at different: (a) superficial gas velocity and (b) media loading.
Processes 09 01765 g012
Figure 13. Exit age distribution as a function of time for different reactor types and media loading.
Processes 09 01765 g013
Table 1. Geometric parameters of all investigated gas diffusers.
ParameterF-SandC-SandH-0.3H-0.6H-1.2
Number of orifices (#)--757519
Orifice diameter (mm)0.08–0.150.20–0.250.30.61.2
Active surface area (cm2)39393939 39
Pitch area (mm2)--5.321.221.5
Table 2. Analysis of flow pattern with models.
ReactorMedia [v/v, %]Vg
[cm/s]
Mean Time, tm [min] *Compartment Model **Tank-in-Series
NTank [-]
Mixed Flow [%]Plug Flow [%]Dead Volume [%]
BCR00.06.1078.884.3316.791.77
0.36.3382.693.6713.631.80
0.66.4684.963.1711.871.77
1.26.6387.642.719.641.71
ALR00.06.2278.856.0315.121.59
0.36.9689.655.225.121.69
0.67.0090.964.544.491.67
1.27.1895.532.402.071.53
BCR100.06.9290.383.965.651.56
0.37.0692.753.513.731.60
0.67.1193.693.303.001.49
1.27.2295.433.011.551.52
ALR100.06.8384.958.206.841.45
0.37.1092.474.363.161.63
0.67.1994.163.921.911.59
1.27.3196.133.490.381.50
BCR50.67.0091.124.394.481.70
150.67.1193.693.303.001.49
250.67.0292.473.214.321.62
ALR50.67.1593.583.852.561.54
150.67.1994.163.921.911.59
250.67.0492.023.934.041.57
* Theoretical residence times of the columns were 7.33 min; ** The total column volume is 22 L.
Publisher’s Note: MDPI stays neutral with regard to jurisdictional claims in published maps and institutional affiliations.

