Article

The Influence of Variable CO2 Emission Tax Rate on Flexible Chemical Process Synthesis

by
Klavdija Zirngast
,
Zdravko Kravanja
and
Zorka Novak Pintarič
*
Faculty of Chemistry and Chemical Engineering, University of Maribor, Smetanova 17, SI-2000 Maribor, Slovenia
*
Author to whom correspondence should be addressed.
Processes 2021, 9(10), 1720; https://doi.org/10.3390/pr9101720
Submission received: 27 July 2021 / Revised: 13 September 2021 / Accepted: 22 September 2021 / Published: 25 September 2021

Abstract

:
The emission of greenhouse gasses is a major environmental problem, and efforts are being made worldwide in various ways to encourage producers to reduce their emissions. There is a need to incorporate environmental measures into process design and synthesis, as pollution prevention is a higher priority than waste management, and in this way, more sustainable solutions can also be achieved. One possibility is to introduce a CO2 tax, the value of which is very uncertain in the future. This paper demonstrates how the CO2 tax affects the optimal results of synthesizing chemical processes using mixed-integer nonlinear programming (MINLP). It was found that the tax increase promotes the use of better-quality raw materials and more efficient process units. Energy consumption and emissions are reduced and economic performance deteriorates. A multi-period, two-stage stochastic approach with recourse is suitable to incorporate the uncertainty of the CO2 tax in the MINLP process synthesis and gives better results than a simpler deterministic approach. In the case of the heat exchanger network synthesis, the costs obtained with the stochastic approach were 5% lower, and the emissions 7% lower than with a deterministic approach.

1. Introduction

One of the most troubling environmental threats is CO2 emissions [1] and the related problem of climate change [2]. Countries around the world are struggling to reduce CO2 emissions, which account for a large part of greenhouse gas (GHG) emissions [3]. According to the IEA, emissions in 2020 decreased by 4.8%, compared to the previous year, due to the COVID-19 pandemic [4]. Europe was the fourth-largest producer of GHG emissions in 2019 [5]. It was preceded by China, the USA, and India.
The European Union Emissions Trading System was introduced in 2005 to promote the reduction in greenhouse gas emissions in a cost-effective and economically efficient manner [6]. Taxes on greenhouse gas emissions have been shown to be beneficial in promoting the reduction of pollutant emissions [7]. With appropriate environmental instruments, governments can encourage investment in carbon capture, utilization, and storage technologies [8]. Imposing a carbon tax on coal and oil would increase the cost of electricity compared to cleaner electricity generation [9]. A tax policy that charges higher emissions encourages generators to reduce emissions [10] by adopting more modern technologies [11]. On the other hand, the introduction of energy efficiency measures in countries with high potential for efficiency improvements reduces emissions more than a carbon tax [12]. Compliance with GHG emission tax leads to sustainable processes and changes the way energy is supplied and used [13]. Energy consumption and emissions can be further reduced by integrating heat and power generation in the process [14].
Fossil fuels, which are used to generate heat and electricity and contribute most to global CO2 emissions [15], are expected to be replaced in the future by renewable energy sources such as solar and wind energy, thus reducing emissions [16]. Fossil fuels or non-renewable resources are mainly used for electricity generation, industry, and transportation. On the one hand, higher energy consumption is a consequence of economic growth and industrialization. On the other hand, the consumption of huge renewable and non-renewable resources leads to environmental problems: greenhouse gas emissions, ecological footprint, biodiversity loss, ecological deficits, etc. [17].
The level of CO2 taxation can have different effects on reducing emissions in different industrial sectors; energy-intensive industries are more susceptible to emissions taxes than other industries [18]. Some authors combine economic categories, such as operating costs, with environmental costs expressed, for example, as a carbon tax. The latter has a significant impact on the structure, the level of feedstocks, and the rates of carbon emission reduction in the supply chain synthesis problem [19]. Novak Pintarič et al. (2019) developed an indicator for a more detailed multi-objective analysis of Pareto process solutions in terms of variable carbon tax rates. Increasing the carbon tax rate shifts investment to a higher level and reduces the Pareto region. It also promotes a reduction in utility consumption and increases the savings and net present value of the synthesized heat exchanger network [20]. The latter is very important in the process industry, as heat exchanger networks enable rational energy use [21] and thus increase the competitiveness and the environmental [22] and energy efficiency of companies [23].
It is, therefore, important to include a tax on CO2 emissions already in the conceptual design and synthesis of sustainable processes, as this can reduce emissions during the construction and operation of the plant. However, it is difficult to predict the long-term values of the CO2 tax rate, as this area is highly volatile and influenced by a number of factors, such as economic, social, and political situations. Several recent studies address process design problems by considering CO2 tax rates, e.g., in processing plants [24], butanol production [25], olefin supply chains [26], and integrated supply networks [27].
A review of the literature shows that there are many developments in emission reduction technologies and emission evaluations [28], but little is known about how emission taxation affects the synthesis of processes, both in design and operation. There is also a lack of systematic optimization methods to incorporate a CO2 tax, which is still quite uncertain and will certainly change in the future, into the synthesis of flexible chemical processes. In this work, we used a mixed-integer nonlinear programming (MINLP) approach that allows the systematic synthesis of processes [29] and processing of subsystems, such as heat exchanger networks [30], under variable input parameters. These problems are essentially nonlinear, and MINLP optimization can be used to efficiently determine discrete and continuous variables simultaneously, leading to feasible and optimal process solutions. The aim of this work was to fill the gap in using a systematic MINLP approach for synthesizing chemical processes under variable CO2 taxes and to demonstrate the effects of CO2 emission tax on the obtained optimal chemical processes. Based on these findings, a method for synthesizing long-term optimal and flexible low-carbon processes under variable and uncertain CO2 tax rates was developed.

2. Methods

In this work, a mixed-integer nonlinear programming (MINLP) synthesis approach was used for process synthesis under variable CO2 emission tax rate. A general mathematical model (1) [31] allowed simultaneous optimization of process unit selection (topology), process unit sizes, and operating and control variables. In this problem, there was also an uncertain parameter—namely, the CO2 emission tax. The variables in the model (1) were divided into the following two groups:
  • The first-stage variables (topology and size of the process) were the same for all CO2 taxes and were determined in advance;
  • The second-stage variables (operating and control variables) were adjusted later when the values of the CO2 tax were known.
Z = min ( c T y + f ( d , x , θ CO 2 ) ) s .   t . h ( d , x , θ CO 2 ) = 0 g ( d , x , θ CO 2 ) + B y 0 A y a d , x 0 , y { 0 , 1 }
where
  • Z objective variable;
  • y first-stage binary variables for selection of topological process alternatives;
  • d first-stage design variables for sizes of process units;
  • x second-stage control and operating variables;
  • A matrix of constants;
  • a vector of constants;
  • B matrices of constants;
  • cT fixed cost;
  • f variable cost function;
  • g inequality constraints;
  • h equality constraints;
  • θ CO 2  uncertain parameter-CO2 tax.
A characteristic of this model is that a parameter θ CO 2 , which is a real number, can take infinitely many values between specified lower and upper bounds. Therefore, this problem cannot be solved directly but requires discretization of the uncertain parameter values. This means selecting a finite number of values for the CO2 emission tax, estimating their probabilities, and solving the corresponding mathematical problem for multiple scenarios. Four approaches to incorporate CO2 emission tax in process synthesis were established and tested on two chemical engineering case studies: (i) deterministic approach, (ii) modified deterministic approach, (iii) stochastic approach considering different CO2 taxes in one period, and (iv) stochastic approach considering different taxes on CO2 emissions over several periods.

2.1. Deterministic Approach

In the deterministic approach, the first-stage variables were determined using the expected value of the CO2 tax, as shown in the one-scenario problem (2):
Z = min ( c T y + f ( d , x , θ ¯ CO 2 ) ) s .   t . h ( d , x , θ ¯ CO 2 ) = 0 g ( d , x , θ ¯ CO 2 ) + B y 0 A y a d , x 0 , y { 0 , 1 }
where
  • θ ¯ CO 2  the expected value of CO2 emission tax (EUR/t CO2 equivalent).
The obtained optimal values of the first-stage variables were then fixed, and the second-stage variables were determined by solving the one-scenario problem (3) at different values of the CO2 tax.
Z t = min ( c T y ¯ opt + f ( d ¯ opt , x t , θ CO 2 , t ) ) s .   t . h ( d ¯ opt , x t , θ CO 2 , t ) = 0 g ( d ¯ opt , x t , θ CO 2 , t ) + B y ¯ opt 0 t T A y ¯ opt a x 0
where
  • y ¯ opt  optimal values of binary variables determined with problem (2);
  • d ¯ opt  optimal values of design variables determined with problem (2);
  • t index of scenarios, i.e., different values of CO2 tax rates;
  • T set of CO2 tax values; T = {t; t = 1, 2, …, Nt};
  • Zt objective variable at scenario t;
  • Nt the number of CO2 tax values selected.
The values of the objective variable obtained at different CO2 tax rates (Zt) are multiplied by their probabilities, and the deterministic expected value of the objective function is obtained, as shown in Equation (4).
E ( Z deter ) = t T p r t Z t
where
  • E(Zdeter) deterministic expected value of an objective variable;
  • prt probability of emission tax value t.

2.2. Deterministic Approach with Possible Correction of the First-Stage Variables

The approach described in the previous section is conservative in the sense that it does not allow for any adjustment of the first-stage variables with respect to the actual realization of the CO2 tax value in the future. In practice, however, some changes and process modifications are usually possible, which are designed as process reconstruction or retrofit. A modified approach was, therefore, proposed in which the values of the first-stage variables are determined at the initial value of the CO2 tax using problem (2), and then the values of the design variables at the specific CO2 tax rate can be modified (Δdt) using problem (5). In this problem, the design variables of those process units that were determined in the previous step with problem (2) can be increased. New units can also be added, which are determined by optimizing the binary variables in (5). The increases in the design variables are limited by the upper bound since in practice retrofitting is often only possible within the limits of certain physical dimensions.
Z t = min ( c T y + f ( d d + Δ d t , x t , θ CO 2 , t ) ) s .   t . h ( d d + Δ d t , x t , θ CO 2 , t ) = 0 g ( d d + Δ d t , x t , θ CO 2 , t ) + B y 0 t T A y a , Δ d t U Δ d t , x t 0 , y { 0 , 1 }
where
  • dd values of design variables obtained at the initial (expected) value of CO2 tax;
  • Δdt increase of design variables at a given value of CO2 tax;
  • U upper bound for the changes in design variables.

2.3. A Stochastic Approach with Different CO2 Emission Taxes within a Single Time Period

Deterministic approaches consider different emission tax rates sequentially, which usually does not allow to establish optimal synergies between first- and second-stage variables, and the obtained results may not be optimal in the long run. Therefore, a stochastic approach was introduced in which the scenarios are considered simultaneously during the optimization. The hypothesis was that the simultaneous approach would provide better optimal results by establishing an appropriate trade-off between the first- and second-stage variables. The stochastic MINLP synthesis is formulated as a two-stage multi-scenario problem with recourse (6), where the index t represents the CO2 emission tax rates that determine several possible scenarios within the same time period. Tax rates (scenarios) can be determined using, e.g., Gaussian quadrature points.
The first-stage variables y and d are the same for all CO2 tax values and are therefore not indexed over the set of scenarios. The second-stage variables are adjusted for each CO2 tax value and are therefore indexed over the set tT. The expected value of the objective variable is obtained simultaneously at different tax values by multiplying the part of the objective function f by their probabilities, prt. If the CO2 tax is a single uncertain parameter, the number of scenarios would be moderate, and the multi-scenario problem (6) can usually be solved simultaneously with manageable computer effort.
E ( Z ) = max ( c T y + t p r t f ( d , x t , θ CO 2 , t ) ) s .   t . h ( d , x t , θ CO 2 , t ) = 0 g ( d , x t , θ CO 2 , t ) + B y 0 t T A y a d , x t 0 , y { 0 , 1 }

2.4. A Stochastic Approach with Varying CO2 Emission Taxes over Multiple Time Periods

Tax rates on CO2 emissions are expected to be in phases, increasing over the long run. The goal was, therefore, to synthesize an optimal process under variable CO2 tax rates over several time periods in which different distributions of CO2 tax rates are expected. To accomplish this task, a multi-period multi-scenario two-stage stochastic problem with recourse was formulated (7).
E ( Z ) = max ( c T y + t p p r t , p f ( d , x t , p , θ CO 2 , t , p ) ) s .   t . h ( d , x t , p , θ CO 2 , t , p ) = 0 t T g ( d , x t , p , θ CO 2 , t , p ) + B y 0 p P A y a d , x t , p 0 , y { 0 , 1 }
where
  • p index of time periods;
  • P set of time periods; P = {p; p = 1, 2, …, Np};
  • Np number of time periods.
The synthesis of the process with the problem (7) is performed simultaneously for different values of the CO2 emission tax in several time periods. The second-stage variables are indexed by the index of CO2 tax rates, t, and by the time periods, p. The size of problem (7), measured by the number of conditional constraints and variables, is about t × p times that of problem (2).

3. Results

The objectives of the study were i) to investigate how the tax on CO2 emissions affects the MINLP synthesis of processes and ii) to develop a methodology for the synthesis of processes that takes into account the uncertainty in the values of this tax. Case studies of a chemical production process and a heat exchanger network synthesis were used to illustrate different approaches. Both examples presented in this paper represent an extended version of the authors’ earlier work [32].

3.1. Influence of CO2 Emission Tax on the Process Synthesis

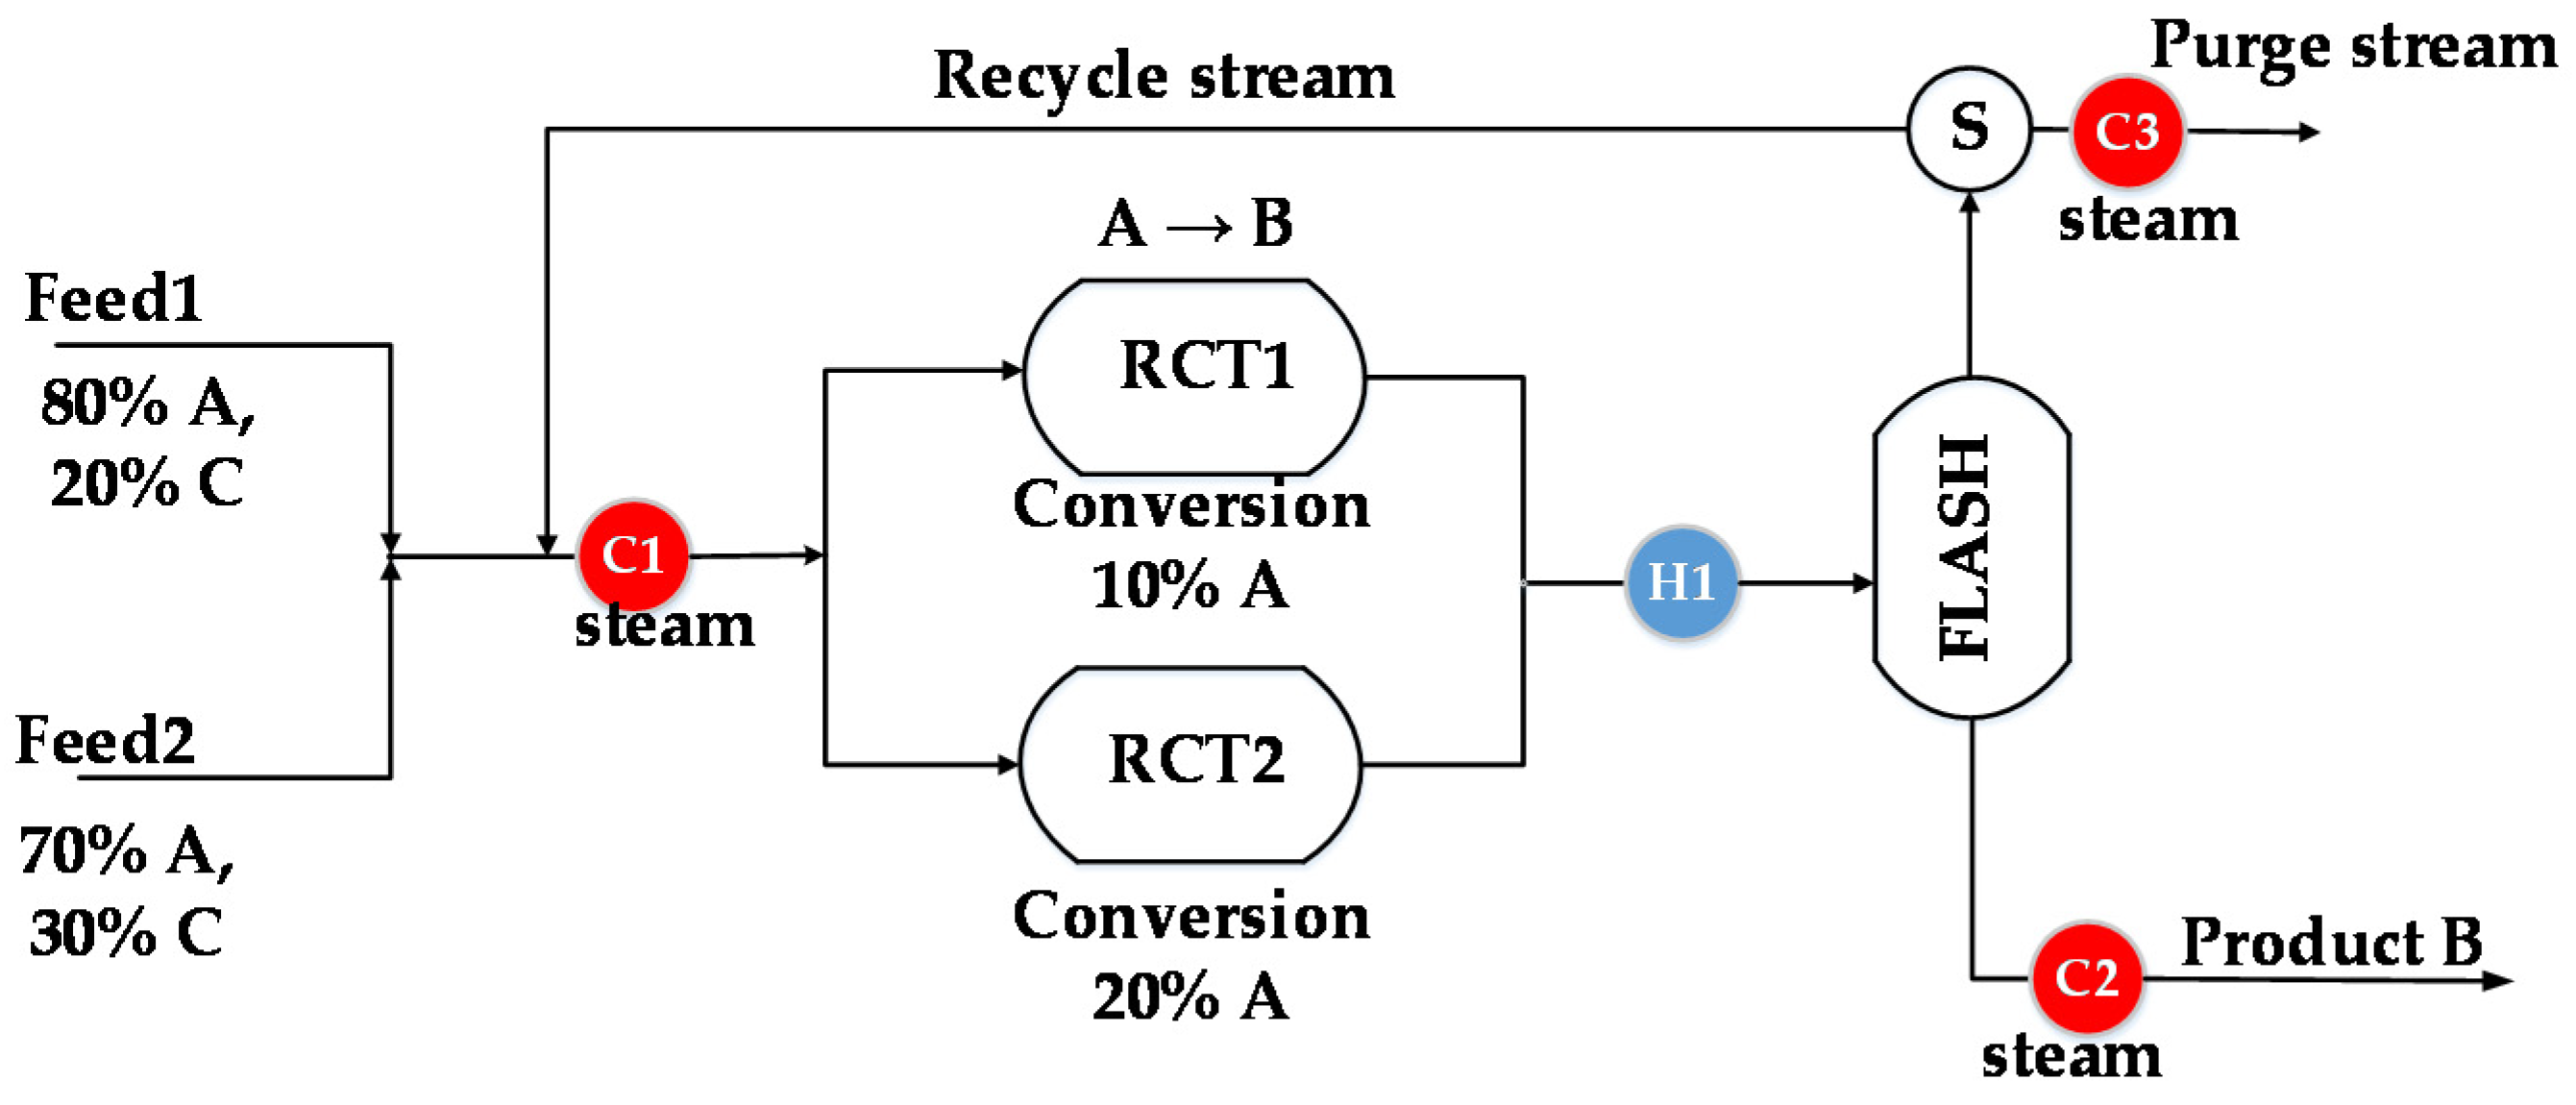
The process superstructure for the production of chemical B is shown in Figure 1. There were two feeds to choose from: the more expensive Feed 1 contained 80% of reactant A and 20% of inert component C, while Feed 2 was cheaper and contained 70% of reactant A and 30% of inert component C. The selected feed was mixed with the recycled stream and heated in unit C1 before entering the reactor. Two alternative reactors were available in which reactant A was converted to product B. Reactor RCT1 was cheaper since the conversion of reactant A was 10%, while reactor RCT2 was more expensive, with a 20% conversion. The effluent from the reactor was cooled in unit H1 and sent to a separator (FLASH). Product B was obtained in the liquid phase, and unreacted reactant A and inert component C in the gaseous phase. Part of this stream was recycled, while the other part was purged to prevent the accumulation of the inert component in the process. The proportion of the purge stream was optimized.
A greenhouse effect was assumed for the chemicals in the feed stream, the purge stream, and the product. Heaters C1, C2, and C3 use a hot utility, which also contributes to the total greenhouse gas (GHG) emission of the process. The process synthesis was modeled as an MINLP problem. The profit was maximized, which is the difference between the revenue from product sales and the cost of raw materials, utilities, depreciation, and CO2 emission tax.
A process synthesis for profit maximization under different rates of CO2 emission tax was performed. Two variants were investigated: (i) without heat integration, in which all heating and cooling demand was met by utilities and (ii) with heat integration of the process, in which maximum heat exchange between process streams was sought [21]. For comparison, a synthesis with minimization of GHG emissions was also performed.
The results of the synthesis of the thermally nonintegrated process are presented in Table 1. In terms of topological choices, the more expensive feedstock and reactor were chosen for all CO2 tax values.
In the case of profit maximization, the investment, the overall conversion, the recycle stream, and the utility consumption increased as the CO2 emission tax increased, while the purge stream, the total GHG emissions, and the profit decreased. In the case of GHG emissions, a trade-off was established between the consumption of hot utility and the amount of GHG component in the purge stream. The impact of the latter was greater in this case, as the purge stream was reduced when the CO2 emission tax was increased, while the consumption of hot utility increased.
At a very high CO2 tax rate, the total GHG emission approached the value obtained by minimizing emissions. The profit became negative when the value of the CO2 emission tax exceeded 14 EUR/t.
In the synthesis of the heat-integrated process (Table 2), an integrated model of Duran and Grossmann [33] was used. At a low value of CO2 emission tax (0 and 10 EUR/t), a cheaper Feed 2 with a lower amount of reactant A and a more expensive reactor (RCT2) with a higher conversion were chosen. As the emission tax increased, a more expensive Feed 1 was selected. When minimizing the total GHG emissions, the highest investment and conversion were obtained, while the lowest consumption of hot utility and raw material, as well as the total GHG emissions, were achieved.
The obtained results are shown graphically in Figure 2, Figure 3, Figure 4, Figure 5 and Figure 6. Figure 2 shows the total CO2 emissions under different CO2 tax rates. The heat-integrated process has significantly lower CO2 emissions than the nonintegrated process. For the integrated process, the GHG emissions are high only at low CO2 tax values because the cheaper raw material with lower content of reactant A was selected. At a CO2 tax value higher than 7 EUR/t, GHG emissions are significantly reduced.
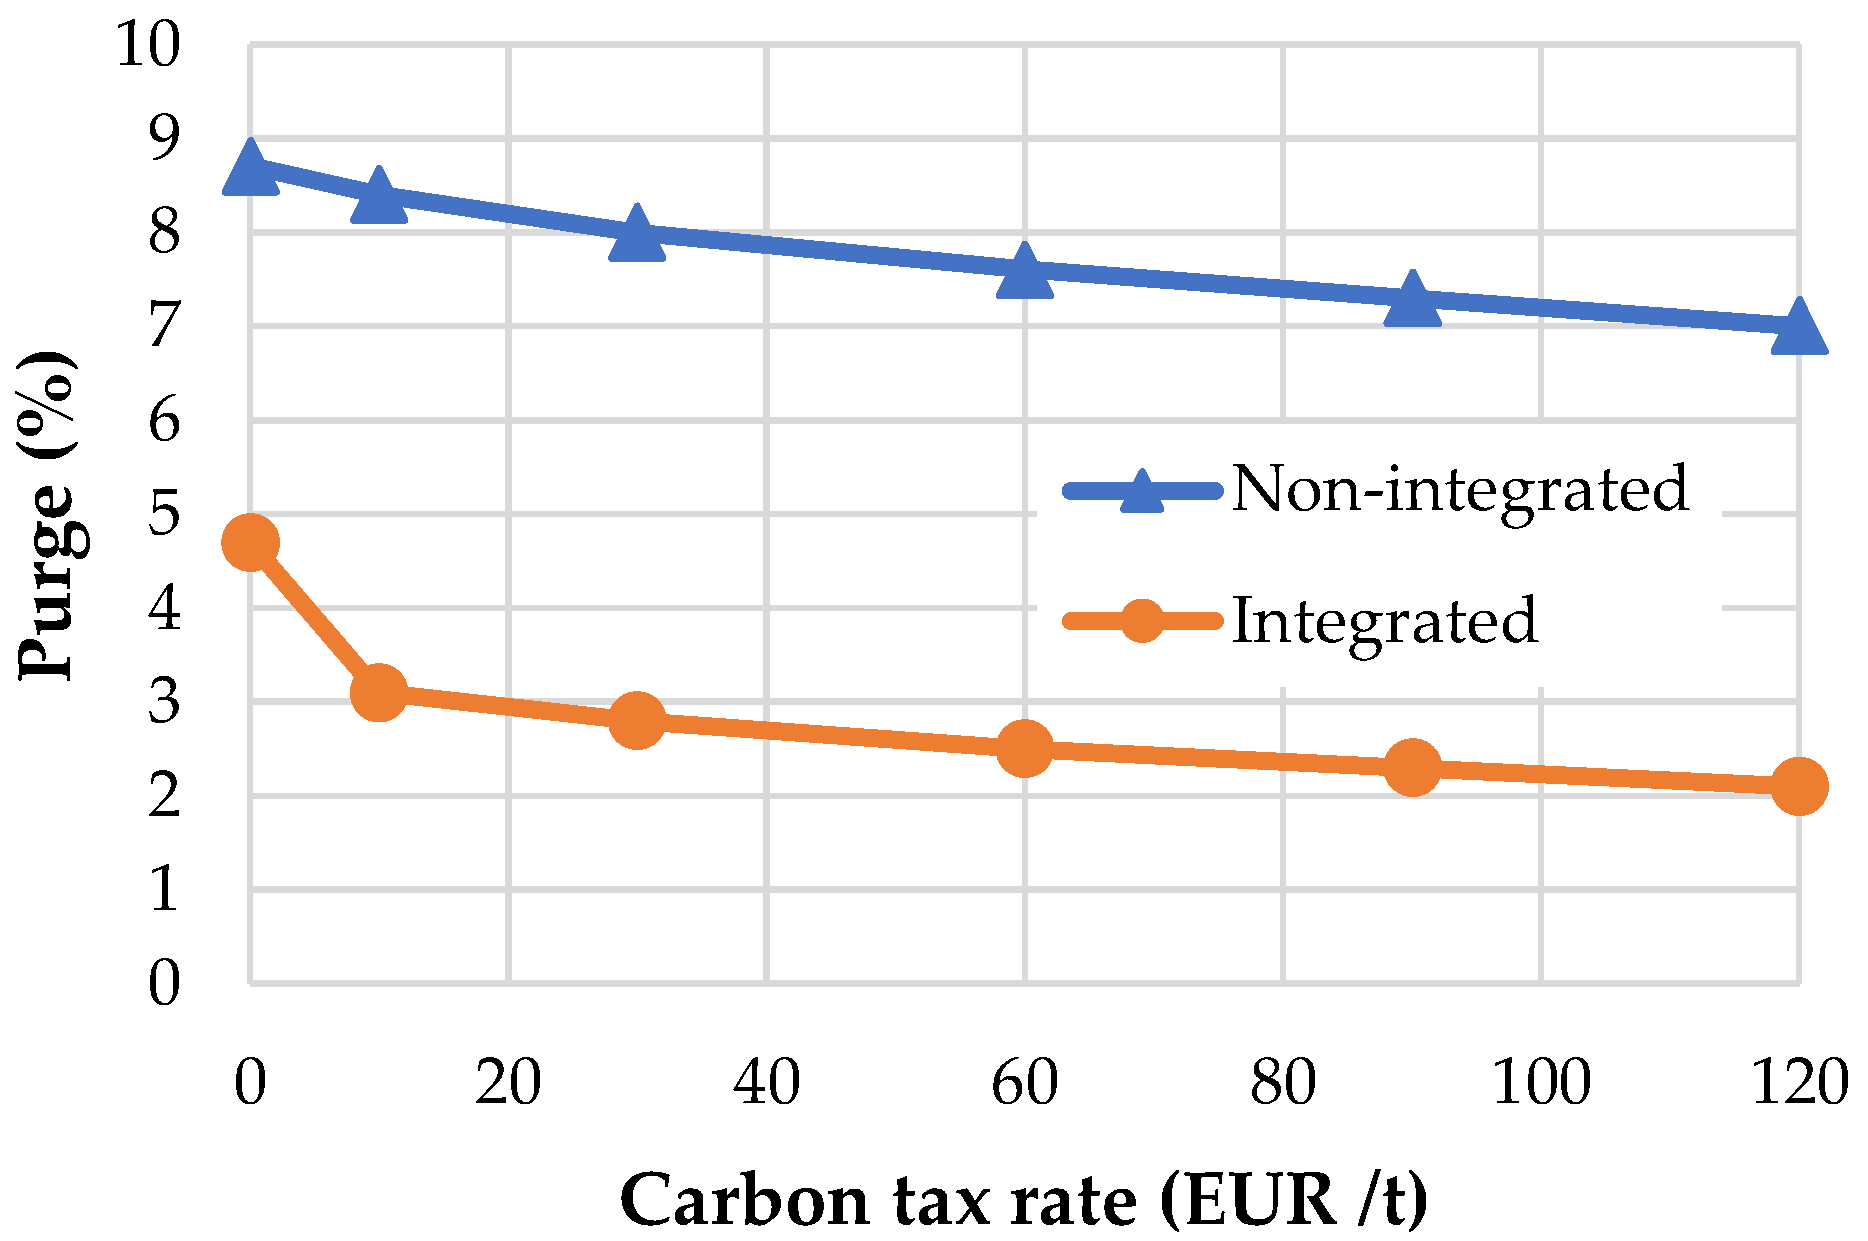
The percentage of the stream that is purged at different CO2 emission tax rates is shown in Figure 3. A larger fraction of the purge occurs in the nonintegrated process. The difference between the purge fraction in the nonintegrated and integrated process at higher CO2 tax rates is about 5 percentage points. At lower CO2 tax rates, the difference is smaller due to the higher emissions caused by choosing a cheaper raw material.
The total conversion of reactant A increases with the CO2 emission tax, as shown in Figure 4. The conversion in the process with heat integration is 13% higher than in the process without heat integration.
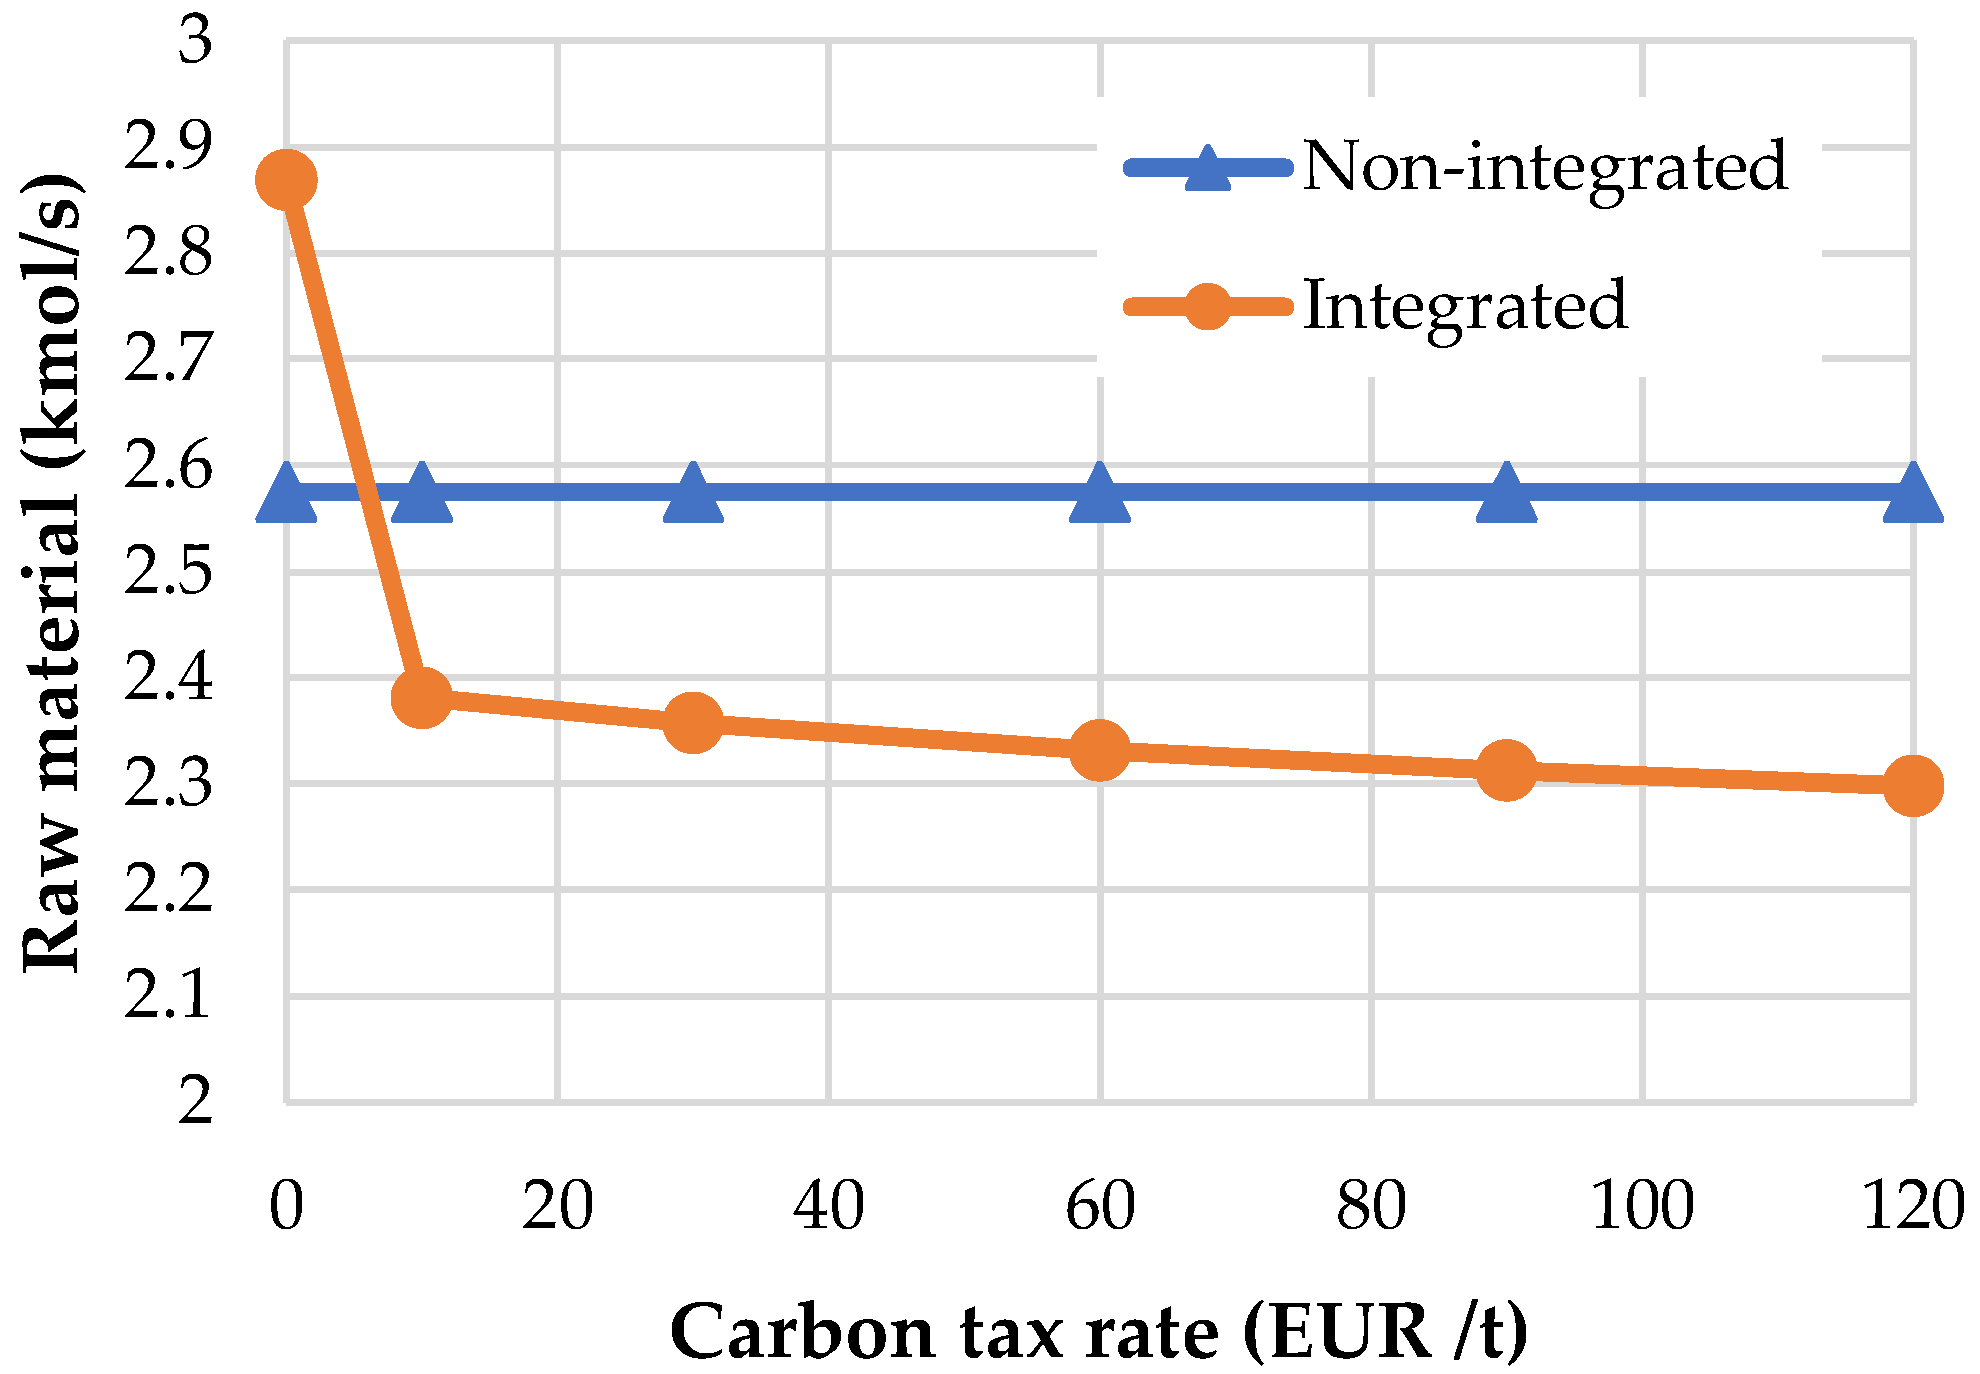
The flow rate of the feed stream at different CO2 tax rates is shown in Figure 5. The heat-integrated process requires less raw material than the nonintegrated process, except at very low CO2 tax rates, when a cheaper feedstock is chosen in the integrated process. Higher CO2 tax rates encourage lower feedstock consumption and more efficient reactant conversion.
Figure 6 shows the investment under different CO2 tax rates. The investment of the heat-integrated process is higher than that of the nonintegrated process and increases with the increase of the CO2 emission tax. It is also higher when a cheaper feed stream with a lower content of raw material A is chosen.

3.2. Process Synthesis under Variable CO2 Emission Tax Rate

The first part of the study has shown that the values of the CO2 tax rate have a significant impact on the topological and operational variables in optimal process solutions. Since the value of the CO2 emission tax is uncertain in the future, the next part of the study tested different approaches to account for this uncertainty in the process synthesis. The process synthesis problem was extended by the following strategies:
  • Considering multiple values of CO2 tax rates within one period;
  • Introducing multiple periods with specific tax values to synthesize an optimal process over a longer period;
  • Performing a deterministic synthesis of the process for comparison.

3.2.1. One-Period Process Synthesis under Variable CO2 Tax Rate

The aim of this part of the study was to set up a one-period process model with simultaneous consideration of several CO2 taxes (scenarios) and to test how different probabilities of these scenarios affect the optimal result. Three CO2 tax values, 10 EUR/t, 60 EUR/t, and 120 EUR/t, and three combinations of probabilities within a period were assumed, as shown in Table 3, to investigate the impact of the probability distribution on the results of the multi-scenario process synthesis. The MINLP synthesis model for the heat-integrated process was solved for each combination simultaneously at three emission tax values. Expected profits fell enormously as the probability of a higher CO2 tax value increased.

3.2.2. Multi-Period Synthesis under Variable CO2 Tax Rate

Since emissions and associated taxes occur over a longer period of time, it may be useful to treat multiple periods in the model. The duration of the period can be arbitrarily determined as the period over which a particular distribution of the CO2 tax rate is expected. In this study, we introduced three periods, and in each of these periods, three different values of the CO2 tax were assumed with corresponding probabilities (Table 4). Lower CO2 tax values would tend to occur in the early periods, while higher CO2 tax rates would take effect later. The process synthesis problem was solved simultaneously for nine scenarios.
The expected profit (loss) of the nonintegrated process was −57,324 k EUR/y (Table 5), the investment was 1610 kEUR, and the more expensive raw material and the reactor with higher conversion were chosen. The same choice was made in the case of the heat-integrated process, but in this case, the investment and the expected profit were significantly higher.

3.2.3. Deterministic Synthesis under a Variable CO2 Tax Rate

The average value of the CO2 emission tax over the three periods, calculated based on the probabilities in Table 4, is 56 EUR/t. For this value of the CO2 tax, the first-stage variables, i.e., the choice of the feed stream, reactor type, and its size, were determined. Then, for the fixed values of the first-stage variables and the investment obtained, the second-stage variables (flow rates of the streams, hot and cold utility consumptions) were calculated for all individual values of the tax rate. The problems were solved in the framework of the General Algebraic Modeling System (GAMS) [34], using the DICOPT solver as the MINLP solution algorithm. The results are shown in Table 6 and Table 7.
The profits obtained at different values of CO2 tax rates were multiplied by the total probability of an individual CO2 tax value over all three periods, yielding deterministic expected values of the profit.
Synthesis of nonintegrated process:
24,594 − 0.3833 + (−64,580) − 0.3633 + (−171,591) − 0.2533 = −57,482 kEUR/y
Synthesis of heat-integrated process:
109,149 − 0.3833 + 45,988 − 0.3633 + (−29,804) − 0.2533 = 50,999 kEUR/y
The expected loss calculated by the deterministic approach, in the case without heat integration, (−57,482 kEUR/y) is slightly more negative than the expected loss of the stochastic approach (−57,324 kEUR/y) reported in Table 5. The expected profit of the optimal heat-integrated process obtained by the deterministic approach (50,999 kEUR/y) is lower than the expected profit of the process obtained by the stochastic approach (51,253 kEUR/y, Table 5).
In both cases, the stochastic approach gave a slightly better result than the deterministic approach, indicating the advantage and importance of stochastic optimization in process synthesis under uncertain CO2 tax rates.

3.3. Synthesis of Heat Exchanger Network under Variable CO2 Emission Tax Rate

The effect of the tax rate on CO2 emissions has also been studied in the synthesis of the heat exchanger network (HEN), where very good trade-offs between operating costs and investment are established in an MINLP synthesis model by Yee and Grossmann [25]. The studied HEN consisted of two hot streams and three cold streams [20]. Inlet temperatures (Ts), outlet temperatures (Tt), heat capacity flow rates (CF), and heat transfer coefficients (α) are shown in Table 8.
The objective function was to minimize the total annual cost (TAC), which consisted of the annual investment cost (depreciation), operating cost, and CO2 emission tax. The GHG emissions came from the consumption of the hot utility and from the manufacturing of the heat exchangers, the latter being estimated according to the investment of HEN [35].
The values of CO2 emission tax in the three periods were provided in the range from 10 EUR/t to 120 EUR/t. Five values (15.2, 35.4, 65.0, 94.8, and 114.8) EUR/tCO2 that correspond to zeros of the Legendre polynomial of the fifth order were used [36]. It was assumed that lower CO2 tax values would be more likely at the beginning, while higher CO2 tax values are more likely in the later period. For the probabilities of the CO2 tax values, a beta distribution was assumed defined by the parameters (α, β) for periods 1, 2, and 3 as follows: (2, 6), (3, 3), and (7, 3). The problems were solved in GAMS [34] using an SBB solver.

3.3.1. Synthesis of HEN for Equal Time Periods

In the first step, we assumed three time periods of equal length, which means that each period contributes the same proportion (1/3) to the expected value. The results obtained with the four approaches, described in Section 2, are presented in Table 9.
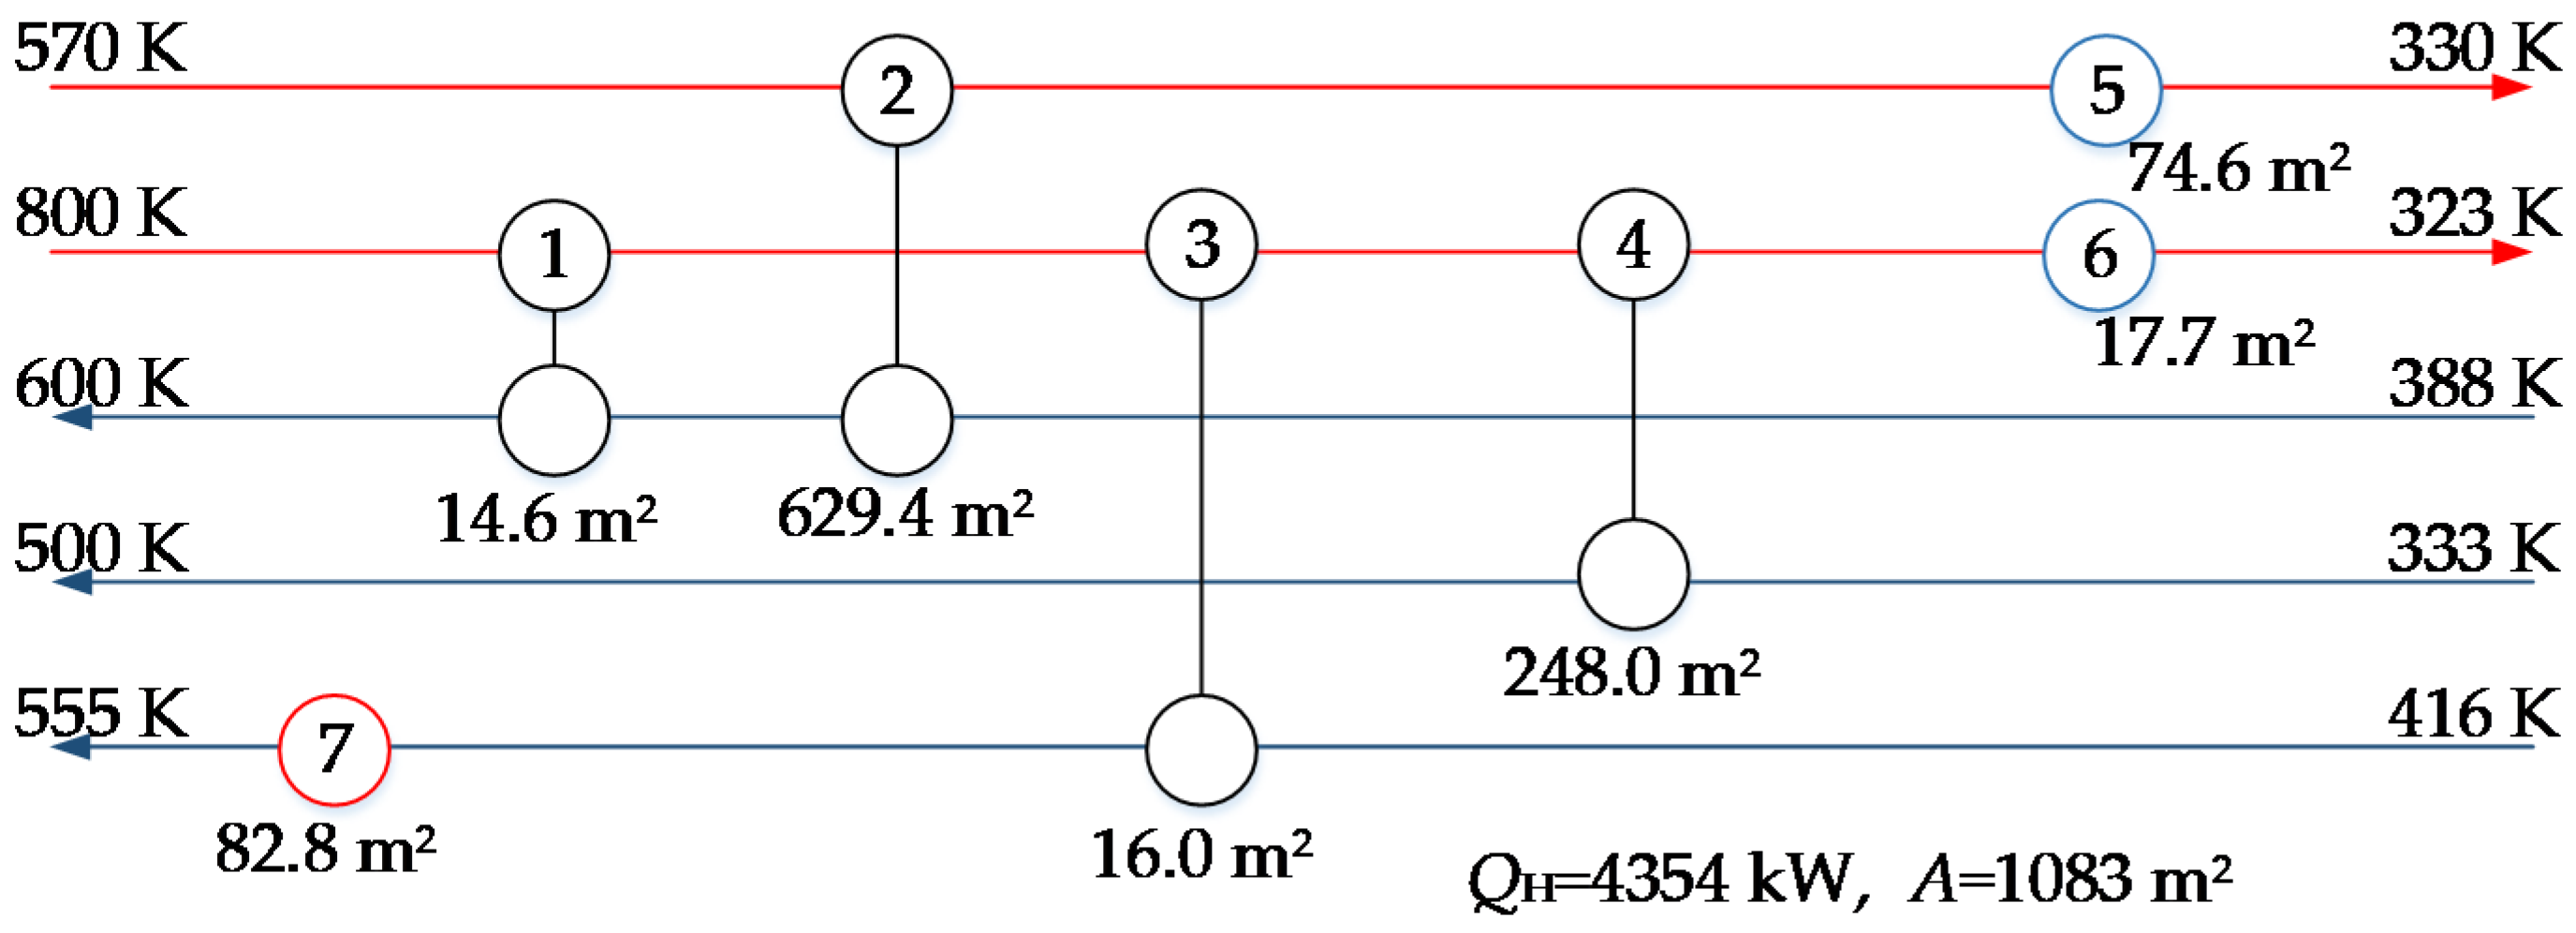
The flexible heat exchanger network determined using the deterministic approach (Figure 7) has a total area of 1083 m2, the expected hot utility consumption is 4354 kW, and the expected cost over three periods is 1,730,303 EUR/y. The network consists of seven process units, of which four are heat exchangers, two are coolers, and one is a heater. The same network topology was obtained using a modified deterministic approach, but the total area was increased by 2.3%, or 25 m2.
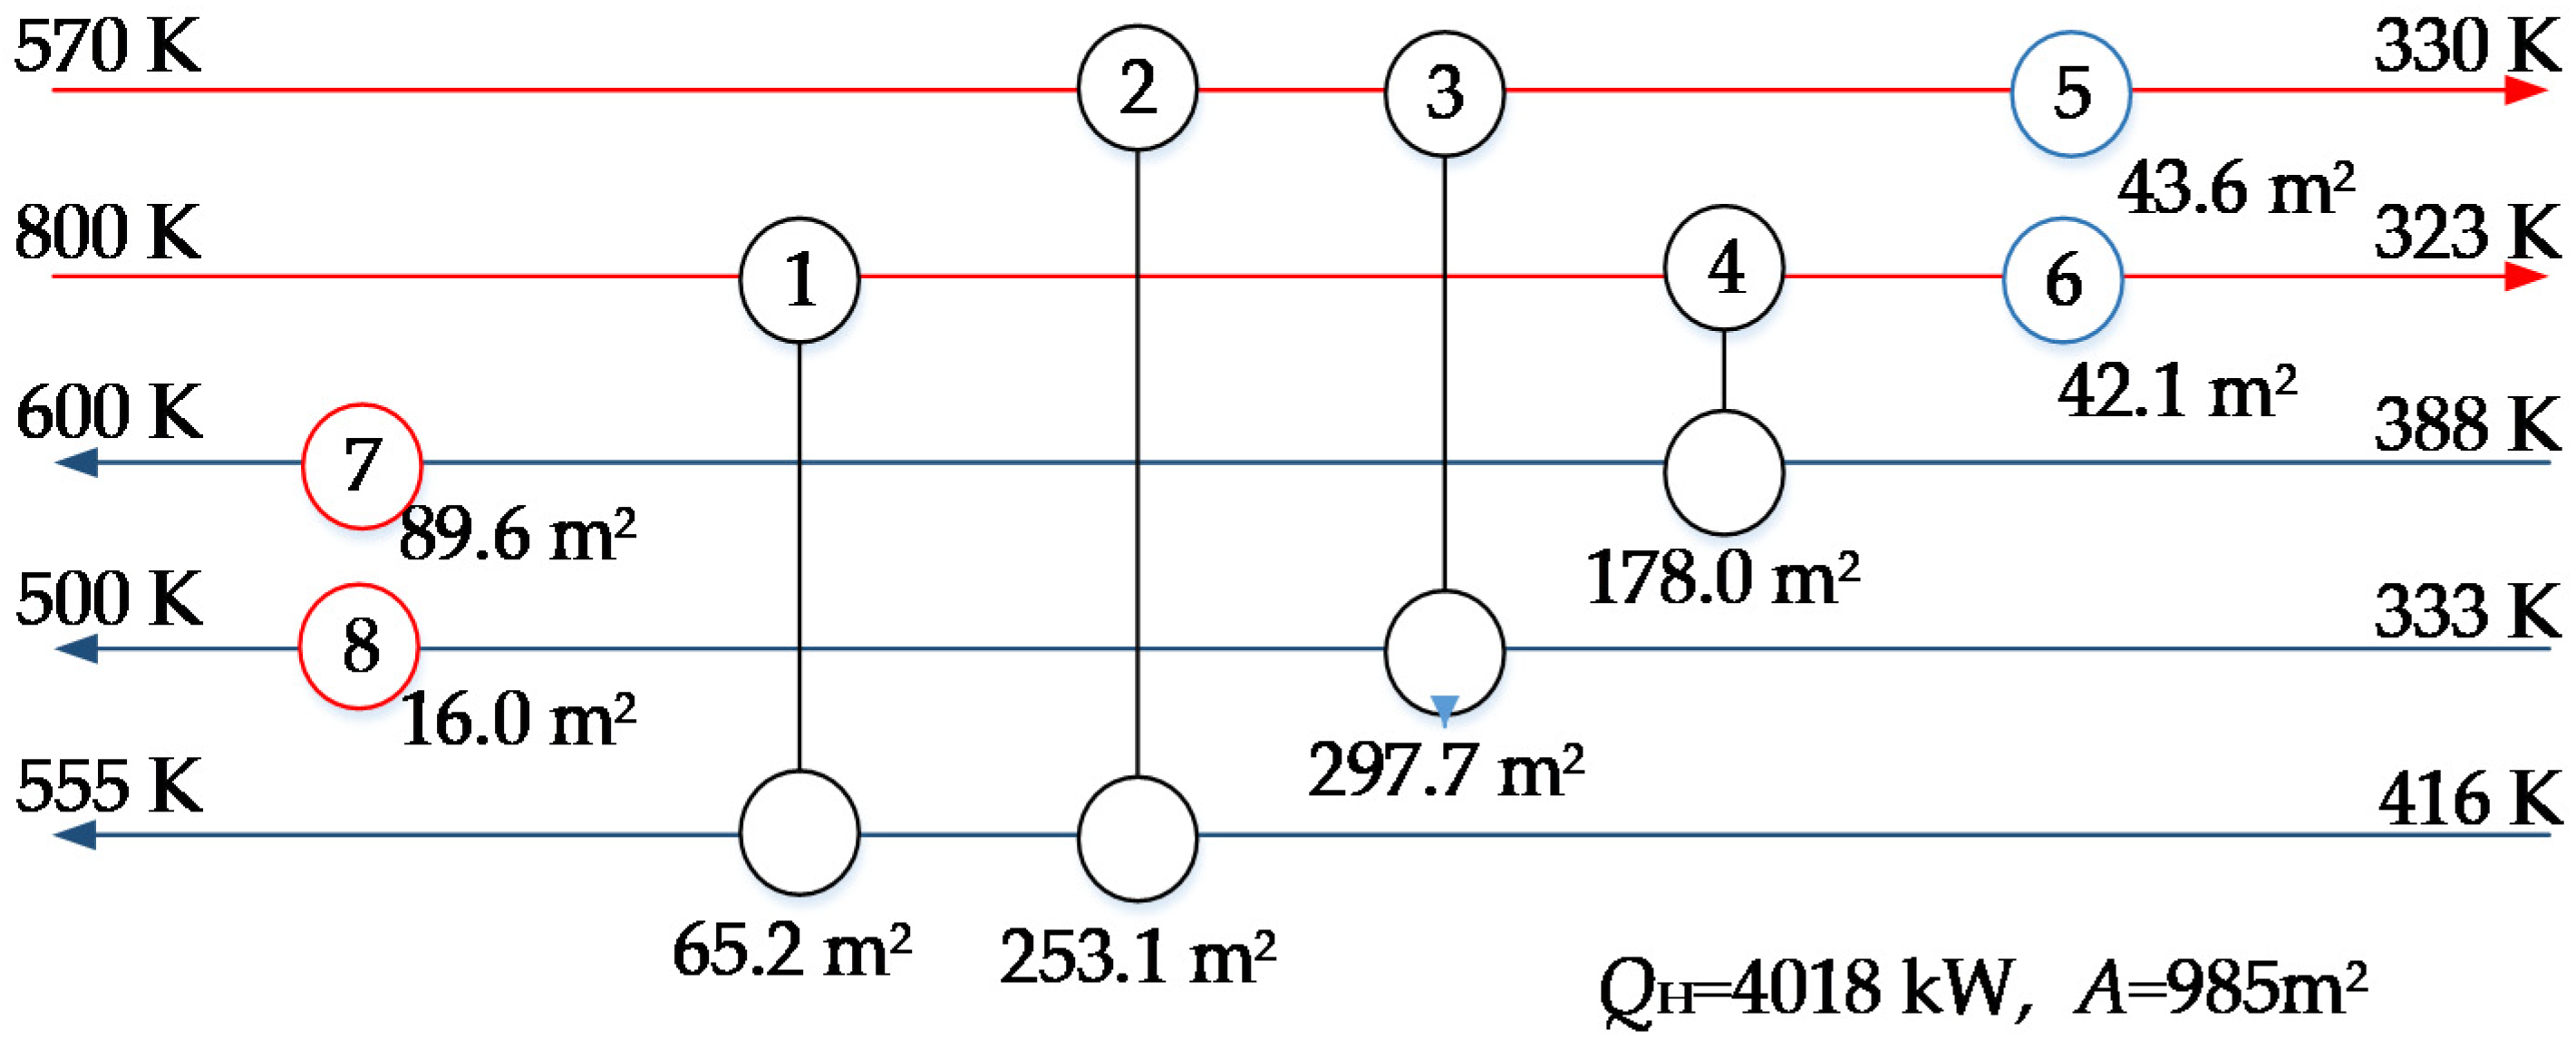
A flexible network obtained using a multi-scenario approach with Gaussian quadrature (Figure 8) has a total area of 985 m2, the expected hot utility consumption is 4018 kW, and the total expected cost is 1,646,609 EUR/y.
A network obtained with a stochastic approach has one more unit than with a deterministic approach but a lower area and utility consumption. The total GHG emissions of the stochastic approach are 7.4% lower than the GHG emissions of the deterministic approach.

3.3.2. Synthesis of HEN for Different Time Periods

In the second step, we assumed that the three periods are of different lengths, i.e., the first period is the longest and the last the shortest, since it is realistic to assume that higher taxes will not be enforced very soon. We assumed that the duration of the periods is in the ratio 2.333:1.666:1. The results are shown in Table 10.
A comparison of the results in Table 9 and Table 10 shows that the expected TAC values are lower in the case in which a longer duration of the first period with a lower value of the CO2 tax was assumed. In the case of a stochastic multi-period approach, the topology of the network (Figure 9) is different from Figure 8. The network consists of eight process units, of which three are heat exchangers, two are coolers, and three are heaters. The total area is slightly lower. In the case of the deterministic approach, the network topology is the same as in Figure 7.
Both variants of this case study confirmed that a simultaneous multi-scenario approach leads to lower total cost and lower emissions than a deterministic approach. It is, therefore, important to use stochastic methods to integrate the CO2 tax into the long-term synthesis of optimal processes.

4. Conclusions

In this paper, the influence of the CO2 emission tax rate on the synthesis of chemical processes and other process systems was presented using the MINLP approach. Methods for synthesizing long-term optimal and flexible processes considering the uncertain CO2 tax rate were also demonstrated, ranging from a deterministic approach to a single-period stochastic approach, to a multi-period multi-scenario stochastic approach.
The results show that an increase in the CO2 tax increases the conversion of reactants, reduces the consumption of raw materials, increases investment, and, consequently, worsens the economic performance of the process. A higher tax rate encourages the use of more efficient process units, e.g., reactors with higher conversion, raw materials with lower levels of impurities, networks with a higher degree of integration.
The synthesis of a flexible process under an uncertain CO2 tax rate was formulated as a deterministic and stochastic problem, as well as a multi-scenario and multi-period problem that takes into account the longer time period in which the CO2 tax changes.
The result of this approach is an optimal flexible process that can adjust over time to the variable value of the CO2 tax. The study showed the advantage of the stochastic approach over the deterministic one, as the stochastic approach achieves better-expected values of the optimization criterion. Greenhouse gas emissions were also noticeably lower, by 7% in the case of the HEN synthesis.

Author Contributions

Conceptualization, Z.N.P.; methodology, K.Z. and Z.N.P.; software, K.Z.; validation, K.Z., Z.N.P. and Z.K.; writing—original draft preparation, K.Z.; writing—review and editing, Z.N.P.; supervision, Z.N.P. and Z.K. All authors have read and agreed to the published version of the manuscript.

Funding

This research was co-funded by the Slovenian Research Agency (PhD research grant MR-39209, program P2-0032, and project J7-1816). The authors are grateful for the financial support.

Institutional Review Board Statement

Not applicable.

Informed Consent Statement

Not applicable.

Data Availability Statement

Not applicable.

Conflicts of Interest

The authors declare no conflict of interest.

References

  1. Intergovernmental Panel on Climate Change. Special Report. Available online: https://www.ipcc.ch/report/sixth-assessment-report-cycle/ (accessed on 27 November 2020).
  2. Dupont, A. The strategic implications of climate change. In ASEAN-India-Australia, 1st ed.; Tow, W.T., Chin, K.W., Eds.; ISEAS Publishing: Singapore, 2009; pp. 131–152. [Google Scholar]
  3. Pata, U.K. Renewable energy consumption, urbanization, financial development, income and CO2 emissions in Turkey: Testing EKC hypothesis with structural breaks. J. Clean Prod. 2018, 187, 770–779. [Google Scholar] [CrossRef]
  4. Global Energy Review: CO2 Emissions in 2020; Understanding the Impacts of Covid-19 on Global CO2 Emissions. Available online: https://www.iea.org/articles/global-energy-review-co2-emissions-in-2020 (accessed on 19 July 2021).
  5. China’s Greenhouse Gas Emissions Exceeded the Developed World for the First Time in 2019. Available online: https://rhg.com/research/chinas-emissions-surpass-developed-countries/ (accessed on 17 July 2021).
  6. European Union Emissions Trading System (EU ETS). Available online: https://www.emissions-euets.com/carbon-market-glossary/872-european-union-emissions-trading-system-eu-ets (accessed on 11 July 2019).
  7. Effective Carbon Rates. Available online: https://www.oecd.org/tax/tax-policy/effective-carbon-rates-2018-brochure.pdf (accessed on 9 May 2019).
  8. Zhang, W.; Liu, L. Investment decisions of fired power plants on carbon utilization under the imperfect carbon emission trading schemes in China. Processes 2019, 7, 828. [Google Scholar] [CrossRef] [Green Version]
  9. Chiu, F.-P.; Kuo, H.-I.; Chen, C.-C.; Hsu, C.-S. The energy price equivalence of carbon taxes and emissions trading—Theory and evidence. Appl. Energ. 2015, 160, 164–171. [Google Scholar] [CrossRef]
  10. Zhou, D.; An, Y.; Zha, D.; Wu, F.; Wang, Q. Would an increasing block carbon tax be better? A comparative study within the Stackelberg Game framework. J. Environ. Manag. 2019, 235, 328–341. [Google Scholar] [CrossRef]
  11. Shahzad, U. Environmental taxes, energy consumption, and environmental quality: Theoretical survey with policy implications. Environ. Sci. Pollut. Res. 2020, 27, 24848–24862. [Google Scholar] [CrossRef]
  12. Vera, S.; Sauma, E. Does a carbon tax make sense in countries with still a high potential for energy efficiency? Comparison between the reducing-emissions effects of carbon tax and energy efficiency measures in the Chilean case. Energy 2015, 88, 478–488. [Google Scholar] [CrossRef]
  13. He, P.; Ning, J.; Yu, Z.; Xiong, H.; Shen, H.; Jin, H. Can environmental tax policy really help to reduce pollutant emissions? An empirical study of a panel ARDL model based on OECD countries and China. Sustainability 2019, 11, 4384. [Google Scholar] [CrossRef] [Green Version]
  14. Huang, X.; Lu, P.; Luo, X.; Chen, J.; Yang, Z.; Liang, Y.; Wang, C.; Chen, Y. Synthesis and simultaneous MINLP optimization of heat exchanger network, steam Rankine cycle, and organic Rankine cycle. Energy 2020, 195, 116922. [Google Scholar] [CrossRef]
  15. Mahmoud, A.; Sunarso, J. A new graphical method to target carbon dioxide emission reductions by simultaneously aligning fuel switching, energy saving, investment cost, carbon credit, and payback time. Int. J. Energy Res. 2018, 42, 1551–1562. [Google Scholar] [CrossRef]
  16. Jenkins, J.D.; Luke, M.; Thernstrom, S. Getting to zero carbon emissions in the electric power sector. Joule 2018, 2, 2498–2510. [Google Scholar] [CrossRef] [Green Version]
  17. Waheed, R.; Sarwar, S.; Wei, C. The survey of economic growth, energy consumption and carbon emission. Energy Rep. 2019, 5, 1103–1115. [Google Scholar] [CrossRef]
  18. Lin, B.; Jia, Z. Impacts of carbon price level in carbon emission trading market. Appl. Energy 2019, 239, 157–170. [Google Scholar] [CrossRef]
  19. Li, S.; Li, X.; Zhang, D.; Zhou, L. Joint optimization of distribution network design and two-echelon inventory control with stochastic demand and CO2 emission tax charges. PLoS ONE 2017, 12, e0168526. [Google Scholar] [CrossRef] [PubMed]
  20. Novak Pintarič, Z.; Varbanov, P.S.; Klemeš, J.J.; Kravanja, Z. Multi-objective multi-period synthesis of energy efficient processes under variable environmental taxes. Energy 2019, 189, 116182. [Google Scholar] [CrossRef]
  21. Klemeš, J.J. Handbook of Process Integration (PI): Minimisation of Energy and Water Use, Waste and Emissions; Woodhead Publishing Limited: Cambridge, UK, 2013. [Google Scholar]
  22. Mano, T.B.; Guillén-Gosálbez, G.; Jiménez, L.; Ravagnani, M.A.S.S. Synthesis of heat exchanger networks with economic and environmental assessment using fuzzy-Analytic Hierarchy Process. Chem. Eng. Sci. 2019, 195, 185–200. [Google Scholar] [CrossRef]
  23. Wang, B.; Klemeš, J.J.; Varbanov, P.S.; Chin, H.H.; Wang, Q.-W.; Zeng, M. Heat exchanger network retrofit by a shifted retrofit thermodynamic grid diagram-based model and a two-stage approach. Energy 2020, 198, 117338. [Google Scholar] [CrossRef]
  24. Shahandeh, H.; Li, Z. Optimal design of bitumen upgrading facility with CO2 reduction. Comput. Chem. Eng. 2017, 106, 106–121. [Google Scholar] [CrossRef]
  25. Li, G.; Chang, Y.; Chen, L.; Liu, F.; Ma, S.; Wang, F.; Zhang, Y. Process design and economic assessment of butanol production from lignocellulosic biomass via chemical looping gasification. Bioresour. Technol. 2020, 316, 123906. [Google Scholar] [CrossRef]
  26. Alizadeh, M.; Ma, J.; Marufuzzaman, M.; Yu, F. Sustainable olefin supply chain network design under seasonal feedstock supplies and uncertain carbon tax rate. J. Clean. Prod. 2019, 222, 280–299. [Google Scholar] [CrossRef]
  27. Pan, J.; Chiu, C.-Y.; Wu, K.-S.; Yen, H.-F.; Wang, Y.-W. Sustainable production—Inventory model in technical cooperation on investment to reduce carbon emissions. Processes 2020, 8, 1438. [Google Scholar] [CrossRef]
  28. Subramanian, A.S.R.; Gundersen, T.; Adams, T.A. Optimal design and operation of a waste tire feedstock polygeneration system. Energy 2021, 223, 119990. [Google Scholar] [CrossRef]
  29. Ye, Y.; Grossmann, I.E.; Pinto, J.M. Mixed-integer nonlinear programming models for optimal design of reliable chemical plants. Comput. Chem. Eng. 2018, 116, 3–16. [Google Scholar] [CrossRef]
  30. Ziyatdinov, N.N.; Emel’yanov, I.I.; Chen, Q.; Grossmann, I.E. Optimal heat exchanger network synthesis by sequential splitting of process streams. Comput. Chem. Eng. 2020, 142, 107042. [Google Scholar] [CrossRef]
  31. Biegler, L.T.; Grossmann, I.E.; Westerberg, A.W. Systematic Methods of Chemical Process Design; Prentice Hall PTR: Hoboken, NJ, USA, 1997. [Google Scholar]
  32. Zirngast, K.; Kravanja, Z.; Novak Pintarič, Z. MINLP Synthesis of flexible process flow sheets under variable carbon tax rates. In Computer Aided Chemical Engineering; Elsevier: Amsterdam, The Netherlands, 2020; Volume 48, pp. 955–960. [Google Scholar]
  33. Duran, M.A.; Grossmann, I.E. Simultaneous optimization and heat integration of chemical processes. AIChE J. 1986, 32, 123–138. [Google Scholar] [CrossRef]
  34. General Algebraic Modeling System. Available online: www.gams.com/ (accessed on 28 August 2021).
  35. Economic Input-Output Life Cycle Assessment (EIO-LCA). US 2007 Benchmark (USEEIO) Model. Available online: www.eiolca.net (accessed on 1 March 2021).
  36. Kreyszig, E. Instructors Manual for Advanced Engineering Mathematics, 9th ed.; John Wiley and Sons: New York, NY, USA, 2006. [Google Scholar]
Figure 1. Process superstructure [32].
Processes 09 01720 g001
Figure 2. Total CO2 emissions at different values of the CO2 tax rate.
Processes 09 01720 g002
Figure 3. Fraction of purge stream at different values of the CO2 tax rate.
Processes 09 01720 g003
Figure 4. Overall conversion at different values of the CO2 tax rate.
Processes 09 01720 g004
Figure 5. Raw material flow at different values of the CO2 tax rate.
Processes 09 01720 g005
Figure 6. Investment at different values of the CO2 tax rate.
Processes 09 01720 g006
Figure 7. Optimal network of heat exchangers determined by deterministic approach (equal time periods).
Processes 09 01720 g007
Figure 8. Optimal network of heat exchangers determined by multi-scenario stochastic approach (equal time periods).
Processes 09 01720 g008
Figure 9. Optimal network of heat exchangers determined by multi-scenario stochastic approach (different time periods).
Processes 09 01720 g009
Table 1. Results of the synthesis of nonintegrated process.
Max ProfitMin GHG
Carbon tax rate (EUR/t)010306090120n.a.
Investment (kEUR)97998198699199610001038
Feed (kmol/s)2.83782.81622.78252.74672.72162.70302.5749
Hot utility (kW)235236240243246249272
Cold utility (kW)316320326334339344385
Purge (%)8.78.48.07.67.37.05.5
Purge (kmol/s)1.1381.1161.0821.0471.0221.0030.875
Total GHG (t/y)1802179717891783177817751764
GHGutility (t/y)357.9360.7365.6371.4376.0379.8414.9
GHGpurge (t/y)583.5579.1572.2564.8559.7555.8529.5
GHGfeed (t/y)444.6441.2435.9430.3426.4423.5403.4
GHGproduct (t/y)416.1416.16416.2416.2416.2416.2416.2
Overall conversion (%)72.372.8673.7374.6775.3575.8679.57
Profit (kEUR/y)42,86424,867−10,998−64,579−117,989−171,28935,597
Selected topologyFeed 1/RCT2Feed 1/RCT2Feed 1/RCT2Feed 1/RCT2Feed 1/RCT2Feed 1/RCT2Feed 1/RCT2
Table 2. Results of the synthesis of heat-integrated process.
Max ProfitMin GHG
Carbon tax rate (EUR/t)010306090120n.a
Investment (kEUR)1335119412341288133713821971
Feed (kmol/s)2.86942.38132.35722.33122.31242.29792.2119
Hot utility (kW)1.6620.960.930.8970.8740.8550.747
Cold utility (kW)187170183201217231412
Purge (%)4.73.12.82.52.32.11.1
Purge (kmol/s)1.1690.6810.6570.6310.6120.5980.512
Total GHG (t/y)2568128012711262125512501218
GHGutility (t/y)2.52.51.41.41.381.41.1
GHGpurge (t/y)885489.7484.7479.4475.4472.5454.8
GHGfeed (t/y)1264.3373.1369.3365.2362.3360.0346.6
GHGproduct (t/y)416.2416.2416.2416.2416.2416.2416.2
Overall conversion (%)81.5785.9486.887.7688.4689.0192.42
Profit (kEUR/y)127,824109,50483,98845,9908234−29,341110,655
Selected topologyFeed 2/RCT2Feed 1/RCT2Feed 1/RCT2Feed 1/RCT2Feed 1/RCT2Feed 1/RCT2Feed 1/RCT2
Table 3. Results of the one-period process synthesis at different values of CO2 tax.
Max Profit
CO2 tax rate (EUR/t)10/60/12010/60/12010/60/120
Probability0.90/0.09/0.010.15/0.80/0.050.10/0.20/0.70
Investment (kEUR)224424472596
Expected hot utility (kW)10.90.87
Expected cold utility (kW)173197218
Expected purge (%)3.062.562.29
Expected purge (kmol/s)0.6760.6370.613
Expected total GHG (t/y)128012811259
Expected GHGutility (t/y)1.51.51.4
Expected GHGpurge (t/y)489490478
Expected GHGfeed (t/y)373373364
Expected GHGproduct (t/y)416416416
Expected overall conversion (%)85.986.787.9
Expected profit (kEUR/y)110,78761,25916,161
Selected topologyFeed 1/RCT2Feed 1/RCT2Feed 1/RCT2
Table 4. Probabilities of the CO2 tax in three periods.
Probability in Period
Carbon Tax Rate (EUR/t CO2)123
100.900.150.10
600.090.800.20
1200.010.050.70
Table 5. Results of the multi-period process synthesis at different values of CO2 emission tax.
Max Profit
Non-IntegratedIntegrated
Investment (kEUR)16102477
Expected hot utility (kW)2400.91
Expected cold utility (kW)342197
Expected purge (%)8.032.64
Expected purge (kmol/s)1.0860.642
Expected total GHG (t/y)17851265
Expected GHGutility (t/y)3691.4
Expected GHGpurge (t/y)568481
Expected GHGfeed (t/y)432367
Expected GHGproduct (t/y)416416
Expected overall conversion (%)74.287.4
Expected profit (kEUR/y)−57,32451,253
Selected topologyFeed 1/RCT2Feed 1/RCT2
Table 6. Results of deterministic synthesis of nonintegrated process.
Carbon Tax Rate (EUR/t CO2)1060120
Investment (kEUR)162816281628
Selected topologyFeed 1/RCT2Feed 1/RCT2Feed 1/RCT2
Total GHG (t/y)178317831783
Total probability0.38330.36330.2533
Profit (kEUR/y)24,594 −64,580−171,591
Table 7. Results of deterministic synthesis of heat-integrated process.
Carbon Tax Rate (EUR/t CO2)1060120
Investment (kEUR)249224922492
Selected topologyFeed 1/RCT2Feed 1/RCT2Feed 1/RCT2
Total GHG (t/y)126312631263
Total probability0.38330.36330.2533
Profit (kEUR/y)109,14945,988−29,804
Table 8. Data for HEN synthesis.
StreamTs (K)Tt (K)CF (kW/K)α (kW/(m2 K))
H1570330200.7
H2800323100.7
C1388600200.7
C2333500150.7
C3416555400.7
Hot utility620619 1.5
Cold utility298313 0.7
Table 9. Comparison of HEN results with different approaches (equal time periods).
Deterministic MethodsStochastic Methods
Fixed First-Stage VariablesModified First-Stage VariablesOne PeriodMulti-Period
PeriodTAC (EUR/y)TAC (EUR/y)TAC (EUR/y)TAC (EUR/y)
11,566,7791,566,6311,485,1261,646,609
21,741,9841,739,6581,713,937
31,882,1471,870,4541,787,043
Expected 1,730,3031,725,5811,662,035
GHG (t/y)6371632259965899
Table 10. Comparison of HEN results with different approaches (different time periods).
Deterministic Methods Stochastic Methods
Fixed First-Stage VariablesModified First-Stage VariablesOne PeriodMulti-Period
TAC (EUR/y)1,688,2541,685,0711,621,7801,597,888
GHG (t/y)6375633360015906
Publisher’s Note: MDPI stays neutral with regard to jurisdictional claims in published maps and institutional affiliations.

