Article

Predicting Host Immune Cell Dynamics and Key Disease-Associated Genes Using Tissue Transcriptional Profiles

by
Muying Wang
1,
Satoshi Fukuyama
2,
Yoshihiro Kawaoka
2,3,4 and
Jason E. Shoemaker
1,5,6,*
1
Department of Chemical and Petroleum Engineering, Swanson School of Engineering, University of Pittsburgh, Pittsburgh, PA 15261, USA
2
Division of Virology, Department of Microbiology and Immunology, Institute of Medical Science, University of Tokyo, Tokyo 108-8639, Japan
3
Department of Pathobiological Sciences, School of Veterinary Medicine, Influenza Research Institute, University of Wisconsin-Madison, Madison, WI 53706, USA
4
Department of Special Pathogens, International Research Center for Infectious Diseases, Institute of Medical Science, University of Tokyo, Tokyo 108-8639, Japan
5
Department of Computational and Systems Biology, School of Medicine, University of Pittsburgh, Pittsburgh, PA 15260, USA
6
The McGowan Institute for Regenerative Medicine, Pittsburgh, PA 15219, USA
*
Author to whom correspondence should be addressed.
Processes 2019, 7(5), 301; https://doi.org/10.3390/pr7050301
Submission received: 16 April 2019 / Revised: 12 May 2019 / Accepted: 15 May 2019 / Published: 21 May 2019
(This article belongs to the Special Issue Modeling & Control of Disease States)

Abstract

:
Motivation: Immune cell dynamics is a critical factor of disease-associated pathology (immunopathology) that also impacts the levels of mRNAs in diseased tissue. Deconvolution algorithms attempt to infer cell quantities in a tissue/organ sample based on gene expression profiles and are often evaluated using artificial, non-complex samples. Their accuracy on estimating cell counts given temporal tissue gene expression data remains not well characterized and has never been characterized when using diseased lung. Further, how to remove the effects of cell migration on transcript counts to improve discovery of disease factors is an open question. Results: Four cell count inference (i.e., deconvolution) tools are evaluated using microarray data from influenza-infected lung sampled at several time points post-infection. The analysis finds that inferred cell quantities are accurate only for select cell types and there is a tendency for algorithms to have a good relative fit (R 2 ) but a poor absolute fit (normalized mean squared error; NMSE), which suggests systemic biases exist. Nonetheless, using cell fraction estimates to adjust gene expression data, we show that genes associated with influenza virus replication and increased infection pathology are more likely to be identified as significant than when applying traditional statistical tests.

1. Introduction

Accurately identifying and quantifying the immune cells is critical to understanding both how the body manages disease and how immune mismanagement may increase the overall disease pathology (e.g., immunopathology). The behavior of immune cells is a primary factor in the overall disease pathology [1,2,3,4,5,6,7]. The immune response is a complex process that coordinates the activation, migration and differentiation of a large variety of immune cells [8,9,10,11]. A very common factor of disease pathology is overly aggressive or dysregulated immune responses in which diseased tissues are observed to have abnormally high numbers of inflammatory immune cells. A specific example is lethal influenza infections, which are often characterized by extremely high quantities of macrophages or neutrophils that infiltrate into lungs [12,13,14,15]. It has also been shown in influenza infection studies that modulating inflammatory immune cell counts by interfering with immune cell trafficking or activation can significantly improve infection outcomes [16,17,18]. An accurate quantification of immune cells is essential to identifying the mechanisms of disease pathology and can provide insights in innovating treatments.
While cell count data is necessary to mathematically model disease development, such data is often limited and not nearly as accessible to the research community as genomics data. Fluorescence-activated cell sorting (FACS) is one of the most common methods to quantify cells in a sample. However, FACS requires significant amount of tissue for analysis, which complicates the design of experiment [19]. Moreover, FACS data repositories are not yet well established, although ongoing efforts such as ImmPort [20] are aiming to improve this. Gene expression data on the other hand is widely available in curated repositories, such as GEO [21]. To support identifying the mechanisms behind disease pathology and promote mathematically modeling the complex systems linking disease and immune responses, it would be a major benefit to be able to exploit gene expression data to identify and count the immune cells in a sample.
The computational challenge is to use the changes in the number of RNA transcripts within a tissue that is caused by the changing numbers of immune cells to infer, i.e., count, the number of immune cells themselves. Both the signaling pathways activated by a disease and the increased localization of immune cells result in changes in the number of RNA transcripts within a tissue (see Figure 1) [22,23]. Most genomics research focuses on identifying differentially expressed genes by comparing gene expression from diseased tissue samples with the control. However, given how immune cell infiltration impacts RNA transcript counts, one should be able to infer the changes in numbers of immune cells by examining the expression data. It is also significant to consider that without adjusting for changes in cellular composition, the obtained differentially expressed genes may include false positives that are not related to regulation activities but due to changes in cell populations. Computational approaches based on gene expression data, i.e., deconvolution algorithms, have been developed to address these issues and can assist in the identification of gene regulations.
Deconvolution algorithms attempt to quantify cell counts in a mixed sample by using gene expression data [24,25]. The expression profiles that can be analyzed by deconvolution algorithms include tissue samples collected from animals (e.g., mouse lung tissue samples infected by influenza viruses [23]) and clinical samples from patients (e.g., blood samples from systemic Lupus erythematosus patients [26]). Figure 1b provides a summary of the algorithms used in this study. Two general strategies have been proposed. One takes a bioinformatics approach and uses longitudinal clustering of time-series data to isolate sets of genes and then associates the gene sets with candidate cell types using statistical tests, such as cell type enrichment (CTen) [22,23]. In this approach, the gene expression patterns are assumed to be correlated with dynamic changes of enriched cell types. This strategy has advantages: firstly, no prior knowledge of the cellular composition in the test sample is required; secondly, all time points are considered simultaneously, and the method can easily be extended over many experimental conditions.
The other common strategy postulates that tissue can be modeled as a linear combination of gene expression profiles derived from pure cell populations. In general, these approaches assume
A · x = b ,
where A is a n × p matrix of expression intensities of p kinds of pure cells for n genes [24,27], b is a vector of gene intensities in the test sample, and x is a vector of proportions for cell types in the matrix A. Since n is usually larger than p, the linear problem is overdetermined and different regression strategies are applied in various algorithms. Cell fractions are solved through simulated annealing [24,27], bounded linear least-squares regression (LLSR) [26], quadratic programming in digital sorting algorithm (DSA) [25], elastic net regularization in digital cell quantification (DCQ) [28], and a modified support vector regression (v-SVR) in a tool named the cell-type identification by estimating relative subsets of RNA transcripts (CIBERSORT) [29]. These algorithms require information of cell composition in the sample and reference gene expressions of pure cells. Both requirements can limit their application in inference.
An unexamined question is how accurate these deconvolution algorithms are for predicting cell quantity changes in animal-derived tissue sampled over time (i.e., dynamic data) and how to utilize their predictions to improve the identification of gene regulation related to the disease. Most deconvolution algorithms are only tested by simulated expression data [30], or data from artificial samples comprised of three or four distinct cell/tissue types [25,26]. Seldom is algorithm performance examined by in vivo collected tissue samples, such as whole blood samples [26]. To better understand performance, we evaluate four representative deconvolution algorithms: CTen [22], modified LLSR (referred to as MLLSR in the following) by Abbas et al. [26], CIBERSORT [29] and DCQ [28] (Figure 1b), by a common microarray dataset of influenza-infected lung tissue sampled at multiple time points [23]. Estimates from each deconvolution algorithm are compared with cell count data measured by FACS under the same experimental conditions. We then propose a new approach to identifying significant genes associated with disease by application of predictions from deconvolution. We find that the ranking is significantly increased for important genes known to be factors of virus replication and disease pathogenesis, after adjusting the bias of differential expression analysis due to immune cell infiltration. Lastly, we conclude with a discussion on how cell count inference algorithms can be incorporated into analytical pipelines to improve disease factor discovery.

2. Materials and Methods

2.1. Ethics Statement

All mouse experiments were performed following the University of Tokyo’s Regulations for Animal Care and Use, which are approved by the Animal Experiment Committee of the Institute of Medical Science, University of Tokyo (approval number: PA10-13). All experiments involving H5N1 virus were performed in biosafety level 3 containment laboratories at the University of Tokyo, with the approval by the Ministry of Agriculture, Forestry, and Fisheries, Japan.

2.2. Microarray Analysis of Mouse Lung Tissue

Complete and detailed methods for infection, tissue collection and tissue treatment to perform lung gene expression analysis for the mice used in this study are reported in Shoemaker et al. [23]. Briefly, 42 mice per cohort were inoculated with 10 5 plaque-forming unit per gram of lung (PFU) of the A/Kawasaki/UTK-4/09 H1N1 virus (H1N1), A/California/04/09 H1N1 virus (pH1N1), or the A/Vietnam/1203/04 H5N1 virus (H5N1). A cohort of animals mock-infected with PBS (phosphate-buffered saline) served as the control for a total of 168 mice. At 14 time points, three mice per cohort were humanely sacrificed, their lungs harvested, and the left-lower section used for gene expression analysis by single-color microarray (the remaining sections were used for cytokine assay and Western blot analysis). Data was background corrected and then quantile normalized using the “limma” R package [31] and are available in the gene expression omnibus (GEO) repository (GSE63786).

2.3. Flow Cytometry

Five mice per time point per cohort were infected with 10 5 PFU of virus. Five uninfected (naïve) mice served as the negative control. Lungs were collected from mice and incubated with Collagenase D (Roche Diagnostics; final concentration: 2 μ g/mL) and DNase I (Worthington; final concentration: 40 U/mL) for 30 min at 37 C. Single-cell suspensions were obtained from lungs by grinding tissues through a nylon filter (BD Biosciences, San Jose, CA, USA). Red blood cells (RBCs) in a sample were analyzed using an RBC lysing buffer (Sigma-Aldrich, St. Louis, MO, USA). Samples were resuspended with PBS containing 2 mM EDTA and 0.5% bovine serum albumin (BSA), and the cell number was determined using a disposable cell counter (OneCell, Fine Plus International, Kyoto, Japan). To block nonspecific binding of antibodies mediated by Fc receptor, cells were incubated with purified anti-mouse CD16/32 (Fc Block, BD Biosciences). Cells were stained with appropriate combinations of fluorescent antibodies to analyze the population of each immune cell subset (see Table S1). The following antibodies were used: anti-CD49b (DX5: BD Biosciences), anti-Fc ε RI (MAR-1: eBioscience), anti-c-kit (2B8: BD Biosciences), anti-CD45 (30-F11: eBioscience), anti-CD11b (M1/70: BD), anti-CCR3 (83101: R&D), anti-F4/80 (BM8; eBioscience), anti-CD11c (HL3: BD), anti-Gr-1 (RB6-8C5: BioLegend), anti-NK1.1 (PK136: BD Biosciences), anti-B220 (RA3-6B2: BD Biosciences), anti-CD3 ε (145-2C11: BD Biosciences), anti-CD4 (RM4-5: BioLegend), anti-CD8 α (53-6.7: BioLegend), and CD69 (H1.2F3: BD Biosciences). All samples were also incubated with 7-aminoactinomycin D (via-probe, BD Biosciences) for dead cell exclusion. The data of labeled cells were acquired on a FACSAria II (BD Biosciences) and analyzed with FlowJo software version 9.3.1 (Tree Star). To evaluate the statistical significance of cell counts across time, we computed false discovery rate (FDR) values by comparing cell counts at each time point and uninfected (naive) mice.

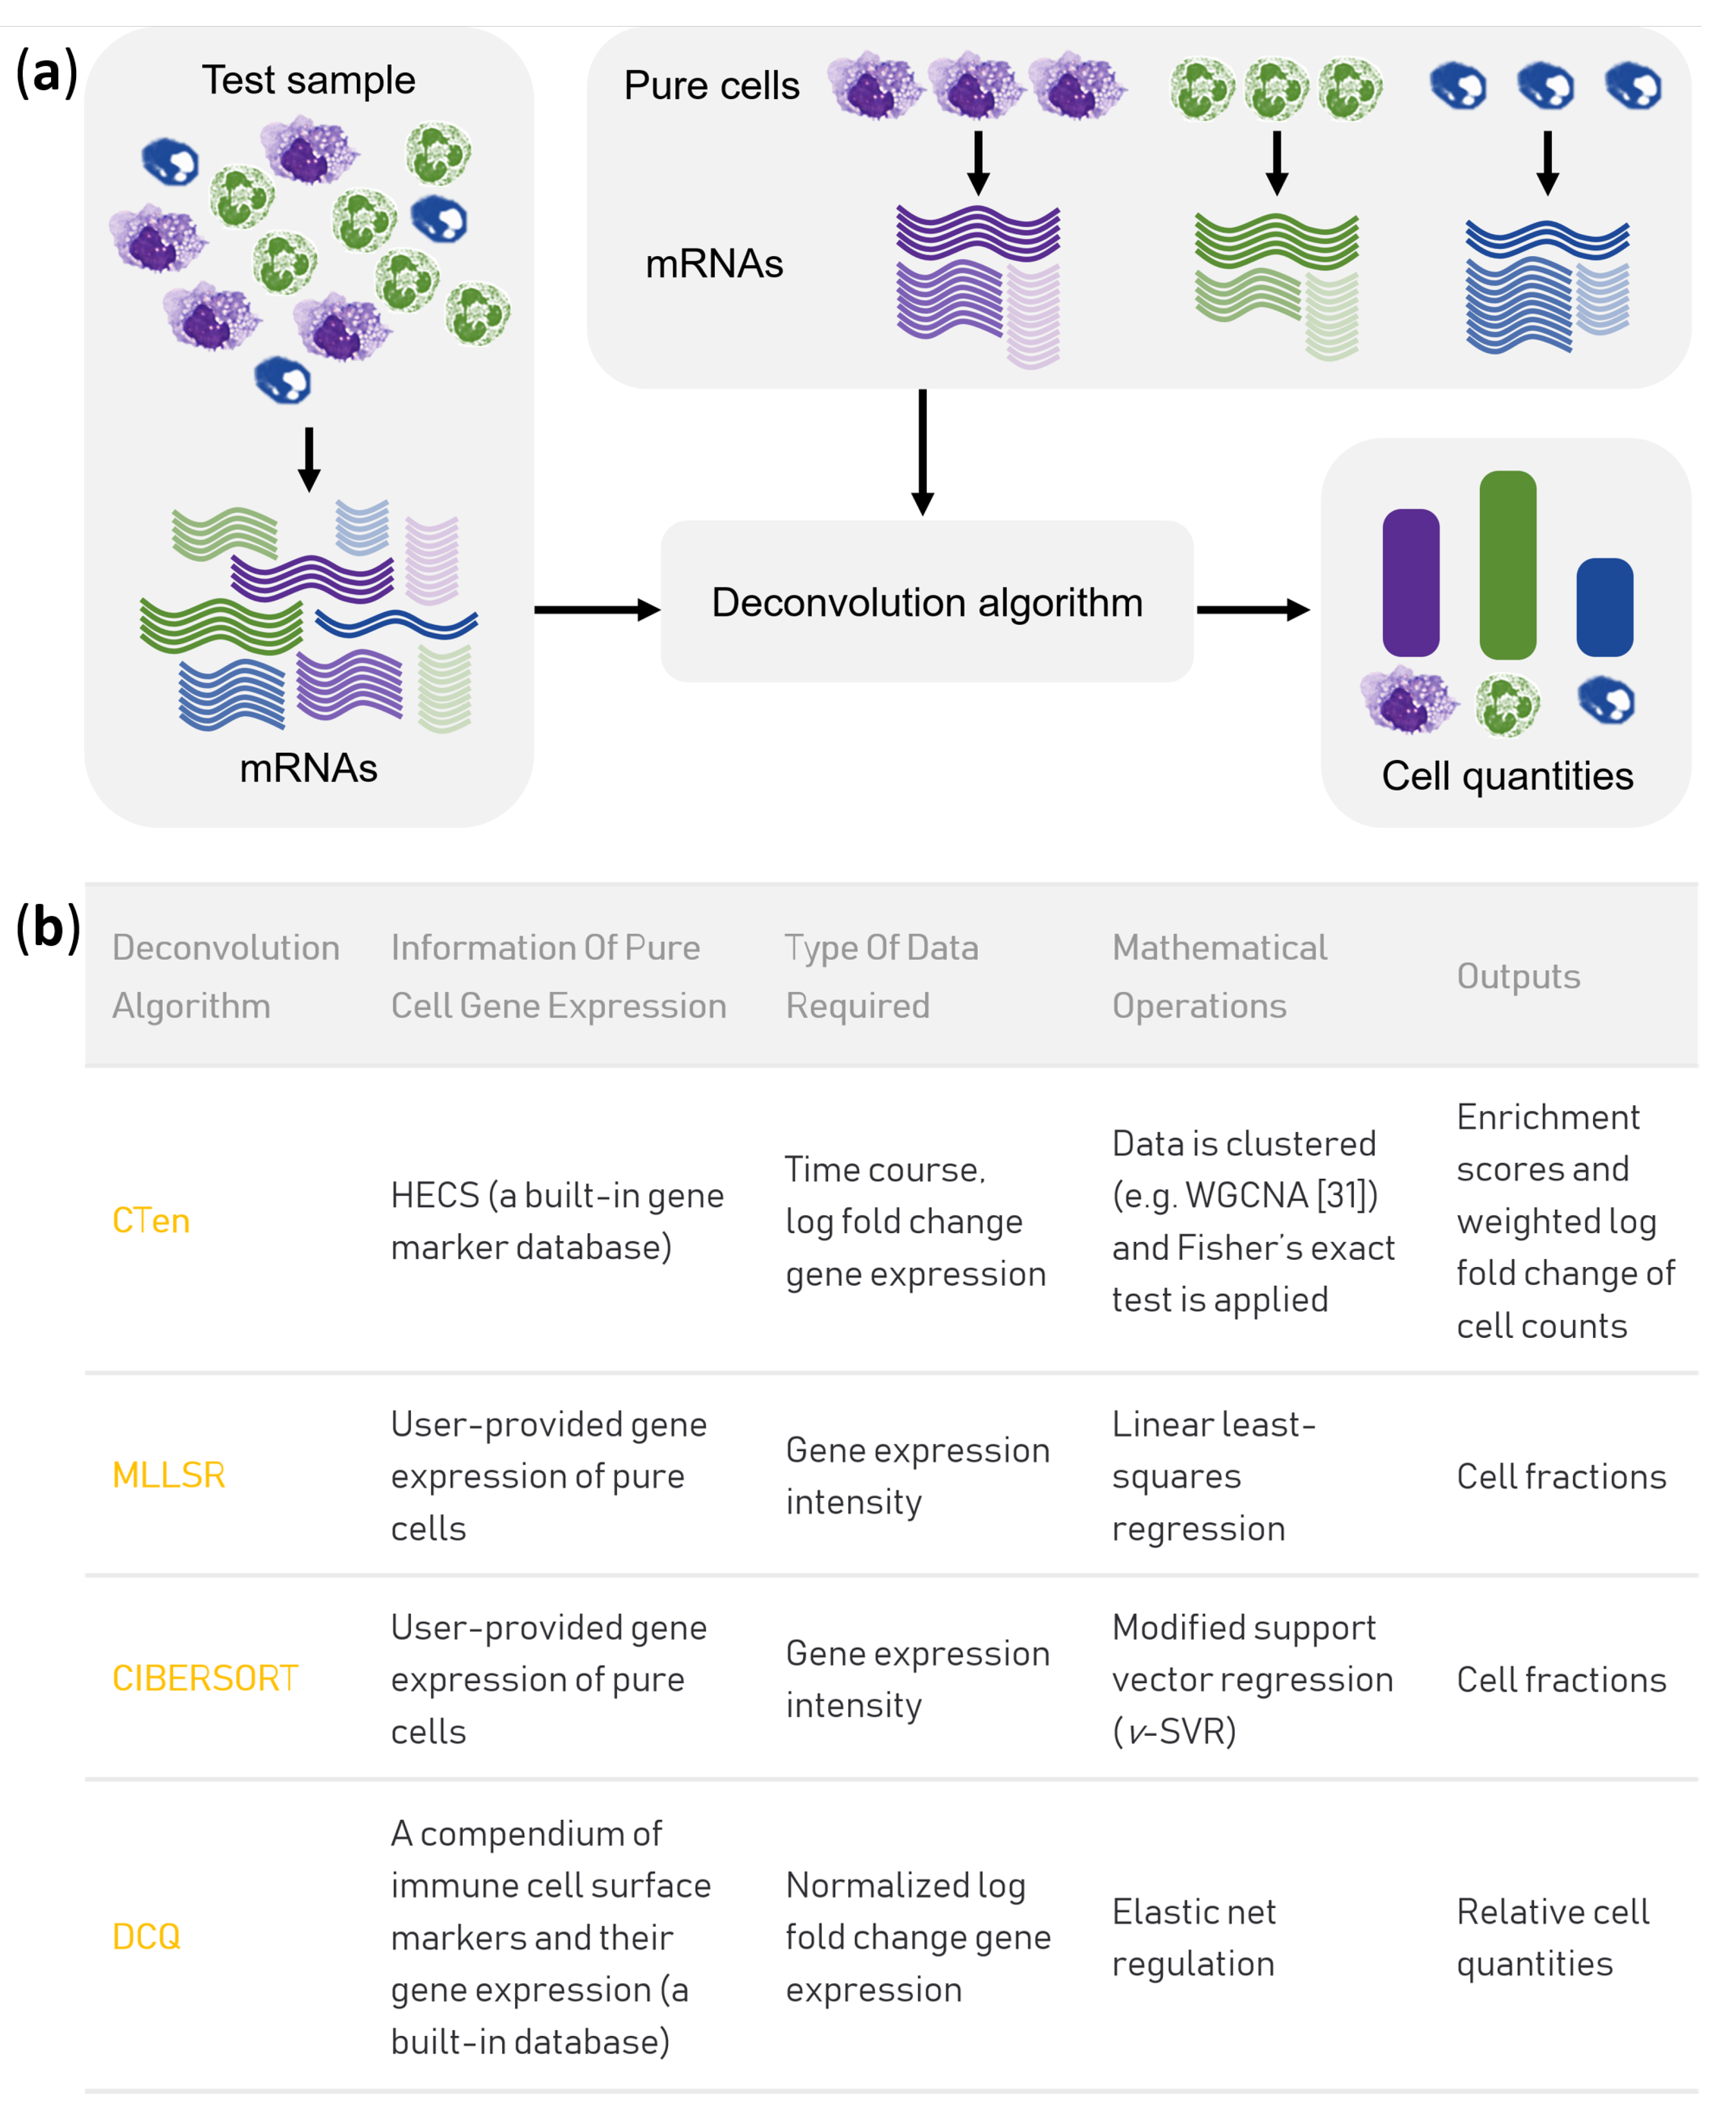
2.4. Prediction of Cell Fractions by MLLSR, CIBERSORT and DCQ

Microarray data of 17 cell types were gathered to construct a library of gene expression profiles from populations of a single cell type for deconvolution by MLLSR and CIBERSORT. These cell types included: B cell, Kdo (12 h) stimulated B cell [32], naïve CD4+ T cell, natural CD4+ regulatory T cell [33], resting naïve CD8+ T cell, resting memory CD8+ T cell, stimulated naïve CD8+ T cell, stimulated memory CD8+ T cell [34], immature dendritic cell (imDC), mature DC (maDC), a unique subset of regulatory DC (sDC), IL-10 treated sDC [35], lung [23], macrophage [36,37], LPS (6 h) stimulated macrophage [37], monocyte [38], and NK cell [39]. Data was background corrected (monocyte data not corrected due to unavailability) and then quantile normalized. Lowly-expressed genes were excluded (intensity > 256 or log-scaled intensity > 8) based on the assumption that large intensity values benefit identification of various cell types and deconvolution of gene expression reference. Gene markers of a certain cell type in the library were selected by sorting the ratio of the intensity of a gene for the cell type divided by the average of the same gene for all other cell types. Top 100 genes with the highest ratios of each cell type and their expression intensities were collected as information of pure cells that serve as matrix A in regression. The intensities of these gene markers in an infected lung tissue sample served as the input as b to MLLSR and CIBERSORT. MLLSR was rebuilt in R according to the literature. Equation (1) is solved by the R function ‘lsfit’ and the minimum negative coefficient is removed until there is no negative value [26]. Analysis by CIBERSORT was implemented online with settings as default. It uses ν -SVR, which minimizes both a loss function and a penalty function. CIBERSORT contains a feature selection step, in which less-variated genes are discarded to reduce overfitting. In the last step, negative coefficients were set as zeros and all coefficients are scaled to sum of one [29].
DCQ does not require or accept user-defined information of pure cells, and it depends on an immune cell compendium that consists of a collection of 61 cell surface markers for 223 diverse cell types (213 of them are immune cells) and expression profiles of these cell subsets obtained from ImmGen Project [40]. Intensities of all genes available in lung tissue microarray data were uploaded to DCQ. As suggested [28], preprocessing of the data was performed by log-scaling and subtracting the control sample, and every entry was divided by the global standard deviation. The parameters, number of repeats and lambda.min, were left as default.

2.5. Gene Co-Expression Analysis by Wgcna and Cell Enrichment Analysis by Cten

Microarray datasets of mouse lung tissues at 14 timepoints (0, 3, 6, 9, 12, 18, 24, 30, 36, 48, 60, 72, 120, and 168 h) after infection by H1N1, pH1N1, and H5N1 were obtained from literature [23] (methods summarized above). For each strain, a gene was differentially expressed if it was significant for at least one time-matched comparison with mock samples (fold change > 2; FDR < 0.01). Log fold change values of these differentially expressed genes were utilized for the construction of the co-expression network by the WGCNA package [41] in R. Block-wise network construction was implemented for pH1N1 and H5N1 due to the large size of their datasets. A soft-thresholding power of 8, 9, and 8 was set respectively for H1N1, pH1N1, and H5N1, based on scale-free topology fitting (Figure S1). Modules were not merged (height cut = 0) for all strains, because merging modules can generate lower correlations among genes within a module [23]. Module eigengenes and module membership of genes were calculated as well. For each module, genes positively or negatively correlated to the eigengene were separated into two submodules, according to signs of their memberships. Negative submodules are denoted by an extra minus sign.
Submodules of genes obtained from WGCNA were uploaded to CTen for detection of cell enrichments [22]. Genes from each module were compared with CTen’s gene marker database. Enrichment scores were computed as −log 10 (p-value) using p-value from Fisher’s exact test. When more than one submodule was annotated by the same cell subset, the submodule with the highest enrichment score was chosen to represent this cell type.

2.6. Comparison between Estimated Cell Quantities and Flow Cytometry Data

To explore the accuracy of each algorithm, we calculated R 2 and normalized mean squared error (NMSE) by comparing normalized predictions with processed cell counts from flow cytometry. NMSE is defined as the following equation:
NMSE ( x , y ) = x y 2 x 2 ,
where x is a vector of normalized predictions, and y is a vector of processed cell counts. Although animals used for flow cytometry are not the same as those for microarray analysis, mean values of both predicted and measured cell quantities are used to account for errors due to diversity of animal samples for all comparisons.
For MLLSR and CIBERSORT, log fold change of estimated cell fractions at each time point versus hour 0 was calculated and compared with log fold change of cell counts to compute R 2 and NMSE scores. The total number of all cells in the lung tissue is not available because large cells (e.g., epithelial cells) were filtered before cell sorting. We assumed the total number of cells did not significantly change in the seven days following infection (proof shown in Figure S2). Therefore, the log fold change of estimated cell fractions (a test sample vs mock sample) should approximately equal to the log fold change of cell counts. Because the physical meaning of the output from DCQ is unclear, we compared it with three kinds of measurement: (i) log fold change of cell counts, (ii) change of cell counts, and (iii) change of normalized cell counts (the cell number of a cell type divided by the number of total live cells). The predicted relative cell quantities from DCQ for more than 200 cell subsets were summed up according to the annotations of its immune cell compendium. For CTen, the expression pattern of a gene marker is assumed correlated to the dynamic change of the referring cell type, and eigengene profiles were normalized then compared to cell count data. The eigengene profiles of the chosen modules were scaled as 0–1, and the profiles from negative submodules were multiplied by −1 before scaling. The R 2 and NMSE scores were computed in comparison between the normalized eigengene profiles and log fold change of cell counts.

2.7. Computation of Adjusted Gene Expression and Identification of Significant Genes

Based on the linear relation i.e., Equation (1) applied in deconvolution algorithms, CIBERSORT-adjusted gene expression g was defined as the following:
g = b A · x ^ ,
where A is a n × p matrix of expression intensities of p kinds of pure cells for n genes, b is a vector of expression intensities in a given sample, and x ^ is a vector of estimated cell fractions for this sample using CIBERSORT. Similarly, cell count-adjusted gene expression x ˜ was defined as
e = b A · x ˜ ,
where b and A are the same with the above while x ˜ is equal to immune cell counts measured by FACS divided by the average total number of cells per mouse lung [42]. For each gene from influenza-infected microarray data, the adjusted gene expression g and e was quantile normalized and compared with that of mock data per time point per sample cohort by the R package limma [31], and the FDR was computed. Standard differential expression (DE) analysis was performed by comparing gene expressions of infected samples to mock samples per time point per cohort and FDR values were computed. For both methods (adjusted expression and standard DE), the minimum FDR values among all time points was utilized to characterize the significance of the associated gene. Genes with FDR values less than 1 × 10 4 for at least two time points were analyzed by DAVID [43,44] for functional annotations.

3. Results

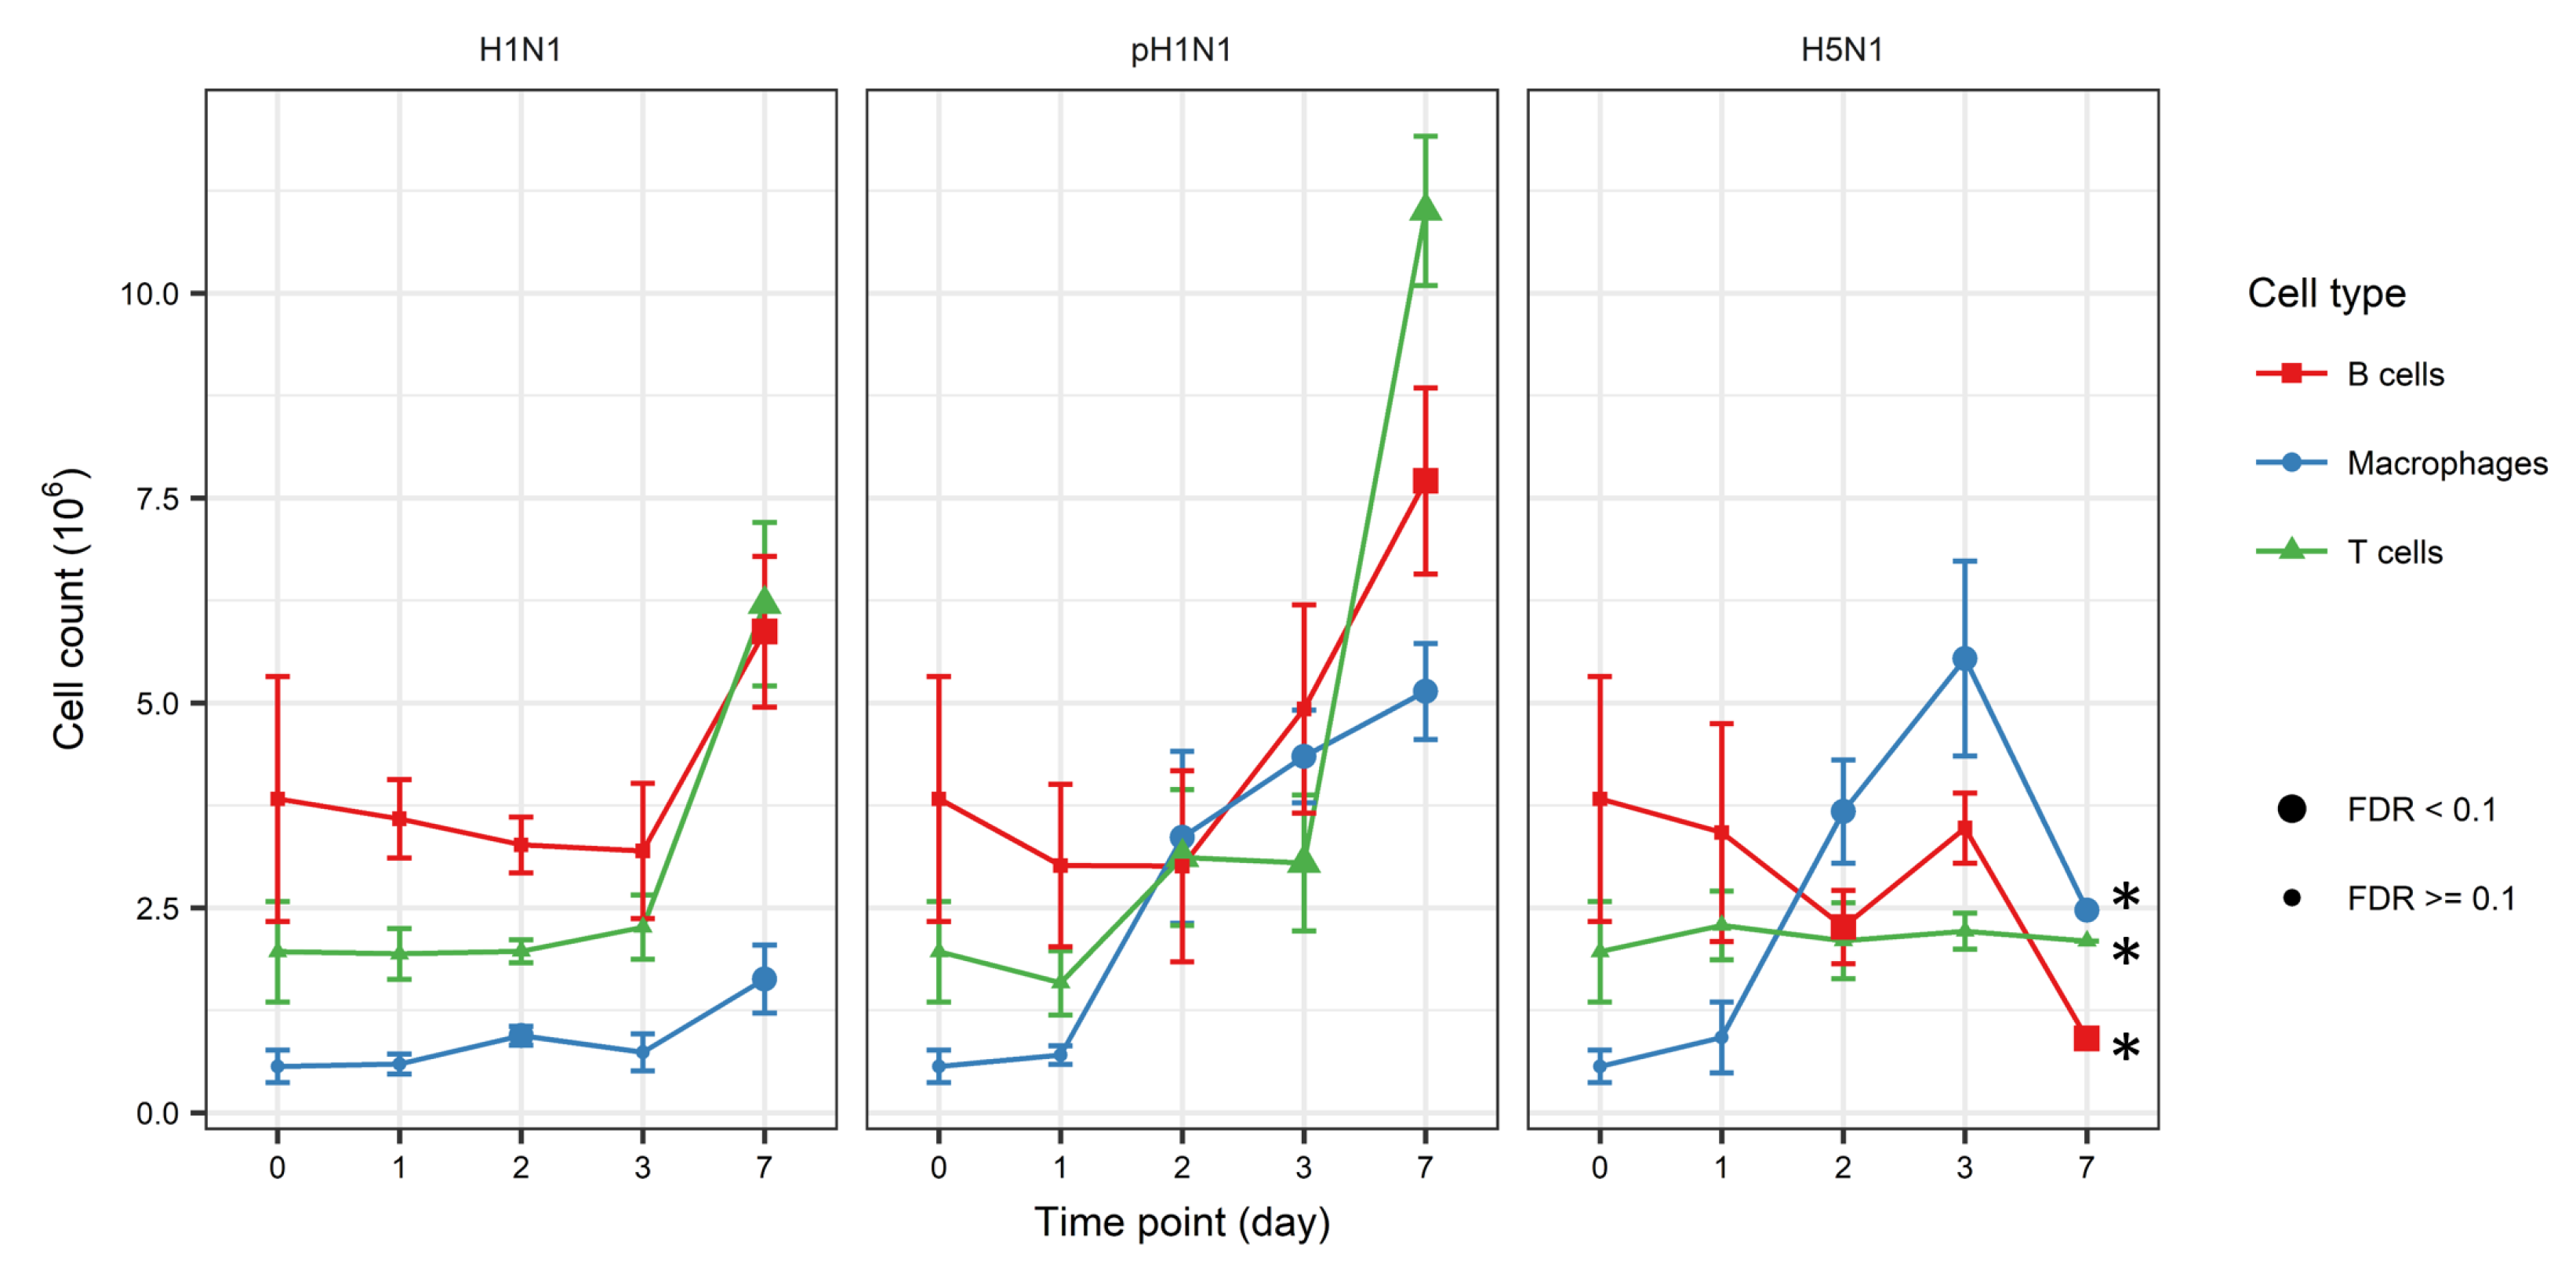
3.1. Dynamic Change of Immune Cell Quantities Induced by Influenza Infection

To characterize the accuracy of predictions from the set of deconvolution algorithms, the number of immune cells in mouse lung at five timepoints (day 0, day 1, day 2, day 3, and day 7) after influenza virus infection were measured by FACS. The cohorts of H5N1 and pH1N1-infected animals had higher immune cell counts (Figure S3), which was consistent with studies of lungs infected with highly pathogenic viruses [12,13,14]. Figure 2 shows the number of select immune cells within the lung overtime (Figure S3 shows the results for all other immune cell counts measured). Macrophages were significantly infiltrated into the mouse lung after day 2 for all sample cohorts (Figure 2). B cell counts did not increase significantly from the counts observed in mock animals until day 7 for the sample cohorts of H1N1 and pH1N1, while for H5N1 the quantity of B cells shows a significant decrease at both day 2 and day 7. For T cells, the H1N1 cohort exhibited an increase in cell number on day 7, whereas a large increase occurred much earlier (since day 2) for pH1N1. However, for H5N1 the variation of T cell counts was insignificant. We observe that CD4+ T cells show similar trends across time: the cell counts did not significantly increase until day 7 for the H1N1 and pH1N1 cohorts, while the cell counts for H5N1 are relatively stable (Figure S3). Dendritic cells (DCs) for the cohort of H1N1 are up-regulated at day 7, and for pH1N1 as well as H5N1 the cell counts greatly increased since day 2 (Figure S3). NK cell quantities kept increasing starting from day 3 for H1N1, and day 2 for pH1N1 and H5N1. These dynamic profiles of cell counts obtained from FACS were used to evaluate cell count predictions from the four algorithms.

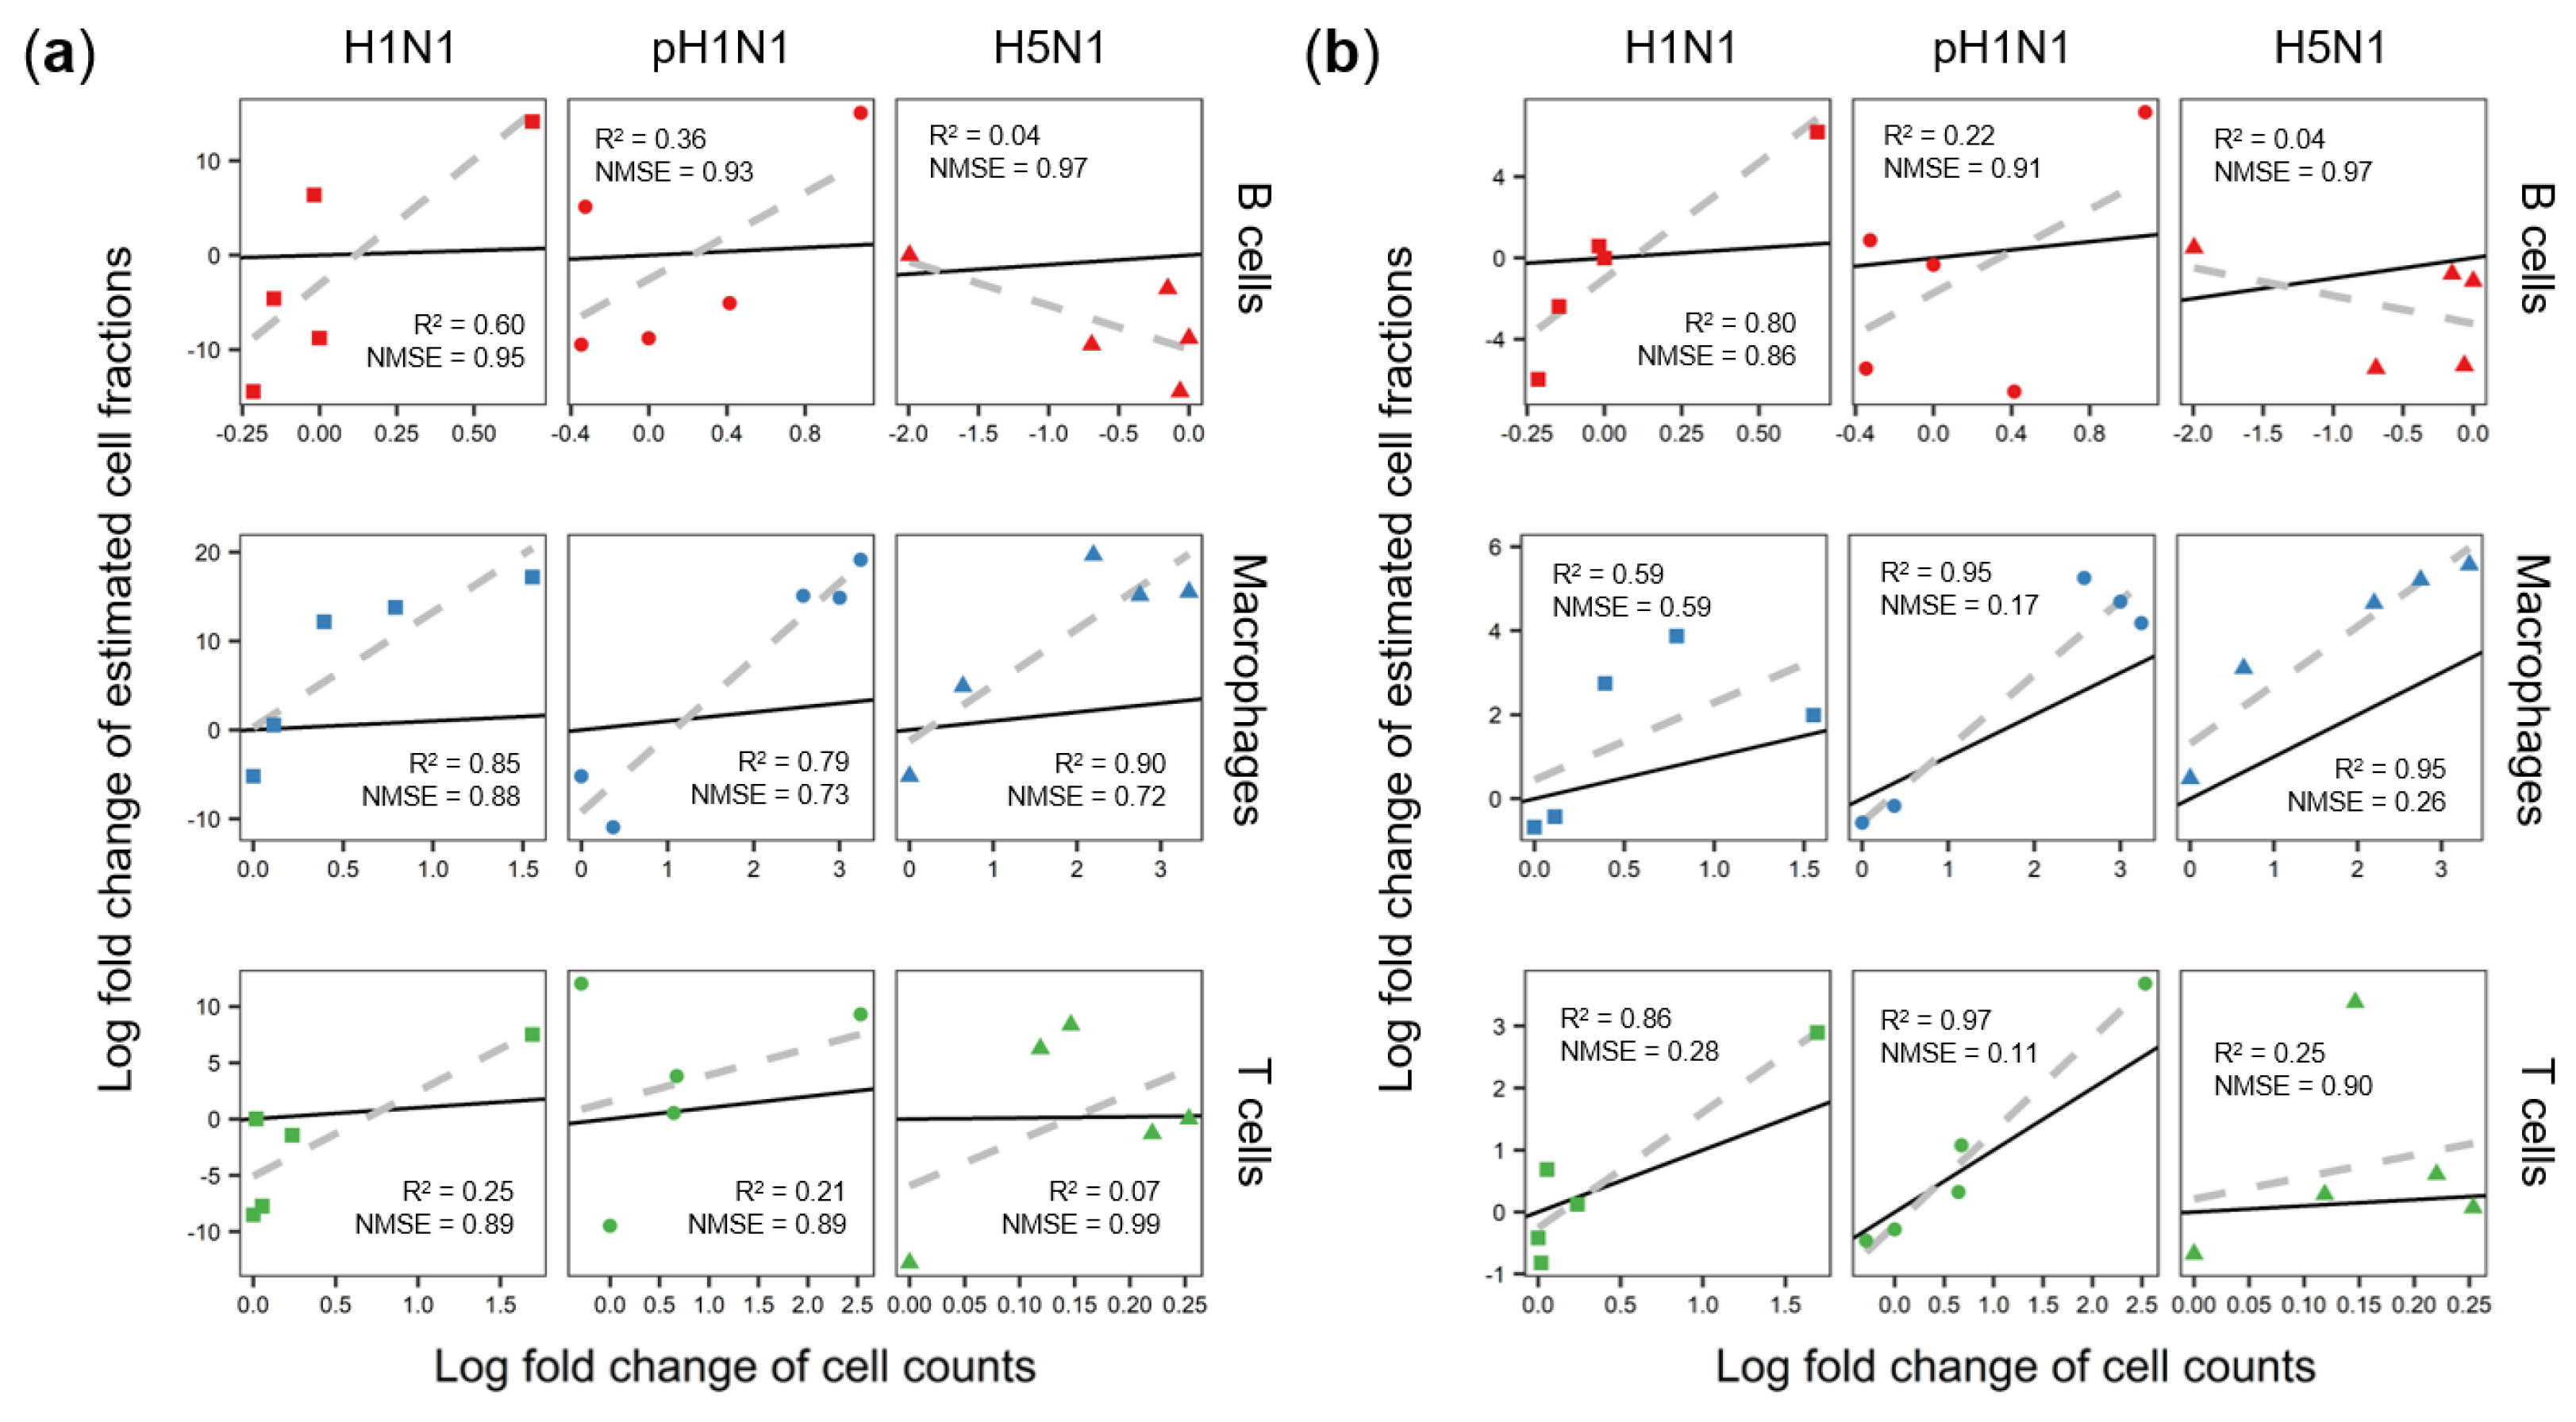
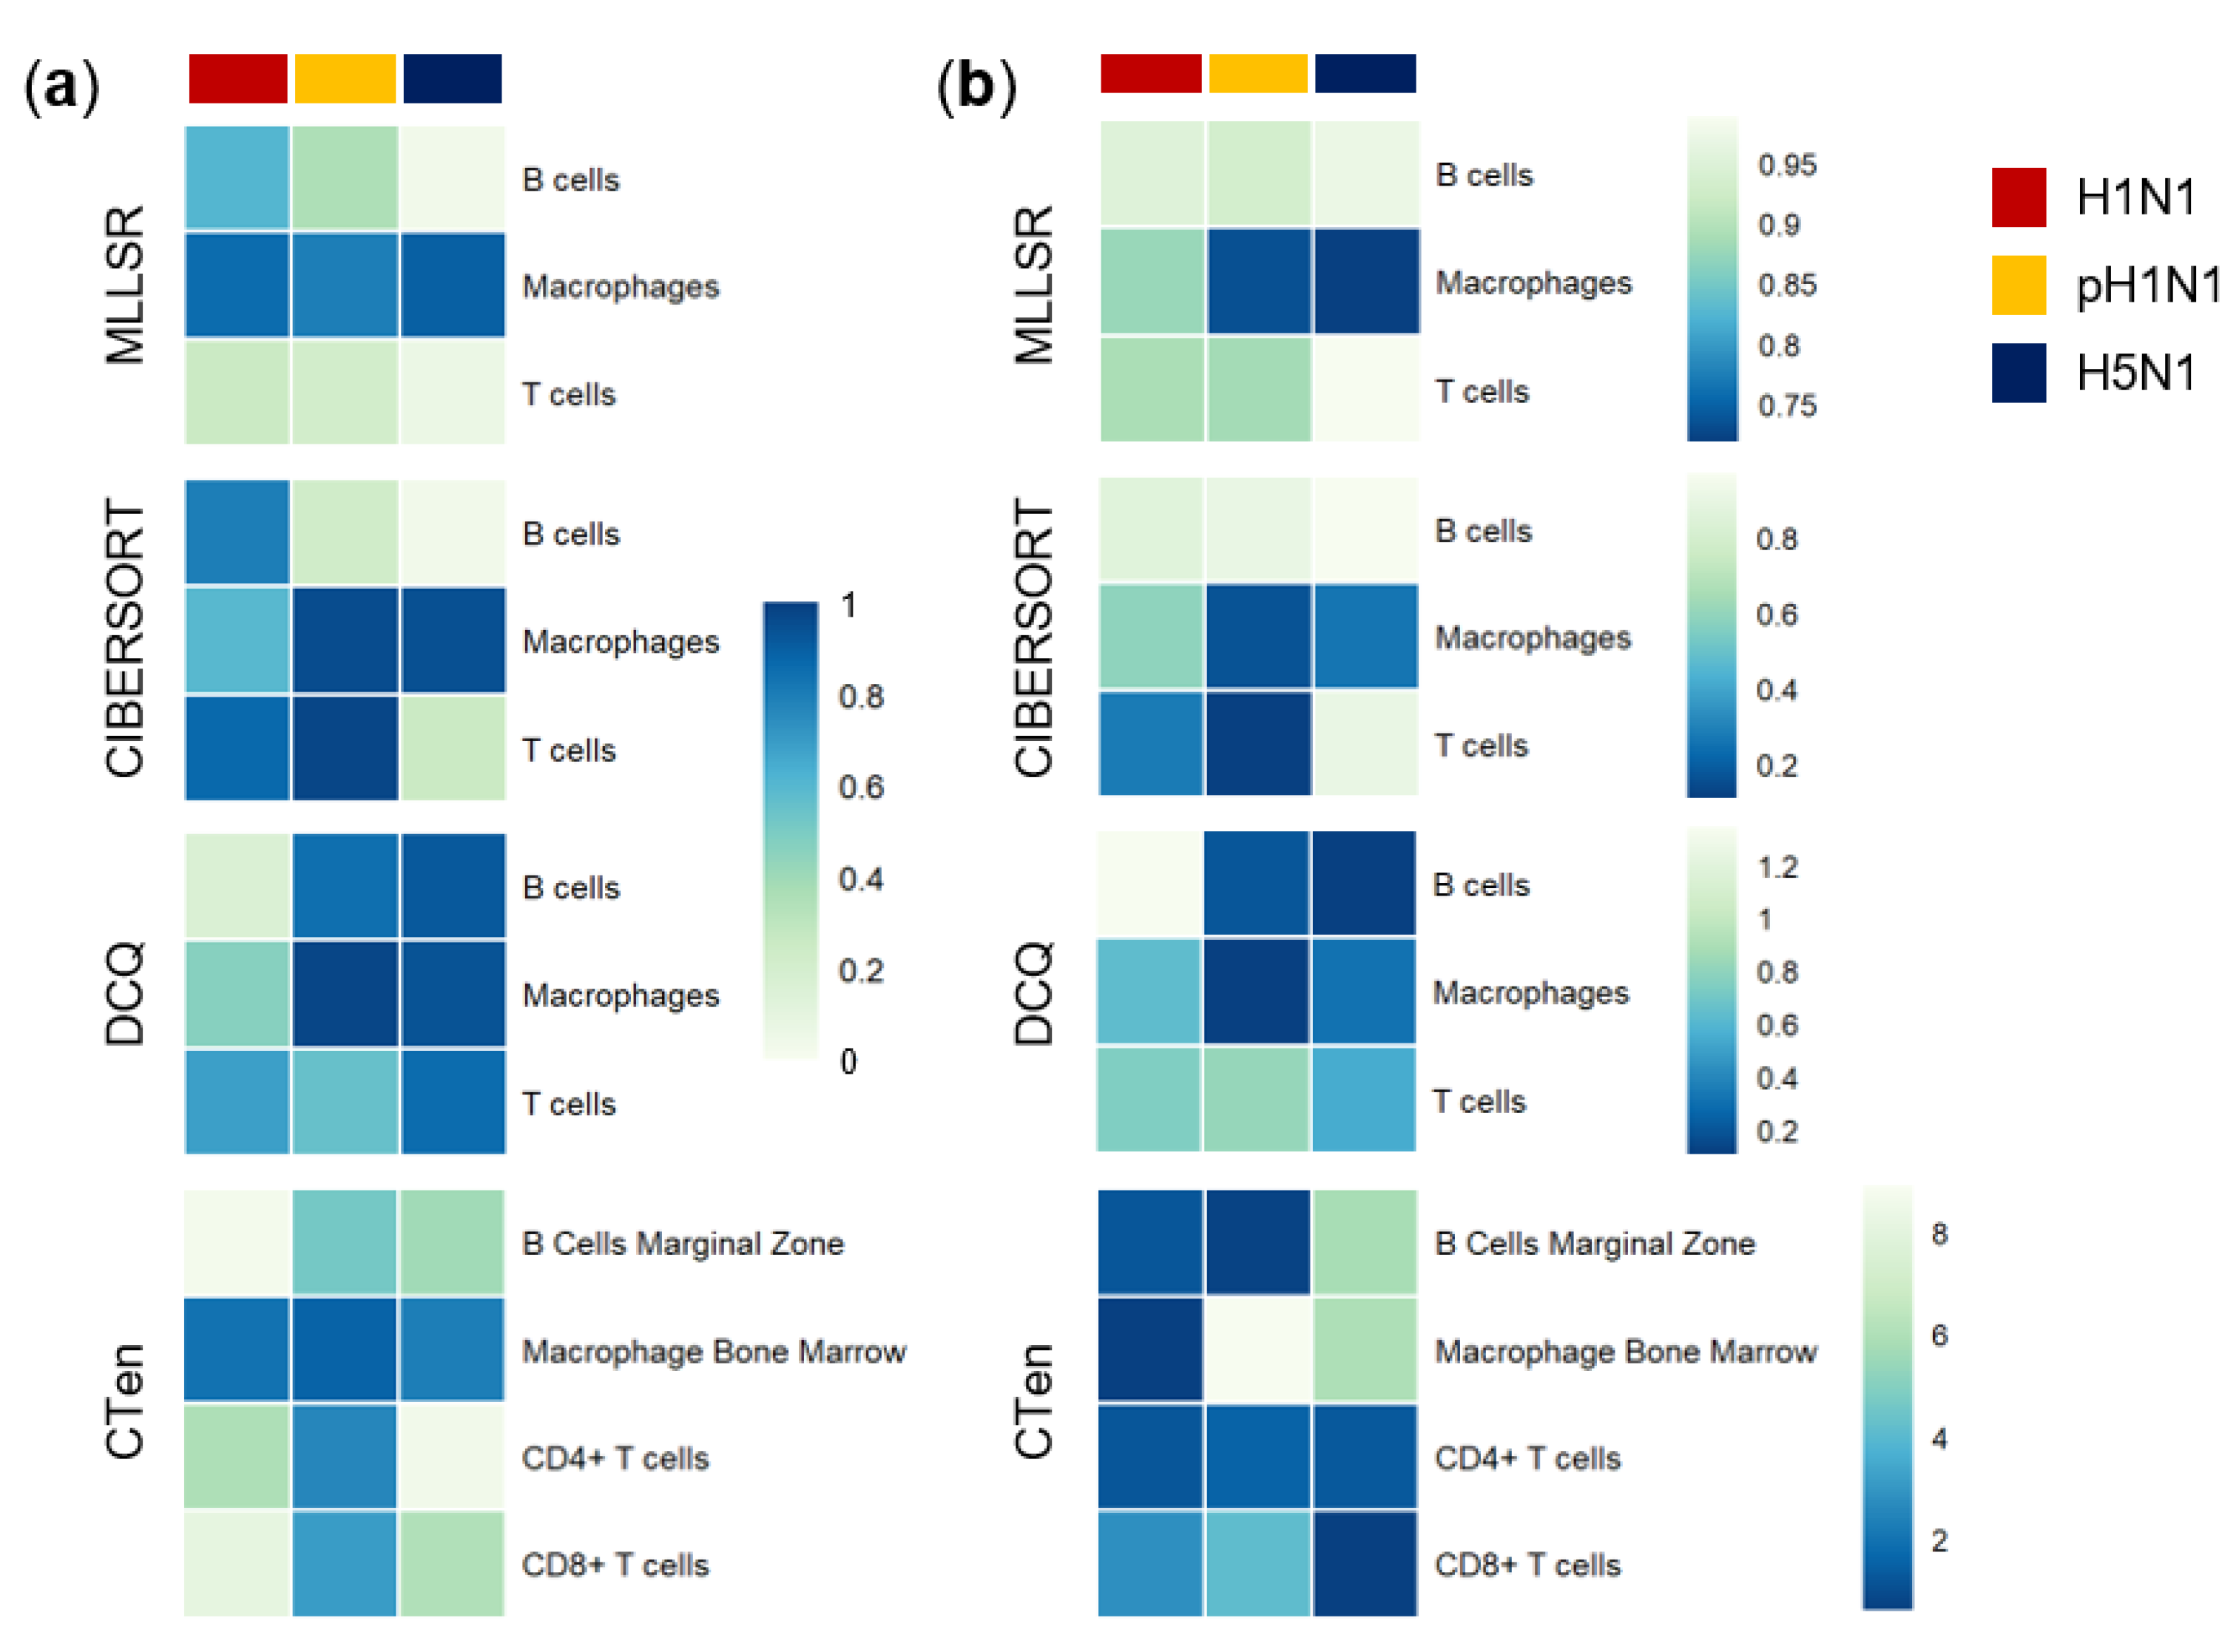
3.2. Cibersort More Accurately Predicts Quantity Changes of T Cells and Macrophages than MLLSR

As explained above, MLLSR and CIBERSORT utilize expression intensities of pure cells and cell mixture samples to calculate cell fractions by linear regression. To improve computational efficiency, they both recommend using expression intensities of user-selected cell marker genes instead of the whole genome. The major difference between the two algorithms is the regression tool they use (see Materials and Methods). Here we evaluate the accuracy of MLLSR and CIBERSORT in predicting the mean cell counts observed in H1N1, pH1N1 or H5N1-infected lung. Two performance measurements for accuracy were provided: the R 2 values and NMSE. As paired data from the same animal is not available (see Discussion on data limitations), we evaluate each algorithm’s ability to accurately predict the mean population observed (Materials and Methods).
MLLSR failed to capture average changes in immune cell populations while CIBERSORT demonstrates significantly better accuracy (Figure 3). Predicted fractions from MLLSR have comparatively low R 2 values and large NMSE scores for most cell types while CIBERSORT has improved R 2 and reduced NMSE. MLLSR’s predictions overestimated the fractions of macrophages to be more than 100% at several time points (Figure 3a). Estimations of macrophages from CIBERSORT had high R 2 values: 0.59, 0.95 and 0.95 for H1N1, pH1N1 and H5N1 respectively, with acceptable NMSE scores (0.59, 0.17, and 0.26), but similar to MLLSR, we observed that CIBERSORT had a tendency to predict higher macrophage counts than those measured (Figure 3b). CIBERSORT’s estimations on T cells, activated CD8+ T cells and DCs (Figure 3b and Figure S4, and Table S2) fit well with cell count data for select sample cohorts. For example, R 2 values of T cells was 0.86 and 0.97 for H1N1 and pH1N1 respectively while that of H5N1 was 0.25 (Figure 3b). When predicting less abundant cell types, MLLSR is unable to estimate CD4+ T cells and CIBERSORT fails to estimate CD8+ T cells (Table S2 and Figure S5). The R 2 values across all cell types and all cohorts for MLLSR was 0.13 and 0.34 for CIBERSORT (Figure S6).
Next, we analyzed the time course trajectories of predicted cell fractions. Although corresponding cell count data was lacking for the majority of time points which have gene expression data, the smoothness of the time-course cell quantity curve and the timescales associated with changes in cell fractions can provide another measurement of inference quality. Figure 4 displays estimated variation of cell populations across time. We observed that different from cell counts measured by FACS, predictions from MLLSR and CIBERSORT for B cells variate dramatically between 0 and 0.03 for at least one sample cohort (Figure 4a,b and Figure 2). Both algorithms failed to capture the decrease of B cells for H5N1, and predictions from MLLSR are mostly unchanged throughout the seven-day time frame. The increase of estimated macrophage fractions predicted using MLLSR and CIBERSORT is minimized for the H1N1 cohort than that of pH1N1 and H5N1, which is consistent with cell count data (Figure 4a,b and Figure 2). However, the estimations for pH1N1 by MLLSR reached a peak at day 2 and then decreased, and the estimated cell fractions of macrophage for H5N1 showed a quick increase and stayed at a high level beginning at day 1. All of these disagreed with cell count data (Figure 2). CIBERSORT’s performance in predicting macrophage cell counts is slightly improved relative to MLLSR as it better estimates the increase of macrophages for H5N1. For T cells, MLLSR and CIBERSORT accurately predict the increase of T cells for the H1N1 and pH1N1 cohorts, including that pH1N1 cohort has the highest increase among all cohorts, while they both fail to predict the steady behavior of H5N1 (Figure 4a,b and Figure 2). For other immune cell types, MLLSR estimates DCs to be almost unvaried and close to zero across the time points sampled for H1N1 (Figure S7). It also estimated CD4+ T cells and NK cells to be zero for almost all time points of all cohorts (Figure S7). Although this was corrected in predictions by CIBERSORT (Figure S8), both MLLSR and CIBERSORT cannot capture the rapid increase of DCs for the pH1N1 cohort. In general, CIBERSORT was more sensitive to the dynamic changes of immune cell quantities using gene expression profiles than that of MLLSR, and predicted time-course cell fractions from CIBERSORT were smoother than those of MLLSR.

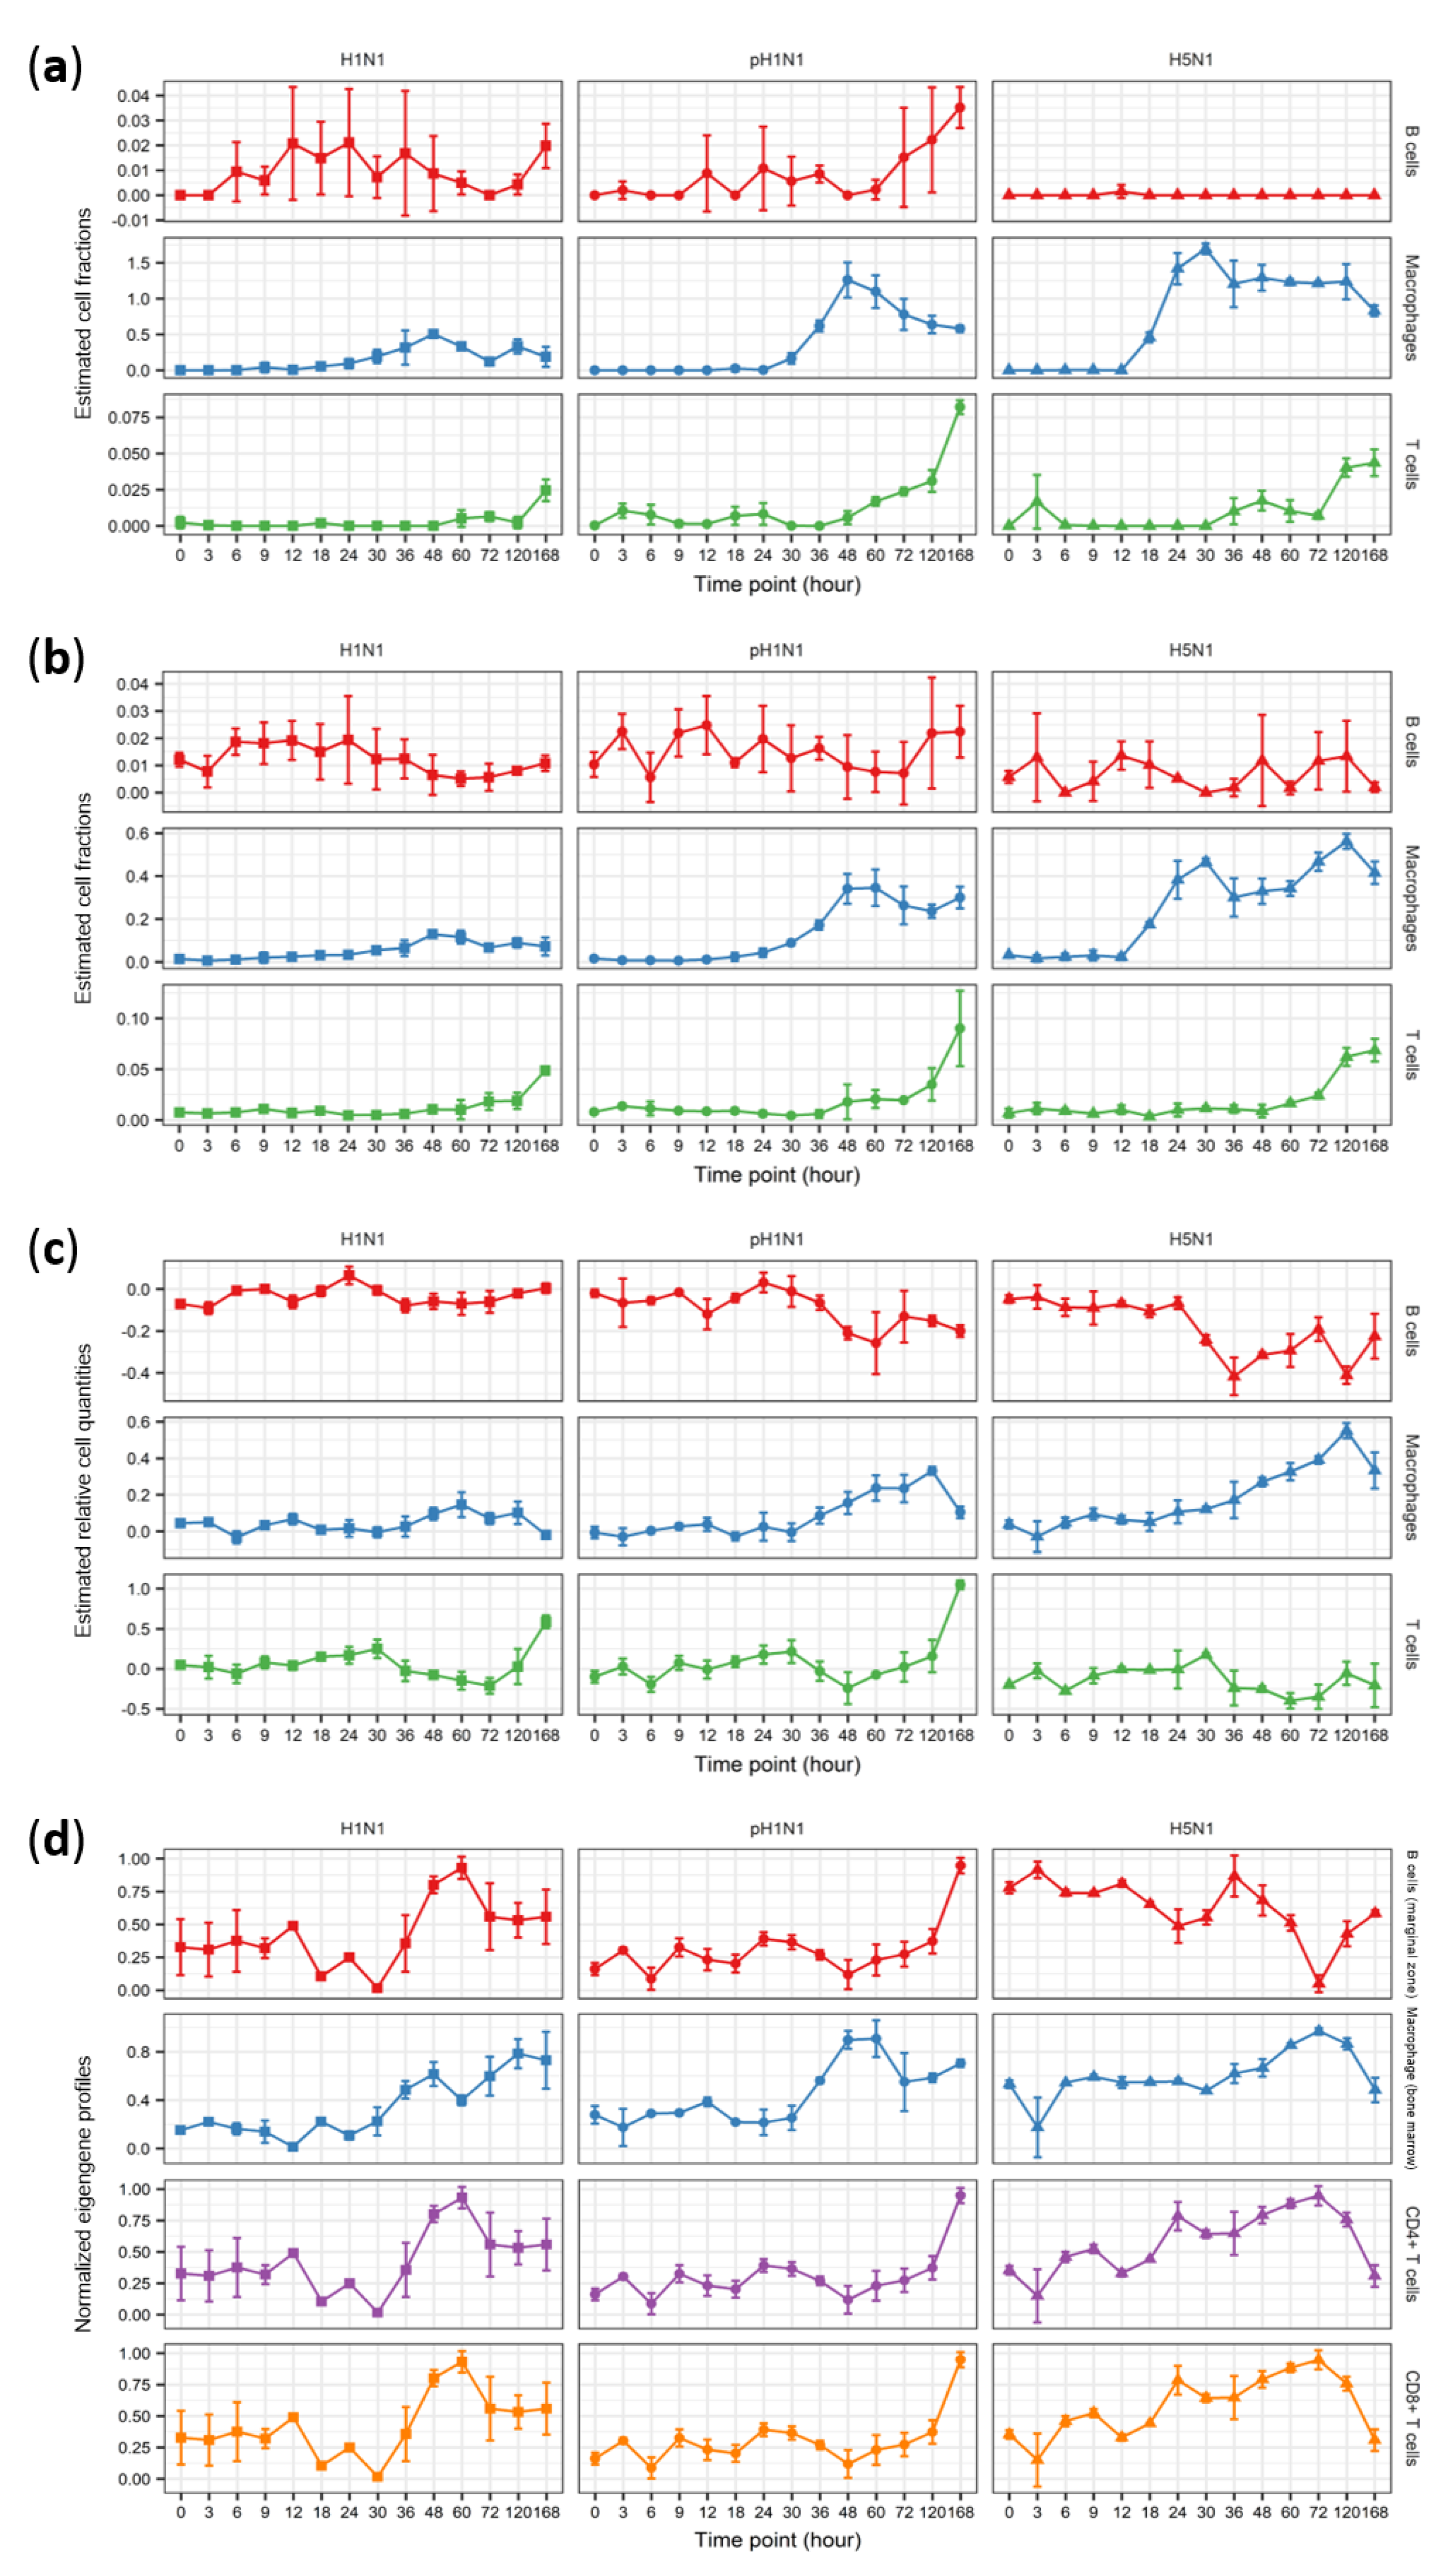
3.3. DCQ Correctly Predicts Relative Cell Quantities of B Cells and Macrophages for the pH1N1 and H5N1 Cohorts

DCQ assumes that there is a linear relation between gene expressions and cell quantities in the same way as MLLSR and CIBERSORT, though it differs from them in three ways: (i) the input data were prepared by comparing a test sample to a reference sample, and the output was the relative change in cell quantities instead of the actual cell proportions in the sample; (ii) DCQ depends on its built-in immune cell compendium for regression and thus lacks flexibility; (iii) relative cell quantities were predicted using elastic net regulation (See Materials and Methods and Figure 1b). Since DCQ predicts the relative change of cell quantity, we compare the estimated relative cell quantities with FACS-measured cell count data that are preprocessed in three different ways (Materials and Methods). We found that adjusting the cell counts by the total live number of cells provided the best fits when using DCQ (Figure S6). The following results (including R 2 and NMSE values) were based on this comparison.
Capable of predicting a variety of immune cell populations, DCQ performs well on subsets of the sample cohorts. As shown in Figure 5, its predictions of B cells show high R 2 values of 0.84 and 0.92 for the pH1N1 and H5N1 cohorts (NMSE = 0.19 and 0.12, respectively). However, the R 2 for H1N1 was 0.16 (NMSE = 1.34). For macrophages, the estimated relative cell quantities agree well with normalized cell counts (especially for pH1N1, R 2 = 0.98, NMSE = 0.11), while the estimations of H1N1 have lower accuracy (R 2 = 0.46, NMSE = 0.63). Analogous to MLLSR and CIBERSORT, DCQ also excessively estimates the quantities of macrophages for the H5N1 cohort (Figure S9). Regarding less abundant cell types such as natural killer T cells (NKT cells), DCQ was unable to correctly quantify its change of cell quantities using lung tissue microarray data (Table S2). The overall R 2 value calculated by comparing DCQ’s estimations to normalized cell count data was 0.32 for all sample cohorts.
Then we assessed DCQ’s estimations in the time course using the trend in cell quantity variation. DCQ successfully captures the observed decrease in B cells around day 2 in H5N1 but fails to detect the increase at day 7 for the H1N1 and pH1N1 cohorts (Figure 4c and Figure 2). For macrophages, DCQ outperforms CIBERSORT and accurately predicts the continuous increase starting from day 2 for the pH1N1 and H5N1 samples (with the exception of day 7 of H5N1). The stable behavior observed in T cell quantities is correctly predicted for the H5N1 cohort, while the rising accumulation of T cells after day 2 in pH1N1 samples is not captured. Additionally, DCQ failed to predict the apparent increase of neutrophils beginning at day 2 for H5N1 and the behavior of DCs for any sample cohort (Figures S3 and S10). In conclusion, DCQ is an effective tool for predicting select immune cell subsets and does not guarantee good performance for all samples.

3.4. CTen Shows High Accuracy When Predicting Dynamic Changes in Macrophages and Neutrophils for All Sample Cohorts

CTen, different from the aforementioned algorithms, did not predict cell quantities by linear regression. Instead, the approach suggests clustering the gene expression data and using overlap/enrichment to identify significant associations between clusters of genes and cell types. Here, we employed WGCNA to cluster genes with highly correlated expression [41]. The eigengene (first principle component) of each cluster was then used to quantify the mean change in the cell counts. The normalized eigengene profiles were not expected to have the same magnitude as cell count data, but NMSE scores are still provided as a reference with R 2 values.
CTen shows consistent performance among samples for most cell types tested. It performed well on all sample cohorts for macrophages and neutrophils. Normalized eigengene profiles of macrophages for each cohort show high R 2 values compared to measured cell counts (Figure 5 and Table S2): that of the H1N1 cohort is 0.84 (NMSE = 0.59), pH1N1 was 0.88 (NMSE = 8.89), and H5N1 was 0.80 (NMSE = 5.96). CTen’s estimations for neutrophils outperform DCQ with the H1N1 cohort R 2 = 0.70 (NMSE = 0.40), pH1N1 cohort R 2 = 0.96 (NMSE = 3.99), and H5N1 cohort R 2 = 0.86 (NMSE = 3.65). The R 2 values for H1N1, pH1N1 and H5N1 in NK cells were 0.59, 0.85, and 0.51, respectively, and in DCs were 0.41, 0.86, and 0.56, respectively (Table S2 and Figure S11). While the estimations for NK cells and DCs have relatively lower R 2 values, no cohort returns an extremely poor R 2 value. However, the normalized eigengene profiles of B cells did not fit well with cell count data (Figure 5 and Table S2), with an R 2 value of 0.03 for H1N1 (NMSE = 1.18), 0.52 for pH1N1 (NMSE = 0.68) and 0.40 for H5N1 (NMSE = 5.78). The R 2 value of CTen’s predictions across all samples was around 0.37, which was the highest of all four algorithms.
The trend in cell quantity change predicted by CTen aligned with FACS data for select cell types. CTen successfully captured the increase of macrophages at days 2 and 7 for the H1N1 cohort, as well as the increase at days 2 and 3 followed by the decrease at day 7 for H5N1 (Figure 4d). Within the pH1N1 cohort, the macrophage quantities were predicted to reach a peak before day 3 followed by a slight decrease, a trend which disagrees with cell count data. For neutrophils, CTen correctly estimated the increase at days 2 and 3 followed by a slight decrease at day 7 for pH1N1, and the constant increase for H5N1 though the estimated decrease at day 7 was inaccurate (Figure S12 and Table S3). For the H1N1 cohort, the increase of neutrophil quantities was overestimated compared to FACS data. Additionally, CTen vastly improved predictions of dynamic changes in NK cells and DCs. Predicted dynamic changes in CD4+ T cells were the same with those in CD8+ T cells as shown in Figure 4d. Based on measured cell counts, the quantities of both cell types did vary at a consistent pace (Figure 2), while the variation was not consistent with what CTen predicts. For example, CD4+ T cells and CD8+ T cells are relatively constant across time for the H5N1 cohort where CTen’s predictions show more deviation.

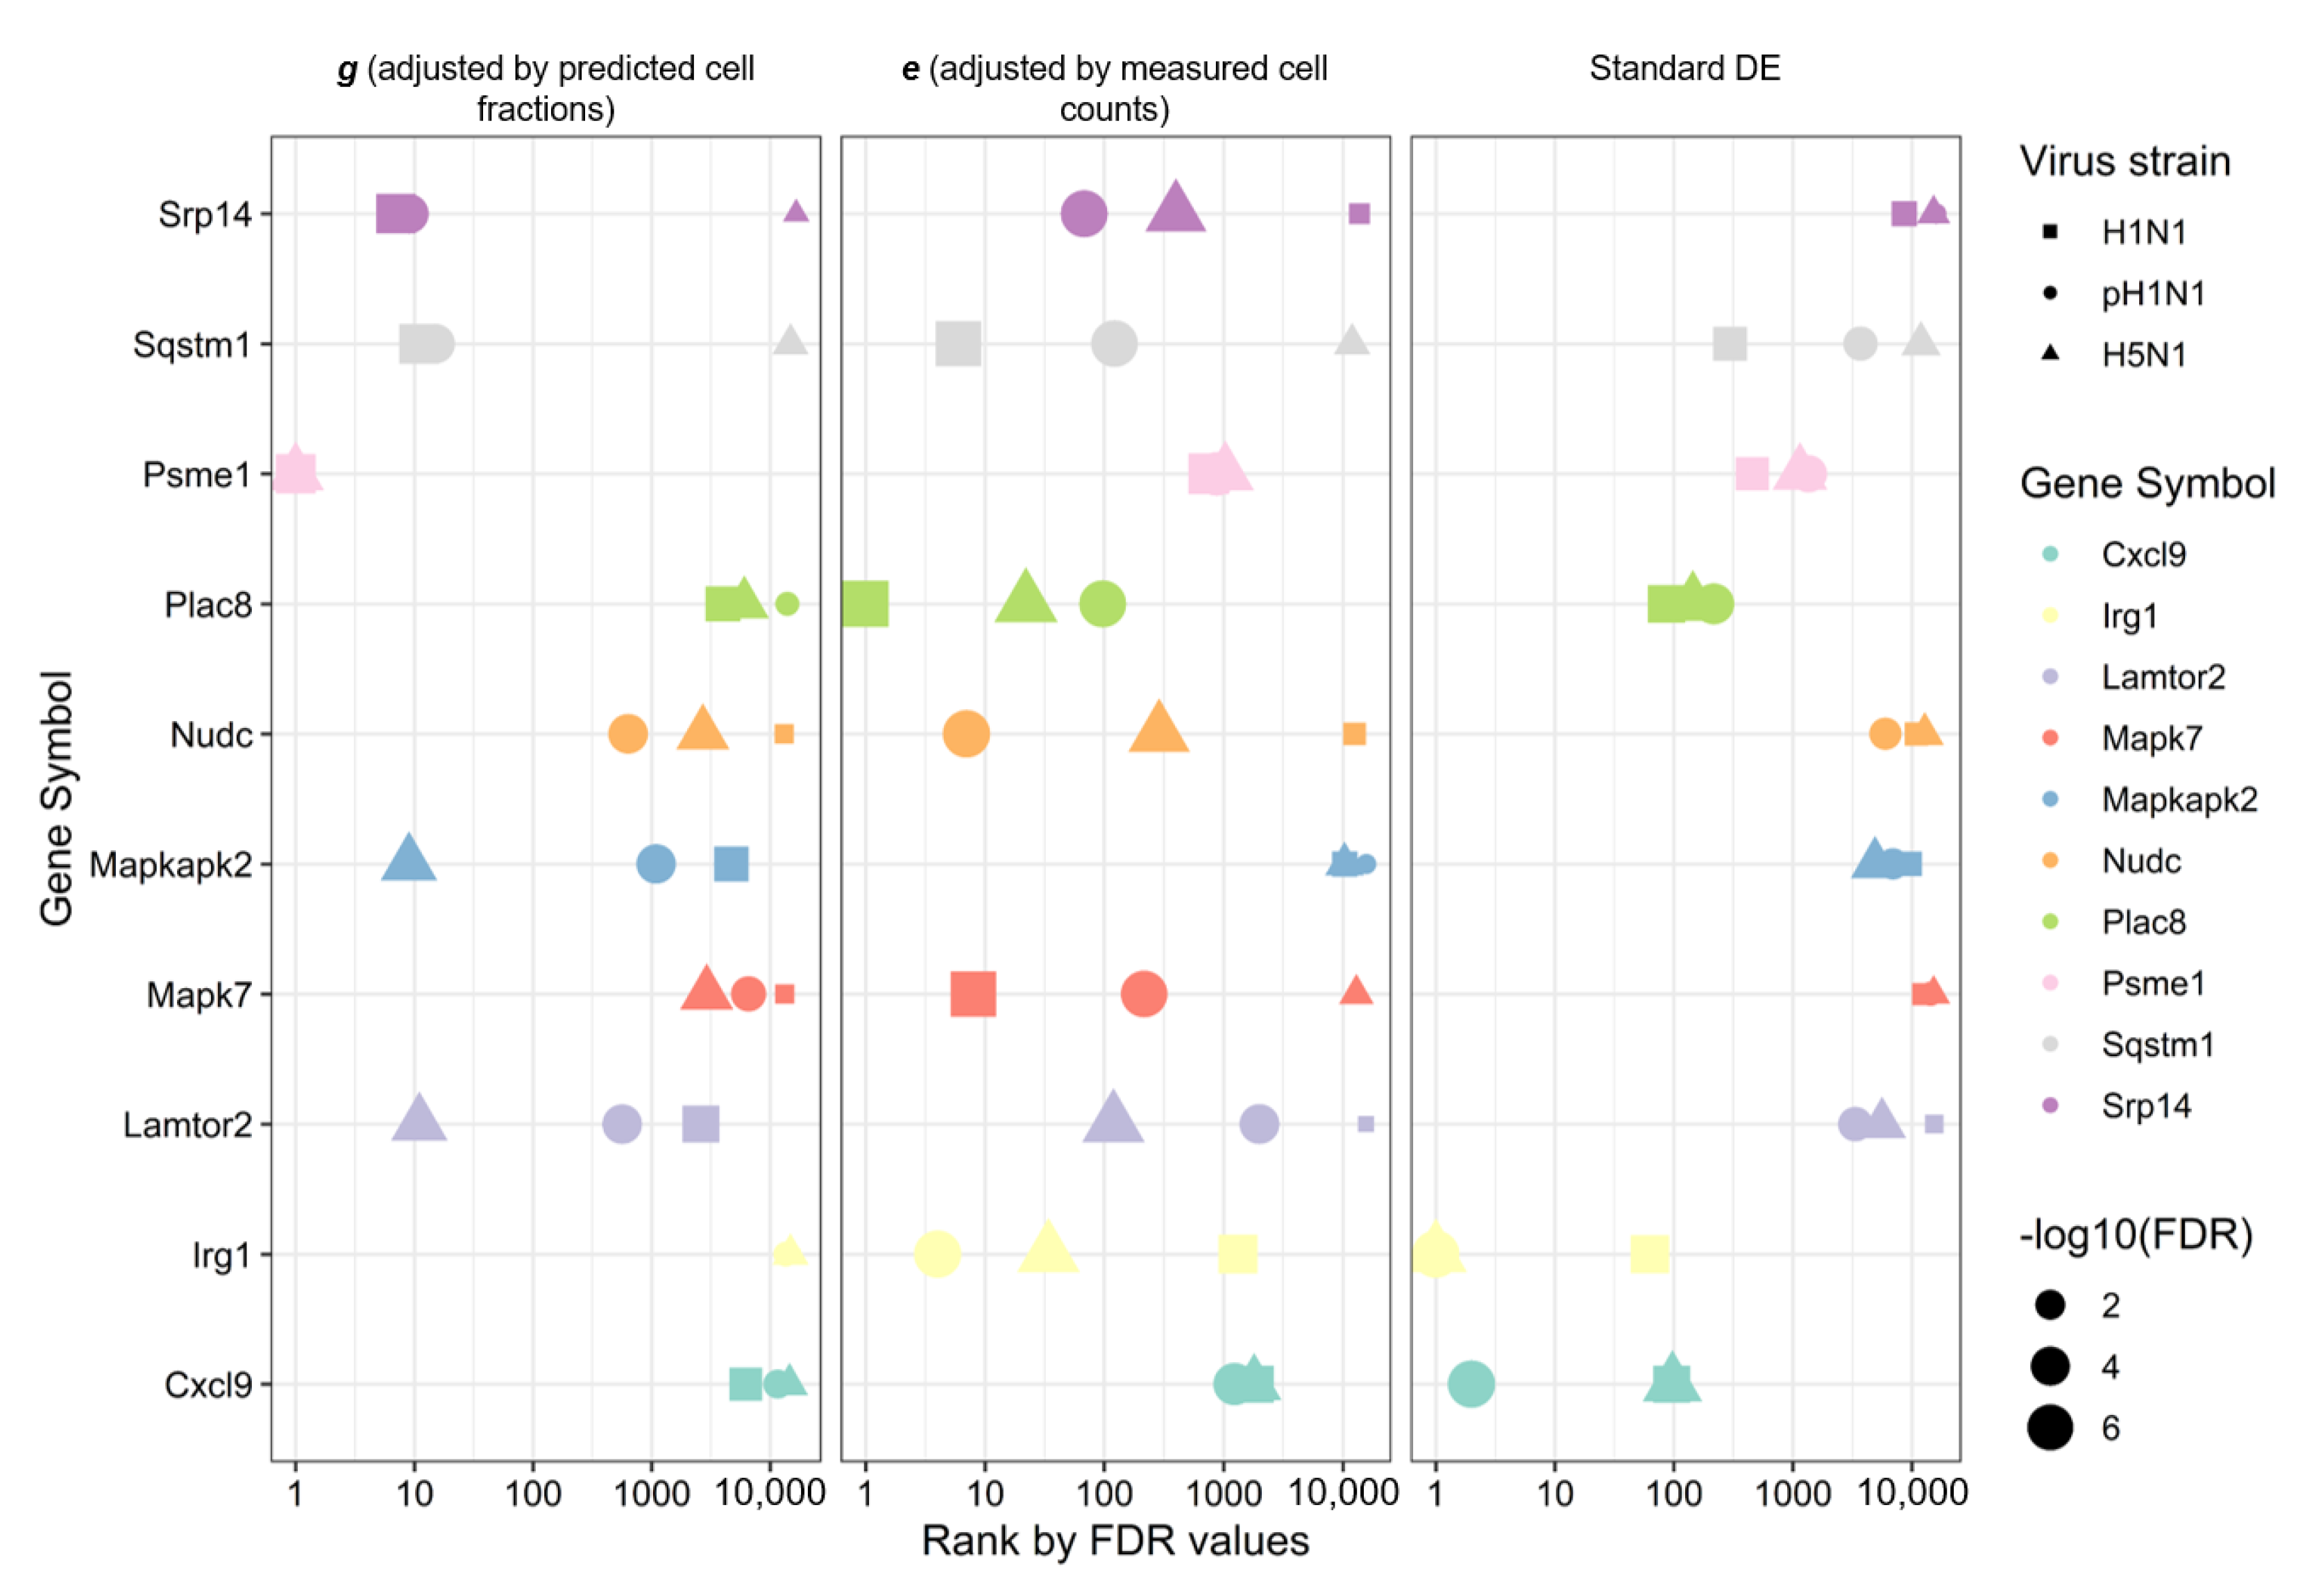
3.5. Improved Disease-Associated Gene Identification by Adjusting for Cellular Composition

One of the most important applications of deconvolution was to remove gene transcript count changes due to cell count changes, which should improve identification of gene expression activity associated more specifically with the disease being studied. Transcriptional profiles of diseased tissue varied over time as a result of both the fluctuation of immune cell populations (such as infiltration of macrophages and neutrophils) and the changes of the gene regulatory networks (activation or repression of certain genes). Based on this assumption, we demonstrated that deconvolution can be combined with statistical analysis to improve identification of disease-associated genes (see Materials and Methods). Briefly, changes in transcript levels due to changes in the cellular composition of the tissue were subtracted from the gene expression data. The resulting gene expression, represented by g (adjusted by predictions from CIBERSORT) or e (adjusted by cell counts from FACS), was then analyzed with established microarray statistical tools (e.g., “limma” [31]) to determine significant genes. The FDR values and associated ranks of genes generated using this adjusted gene expression were compared to those obtained through standard differential expression (DE) analysis of the unadjusted data.
Adjusted gene expression, based on either inference by CIBERSORT (i.e., g) or measured cell counts (i.e., e), largely improved FDR values and ranking for genes involved in influenza infection and the anti-viral immune response. Among the top 10 ranked genes obtained by sorting FDR values calculated from adjusted gene expression g, Psme1 was the most significant gene for all three sample cohorts (as shown in Figure 6 and Table S4). Srp14 is ranked 7th and 9th for the H1N1 and pH1N1 cohorts, respectively (ranked 16532th for H5N1). The human PSME1 protein interacts with influenza A virus protein neuraminidase (NA) according to the protein-protein interaction (PPI) database VirHostNet2 [45]. The human SRP14 protein interacts with influenza nucleoprotein (NP), polymerase acidic protein (PA), non-structural protein 1 (NS1), polymerase basic protein 2 (PB2), RNA-directed RNA polymerase catalytic subunit (PB1), hemagglutinin (HA), NA, and the matrix protein 1 (M1) [45]. Sqstm1, Mapkapk2, and Lamtor2 are also found in the 20 most significant genes for different cohorts (Figure 6 and Table S4), all of which are well known for being associated with the NF- κ B signaling [46] and MAPK/ERK pathways [47,48]. However, in the standard DE analysis based on original gene expression, Psme1 is ranked 456th, 1353th and 1145th for H1N1, pH1N1 and H5N1, respectively. Srp14 is not included in the top 1000 genes with much higher FDR values. For Sqstm1, Mapkapk2, and Lamtor2, genes which are considered important in adjusted gene expression analysis, their rank is significantly lower than those from adjusted gene expression (Figure 6). Instead, Cxcl9, the chemokine that attracts NK cells and T cells [49], is ranked higher using unadjusted gene expression data (2nd for the pH1N1 cohort). For significant genes obtained from adjusted gene expression e, which is computed based on cell counts measured by FACS, Plac8 is ranked 1st, 97th and 22nd for the H1N1, pH1N1 and H5N1 cohorts, respectively, whose human protein interacts with PB1 [45]. Nudc is ranked 7th and 288th for the pH1N1 and H5N1 cohorts (12499th for the H1N1 cohort). The human NUDC protein interacts with M1, HA, and NA proteins [45]. Similar to the adjusted gene expression g, we find Sqstm1 and Mapk7 among the top 10 genes. Furthermore, Irg1 is ranked 4th and 34th for pH1N1 and H5N1 cohorts, respectively. This gene is considered significant through standard differential analysis while regarded as rather insignificant by gene expression adjusted by predictions from CIBERSORT with FDR values greater than 0.01 for all sample cohorts. This indicates that using adjusted gene expression values is better isolating gene expression associated directly with virus replication while using unadjusted expression is isolating immune response events induced by the infection while the ability of identifying disease-associated genes depends on the approach of adjustment.
When considering functional enrichment analysis of DE gene sets, unadjusted expression identified several key virus-infection-associated processes while adjusted gene expression filters out part of the annotations associated with inflammatory response. For example, significant genes (FDR < 10 4 for at least two timepoints, see Materials and Methods) obtained from adjusted gene expression g for the pH1N1 cohort are enriched in antigen processing and presentation, 4-iron-4-sulfur cluster binding and small GTP-binding protein domain (Table S5). The H1N1 and H5N1 cohorts are enriched in Ras-association, endoplasmic reticulum (ER), protein transport and proteasome. All three sample cohorts were enriched in cadherin binding involved in cell-cell adhesion, ribosomal protein (Table S5). In contrast, significant genes from standard DE analysis were associated with annotations related to response to virus and 2-5-oligoadenylate synthetase for all sample cohorts (Table S6). Both the pH1N1 and H5N1 cohorts were highly enriched in chemotaxis, cytokine activity, cellular response to interferon-gamma and cell cycle (Table S6). For significant genes calculated from adjusted gene expression e, their enriched functional annotations were similar to those for standard DE. All sample cohorts were enriched in 2 -5 -oligoadenylate synthase, innate immune response, and both pH1N1 and H5N1 cohorts are enriched in cellular response to interferon-gamma (Table S7). The H1N1 cohort is also related to RNA binding and regulation of transcription, and the pH1N1 is associated with antigen processing and presentation as well as GTP binding.

4. Discussion

In this work, we applied four deconvolution algorithms to microarray data from mouse lung tissue infected by the influenza virus and tested their accuracy on predicting either absolute or relative changes in cell counts. Most algorithms predict well on several cell types for select sample cohorts except MLLSR, which is unsuccessful in the majority cohorts/cell types tested and has the lowest R 2 value. We utilized the estimated cell quantities to modify differential expression analysis and demonstrated that the adjusted gene expression largely improves the statistical significance of disease-associated genes and the efficiency of discovering key factors.
The first major caveat of the presented work is that the data is unpaired. Ideally, the gene expression and cell count data would come from the same animals. But in mice studies, tissue quantity is limited, and it is very common for pathology studies to have unpaired data (i.e., data from different animals) [23,50,51,52]. We justify our approach here of evaluating the ability of the algorithms to predict the mean cell counts (or mean change in cell counts) as the animals used for lung gene expression and those for lung cell counts were infected with the same viruses, at the same initial loads, in the same laboratory and demonstrated the same symptoms and disease characteristics over time (e.g., weight loss, general lethargy and death due to infection were consistent [23]). Furthermore, the mice having the same genetic background were housed in the same facilities and treated in the same manner during the experiments. Future work will focus on collecting paired gene expression and cell count data to provide a more thorough analysis of deconvolution algorithm’s predictive performance. Yet, this work is still highly significant as whole genome gene expression analysis is a common and established tool to characterize disease-associated gene expression, and the findings summarized below strongly suggest that changes in tissue cellular composition must be addressed to improve prioritization of disease-associated gene candidates.
Based on the analysis of microarray data of influenza-infected mouse lungs, we find that the clustering-based algorithm, CTen, provides the most accurate cell count estimates. This improved predictive performance is likely due to the ability of CTen to infer across time points, whereas MLLSR, CIBERSORT and DCQ compute each time point independently. In addition, the regression-based tools analyzed here require much more reference data than CTen. These problems raise additional questions about the ability of select regression-based algorithms to infer accurately when applied to tissue samples, even though they demonstrated reasonable performance in the deconvolution of samples comprised of only 3 or 4 cell populations [26,29]. Therefore, future research on cell count inference of time-course transcriptional profiles should consider either the more advanced clustering technologies (e.g., t-SNE [53]), or the models in the regression algorithms should be modified to account for time-course dynamics.
The regression-based algorithms can be utilized to infer cell quantities when applied to data from single time points and if the suitable reference data is available. This study finds that CIBERSORT provides more accurate predictions than MLLSR or DCQ for expression profiles sampled at a single time point. We also find that the inference accuracy of the tested algorithms is independent of the scale of the cell count data for CIBERSORT, MLLSR and CTen, but DCQ shows a significant association with the scale of the data having an R 2 value of 0.26 (as shown in Figure S13), suggesting that the accuracy of DCQ is biased to larger cell populations.
Finally, we demonstrate that adjusting gene expression due to changing cell populations within the tissue improves the identification of disease-associated genes. However, the discovery of influenza virus-associated genes was improved at the cost of weakening the identification of biological functions. A possible explanation is that we utilized a strict cutoff of FDR values for all sample cohorts (FDR < 10 4 for at least two timepoints) in order to limit the number of genes for functional annotation analysis (Tables S5 and S7). Another important reason may be that the adjustment due to changing cellular composition was moderately accurate since the estimated cell fractions have an overall R 2 value no larger than 0.4 when compared with measured cell counts. But despite the limitation, our study emphasizes that the adjustment of cell composition applied to transcriptomic data improves identification of meaningful genes which could be used as potential drug targets. Further improvement of deconvolution algorithms will greatly advance the systems biology and bioinformatics communities’ ability to accurately model complex disease in tissue and improve the discovery of disease-associated genes.

Supplementary Materials

The following are available online at https://www.mdpi.com/2227-9717/7/5/301/s1, Figure S1: Scale-free topology fit using the WGCNA, Figure S2: The estimated total number of cells in influenza virus-infected samples; Figure S3: Cell counts of total live cells, T cell subsets, neutrophils, DCs, NK cells and NKT cells; Figure S4: Log fold change of estimated cell fractions by CIBERSORT in comparison with log fold change of measured cell counts; Figure S5: Log fold change of estimated cell fractions by MLLSR in comparison with log fold change of measured cell counts; Figure S6: Estimated cell quantities by four algorithms in comparison with measured cell counts for all samples; Figure S7: Estimated cell fractions across time using MLLSR; Figure S8: Estimated cell fractions across time using CIBERSORT; Figure S9: Estimated relative cell quantities by DCQ in comparison with the change in normalized cell counts; Figure S10: Estimated relative cell quantities across time using DCQ; Figure S11: Normalized eigengene profiles by CTen and WGCNA in comparison with measured cell counts; Figure S12: Normalized eigengene profiles of modules enriched in immune cells; Figure S13: R 2 values of associated predicted cell quantities versus average cell counts; Table S1: Antibodies used in flow cytometry for each cell type; Table S2: R 2 values and NMSE for predictions from each algorithm; Table S3: Modules from WGCNA that are enriched in immune cell subsets; Table S4: Genes sorted by FDR values calculated based on adjusted expression and standard differential expression analysis; Table S5: Functional annotations for genes obtained from adjusted gene expression g; Table S6: Functional annotations for genes obtained from standard DE analysis; Table S7: Functional annotations for genes obtained from adjusted gene expression e.

Author Contributions

Conceptualization, J.E.S.; methodology, M.W.; formal analysis, M.W.; investigation, S.F. and M.W.; writing—original draft preparation, M.W.; writing—review and editing, J.E.S.; visualization, M.W.; supervision, J.E.S. and Y.K.

Funding

This research received no external funding.

Conflicts of Interest

The authors declare no conflict of interest.

References

  1. Mackroth, M.S.; Abel, A.; Steeg, C.; Schulze Zur Wiesch, J.; Jacobs, T. Acute Malaria Induces PD1+CTLA4+ Effector T Cells with Cell-Extrinsic Suppressor Function. PLoS Pathog. 2016, 12, e1005909. [Google Scholar] [CrossRef] [PubMed]
  2. Ostroumov, D.; Fekete-Drimusz, N.; Saborowski, M.; Kuhnel, F.; Woller, N. CD4 and CD8 T lymphocyte interplay in controlling tumor growth. Cell. Mol. Life Sci. 2018, 75, 689–713. [Google Scholar] [CrossRef]
  3. Dendrou, C.A.; Fugger, L.; Friese, M.A. Immunopathology of multiple sclerosis. Nat. Rev. Immunol. 2015, 15, 545–558. [Google Scholar] [CrossRef] [PubMed]
  4. Josset, L.; Belser, J.A.; Pantin-Jackwood, M.J.; Chang, J.H.; Chang, S.T.; Belisle, S.E.; Tumpey, T.M.; Katze, M.G. Implication of inflammatory macrophages, nuclear receptors, and interferon regulatory factors in increased virulence of pandemic 2009 H1N1 influenza A virus after host adaptation. J. Virol. 2012, 86, 7192–7206. [Google Scholar] [CrossRef] [PubMed]
  5. Warrington, R.; Watson, W.; Kim, H.L.; Antonetti, F.R. An introduction to immunology and immunopathology. Allergy Asthma Clin. Immunol. 2011, 7 (Suppl. 1), S1. [Google Scholar] [CrossRef] [PubMed]
  6. Nakaya, H.I.; Wrammert, J.; Lee, E.K.; Racioppi, L.; Marie-Kunze, S.; Haining, W.N.; Means, A.R.; Kasturi, S.P.; Khan, N.; Li, G.M.; et al. Systems biology of vaccination for seasonal influenza in humans. Nat. Immunol. 2011, 12, 786–795. [Google Scholar] [CrossRef] [PubMed] [Green Version]
  7. Obermoser, G.; Presnell, S.; Domico, K.; Xu, H.; Wang, Y.; Anguiano, E.; Thompson-Snipes, L.; Ranganathan, R.; Zeitner, B.; Bjork, A.; et al. Systems scale interactive exploration reveals quantitative and qualitative differences in response to influenza and pneumococcal vaccines. Immunity 2013, 38, 831–844. [Google Scholar] [CrossRef] [PubMed]
  8. Kaech, S.M.; Ahmed, R. Memory CD8+ T cell differentiation: Initial antigen encounter triggers a developmental program in naive cells. Nat. Immunol. 2001, 2, 415–422. [Google Scholar] [CrossRef]
  9. Luster, A.D.; Alon, R.; von Andrian, U.H. Immune cell migration in inflammation: Present and future therapeutic targets. Nat. Immunol. 2005, 6, 1182–1190. [Google Scholar] [CrossRef]
  10. Lang, P.A.; Lang, K.S.; Xu, H.C.; Grusdat, M.; Parish, I.A.; Recher, M.; Elford, A.R.; Dhanji, S.; Shaabani, N.; Tran, C.W.; et al. Natural killer cell activation enhances immune pathology and promotes chronic infection by limiting CD8+ T-cell immunity. Proc. Natl. Acad. Sci. USA 2012, 109, 1210–1215. [Google Scholar] [CrossRef]
  11. Lam, V.C.; Lanier, L.L. NK cells in host responses to viral infections. Curr. Opin. Immunol. 2017, 44, 43–51. [Google Scholar] [CrossRef] [PubMed] [Green Version]
  12. Morrison, J.; Josset, L.; Tchitchek, N.; Chang, J.; Belser, J.A.; Swayne, D.E.; Pantin-Jackwood, M.J.; Tumpey, T.M.; Katze, M.G. H7N9 and other pathogenic avian influenza viruses elicit a three-pronged transcriptomic signature that is reminiscent of 1918 influenza virus and is associated with lethal outcome in mice. J. Virol. 2014, 88, 10556–10568. [Google Scholar] [CrossRef] [PubMed]
  13. Peiris, J.S.; Cheung, C.Y.; Leung, C.Y.; Nicholls, J.M. Innate immune responses to influenza A H5N1: Friend or foe? Trends Immunol. 2009, 30, 574–584. [Google Scholar] [CrossRef]
  14. Cilloniz, C.; Shinya, K.; Peng, X.; Korth, M.J.; Proll, S.C.; Aicher, L.D.; Carter, V.S.; Chang, J.H.; Kobasa, D.; Feldmann, F.; et al. Lethal influenza virus infection in macaques is associated with early dysregulation of inflammatory related genes. PLoS Pathog. 2009, 5, e1000604. [Google Scholar] [CrossRef]
  15. Brandes, M.; Klauschen, F.; Kuchen, S.; Germain, R.N. A systems analysis identifies a feedforward inflammatory circuit leading to lethal influenza infection. Cell 2013, 154, 197–212. [Google Scholar] [CrossRef]
  16. Carter, M.J. A rationale for using steroids in the treatment of severe cases of H5N1 avian influenza. J. Med. Microbiol. 2007, 56, 875–883. [Google Scholar] [CrossRef] [Green Version]
  17. Shinya, K.; Ito, M.; Makino, A.; Tanaka, M.; Miyake, K.; Eisfeld, A.J.; Kawaoka, Y. The TLR4-TRIF pathway protects against H5N1 influenza virus infection. J. Virol. 2012, 86, 19–24. [Google Scholar] [CrossRef]
  18. Tanaka, A.; Nakamura, S.; Seki, M.; Fukudome, K.; Iwanaga, N.; Imamura, Y.; Miyazaki, T.; Izumikawa, K.; Kakeya, H.; Yanagihara, K.; et al. Toll-like receptor 4 agonistic antibody promotes innate immunity against severe pneumonia induced by coinfection with influenza virus and Streptococcus pneumoniae. Clin. Vaccine Immunol. 2013, 20, 977–985. [Google Scholar] [CrossRef]
  19. Ibrahim, S.F.; van den Engh, G. Flow cytometry and cell sorting. Adv. Biochem. Eng. Biotechnol. 2007, 106, 19–39. [Google Scholar] [CrossRef]
  20. Bhattacharya, S.; Dunn, P.; Thomas, C.G.; Smith, B.; Schaefer, H.; Chen, J.; Hu, Z.; Zalocusky, K.A.; Shankar, R.D.; Shen-Orr, S.S.; et al. ImmPort, toward repurposing of open access immunological assay data for translational and clinical research. Sci. Data 2018, 5, 180015. [Google Scholar] [CrossRef] [Green Version]
  21. Edgar, R.; Domrachev, M.; Lash, A.E. Gene Expression Omnibus: NCBI gene expression and hybridization array data repository. Nucleic Acids Res. 2002, 30, 207–210. [Google Scholar] [CrossRef] [Green Version]
  22. Shoemaker, J.E.; Lopes, T.J.; Ghosh, S.; Matsuoka, Y.; Kawaoka, Y.; Kitano, H. CTen: A web-based platform for identifying enriched cell types from heterogeneous microarray data. BMC Genom. 2012, 13, 460. [Google Scholar] [CrossRef]
  23. Shoemaker, J.E.; Fukuyama, S.; Eisfeld, A.J.; Zhao, D.; Kawakami, E.; Sakabe, S.; Maemura, T.; Gorai, T.; Katsura, H.; Muramoto, Y.; et al. An Ultrasensitive Mechanism Regulates Influenza Virus-Induced Inflammation. PLoS Pathog. 2015, 11, e1004856. [Google Scholar] [CrossRef] [PubMed]
  24. Wang, M.; Master, S.R.; Chodosh, L.A. Computational expression deconvolution in a complex mammalian organ. BMC Bioinform. 2006, 7, 328. [Google Scholar] [CrossRef]
  25. Zhong, Y.; Wan, Y.W.; Pang, K.; Chow, L.M.; Liu, Z. Digital sorting of complex tissues for cell type-specific gene expression profiles. BMC Bioinform. 2013, 14, 89. [Google Scholar] [CrossRef]
  26. Abbas, A.R.; Wolslegel, K.; Seshasayee, D.; Modrusan, Z.; Clark, H.F. Deconvolution of blood microarray data identifies cellular activation patterns in systemic lupus erythematosus. PLoS ONE 2009, 4, e6098. [Google Scholar] [CrossRef]
  27. Lu, P.; Nakorchevskiy, A.; Marcotte, E.M. Expression deconvolution: A reinterpretation of DNA microarray data reveals dynamic changes in cell populations. Proc. Natl. Acad. Sci. USA 2003, 100, 10370–10375. [Google Scholar] [CrossRef] [Green Version]
  28. Altboum, Z.; Steuerman, Y.; David, E.; Barnett-Itzhaki, Z.; Valadarsky, L.; Keren-Shaul, H.; Meningher, T.; Mendelson, E.; Mandelboim, M.; Gat-Viks, I.; et al. Digital cell quantification identifies global immune cell dynamics during influenza infection. Mol. Syst. Biol. 2014, 10, 720. [Google Scholar] [CrossRef] [PubMed]
  29. Newman, A.M.; Liu, C.L.; Green, M.R.; Gentles, A.J.; Feng, W.; Xu, Y.; Hoang, C.D.; Diehn, M.; Alizadeh, A.A. Robust enumeration of cell subsets from tissue expression profiles. Nat. Methods 2015, 12, 453–457. [Google Scholar] [CrossRef] [Green Version]
  30. Liebner, D.A.; Huang, K.; Parvin, J.D. MMAD: Microarray microdissection with analysis of differences is a computational tool for deconvoluting cell type-specific contributions from tissue samples. Bioinformatics 2014, 30, 682–689. [Google Scholar] [CrossRef]
  31. Ritchie, M.E.; Phipson, B.; Wu, D.; Hu, Y.; Law, C.W.; Shi, W.; Smyth, G.K. limma powers differential expression analyses for RNA-sequencing and microarray studies. Nucleic Acids Res. 2015, 43, e47. [Google Scholar] [CrossRef]
  32. Escoubet-Lozach, L.; Benner, C.; Kaikkonen, M.U.; Lozach, J.; Heinz, S.; Spann, N.J.; Crotti, A.; Stender, J.; Ghisletti, S.; Reichart, D.; et al. Mechanisms establishing TLR4-responsive activation states of inflammatory response genes. PLoS Genet. 2011, 7, e1002401. [Google Scholar] [CrossRef]
  33. Pan, F.; Yu, H.; Dang, E.V.; Barbi, J.; Pan, X.; Grosso, J.F.; Jinasena, D.; Sharma, S.M.; McCadden, E.M.; Getnet, D.; et al. Eos mediates Foxp3-dependent gene silencing in CD4+ regulatory T cells. Science 2009, 325, 1142–1146. [Google Scholar] [CrossRef]
  34. DiSpirito, J.R.; Shen, H. Expression Analysis of Resting and Stimulated naïVe and MP CD8 T Cells. 2012. Available online: https://www.ncbi.nlm.nih.gov/geo/query/acc.cgi?acc=GSE16145 (accessed on 6 January 2017).
  35. Liu, X.; Qu, X.; Chen, Y.; Liao, L.; Cheng, K.; Shao, C.; Zenke, M.; Keating, A.; Zhao, R.C. Mesenchymal stem/stromal cells induce the generation of novel IL-10-dependent regulatory dendritic cells by SOCS3 activation. J. Immunol. 2012, 189, 1182–1192. [Google Scholar] [CrossRef]
  36. Al Moussawi, K.; Ghigo, E.; Kalinke, U.; Alexopoulou, L.; Mege, J.L.; Desnues, B. Type I interferon induction is detrimental during infection with the Whipple’s disease bacterium, Tropheryma whipplei. PLoS Pathog. 2010, 6, e1000722. [Google Scholar] [CrossRef]
  37. Ghigo, E.; Barry, A.O.; Pretat, L.; Al Moussawi, K.; Desnues, B.; Capo, C.; Kornfeld, H.; Mege, J.L. IL-16 promotes T. whipplei replication by inhibiting phagosome conversion and modulating macrophage activation. PLoS ONE 2010, 5, e13561. [Google Scholar] [CrossRef]
  38. Swirski, F.K.; Nahrendorf, M.; Etzrodt, M.; Wildgruber, M.; Cortez-Retamozo, V.; Panizzi, P.; Figueiredo, J.L.; Kohler, R.H.; Chudnovskiy, A.; Waterman, P.; et al. Identification of splenic reservoir monocytes and their deployment to inflammatory sites. Science 2009, 325, 612–616. [Google Scholar] [CrossRef]
  39. Latorre, A.O.; Caniceiro, B.D.; Fukumasu, H.; Gardner, D.R.; Lopes, F.M.; Wysochi, H.L.J.; da Silva, T.C.; Haraguchi, M.; Bressan, F.F.; Gorniak, S.L. Ptaquiloside reduces NK cell activities by enhancing metallothionein expression, which is prevented by selenium. Toxicology 2013, 304, 100–108. [Google Scholar] [CrossRef] [Green Version]
  40. Heng, T.S.; Painter, M.W.; Immunological Genome Project Consortium. The Immunological Genome Project: Networks of gene expression in immune cells. Nat. Immunol. 2008, 9, 1091–1094. [Google Scholar] [CrossRef]
  41. Langfelder, P.; Horvath, S. WGCNA: An R package for weighted correlation network analysis. BMC Bioinform. 2008, 9, 559. [Google Scholar] [CrossRef]
  42. Hasegawa, K.; Sato, A.; Tanimura, K.; Uemasu, K.; Hamakawa, Y.; Fuseya, Y.; Sato, S.; Muro, S.; Hirai, T. Fraction of MHCII and EpCAM expression characterizes distal lung epithelial cells for alveolar type 2 cell isolation. Respir. Res. 2017, 18, 150. [Google Scholar] [CrossRef] [Green Version]
  43. Huang da, W.; Sherman, B.T.; Lempicki, R.A. Systematic and integrative analysis of large gene lists using DAVID bioinformatics resources. Nat. Protoc. 2009, 4, 44–57. [Google Scholar] [CrossRef]
  44. Huang, D.W.; Sherman, B.T.; Lempicki, R.A. Bioinformatics enrichment tools: Paths toward the comprehensive functional analysis of large gene lists. Nucleic Acids Res. 2009, 37, 1–13. [Google Scholar] [CrossRef]
  45. Guirimand, T.; Delmotte, S.; Navratil, V. VirHostNet 2.0: Surfing on the web of virus/host molecular interactions data. Nucleic Acids Res. 2015, 43, D583–D587. [Google Scholar] [CrossRef]
  46. Duran, A.; Linares, J.F.; Galvez, A.S.; Wikenheiser, K.; Flores, J.M.; Diaz-Meco, M.T.; Moscat, J. The signaling adaptor p62 is an important NF-kappaB mediator in tumorigenesis. Cancer Cell 2008, 13, 343–354. [Google Scholar] [CrossRef]
  47. Scheffler, J.M.; Sparber, F.; Tripp, C.H.; Herrmann, C.; Humenberger, A.; Blitz, J.; Romani, N.; Stoitzner, P.; Huber, L.A. LAMTOR2 regulates dendritic cell homeostasis through FLT3-dependent mTOR signalling. Nat. Commun. 2014, 5, 5138. [Google Scholar] [CrossRef] [Green Version]
  48. Zhang, W.; Liu, H.T. MAPK signal pathways in the regulation of cell proliferation in mammalian cells. Cell Res. 2002, 12, 9–18. [Google Scholar] [CrossRef] [Green Version]
  49. Muller, M.; Carter, S.; Hofer, M.J.; Campbell, I.L. Review: The chemokine receptor CXCR3 and its ligands CXCL9, CXCL10 and CXCL11 in neuroimmunity—A tale of conflict and conundrum. Neuropathol. Appl. Neurobiol. 2010, 36, 368–387. [Google Scholar] [CrossRef]
  50. Kiso, M.; Lopes, T.J.S.; Yamayoshi, S.; Ito, M.; Yamashita, M.; Nakajima, N.; Hasegawa, H.; Neumann, G.; Kawaoka, Y. Combination Therapy With Neuraminidase and Polymerase Inhibitors in Nude Mice Infected With Influenza Virus. J. Infect. Dis. 2018, 217, 887–896. [Google Scholar] [CrossRef]
  51. Ueki, H.; Wang, I.H.; Fukuyama, S.; Katsura, H.; da Silva Lopes, T.J.; Neumann, G.; Kawaoka, Y. In vivo imaging of the pathophysiological changes and neutrophil dynamics in influenza virus-infected mouse lungs. Proc. Natl. Acad. Sci. USA 2018, 115, E6622–E6629. [Google Scholar] [CrossRef]
  52. Iwatsuki-Horimoto, K.; Nakajima, N.; Ichiko, Y.; Sakai-Tagawa, Y.; Noda, T.; Hasegawa, H.; Kawaoka, Y. Syrian Hamster as an Animal Model for the Study of Human Influenza Virus Infection. J. Virol. 2018, 92. [Google Scholar] [CrossRef] [PubMed]
  53. Briggs, J.A.; Weinreb, C.; Wagner, D.E.; Megason, S.; Peshkin, L.; Kirschner, M.W.; Klein, A.M. The dynamics of gene expression in vertebrate embryogenesis at single-cell resolution. Science 2018, 360, eaar5780. [Google Scholar] [CrossRef] [PubMed]
Figure 1. Overview of deconvolution algorithms. (a) Gene transcript counts change as the cellular makeup of a sample changes. Deconvolution algorithms postulate that the change in the cellular makeup of the tissue can be inferred from the tissue’s gene expression by exploiting the transcriptional profiles of pure cells. (b) Inputs, mathematical operations and outputs of the four deconvolution algorithms reviewed in this paper.
Processes 07 00301 g001
Figure 2. Cell counts of B cells, macrophages, and T cells in mouse lungs after infection by either H1N1, pH1N1 or H5N1 virus. Day 0 data are from uninfected, control animals. * Animals infected by H5N1 died before day 7.
Processes 07 00301 g002
Figure 3. Log fold change (virus infection versus mock) of estimated cell fractions by modified linear least-squares regression (LLSR) (a) and cell-type identification by estimating relative subsets of RNA transcripts (CIBERSORT) (b) in comparison with log fold change of cell counts measured by fluorescence-activated cell sorting (FACS) for B cells, macrophages and T cells. Concordance is characterized by R 2 and normalized mean squared error (NMSE) values. The black line is y = x while the grey dashed line is regression.
Processes 07 00301 g003
Figure 4. Estimated cell quantities of B cells, macrophages and T cells across time obtained using (a) MLLSR, (b) CIBERSORT, (c) digital cell quantification (DCQ), and (d) cell type enrichment (CTen). There were three samples per time point. Error bars depict the standard deviation of the estimate.
Processes 07 00301 g004
Figure 5. Two measurements for the accuracy of predicted cell quantities. Log fold changes of estimated cell fractions from MLLSR or CIBERSORT are compared with log fold changes of cell counts at the same time point per virus strain to compute R 2 (a) and NMSE (b). Similarly, R 2 (a) and NMSE (b) values for DCQ are calculated as estimated relative cell quantities versus change of normalized cell counts. R 2 (a) and NMSE (b) of CTen’s predictions are calculated as eigengene profiles against log fold changes of cell counts.
Processes 07 00301 g005
Figure 6. Ranking and false discovery rate (FDR) values of significant genes from calculating adjusted gene expressions and standard differential expression (DE) analysis.
Processes 07 00301 g006

