Article

Calibration of Discrete-Element-Method Parameters for Cohesive Materials Using Dynamic-Yield-Strength and Shear-Cell Experiments

1
Department of Chemical and Biochemical Engineering, Rutgers, The State University of New Jersey, Piscataway, NJ 08854, USA
2
School of Chemical Engineering, Purdue University, West Lafayette, IN 47907, USA
3
School of Mechanical Engineering, Purdue University, West Lafayette, IN 47907, USA
4
BASF Corporation, Beachwood, OH 23700, USA
5
BASF Corporation, 67056 Ludwigshafen, Germany
*
Author to whom correspondence should be addressed.
Current address: USFDA, Silver Spring, Maryland, USA.
Current address: Tokyo Electron US Holdings, Inc., New York, NY, USA.
Processes 2019, 7(5), 278; https://doi.org/10.3390/pr7050278
Submission received: 4 April 2019 / Revised: 29 April 2019 / Accepted: 2 May 2019 / Published: 13 May 2019
(This article belongs to the Special Issue Recent Advances in Population Balance Modeling)

Abstract

:
This study tested the effectiveness of using dynamic yield strength (DYS) and shear-cell experiments to calibrate the following discrete-element-method (DEM) parameters: surface energy, and the coefficients of sliding and rolling friction. These experiments were carried out on cohesive granules, and DEM models were developed for these experiment setups using the JKR cohesion contact model. Parameter-sensitivity analysis on the DYS model showed that the DYS results in the simulations were highly sensitive to surface energy and were also impacted by the values of the two friction coefficients. These results indicated that the DYS model could be used to calibrate the surface energy parameter once the friction coefficients were fixed. Shear-cell sensitivity analysis study found that the influence of surface energy on the critical-state shear value cannot be neglected. It was inferred that the shear-cell model has to be used together with the DYS model to identify the right set of friction parameters. Next, surface energy was calibrated using DYS simulations for a chosen set of friction parameters. Calibrations were successfully conducted for simulations involving experimentally sized particles, scaled-up particles, a different shear modulus, and a different set of friction parameters. In all these cases, the simulation DYS results were found to be linearly correlated with surface energy and were within 5% of the experimental DYS result. Shear-cell simulations were then used to compare calibrated surface-energy values for the scaled-up particles with the experimentally sized particles. Both the simulations resulted in similar critical-state shear values. Finally, it was demonstrated that a combination of DYS and shear-cell simulations could be used to compare two sets of friction parameters and their corresponding calibrated surface energy values to identify the set of parameters that better represent the flow behavior demonstrated by the experimental system.

1. Introduction and Objectives

Cohesive granular materials are encountered in a variety of industries, such as food processing, agriculture, geotechnical industries, and pharmaceuticals. These materials go through a range of processing operations, from feeding [1], mixing [2], granulation [3,4], drying [5], roller compaction [6] to transport and storage operations [7]. The flow of these materials can influence product quality, production rate, and the type of manufacturing operations utilized in product design [8]. This makes the study of cohesive granular flow an essential area of research.
The discrete-element method (DEM) has become a popular computational technique for simulating granular motion ever since Cundall and Strack [9] first demonstrated its usefulness for studying granular behavior. The movement of particles in DEM is governed by the laws of physics, and DEM tracks every particle and all its interactions throughout a simulation domain. It can be used to study the effects of changes in material properties, particle sizes, equipment design, and operating conditions [10], making it a useful tool to gain insight related to the flow of particles in equipment.
DEM can be used to simulate cohesive granular materials with the help of cohesive contact models. Cohesiveness can be due to the inherent nature of a material or it can be caused by wetting with water or other binding agents. Different contact models exist in the DEM literature for simulating different types of cohesive behaviors, such as the linear cohesion model [11], the JKR model [12], and liquid-bridge models [13,14]. These models have been shown to be reliable for prediction in many studies. The JKR model was used in a study of mixing of glass beads in a single blade mixer [15]. Changes in mixing performance were found to be similar for both dry and wet glass beads for the same changes in the blade rake angles. Mukherjee et al. [16] studied the discharge rates of cohesive particle flow in a hopper by using a contact model containing a dimensionless parameter called the Bond number that combined the cohesion effects of van der Waals forces, electrostatic forces, and force due to liquid bridges. The study found that the hopper discharge rates decreased with increasing Bond numbers and also that there would be no discharge above a critical Bond number as the cohesive forces were more dominant than the particle weight. Guo et al. developed a DEM model to predict the flow behavior of wet fibers with the help of a liquid-bridge contact model and validated it by comparing the simulated angle of repose values to experimental values [17]. Radl et al. used a capillary force model to simulate wet granules inside a four-bladed mixer and showed that the mixing of particles with low moisture is heterogeneous due to agglomerates that break at specific regions near the impeller [18]. A study by Wu et al. [19] simulated the aggregate skeletons of different gradations in asphalt mixture and found that there is higher load resistance in fine-gradation compared to coarse-gradation of asphalt mixture. Remy et al. [20] used a DEM study to find that mixing performance improves for granular particles with low moisture content when compared to dry material, but the performance deteriorates when the moisture content is high.
Although DEM is good for simulating granular flow behavior, it has three major limitations:
  • DEM simulations are computationally expensive and take a long time to complete due to small time-step sizes and large numbers of particles that are tracked as they move through the system.
  • The approximation of complex particle shapes using spheres, usually done to reduce computational burden, might not reflect the true nature of the particles being simulated.
  • Calibration of DEM parameters to match particle flow behavior in the experimental system is a challenge.
The first two limitations can be reasonably addressed if one has access to high-performance computing resources [21]. We seek to address the third limitation in this study.
Some of the methods available in the literature for the calibration of DEM parameters for noncohesive systems are described here. Sandpile tests were used to adequately calibrate the rolling-friction coefficient between particles and between a particle and wall [22]. Sen et al. [23] studied the mixing of three free-flowing materials in a bin blender by first calibrating the friction coefficients of those materials by using angle-of-repose simulations. The mixing model was then used to identify superpotent and subpotent regions inside the blender. Zhou et al. [24] also conducted angle-of-repose simulations on noncohesive spheres and formulated a calibrating equation relating the angle of repose to coefficients of sliding and rolling frictions. Do et al. [25] used genetic-algorithm and direct-optimization techniques to calibrate coefficients of sliding and rolling frictions of the DEM particles based on experiment results of angle-of-repose tests and hourglass discharge times for quartz sand. Simons et al. [26] conducted sensitivity analysis on ring shear-cell DEM simulations for cohesionless particles and concluded that sliding- and rolling-friction parameters can be calibrated using the shear cell if Young’s modulus was predefined. Cheng et al. [27] developed an iterative Bayesian tool for the calibration of the shear modulus and the friction coefficients of glass beads that underwent loading and unloading cycles of oedometric compression. A study by Ostanin et al. [28] calibrated the parameters for a mesoscopic DEM simulation of nanocrystalline particles by matching peak force and critical strain of nanoindentation tests in the simulations. A method for calibrating DEM parameters to simulate cohesionless soil using in situ sinkage tests and nonlinear optimization was developed by Asaf et al. [29].
Although a large variety of cohesion models exist, the methods available for calibrating cohesive systems are far fewer compared to free-flowing systems. The angle of repose method, which works well for noncohesive systems, might not apply to cohesive systems, as cohesive forces might be too large for gravitational flow. Tsunazawa et al. [30] developed a cohesion model that considered liquid-bridge and adhesion forces, and validated the cohesive parameters by showing that the flow of wet glass beads in a pan pelletizer was in good agreement with the experimental flow behavior at various rotation speeds. In this study, the sliding-friction parameter was calibrated using angle-of-repose experiment values for the dry material. Wang et al. [31] calibrated the linear viscous coefficient and the local damping parameter for a mesoscopic DEM model of two carbon nanotubes using data collected from molecular-dynamics simulations. A DEM study of the FT4 powder rheometer on silanized glass beads [32] utilized an experimental drop test developed by Zafar et al. [33] to determine the surface-energy parameter for the JKR cohesive model.
This work proposes an alternative method for the calibration of highly cohesive particles by exploring the use of dynamic yield strength (DYS) and shear-cell simulations as calibration methods for simulating wet granular particles using the JKR cohesion model in DEM. The objectives of this study are as follows:
  • Develop a DEM model for dynamic-yield-strength measurements and use it to calibrate the surface energy between particles.
  • Develop a DEM model for a parallel-plate shear cell and calibrate the coefficient of sliding friction (CoSF) and the coefficient of rolling friction (CoRF) parameters for particle–particle interactions.

2. Experiment Setup

2.1. Materials

The studies were performed using a copper- and lime-based proprietary mixture of powders. These powders were blended in a 5 L plowshare mixer operated at 200 RPM. Powder flow tests on the blend using a Freeman FT-4 powder rheometer found that the blend had an average flow factor value of 1.7, indicating very cohesive and poorly flowing behavior. More details of the blend are given in Table 1.

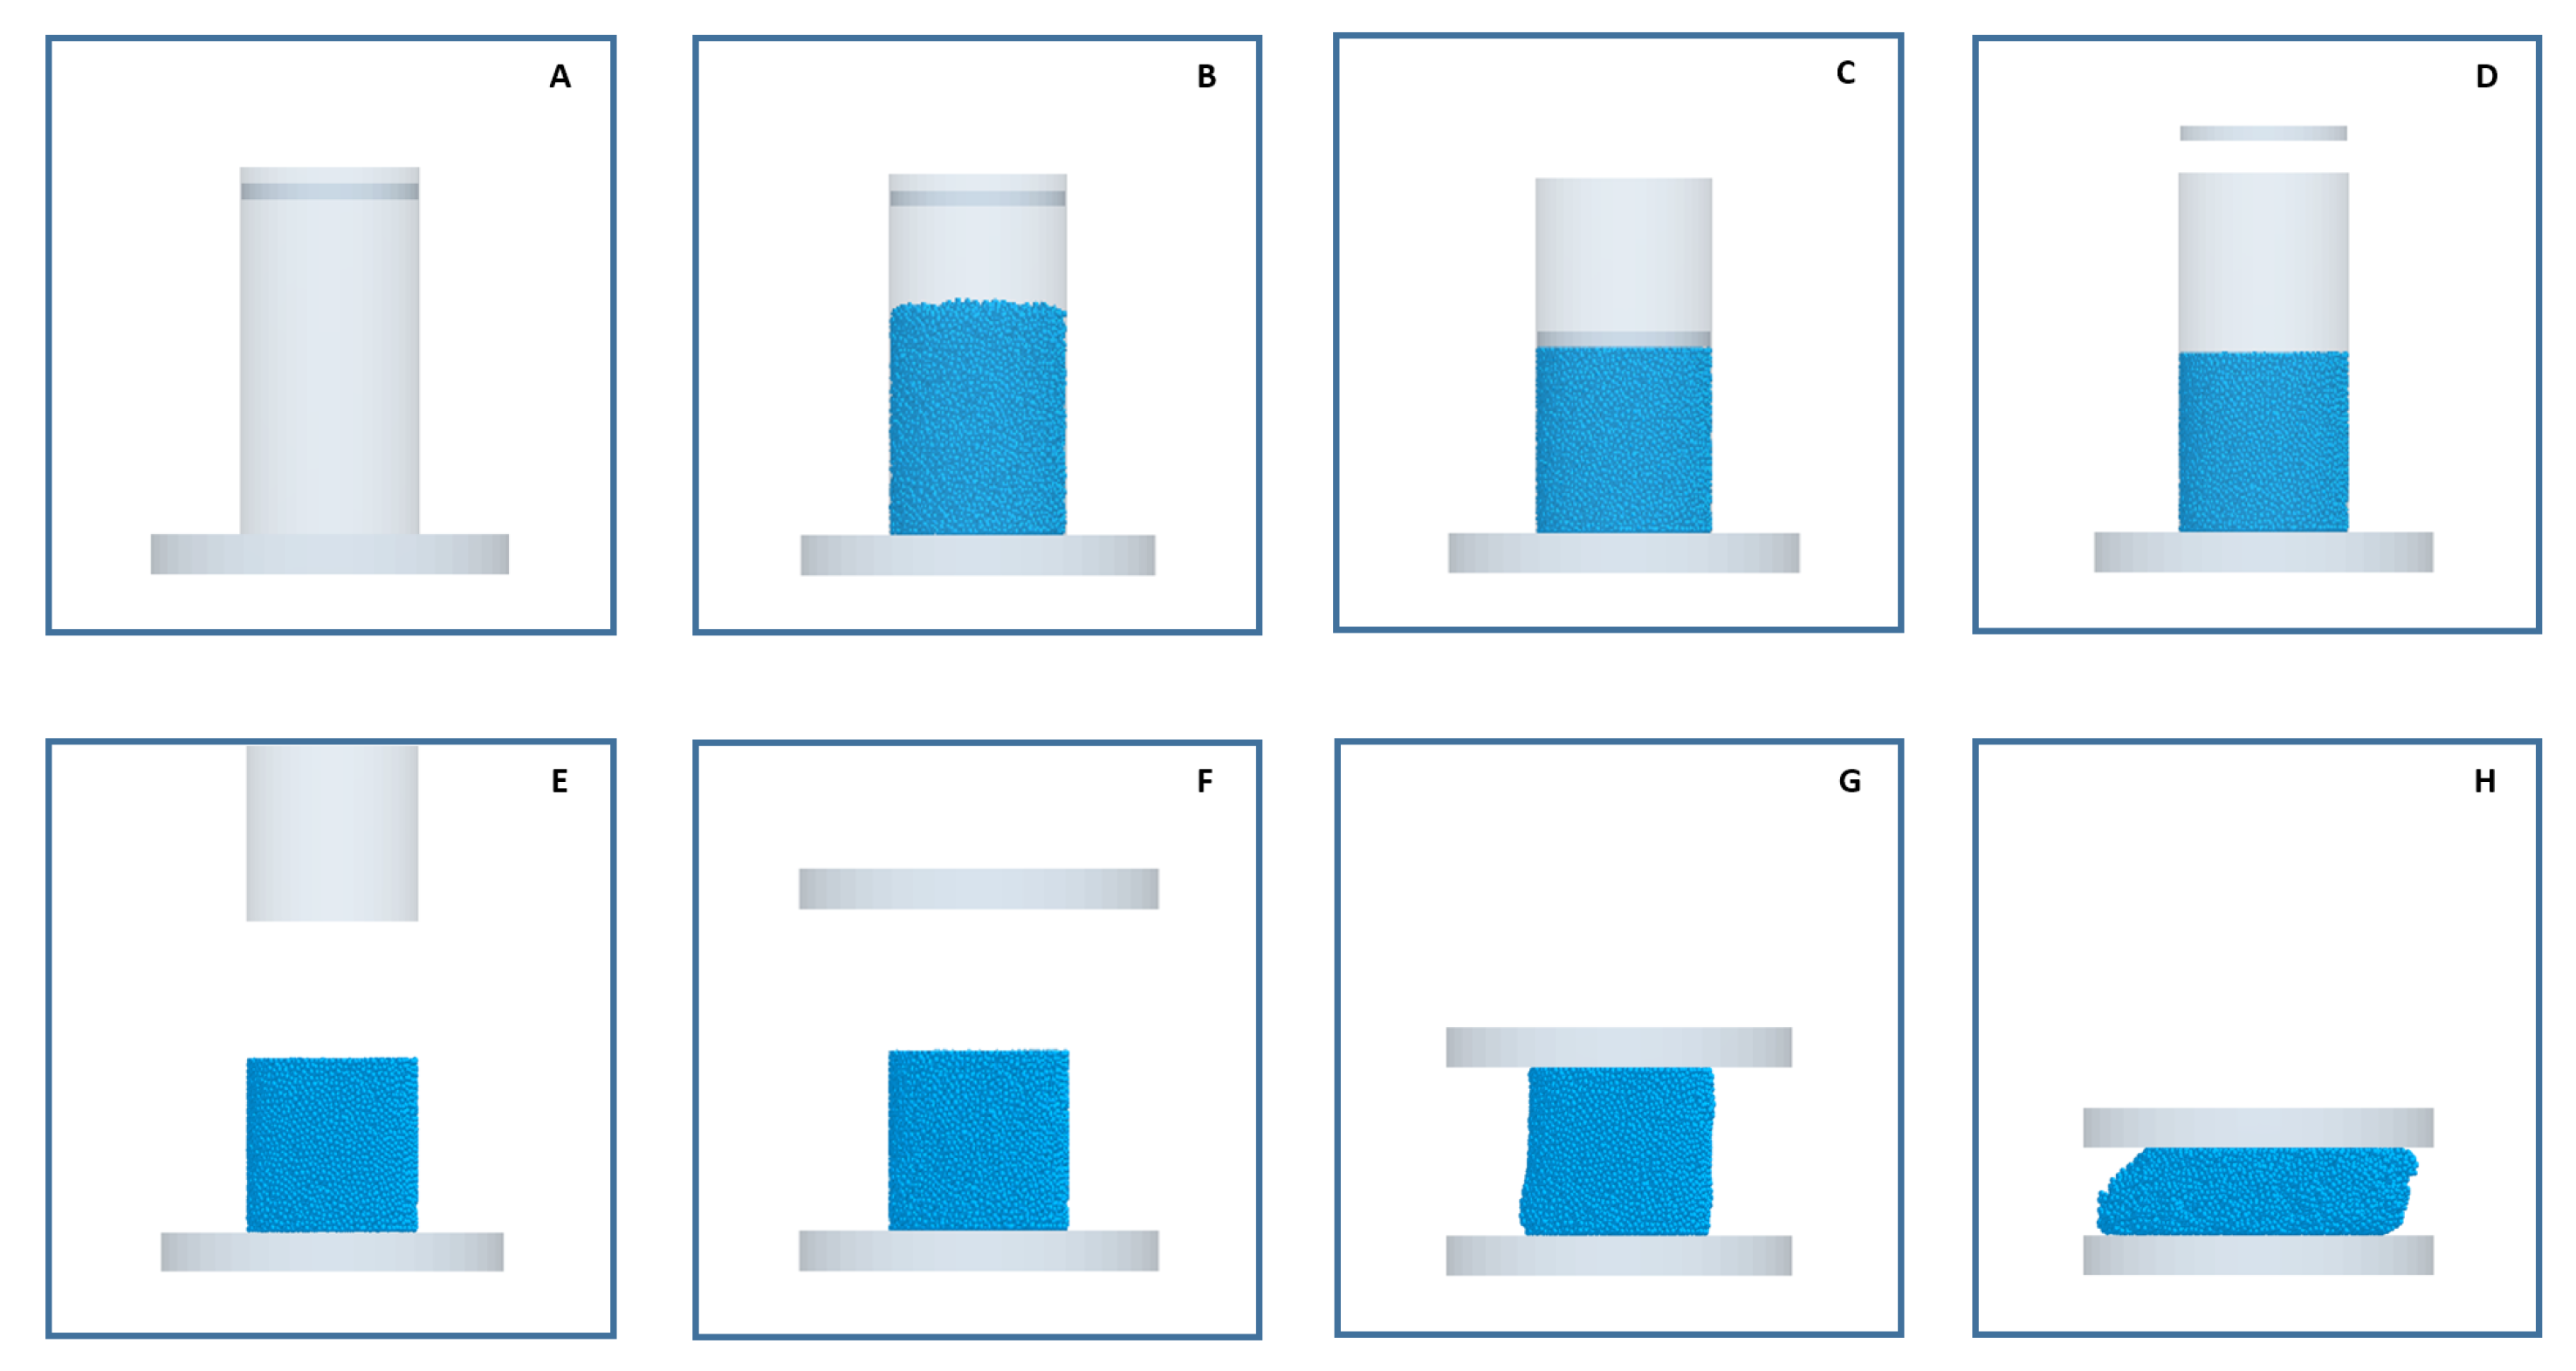
2.2. Dynamic Yield Strength Experiment

The mixture of powders was granulated using a Bindzil and water mixture in a 16 mm Thermo Fischer Twin Screw granulator. The granules were then dried and sieved. A photograph of a dried granule is presented in Figure 1. The granules of the sieve fraction, 0.7–1.0 mm, were taken and rewetted with water in a ratio of 10:7 by mass. This wet granular mixture was used to create a cylindrical pellet with a 25 mm diameter and height using a hand-press punch and die set. The dynamic-yield-strength test of the pellet was conducted using an Instron ElectroPuls E1000 mechanical testing frame. This instrument consists of two vertically aligned metallic heads facing each other. Both heads are greased with Vaseline and the pellet is placed on top of the bottom head. During equipment operation, the bottom head stays in a fixed position while the top head moves downward to impact the pellet at a preset velocity of 100 mm/s. The instrument measures the vertical force used to compress the pellet and the displacement of the upper head. After converting the force and displacement into engineering stress and engineering strain, the peak-stress value in the measurement is defined as the material’s dynamic yield strength.

2.3. Shear-Cell Experiment

The wet mixture was added to the trough of a Dietmar-Schultze Ring Shear Tester. Preconsolidation normal stress of 2000 Pa was applied through the lid of the shear cell, and the rotation rate of the base was set to 0.026 rad/min. Changes in shear value over time were recorded by the instrument. After the shear value reached a steady state, the load was reduced to zero.

3. Method and Simulation Setups

All simulations were performed using EDEM® version 2.7.3 (DEM Solutions) [34]. The geometry for the shear-cell simulation was developed using the 3D-CAD package called SOLIDWORKS® (Dassault Systémes) [35], while the geometry for the DYS simulation was developed using tools in EDEM®.
In a DEM model, particles are inserted into the simulation domain, and contacts between particles and particles, and between particles and boundaries, are detected. Since the soft-particle DEM approach was used here, particle overlaps were calculated next. Next, the force on each particle is determined. Based on this force, particle acceleration is calculated using Newton’s laws of motion. The acceleration values for each particle are integrated over a small time step in order to determine the velocity and position of the particles for the next time step [10].
The total contact force ( F ) acting on each particle is the sum of the normal contact force ( F N ), the normal damping force ( F N d ), the tangential contact force ( F T ), the tangential damping force ( F T d ), and the body force ( F B ) (1). The only body force considered in the DEM models in this study is the force due to gravity.
F = F N + F N d + F T + F T d + F B
The particles in the experiments were cohesive, wet, and in the funicular region. In order to calculate the forces that arise due to particle contacts (with other particles and boundaries), DEM uses a physics/contact model. The capillary force contact model was not applicable as the experiments were not conducted in the pendular region. Since a viscous force model was not available in EDEM®, the contact and cohesive forces in the DEM models developed in this study were also accounted for by using the JKR normal contact model [12]. This contact model uses a parameter called surface energy ( γ ) to quantify the attractive nature of the particles. When surface energy is set to zero, the JKR model reduces to the Hertz contact model, a nonlinear spring-and-dashpot model based on the Hertz theory of elastic contacts [36]. The normal contact force between two spherical particles of radius R 1 and R 2 with a normal overlap, δ N is given by [37]:
F N = 4 3 E e q R e q a 3 4 π E e q γ a 3 / 2 δ N = a 2 R e q 4 a π γ E e q a 3
where a is the contact radius between the particles, R e q is the equivalent radius, i.e., the inverse of the reciprocal sum of the two particles’ radii R 1 and R 2 , and E e q is the equivalent Young’s modulus, i.e., the inverse of the reciprocal sum of the two particles’ Young’s moduli E 1 and E 2 . Young’s modulus is calculated from the shear modulus (G) and Poisson’s ratio ( ν ) using the relation: E i = 2 G i (1+ ν i ).
The normal damping force is related to the normal stiffness ( k N ), relative normal velocity ( v N r e l ), equivalent mass ( M e q ), and coefficient of restitution (e) by:
F N d = 2 β v N r e l 5 6 k n M e q k N = 2 E e q R e q δ N β = ln e ln 2 e + π 2
Tangential forces are calculated using the Mindlin–Deresiewicz no-slip model [38]. The tangential contact force and the tangential damping force are given by the following equations:
F T = k T δ T k T = 8 G e q R e q δ N
F T d = 2 β v T r e l 5 6 k T M e q
where, k T is the tangential stiffness, G e q is the equivalent shear modulus, δ T is the tangential overlap, and v T r e l is the relative tangential velocity. Coulomb’s law limits the tangential force by the coefficient of static friction ( μ S ), as given by [39]:
F T = s i g n ( F T ) m i n ( F T , μ S F N )
The rolling torque ( τ i ) on a particle is calculated using the rolling-friction resistance model given by the equation [24]:
τ i = μ r F N ω i R i
where μ r is the rolling friction coefficient, and ω i is the angular velocity.

3.1. Dynamic-Yield-Strength Simulation Setup

Figure 2 shows the the DEM model setup for the DYS simulations. The platens were simulated by constructing two solid cylindrical plates of 50 mm diameter. Just as in the experiments, the top platen was movable while the bottom platen remained fixed throughout the simulation.
In order to make the pellet in the simulation, a hollow cylindrical die of 25 mm diameter and 40 mm height was created with both its top and bottom circular sections open. This cylinder was placed vertically over the bottom platen and was filled to a height of 29 mm with spherical particles, which were normally distributed, with a mean diameter of 0.7 mm and a standard deviation of 0.21 mm. Particle distribution was capped at 0.7 and 1.0 mm to simulate the sieve fraction from the experiment results. The spherical particles in the simulation represent an approximation to the experimental granules, which had a vertical aspect ratio of 1.30. This increase in size is a common approximation done in DEM simulations in order to reduce computational time [40]. These particles were compressed inside the die at a rate of 1.5 mm/s to a height of 22 mm using a smaller cylindrical plate of 24.6 mm diameter, and then released. This caused the pile to spring back up to an approximate height of 25 mm. The hollow cylinder was then removed to leave behind a cylindrical pellet on top of the bottom platen.
The dynamic-yield-strength test was carried out by moving the top platen vertically downwards at a speed of 100 mm/s. The force on the top of the pellet and the deformation it underwent were recorded. A plot of the engineering stress–strain curve was made, and peak-stress value gave dynamic yield strength.
The details of the DEM parameters used in the DYS simulations are presented in Table 2 and Table 3. The majority of the parameters used in the base-case simulation were taken from the literature [23]. The density of the particles was set to the experimentally measured density of the granules. Since the platens were lubricated in the experiment, they were assumed to be frictionless in the simulations, and the sliding- and rolling-friction parameters between a particle and wall were set to zero. Additionally, the value of surface energy was chosen by running test simulations to determine the minimum value that was required to keep the pile of particles stable after the precompression step. This value was doubled and used as the base-case setting.

3.2. Periodic Shear-Cell Simulation Setup

A DEM simulation of the full experimental shear cell was found to be too computationally expensive. Hence, a periodic section of the shear cell, similar to the one developed by Ketterhagen et al. [41], was used for the simulations. The periodic-section simulation had the dimensions of 18 × 23 × 22 mm in the x, y, and z directions, respectively. The x-axis was treated as a periodic boundary. The top plate consisted of a horizontal plate of 18 × 22 mm with grooves of height 3 mm and width 0.8 mm, with a spacing of 10.5 mm. It also had two vertical plates of dimensions 18 × 8 mm on either side. The bottom plate consisted of a horizontal plate of 200 × 22 mm with grooves of height 2 mm and width 1 mm, with a spacing of 5.35 mm. Just like the top plate, the bottom plate also had two vertical plates of dimensions 200 × 14.5 mm on either side. Figure 3 shows the shear-cell simulation when empty. In the simulations, the particles were periodic but the bottom plate was not, since the boundary elements could not be made periodic due to software restrictions. This should not affect the results from the simulation since the bottom plate had grooves that repeated at regular intervals, and as this plate moved as a single unit at a constant speed causing the particles close to the plate to be subjected to the same constant force, even when the particles moved across the periodic boundaries.
The shear cell was simulated with 20,000 particles to match the experimental compressed bed height of 16 mm. The top plate was moved down on the particles to apply a constant stress of 2000 Pa in the preconsolidation step. The application of constant load was achieved by using the Dynamics Coupling feature in EDEM®. Once the particles were compressed by the top plate, the bottom plate was made to move at a rate of 3.813e-05 m/s in the positive x-direction. This speed is the experimental angular velocity converted to linear speed. The shear stress on the top plate was recorded.

4. Results and Discussion

This section presents the results from the DEM DYS and shear-cell simulations. The results from parameter-sensitivity analysis for the two setups are first described, followed by details of the calibration efforts.

4.1. Sensitivity Analysis: Dynamic Yield Strength

The results from the DYS simulation are visualized in Figure 4. An empty cylinder was laid on top of the bottom platen (A) and filled with particles (B). The smaller precompression plate moved downward to compress the pile (C). Next, the precompression plate was withdrawn (D). The hollow cylinder was removed to expose the compressed pile (E). Finally, the top platen moved downward at the specified speed (F–H). The state of the pile just after the top platen hit it is shown in (G), while (H) shows the final state of the pile. Note that the base-case DYS simulation had a time step of 3.82 e 6 s and took 10 h to complete using 12 cores of Intel Xeon (R) E5-2650 v4 CPU @ 2.2 GHz.
The sensitivity of the peak-stress value in the DYS simulations to the DEM parameters was studied with respect to the following parameters: Poisson’s ratio, shear modulus, surface energy, the coefficient of restitution, and the coefficient of sliding friction and the coefficient of rolling friction between particles. An initial simulation was run with a fixed set of parameter values (based on Table 2 and Table 3), and this simulation was called the base-case simulation. In the sensitivity analysis, the values of the aforementioned DEM parameters were increased by 2.5 times their respective values in the base-case simulation. This multiplier value was chosen as it covered the complete range of two out of the six parameters in the study. These two parameters, namely, the Poisson’s ratio and the coefficient of restitution, were not expected to have much effect on the peak-stress value, and it was necessary to test their effect on DYS at their maximum value. Note that the parameters were varied individually in separate simulations, and the dynamic-yield-strength results from these simulations were compared to the result from the base-case simulation.
Results from the sensitivity-analysis study are shown in Table 4. From the results, it can be inferred that the effects of Poisson’s ratio and coefficient of restitution on the DYS values were insignificant since changes in the DYS results were small even when these parameters were tested at the maximum value of their respective ranges. Surprisingly, the coefficient of sliding friction was negatively correlated with DYS. The shear modulus lowered the DYS at the tested values. Raising the shear modulus increased particle stiffness and decreased the particle contact area, thereby reducing cohesion strength between the particles. This loss in cohesive power contributed to lowering the DYS value. The DYS value was almost twice as sensitive to the coefficient of rolling friction as it was to the shear modulus or the coefficient of sliding friction. Finally, it was observed that the DYS result was extremely sensitive to the surface-energy parameter.
Based on the above results, it was decided that more detailed analysis was necessary to obtain a better idea about the influence of the more sensitive parameters (i.e., the coefficient of rolling friction, the coefficient of sliding friction, shear modulus, and surface energy) on DYS values. Hence, simulations were run with friction parameters varying in the range of 0.01 to 1; the shear modulus varied between 1 to 10 MPa, and surface energy varied from 0.45 to 2.7. Note that the results of the sensitivity of the DYS value to surface energy are presented later as part of the calibration study in Section 4.3. Results from the detailed sensitivity analysis of the remaining three parameters are plotted in Figure 5. The plot shows that the effect of the shear modulus on DYS was the least among the three parameters. The DYS result rose sharply with increasing CoRF up to a value of 0.30, after which its influence waned significantly. The impact of the CoSF was strongest, in the range from 0.01 to 0.40. The DYS value peaked at a CoSF of 0.1, while values on either side of this number seemed to decrease frictional resistance to the deformation force in the DEM simulations, leading to a lower value of DYS.
We conclude that the DYS value is very sensitive to surface energy, which makes this setup useful for calibrating the surface-energy parameter. Nevertheless, the influences of the coefficient of rolling friction and the coefficient of sliding friction of the particles on DYS cannot be neglected. Hence, it would be useful to first fix the friction parameters and then calibrate the surface energy parameter using DYS simulations.

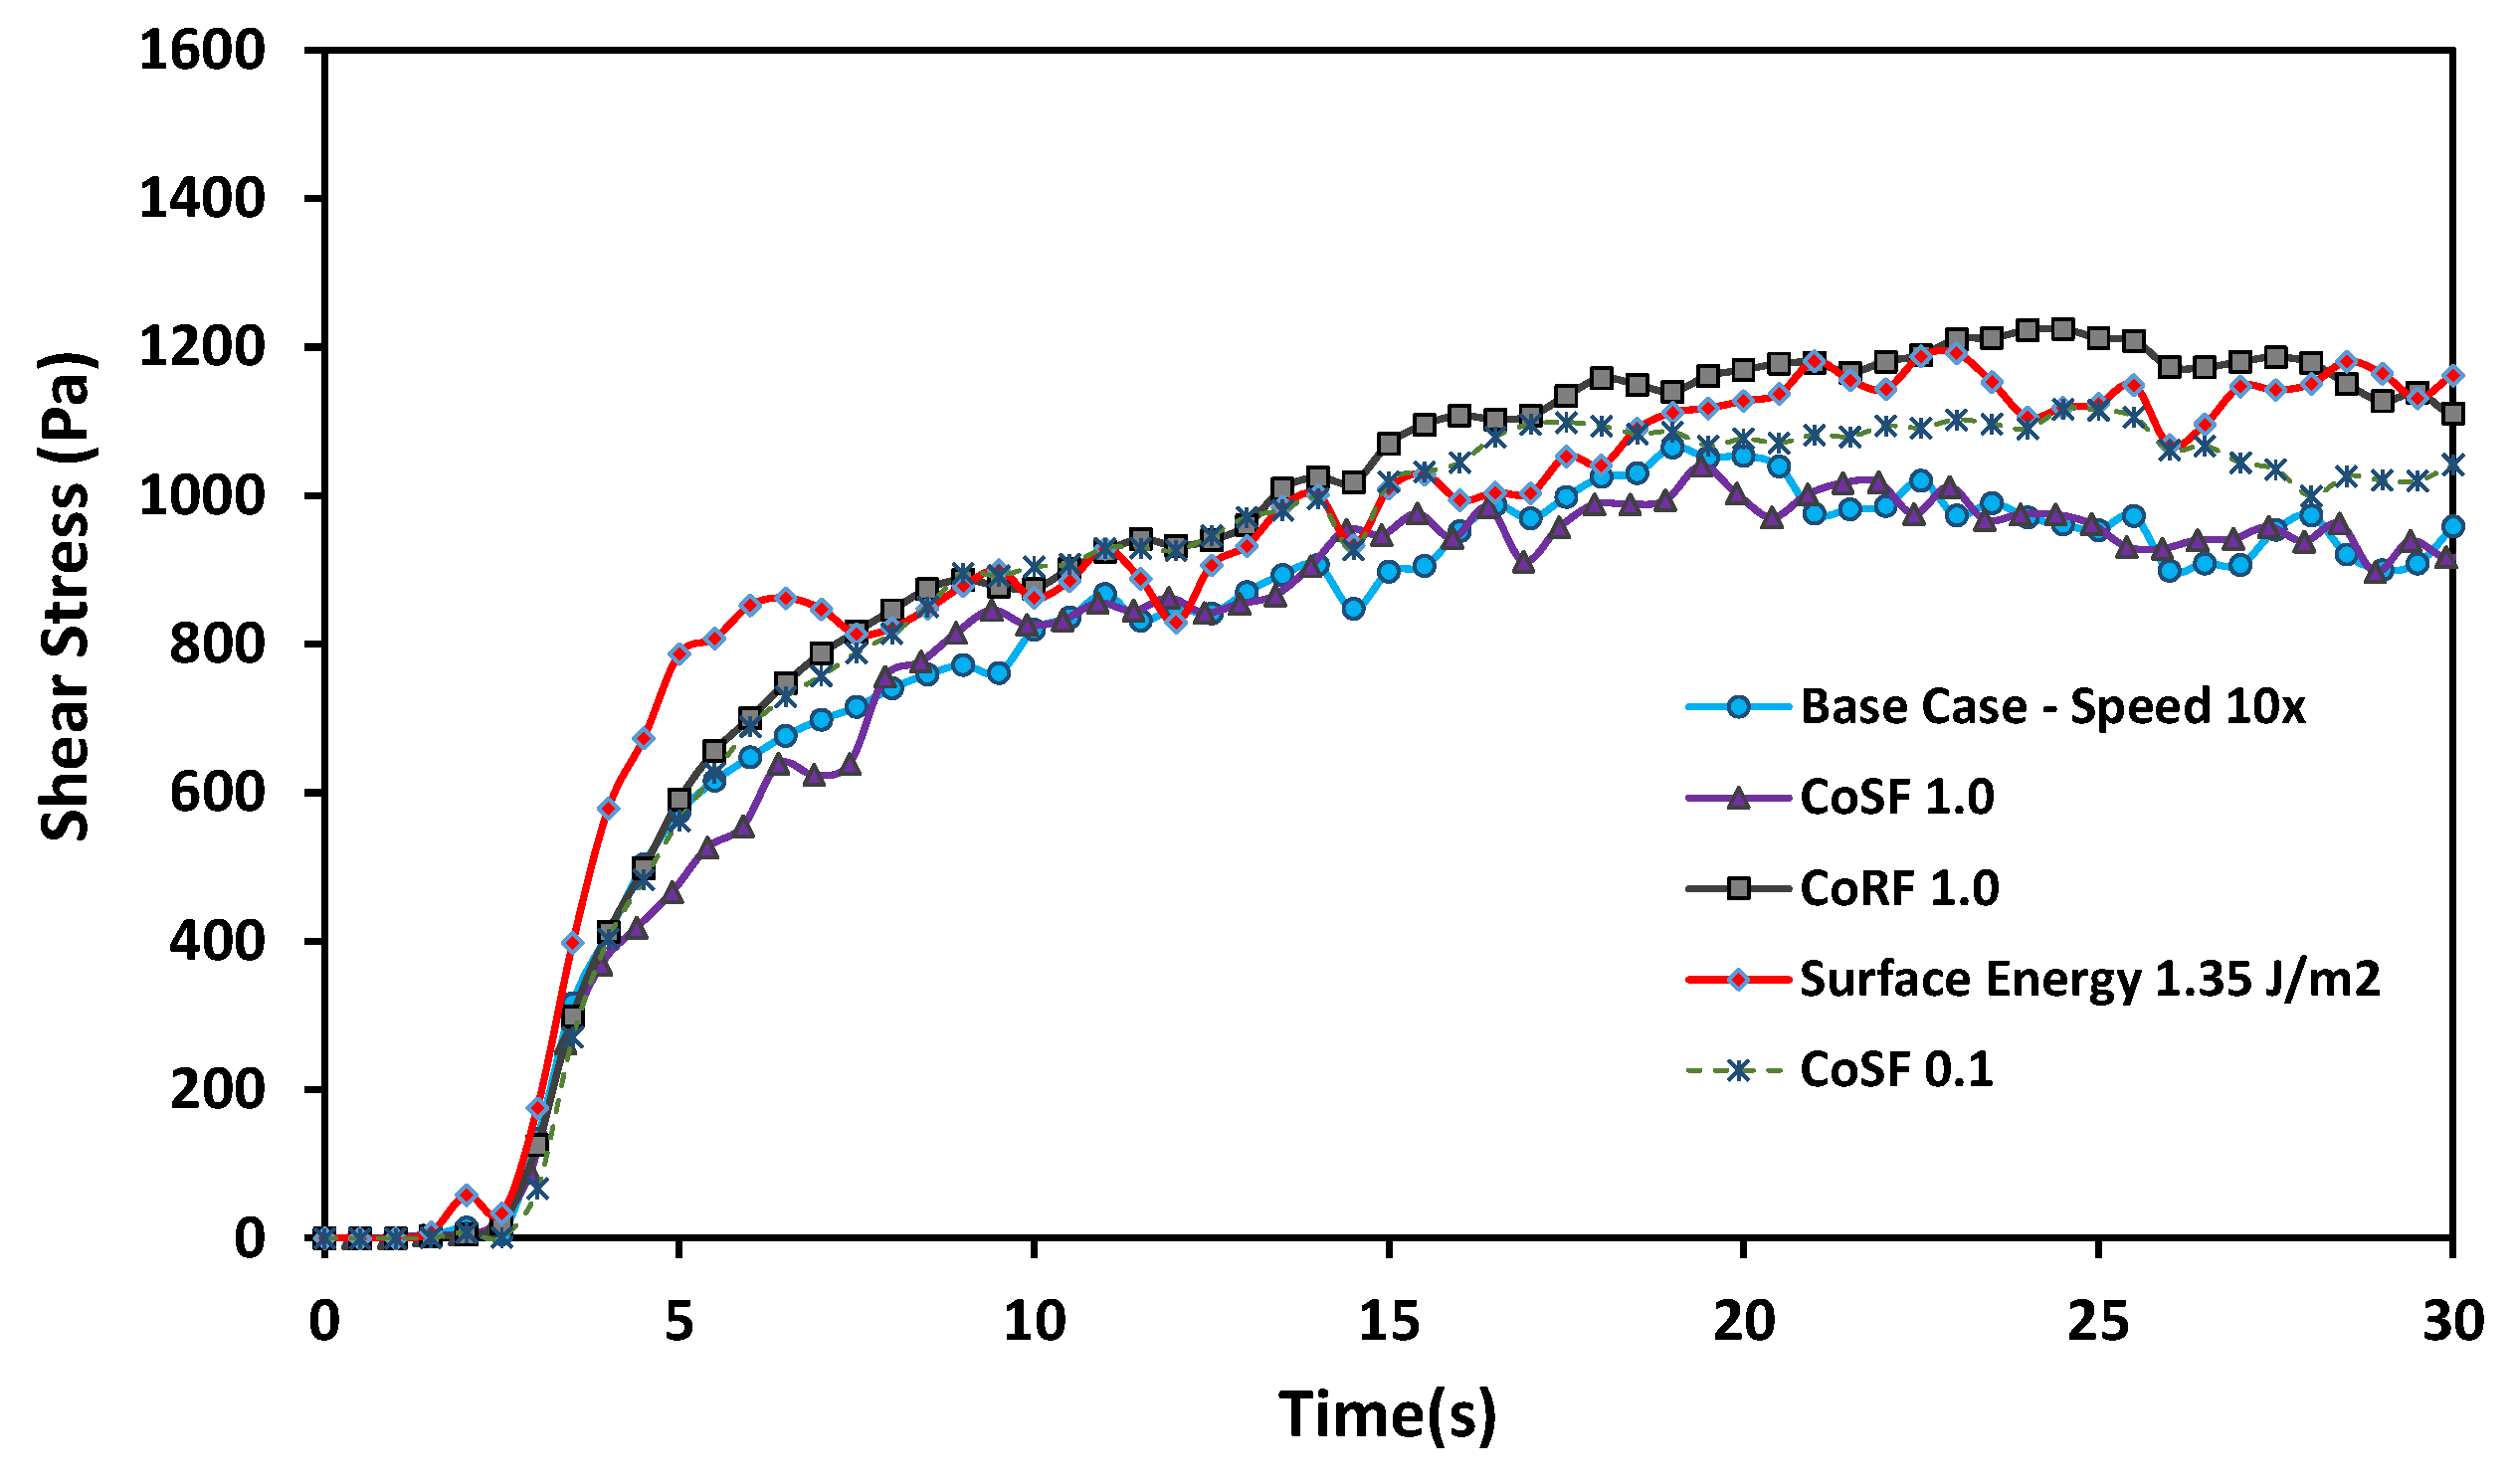
4.2. Shear-Cell Sensitivity Results

The base-case shear-cell simulation was executed using the DEM parameters listed in Table 2 and Table 3, and it took a significant amount of computational time to reach the critical-state shear value when operated at the experimental plate speed. In an attempt to reduce computational time, a simulation was carried out at ten times the experimental speed value to test the effect of bottom plate speed on the shear-cell results. Figure 6 compares the results from these simulations. It can be seen that increasing the plate speed did make the simulations reach critical state earlier, but did not cause any significant change in the critical-state shear value. This means that increasing the plate speed is an effective way of speeding up the simulation. Hence, subsequent shear-cell simulations were run with a bottom-plate speed that was ten times the experimental plate speed.
Even with the faster plate speed, the shear-cell simulations took significantly longer to run than the DYS simulations. The base-case simulation of 30 s took 40 h to complete using 12 cores of Intel Xeon (R) E5-2650 v4 CPU @ 2.2 GHz. Hence, the sensitivity study of the shear cell is less extensive compared to the DYS study. Only parameters identified as the most sensitive in the DYS study were tested. In this study, four additional simulations were executed by individually varying one parameter at a time. These simulations included runs with: surface energy set to 1.35 J / m 2 (three times the value of the base case); a CoRF set to a high value of 1.0; a CoSF set to a high value of 1.0; and a CoSF set to a value of 0.1. The results from these simulations were compared to the base-case simulation in Figure 7. The plot suggests that increasing the sliding-friction value from 0.40 (base case) to 1.0 had no significant effect on critical-state shear value. Setting the CoSF value to 0.1 increased the critical-state shear value, i.e., the CoSF showed similar behavior to those observed in the DYS sensitivity study. When the coefficient of rolling friction value was changed to 1.0 from 0.01 in the base case, the critical-state value increased from 1008 to 1183 Pa in the base case. The final simulation in the study showed that the shear-cell simulation is also affected by the surface-energy parameter, but it appears that the shear cell is not as sensitive to the parameter as was the case in the DYS simulations. It can be inferred from these results, the shear-cell simulation cannot decouple the effects of the surface-energy parameter from the effects of CoSF and CoRF when the JKR contact model is used. Hence, the shear-cell model cannot be independently used to calibrate the friction coefficients of cohesive particles before running the DYS model to calibrate surface energy.

4.3. Surface-Energy Calibration Using DYS Simulations

The DYS calibration study was conducted to test whether the cohesion parameter could be calibrated by matching the simulation DYS results to the experimental DYS result of 3242 Pa. Since the shear-cell simulation could not be used to calibrate the sliding- and rolling-friction parameters, the study was carried out by fixing the values of CoSF, CoRF, and shear modulus to the base-case simulation values. In this study, surface energy was varied in an attempt to match the experimental DYS result. A total of seven simulations (including the simulations performed for sensitivity analysis) were carried out at the following surface energies: 0.45, 0.675, 1.125, 1.92, 1.97, 2.15, and 2.70 J / m 2 . The DYS results from these simulations are plotted against the surface energy used in the simulations in Figure 8. From the plot, it is clear that the DYS value has a linear relationship with surface energy. This relationship is expressed by the following equation: DYS (Pa) = 1837 × Surface Energy( J / m 2 ) − 456. This line, shown in the plot, has an R 2 value of 0.9852, indicating that it is a very good fit. From the plot, it can also be seen that the simulation with surface energy of 2.15 J / m 2 had a DYS value of 3378 Pa, which closely matched with the experimental value of 3242 Pa. In fact, this simulation result is within 5% of the experiment result.
To test the robustness of this calibration method, the calibration study was extended to verify whether surface energy can be calibrated for other scenarios:
  • A different particle shear modulus chosen for the simulations. Here, a shear modulus of 1e7 Pa was tested.
  • Particles were scaled-up for the simulations. Particle sizes were doubled for this test.
  • Different sets of friction parameters were used. Both friction parameters were set to 0.5 for this test.
All other simulation parameters were kept constant for these simulations. Just as in the base case, a linear relationship between the DYS value and surface energy was observed for all three new cases. Due to this relationship, the calibrated surface-energy values were identified without requiring many trial simulations. Table 5 summarizes the results from the calibration tests. The simulation named calibrated base case (CBC) in the table refers to the previously discussed simulation that was calibrated for particles of size in the range of 0.7–1.0 mm having a shear modulus of 1 e 6 Pa with a CoSF of 0.4 and a CoRF of 0.01. All DYS values for the calibrated simulations shown in Table 5 were within 5% of the experiment value of 3242 Pa. Surface energy was calibrated at a value of 2.95 J / m 2 for the simulation with a shear modulus of 1 e 7 Pa. As expected, this value was higher compared to the surface energy required to calibrate the CBC simulation, because a higher shear modulus results in a decrease of cohesive forces between particles due to a smaller contact area. Surface energy was also successfully calibrated for the simulation with the doubled particle size, showing that this method of calibration can also be employed for a system with scaled-up particles. Finally, the DYS value rose steeply with an increasing CoRF in the sensitivity study. Hence, it was understandable that the surface energy required to calibrate the system with changed friction parameters was lower compared to the CBC simulation. Note that, although simulations managed to capture the experimental dynamic-yield-strength value, the strain rate at which peak stresses occur in these simulations were different compared to the experiments. The simulations seemed to offer much less resistance to the load and the peak stress in each simulation occurred at a low strain value. A reason for this variation could be the fact that the purely spherical particles used in the simulation were not deformable, and this resulted in a different packing efficiency when compressed into a die compared to the experimental die.

4.4. Comparing Calibrated Setups with Shear Cell

To verify the validity of the calibrated surface energies, the parameters used by simulations mentioned in Table 5 were tested using the shear-cell simulation in this study. Results plotted in Figure 9 show that the CBC simulation had a critical-state shear value of about 1330 Pa. The simulation with the doubled particle size had a critical-state shear value close to that of the CBC simulation, albeit with larger fluctuations. This implies that the calibration of the scaled-up particles did not result in changes to the particle flow. It further demonstrates the robustness of the method of calibrating surface energy using DYS simulations. Figure 9 also showed that calibrated surface energy for the higher shear-modulus simulation did not have a significant impact on the critical-state shear result. Finally, the simulation with higher friction parameters had a different critical-state shear value (1178 Pa) compared to the CBC simulation. This was to be expected since the shear-cell results were shown to be sensitive to the friction coefficients even though the model could not differentiate the effects of CoRF, CoSF, and surface energy.
The shear-cell experiment result is shown in Figure 10. The plot shows that, for a load of 2000 Pa, the critical-state shear-stress value is about 1800 Pa. Comparing the results from the CBC and the simulation with higher friction parameters to the experiment results, it can be noted that although neither matches the experiment value, the CBC result is closer to it. In this case, it can be concluded that the friction parameters from the CBC simulation produced a particle flow that is a better representative of the particle behavior in the actual system compared to the simulation in which the friction coefficients were set to 0.5.

5. Conclusions

Dynamic-yield-strength and shear-cell experiments were performed on cohesive granular material. DEM models were then developed for this dynamic-yield-strength and shear-cell equipment using the JKR cohesion contact model. Parameter-sensitivity analysis performed on the DYS model showed that the peak-stress value is not only affected by the coefficients of sliding and rolling friction, but is also very sensitive to the surface-energy parameter of the JKR cohesion model. This result made the DYS model a good candidate for calibrating the surface energy, provided the friction parameters were already calibrated. The sensitivity of the shear-cell model to the surface-energy parameter meant that it was not practical to independently use the model to calibrate the friction coefficients. This model has to be used simultaneously with the DYS model to determine the CoSF and CoRF. The DYS model was then used to calibrate the surface energy for the set of DEM parameters used in the base-case simulation by running simulations at various surface-energy values and comparing the resulting DYS value to the experiment result. A surface energy value of 2.15 J / m 2 was identified as the calibrated value. During this exercise, it was also found that the DYS value from the simulations had a linear relationship with the surface-energy parameter. This linear relationship was also observed for simulations in which particle size, shear modulus, and friction coefficients were changed—making it simpler to identify the calibrated surface-energy value without the need for many trial simulations. Further, it was shown that the surface-energy parameter could also be calibrated by the DYS simulation when using scaled-up particles, and that particle scaling did not affect the critical-state shear value of the shear-cell simulation. Although the shear-cell model could not solely be used to calibrate the friction parameters, it was demonstrated that the combination of DYS and shear-cell simulations could be used to compare different sets of friction parameters and help choose the set that can simulate particle motion in the model that is closer to the experimental flow behavior. Future work can be directed at exploring methods to find a more direct way of calibrating the friction parameters, and at calibrating the particle–wall interaction parameters for cohesive systems.

Author Contributions

Conceptualization and supervision, C.W., C.R., and R.R.; methodology, S.K.; formal analysis, S.K., N.D., Y.S., X.L., and G.Y.; investigation, S.K., N.D., Y.S., X.L., and G.Y.; writing—original-draft preparation, S.K.; writing—review and editing, C.W., C.R., and R.R.

Funding

This research was funded by the BASF Corporation.

Acknowledgments

The authors would like to acknowledge DEM Solutions for providing the academic licenses used for this research. The authors would also like to acknowledge Mohammed Asaduzzaman for his contributions in discussions pertaining to this work.

Conflicts of Interest

The authors declare no conflict of interest.

Abbreviations

The following abbreviations are used in this manuscript:
CoRFCoefficient of Rolling Friction
CoSFCoefficient of Static Friction
DEMDiscrete Element Method
DYSDynamic Yield Strength

References

  1. Hou, Q.; Dong, K.; Yu, A. DEM study of the flow of cohesive particles in a screw feeder. Powder Technol. 2014, 256, 529–539. [Google Scholar] [CrossRef]
  2. Li, H.; McCarthy, J.J. Controlling Cohesive Particle Mixing and Segregation. Phys. Rev. Lett. 2003, 90, 184301. [Google Scholar] [CrossRef] [PubMed]
  3. Thompson, M.; Sun, J. Wet granulation in a twin-screw extruder: Implications of screw design. J. Pharm. Sci. 2010, 99, 2090–2103. [Google Scholar] [CrossRef] [PubMed]
  4. Chen, Y.; Yang, J.; Dave, R.N.; Pfeffer, R. Granulation of cohesive Geldart group C powders in a Mini-Glatt fluidized bed by pre-coating with nanoparticles. Powder Technol. 2009, 191, 206–217. [Google Scholar] [CrossRef]
  5. Peron, H.; Delenne, J.; Laloui, L.; Youssoufi, M.E. Discrete element modelling of drying shrinkage and cracking of soils. Comput. Geotech. 2009, 36, 61–69. [Google Scholar] [CrossRef]
  6. Yu, S.; Gururajan, B.; Reynolds, G.; Roberts, R.; Adams, M.J.; Wu, C.Y. A comparative study of roll compaction of free-flowing and cohesive pharmaceutical powders. Int. J. Pharm. 2012, 428, 39–47. [Google Scholar] [CrossRef]
  7. Guaita, M.; Couto, A.; Ayuga, F. Numerical Simulation of Wall Pressure during Discharge of Granular Material from Cylindrical Silos with Eccentric Hoppers. Biosyst. Eng. 2003, 85, 101–109. [Google Scholar] [CrossRef]
  8. Prescott, J.; Bernum, R. On Powder Flowability. Pharm. Technol. 2000, 24, 60–84. [Google Scholar]
  9. Cundall, P.A.; Strack, O.D.L. A discrete numerical model for granular assemblies. Géotechnique 1979, 29, 47–65. [Google Scholar] [CrossRef]
  10. Ketterhagen, W.R.; am Ende, M.T.; Hancock, B.C. Process Modeling in the Pharmaceutical Industry using the Discrete Element Method. J. Pharm. Sci. 2009, 98, 442–470. [Google Scholar] [CrossRef]
  11. Mitarai, N.; Nori, F. Wet granular materials. Adv. Phys. 2006, 55, 1–45. [Google Scholar] [CrossRef] [Green Version]
  12. Johnson, K.L.; Kendall, K.; Roberts, A.D. Surface Energy and the Contact of Elastic Solids. Proc. R. Soc. Lond. Ser. A Math. Phys. Sci. 1971, 324, 301–313. [Google Scholar] [CrossRef]
  13. Lian, G.; Thornton, C.; Adams, M.J. A Theoretical Study of the Liquid Bridge Forces between Two Rigid Spherical Bodies. J. Colloid Interface Sci. 1993, 161, 138–147. [Google Scholar] [CrossRef]
  14. Mikami, T.; Kamiya, H.; Horio, M. Numerical simulation of cohesive powder behavior in a fluidized bed. Chem. Eng. Sci. 1998, 53, 1927–1940. [Google Scholar] [CrossRef]
  15. Umer, M.; Siraj, M.S. DEM studies of polydisperse wet granular flows. Powder Technol. 2018, 328, 309–317. [Google Scholar] [CrossRef]
  16. Mukherjee, R.; Mao, C.; Chattoraj, S.; Chaudhuri, B. DEM based computational model to predict moisture induced cohesion in pharmaceutical powders. Int. J. Pharm. 2018, 536, 301–309. [Google Scholar] [CrossRef]
  17. Guo, Y.; Wassgren, C.; Ketterhagen, W.; Hancock, B.; Curtis, J. Discrete element simulation studies of angles of repose and shear flow of wet, flexible fibers. Soft Matter 2018, 14, 2923–2937. [Google Scholar] [CrossRef]
  18. Radl, S.; Kalvoda, E.; Glasser, B.J.; Khinast, J.G. Mixing characteristics of wet granular matter in a bladed mixer. Powder Technol. 2010, 200, 171–189. [Google Scholar] [CrossRef]
  19. Wu, W.; Tu, Z.; Zhu, Z.; Zhang, Z.; Lin, Y. Effect of Gradation Segregation on Mechanical Properties of an Asphalt Mixture. Appl. Sci. 2019, 9. [Google Scholar] [CrossRef]
  20. Brenda, R.; Khinast, J.G.; Glasser, B.J. Wet granular flows in a bladed mixer: Experiments and simulations of monodisperse spheres. AIChE J. 2012, 58, 3354–3369. [Google Scholar]
  21. Marigo, M.; Stitt, E.H. Discrete Element Method (DEM) for Industrial Applications: Comments on Calibration and Validation for the Modelling of Cylindrical Pellets. KONA Powder Part. J. 2015, 32, 236–252. [Google Scholar] [CrossRef]
  22. Li, Y.; Xu, Y.; Thornton, C. A comparison of discrete element simulations and experiments for ‘sandpiles’ composed of spherical particles. Powder Technol. 2005, 160, 219–228. [Google Scholar] [CrossRef]
  23. Sen, M.; Karkala, S.; Panikar, S.; Lyngberg, O.; Johnson, M.; Marchut, A.; Schäfer, E.; Ramachandran, R. Analyzing the Mixing Dynamics of an Industrial Batch Bin Blender via Discrete Element Modeling Method. Processes 2017, 5. [Google Scholar] [CrossRef]
  24. Zhou, Y.; Xu, B.; Yu, A.; Zulli, P. An experimental and numerical study of the angle of repose of coarse spheres. Powder Technol. 2002, 125, 45–54. [Google Scholar] [CrossRef]
  25. Do, H.Q.; Aragón, A.M.; Schott, D.L. Automated discrete element method calibration using genetic and optimization algorithms. EPJ Web Conf. 2017, 140, 15011. [Google Scholar] [CrossRef] [Green Version]
  26. Simons, T.A.; Weiler, R.; Strege, S.; Bensmann, S.; Schilling, M.; Kwade, A. A Ring Shear Tester as Calibration Experiment for DEM Simulations in Agitated Mixers—A Sensitivity Study. Procedia Eng. 2015, 102, 741–748. [Google Scholar] [CrossRef]
  27. Cheng, H.; Shuku, T.; Thoeni, K.; Tempone, P.; Luding, S.; Magnanimo, V. An iterative Bayesian filtering framework for fast and automated calibration of DEM models. Comput. Methods Appl. Mech. Eng. 2019, 350, 268–294. [Google Scholar] [CrossRef]
  28. Ostanin, I.; Wang, Y.; Ni, Y.; Dumitrică, T. Mechanics of Nanocrystalline Particles With the Distinct Element Method. J. Eng. Mater. Technol. 2015, 137, 024501. [Google Scholar] [CrossRef]
  29. Asaf, Z.; Rubinstein, D.; Shmulevich, I. Determination of discrete element model parameters required for soil tillage. Soil Tillage Res. 2007, 92, 227–242. [Google Scholar] [CrossRef]
  30. Tsunazawa, Y.; Fujihashi, D.; Fukui, S.; Sakai, M.; Tokoro, C. Contact force model including the liquid-bridge force for wet-particle simulation using the discrete element method. Adv. Powder Technol. 2016, 27, 652–660. [Google Scholar] [CrossRef]
  31. Wang, Y.; Xu, H.; Drozdov, G.; Dumitrică, T. Mesoscopic friction and network morphology control the mechanics and processing of carbon nanotube yarns. Carbon 2018, 139, 94–104. [Google Scholar] [CrossRef]
  32. Hare, C.; Zafar, U.; Ghadiri, M.; Freeman, T.; Clayton, J.; Murtagh, M. Analysis of the dynamics of the FT4 powder rheometer. Powder Technol. 2015, 285, 123–127. [Google Scholar] [CrossRef] [Green Version]
  33. Zafar, U.; Hare, C.; Hassanpour, A.; Ghadiri, M. Drop test: A new method to measure the particle adhesion force. Powder Technol. 2014, 264, 236–241. [Google Scholar] [CrossRef] [Green Version]
  34. DEM Solutions. EDEM 2.5.1 Documentation. EDEM Analyst. 2013. Available online: http://www.dem--solutions.com/ (accessed on 29 April 2019).
  35. Dassault Systémes. Solidworks 2010–2011 Documentation. Solidworks Fundamentals. 2010. Available online: http://www.solidworks.com/ (accessed on 29 April 2019).
  36. Nasato, D.S.; Goniva, C.; Pirker, S.; Kloss, C. Coarse Graining for Large-scale DEM Simulations of Particle Flow—An Investigation on Contact and Cohesion Models. Procedia Eng. 2015, 102, 1484–1490. [Google Scholar] [CrossRef]
  37. Baran, O.; DeGennaro, A.; Ramé, E.; Wilkinson, A. DEM Simulation of a Schulze Ring Shear Tester. AIP Conf. Proc. 2009, 1145, 409–412. [Google Scholar]
  38. Mindlin, R.; Deresiewicz, H. Elastic Spheres in Contact under Varying Oblique Force. J. Appl. Mech. 1953, 20, 327–344. [Google Scholar]
  39. Liu, J.; Yun, B.; Zhao, C. Identification and Validation of Rolling Friction Models by Dynamic Simulation of Sandpile Formation. Int. J. Geomech. 2012, 12, 484–493. [Google Scholar] [CrossRef]
  40. Ting, J.M.; Khwaja, M.; Meachum, L.R.; Rowell, J.D. An ellipse-based discrete element model for granular materials. Int. J. Numer. Anal. Methods Geomech. 1993, 17, 603–623. [Google Scholar] [CrossRef]
  41. Ketterhagen, W.R.; Curtis, J.S.; Wassgren, C.R.; Hancock, B.C. Predicting the flow mode from hoppers using the discrete element method. Powder Technol. 2009, 195, 1–10. [Google Scholar] [CrossRef]
Figure 1. Dried granule photograph.
Processes 07 00278 g001
Figure 2. Dynamic-yield-strength simulation setup.
Processes 07 00278 g002
Figure 3. Parallel-plate shear-cell simulation setup.
Processes 07 00278 g003
Figure 4. Snapshots of the DYS simulation state.
Processes 07 00278 g004
Figure 5. Detailed DYS sensitivity-analysis results.
Processes 07 00278 g005
Figure 6. Shear-cell bottom-plate speed comparison.
Processes 07 00278 g006
Figure 7. Shear-cell sensitivity results.
Processes 07 00278 g007
Figure 8. Plot of dynamic yield strength vs. surface energy.
Processes 07 00278 g008
Figure 9. Shear-cell results for calibrated surface-energy simulations.
Processes 07 00278 g009
Figure 10. Shear-cell experiment result for 2000 Pa load.
Processes 07 00278 g010
Table 1. Material properties of the blend.
PropertiesBlend
Bulk Density ( kg / m 3 )422
D50 ( μ m )14.30
Avg. Flow Factor1.7
Table 2. Discrete-element-method (DEM) material parameters for dymanic-yield-strength (DYS) and shear-cell base-case simulations.
Material ParametersParticleWall
Density ( kg / m 3 )10008000
Poisson’s Ratio0.20.33
Shear Modulus (Pa) 1 e 6 7.93 e 10
Surface Energy ( J / m 2 )0.45-
Table 3. DEM interaction parameters for DYS and shear-cell base-case simulations.
Interaction ParametersParticle-ParticleParticle-Wall
Coeff. of Restitution0.20.2
Coeff. of Sliding Friction0.40
Coeff. of Rolling Friction0.010
Table 4. Results from the dynamic-yield-strength sensitivity analysis of particle properties.
SimulationParameter ValueDYS (Pa)Change w.r.t. Base Case (%)
Base case-495-
Poisson’s Ratio0.5457−7.7
Coeff. of Restitution0.5472−4.6
Shear Modulus (Pa) 2.5 e 6 400−19.2
Surface Energy ( J / m 2 )1.1251853274.3
Coeff. of Sliding Friction1.0402−18.8
Coeff. of Rolling Friction0.02567837.0
Table 5. Surface-energy and dynamic-yield-strength results from calibrated simulations. Note: CoSF, Coefficient of Sliding Friction. CoRF, Coefficient of Rolling Friction.
SimulationSurface Energy ( J / m 2 )DYS (Pa)
Target/Experimental result-3242
Calibrated base case (CBC)2.153378
Shear modulus 1 e 7 Pa2.953220
Double particle size2.903351
CoSF and CoRF 0.50.953267

