Hollow and Solid Spherical Azithromycin Particles Prepared by Different Spherical Crystallization Technologies for Direct Tableting


 ,
, 
Abstract
1. Introduction
2. Materials and Methods
2.1. Materials
2.2. Preparation of Spherical Crystals
2.2.1. SA Method for the Preparation of Solid Spherical Crystals
2.2.2. QESD Method for the Preparation of Hollow Spherical Crystals
2.3. Characterization of Products
2.4. Determination of Spherical Crystal Properties
2.4.1. Flowability
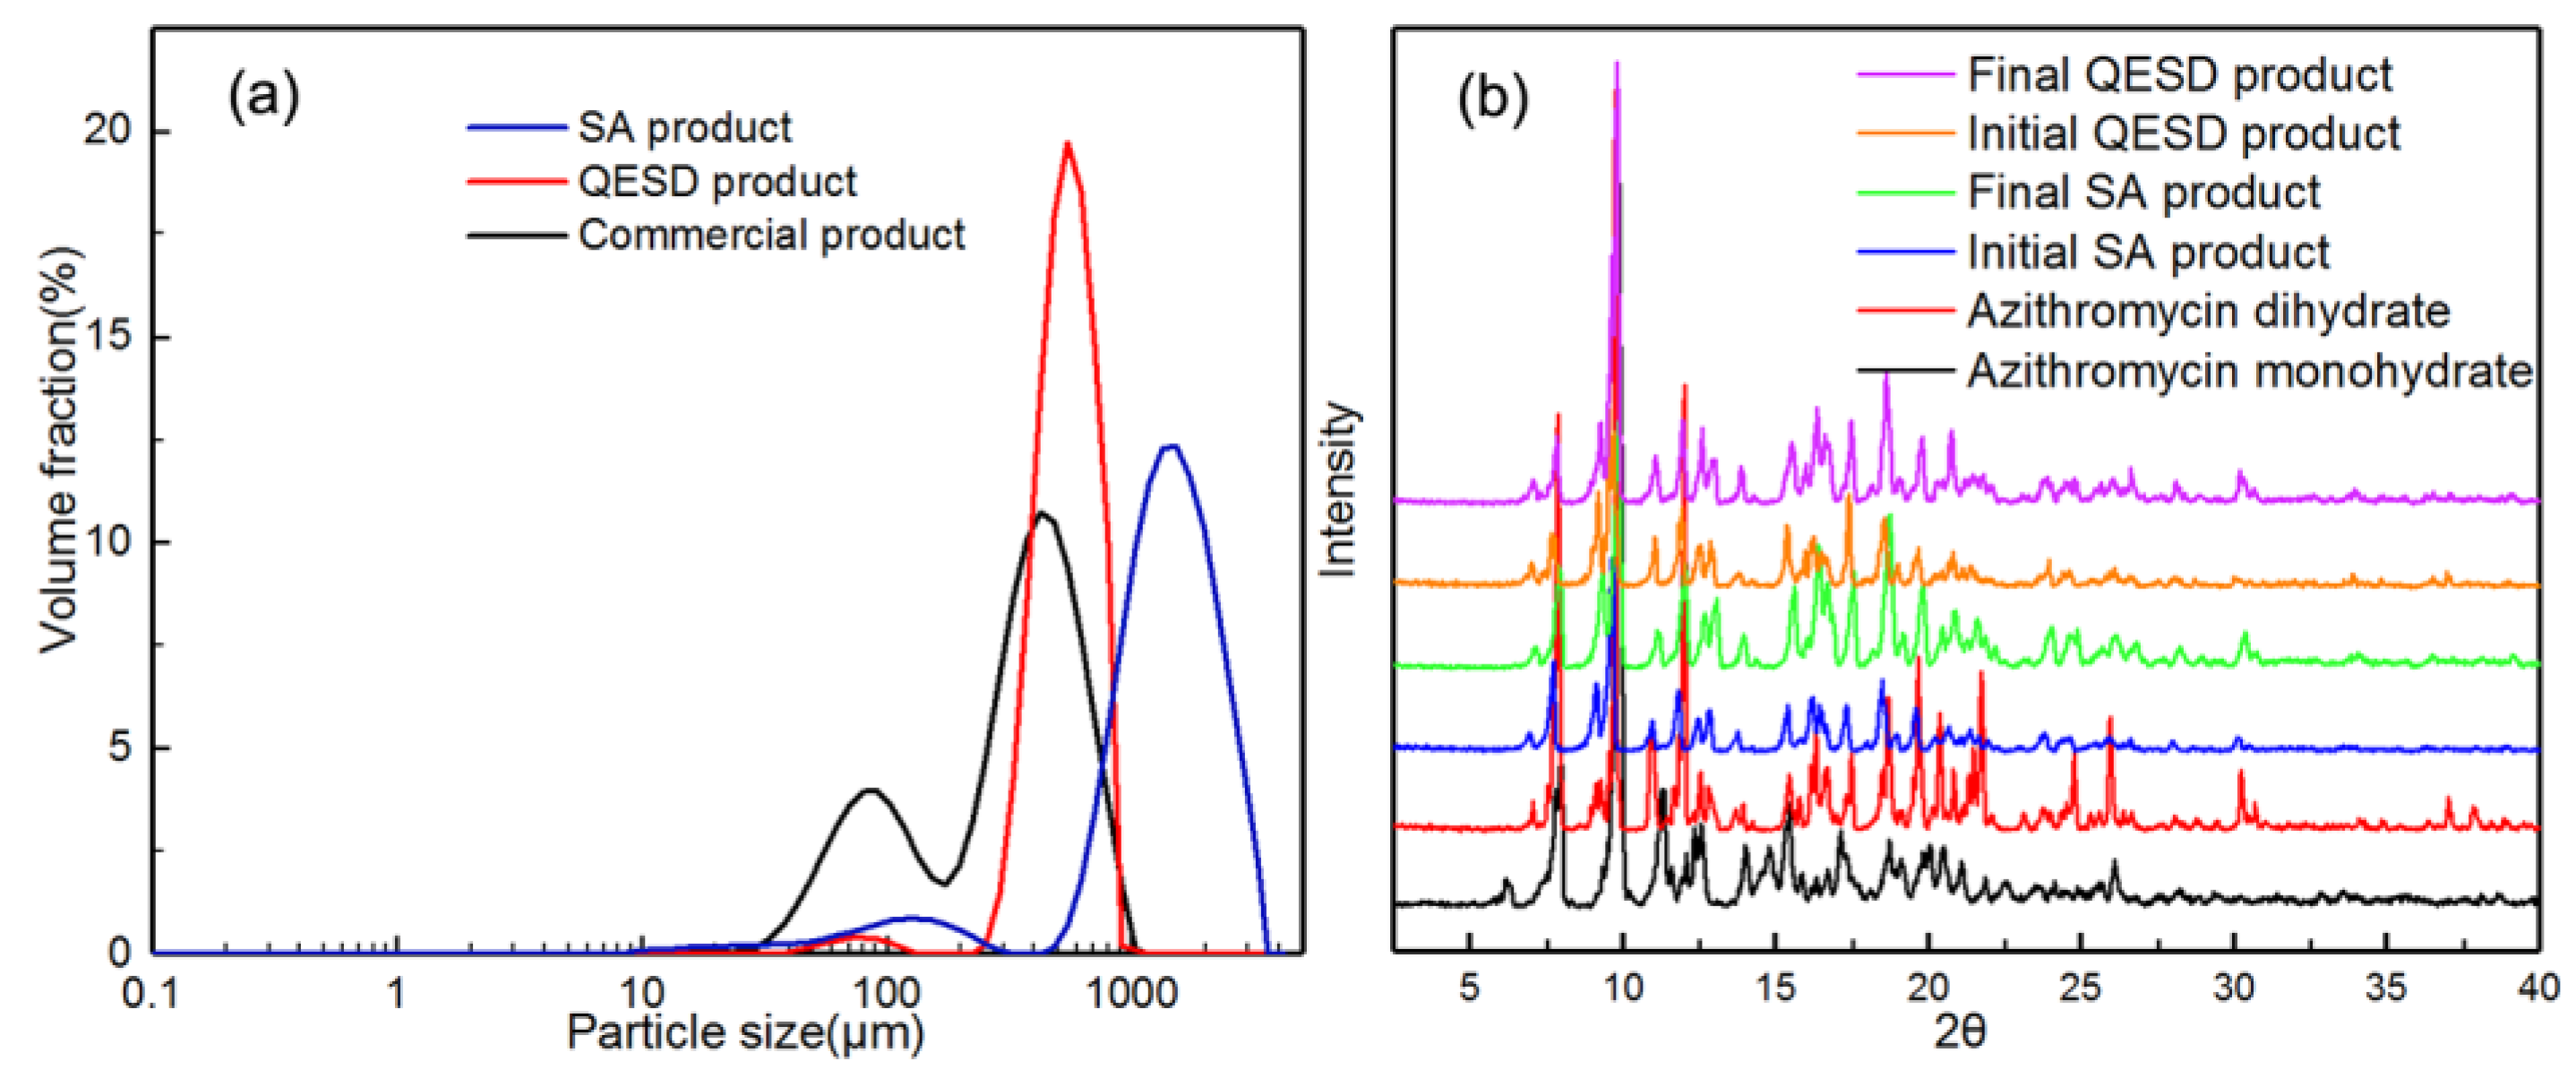
2.4.2. Particle Size Distribution (PSD)
2.4.3. Packability
2.4.4. Mensuration of Purity and Residual Solvents
2.5. Determination of Tablet Properties
2.5.1. Preparation of Tablets
2.5.2. Compactibility
2.5.3. Friability
2.5.4. Disintegration Time
2.5.5. Content Uniformity
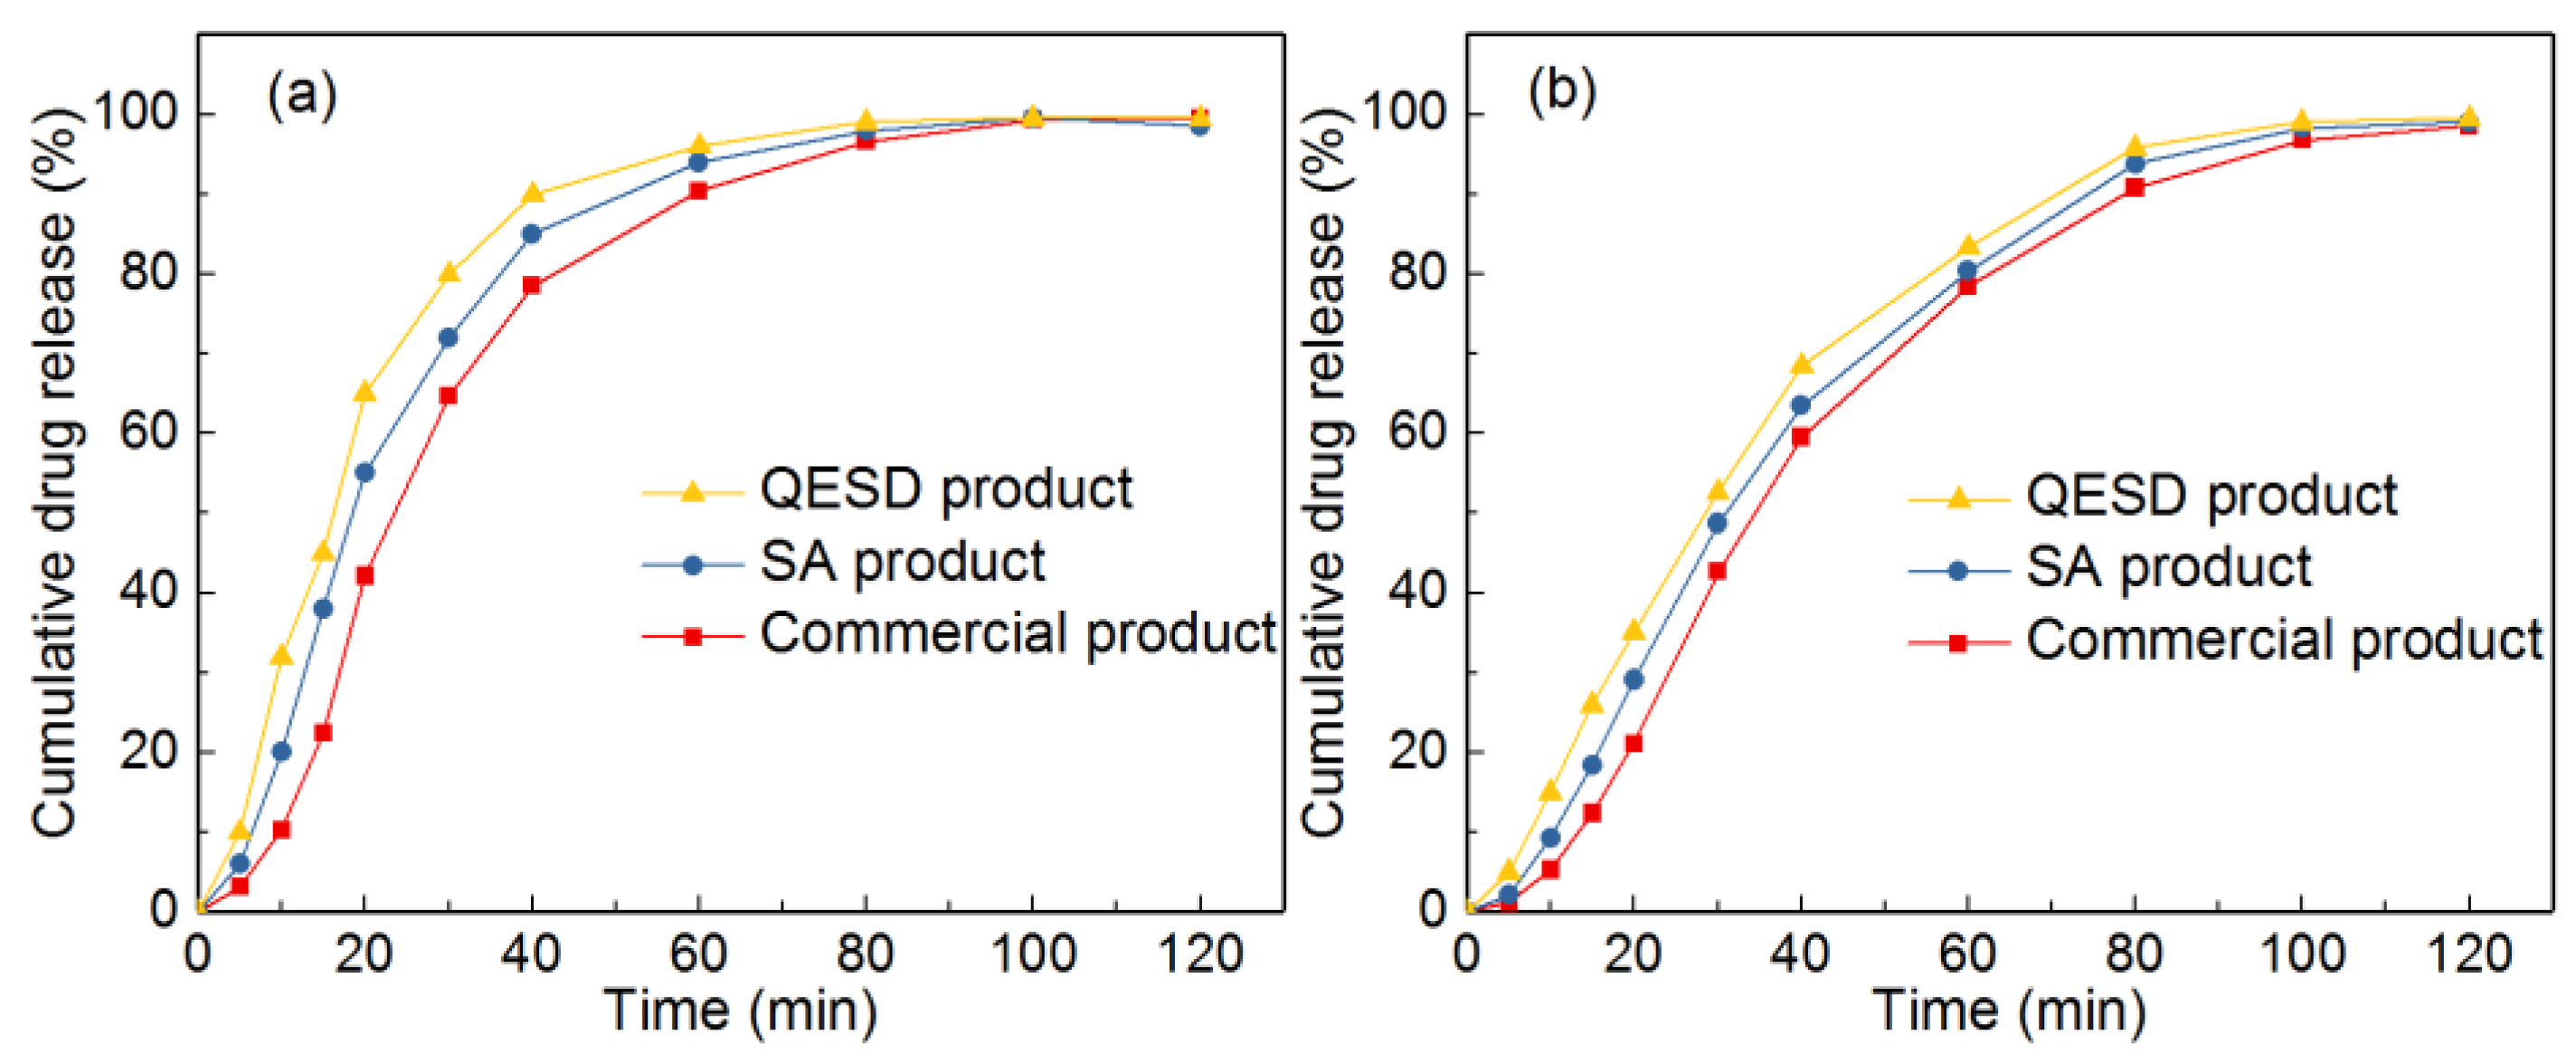
2.5.6. In Vitro Dissolution Experiment
3. Results and Discussion
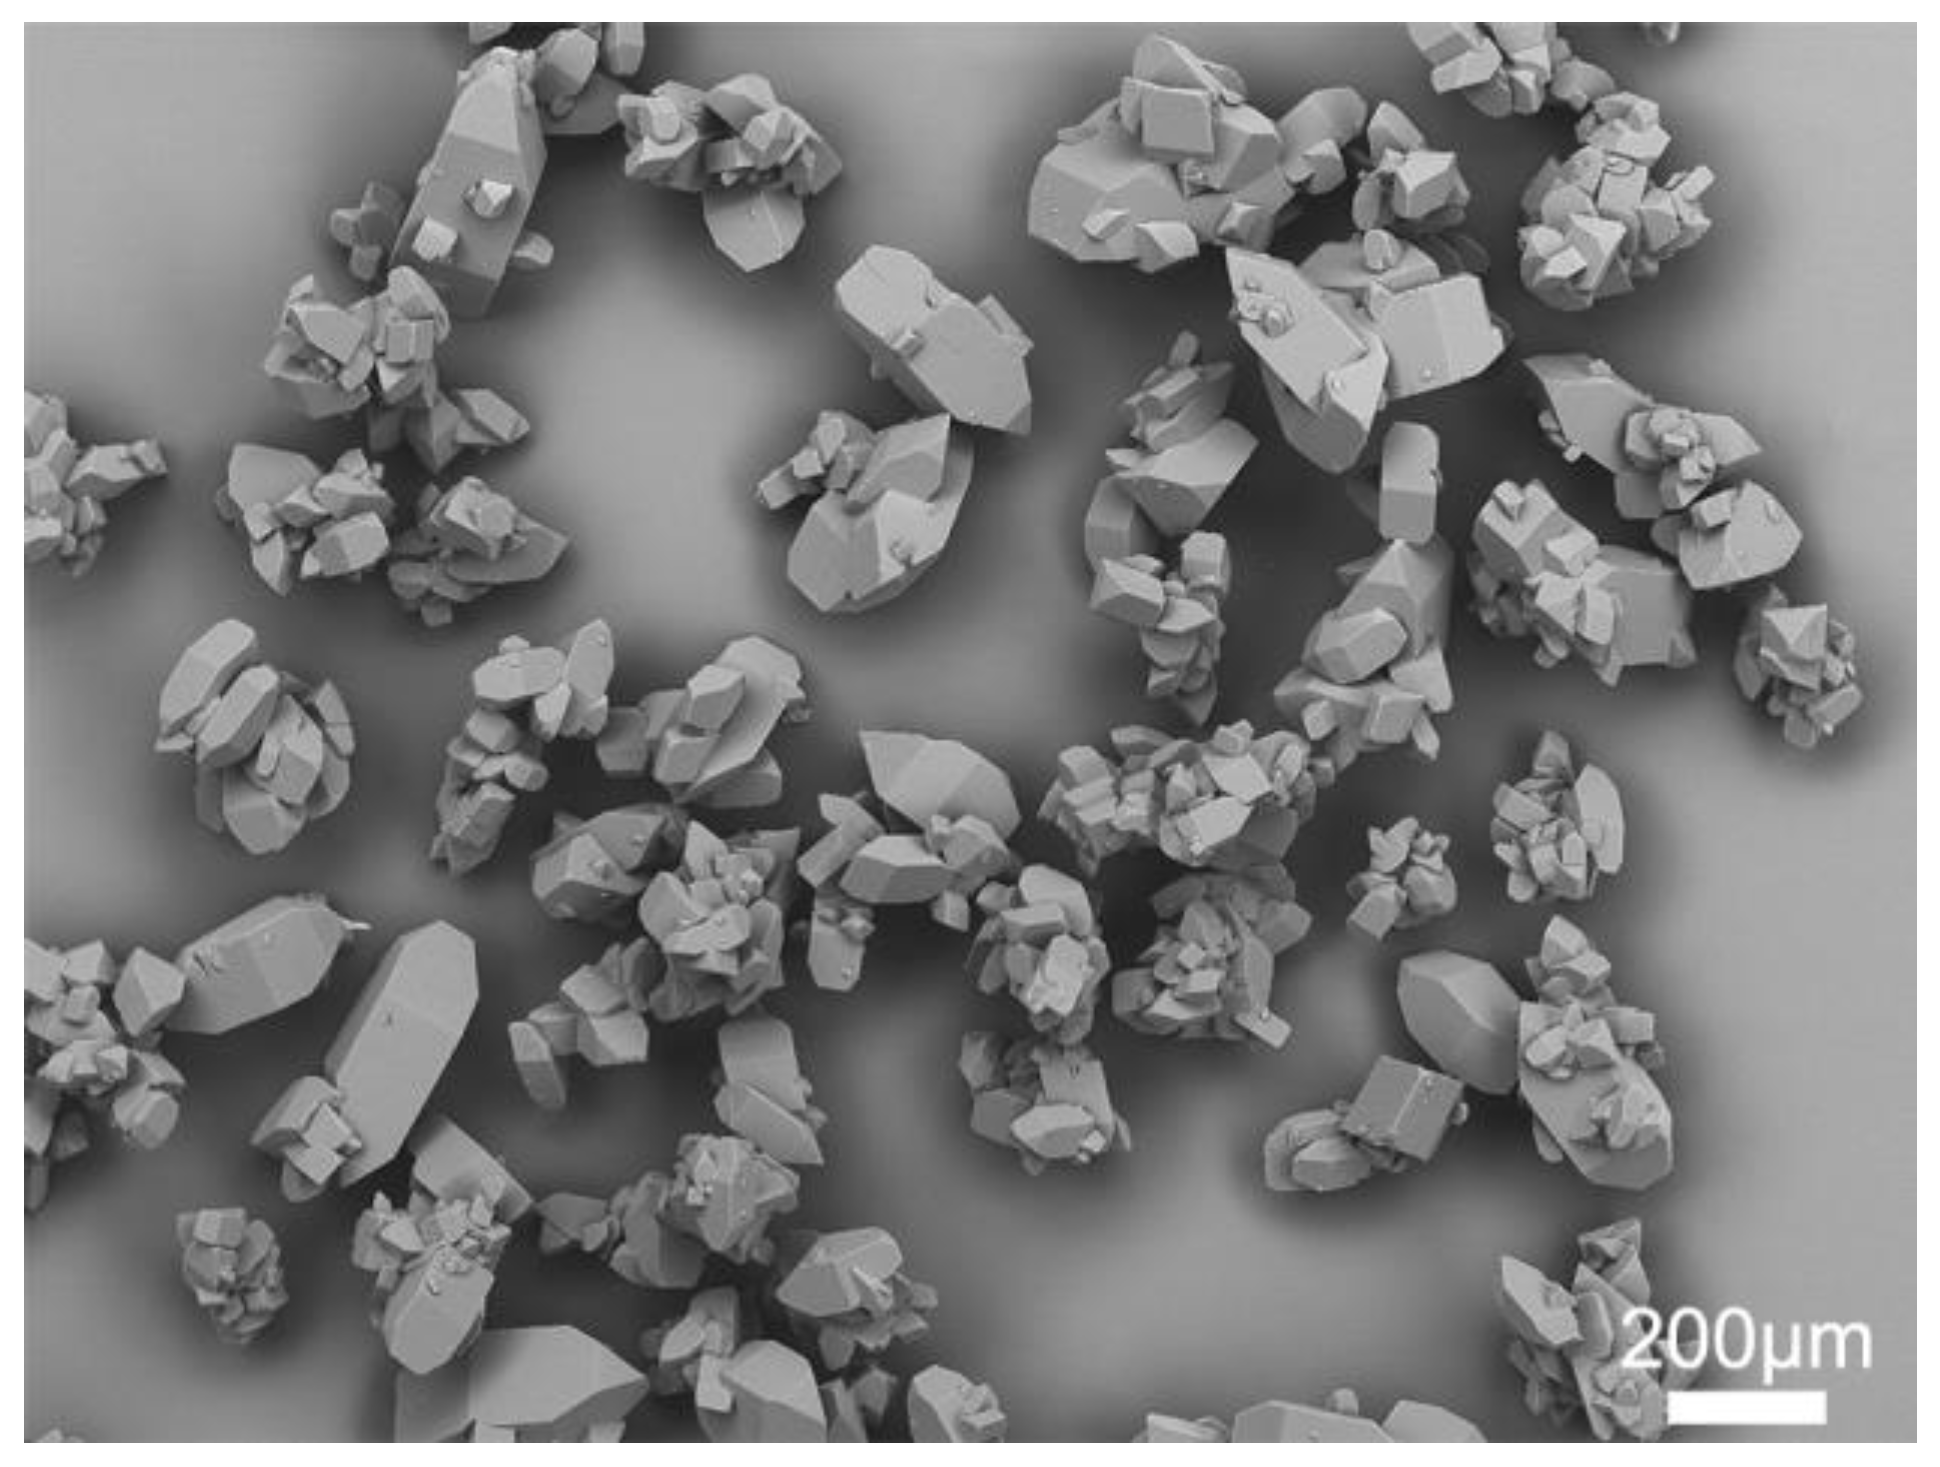
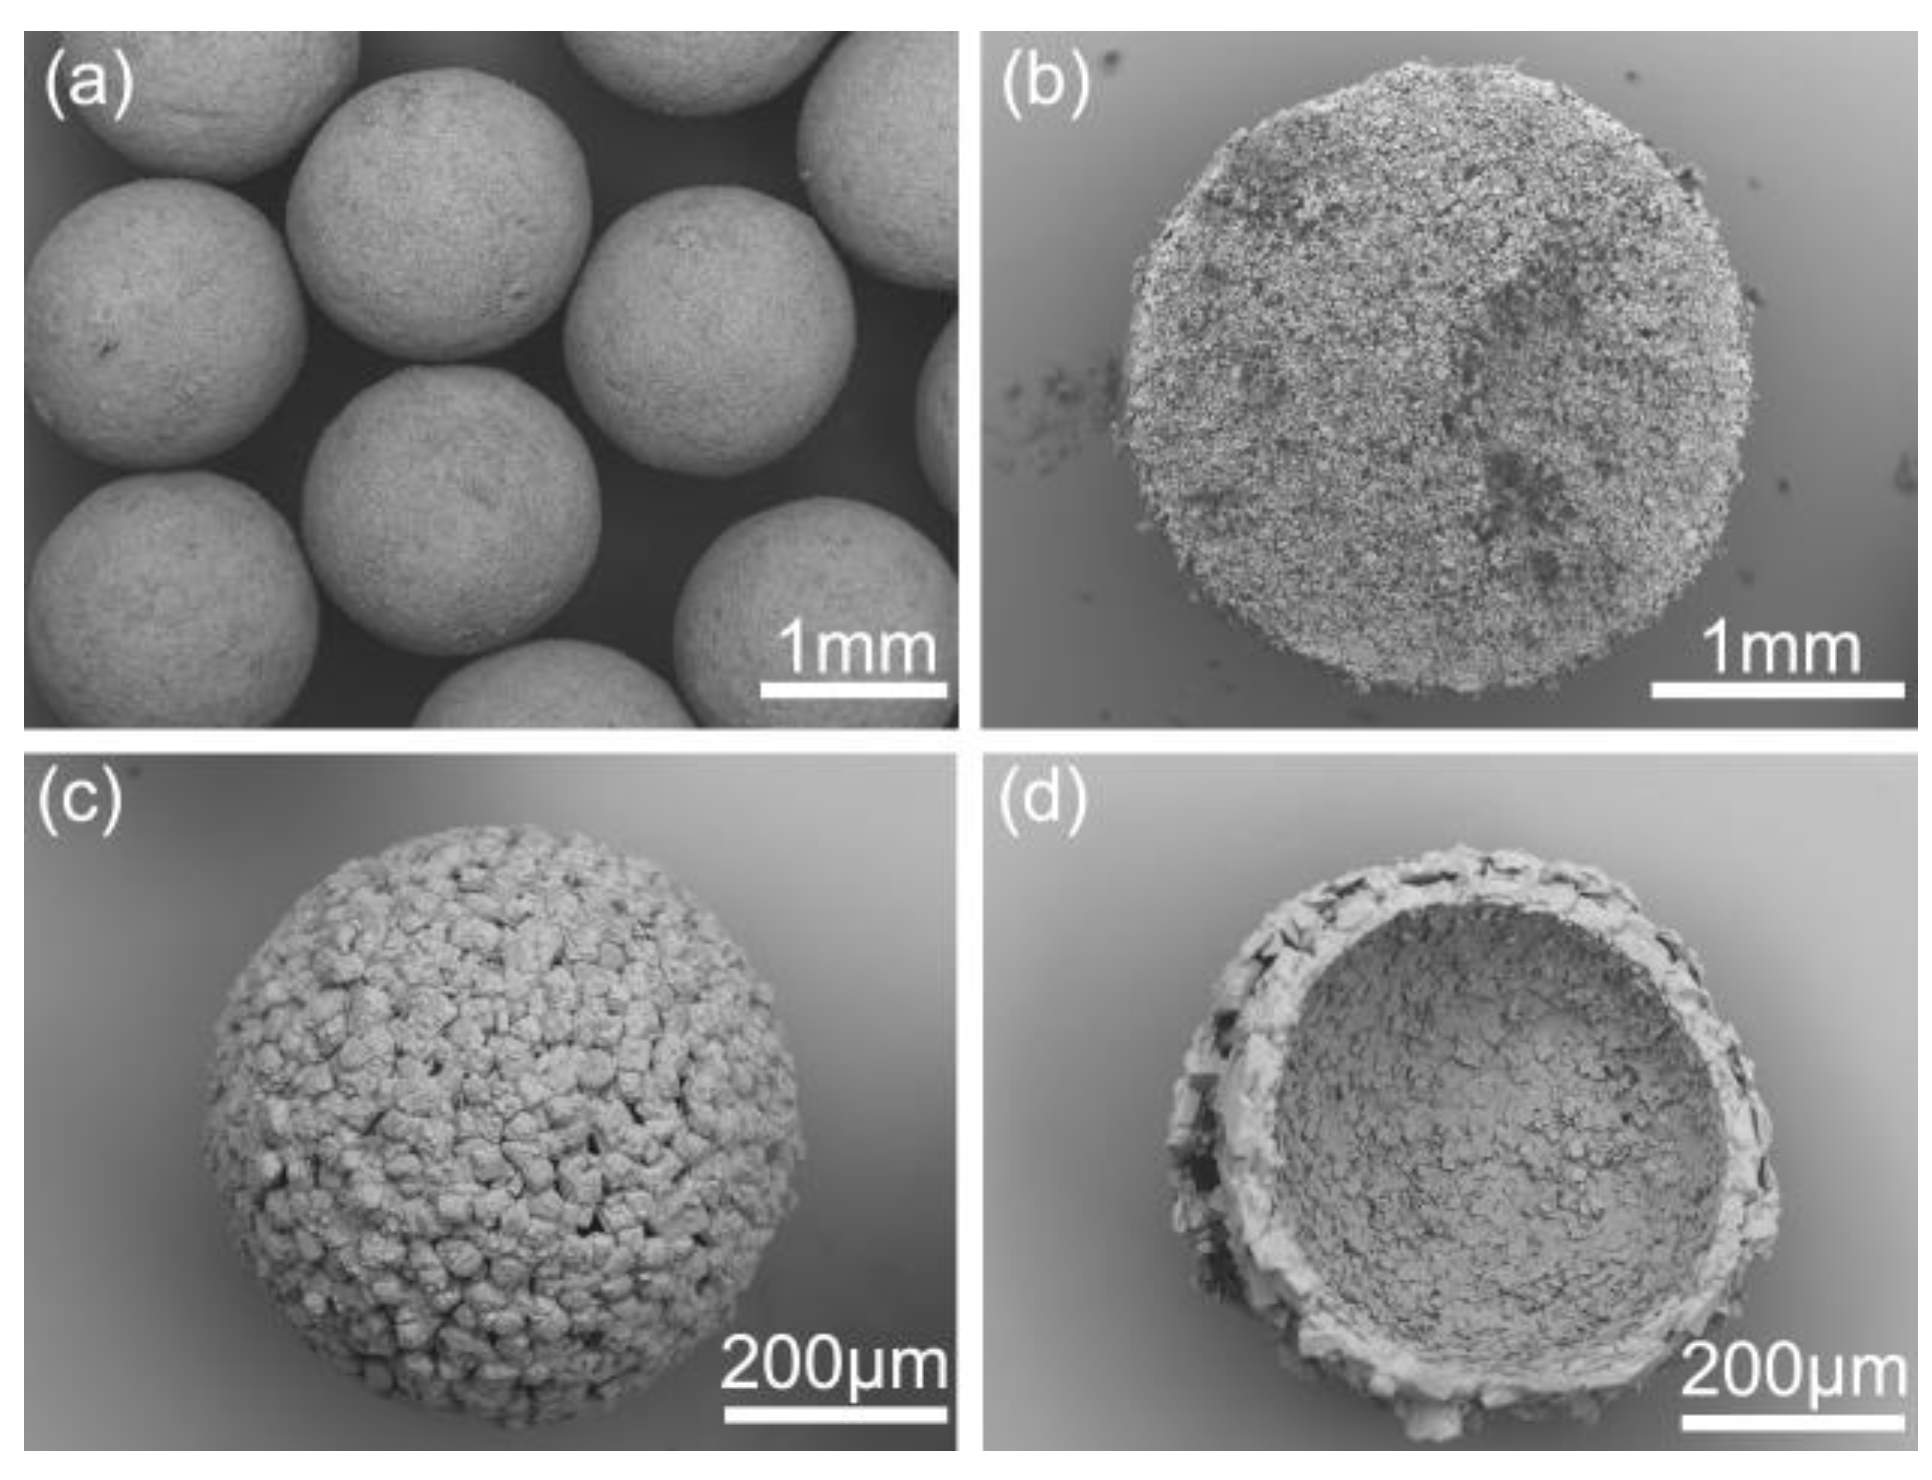
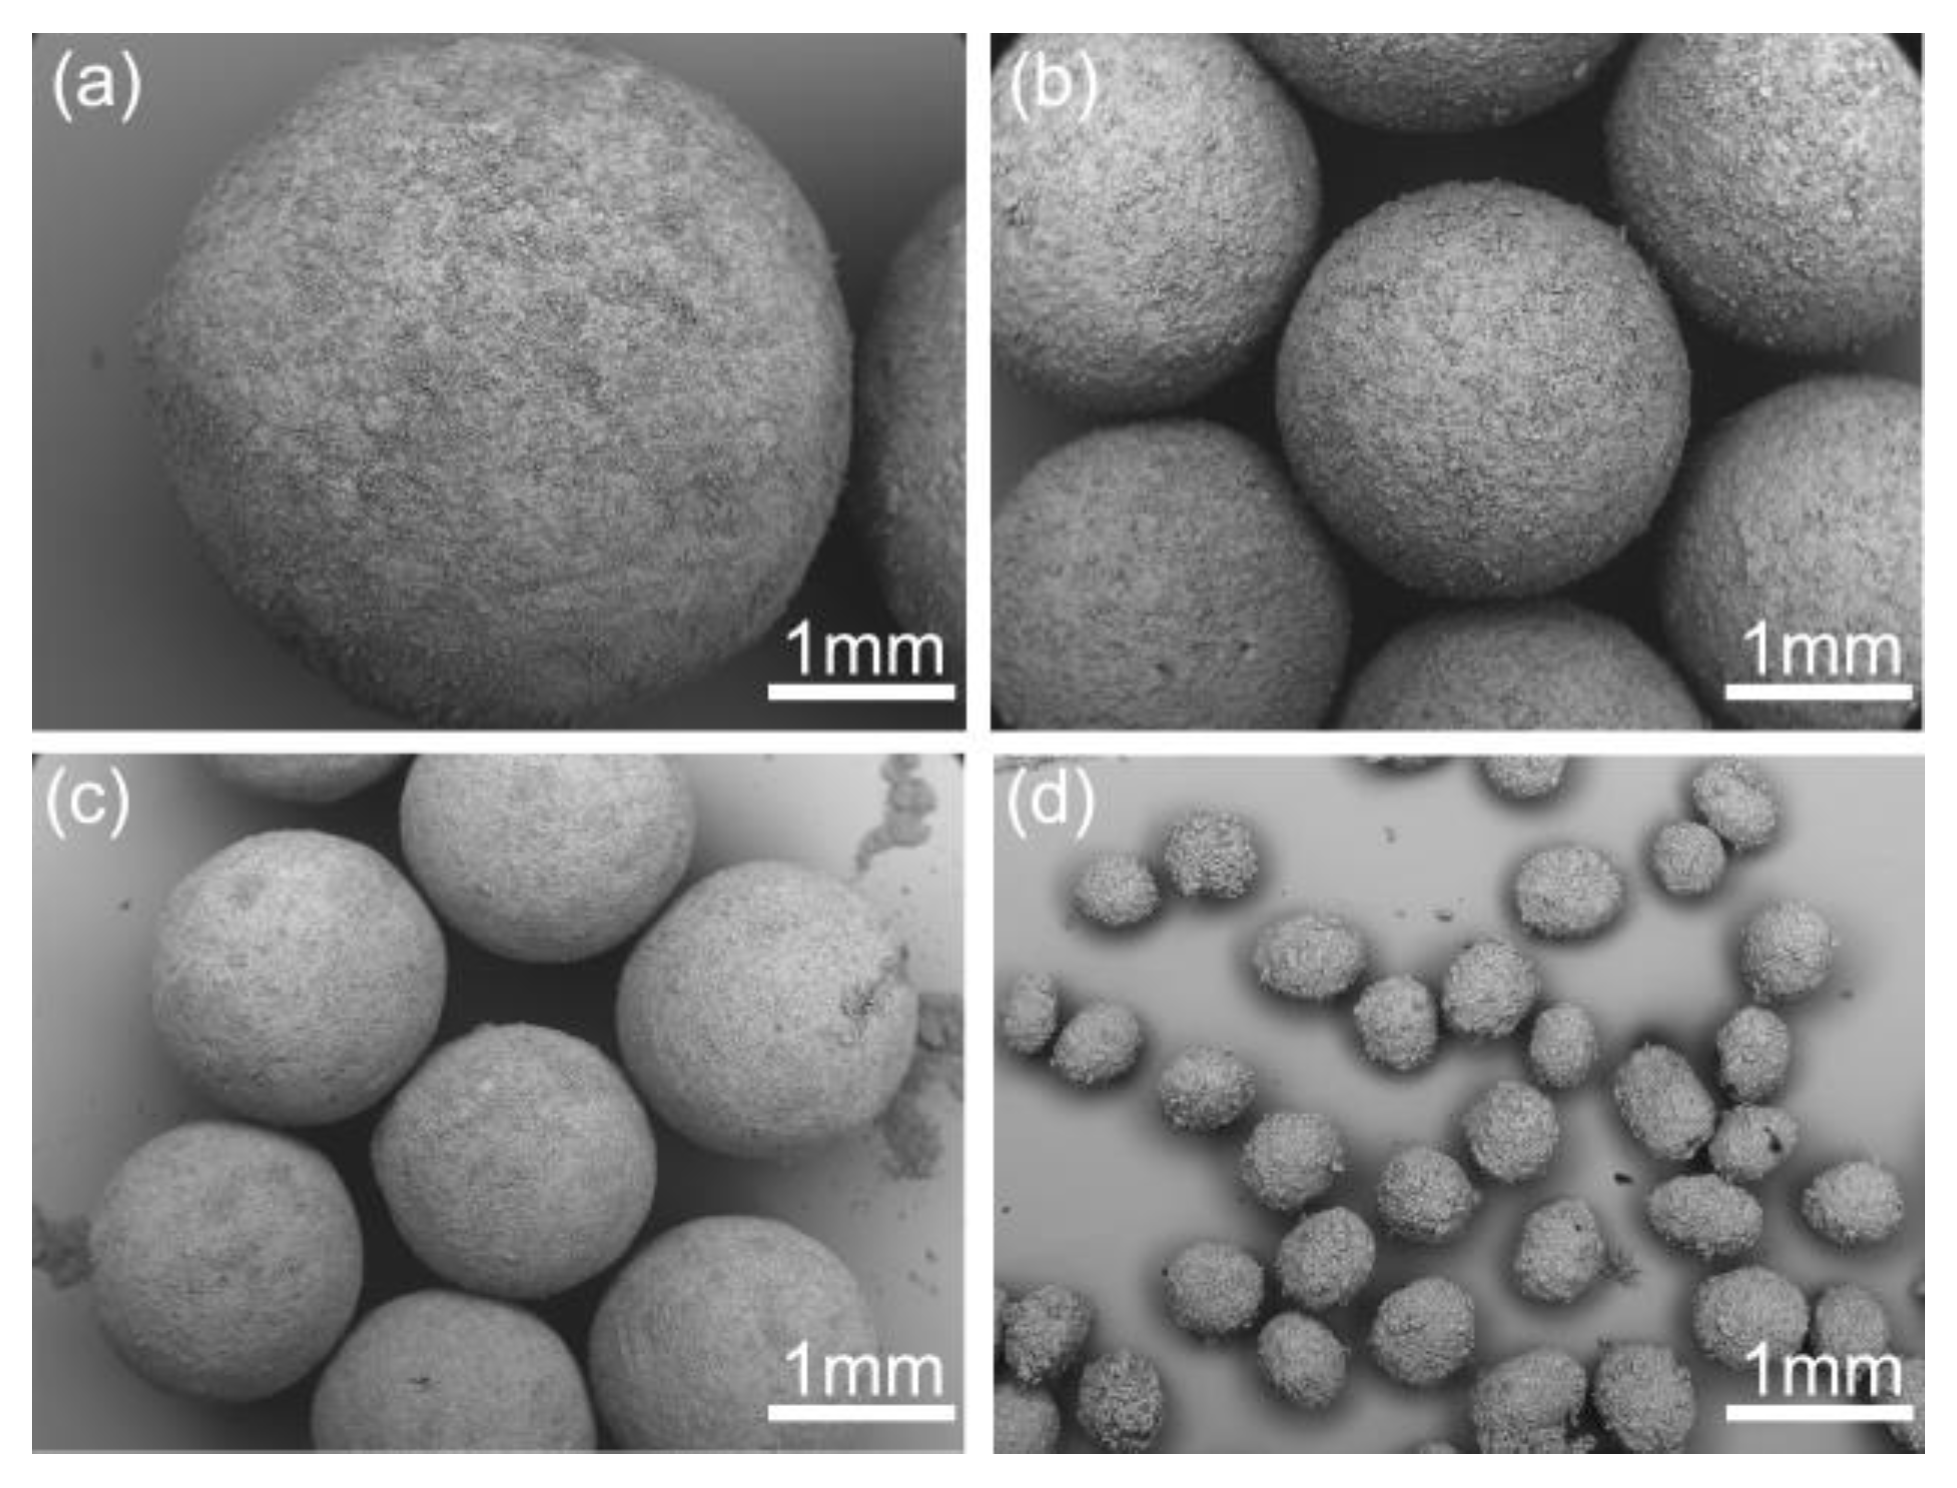
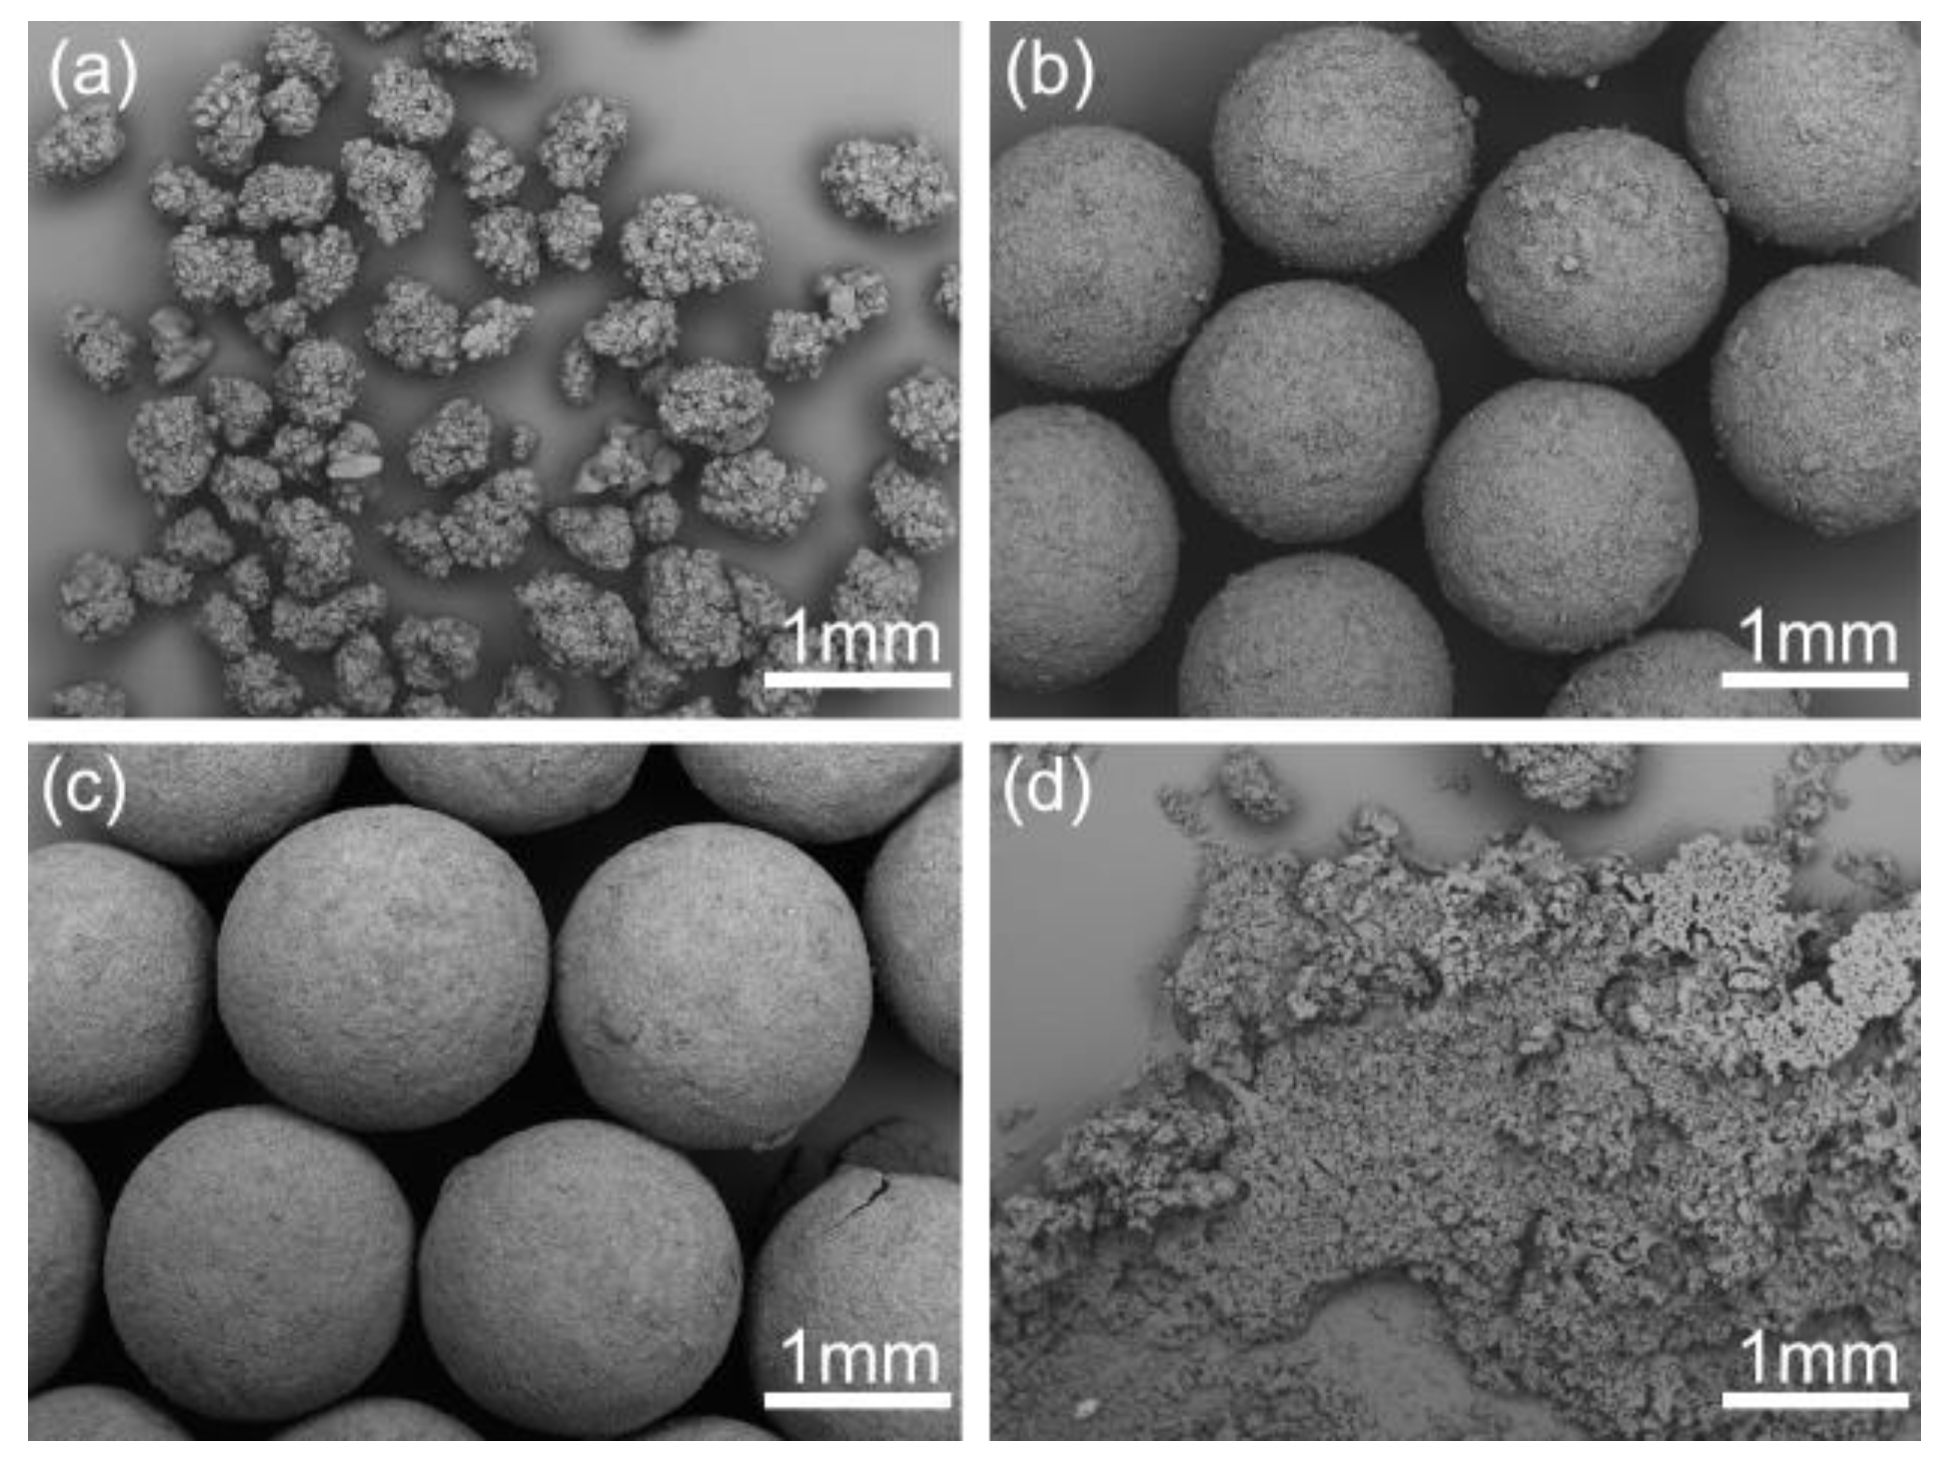
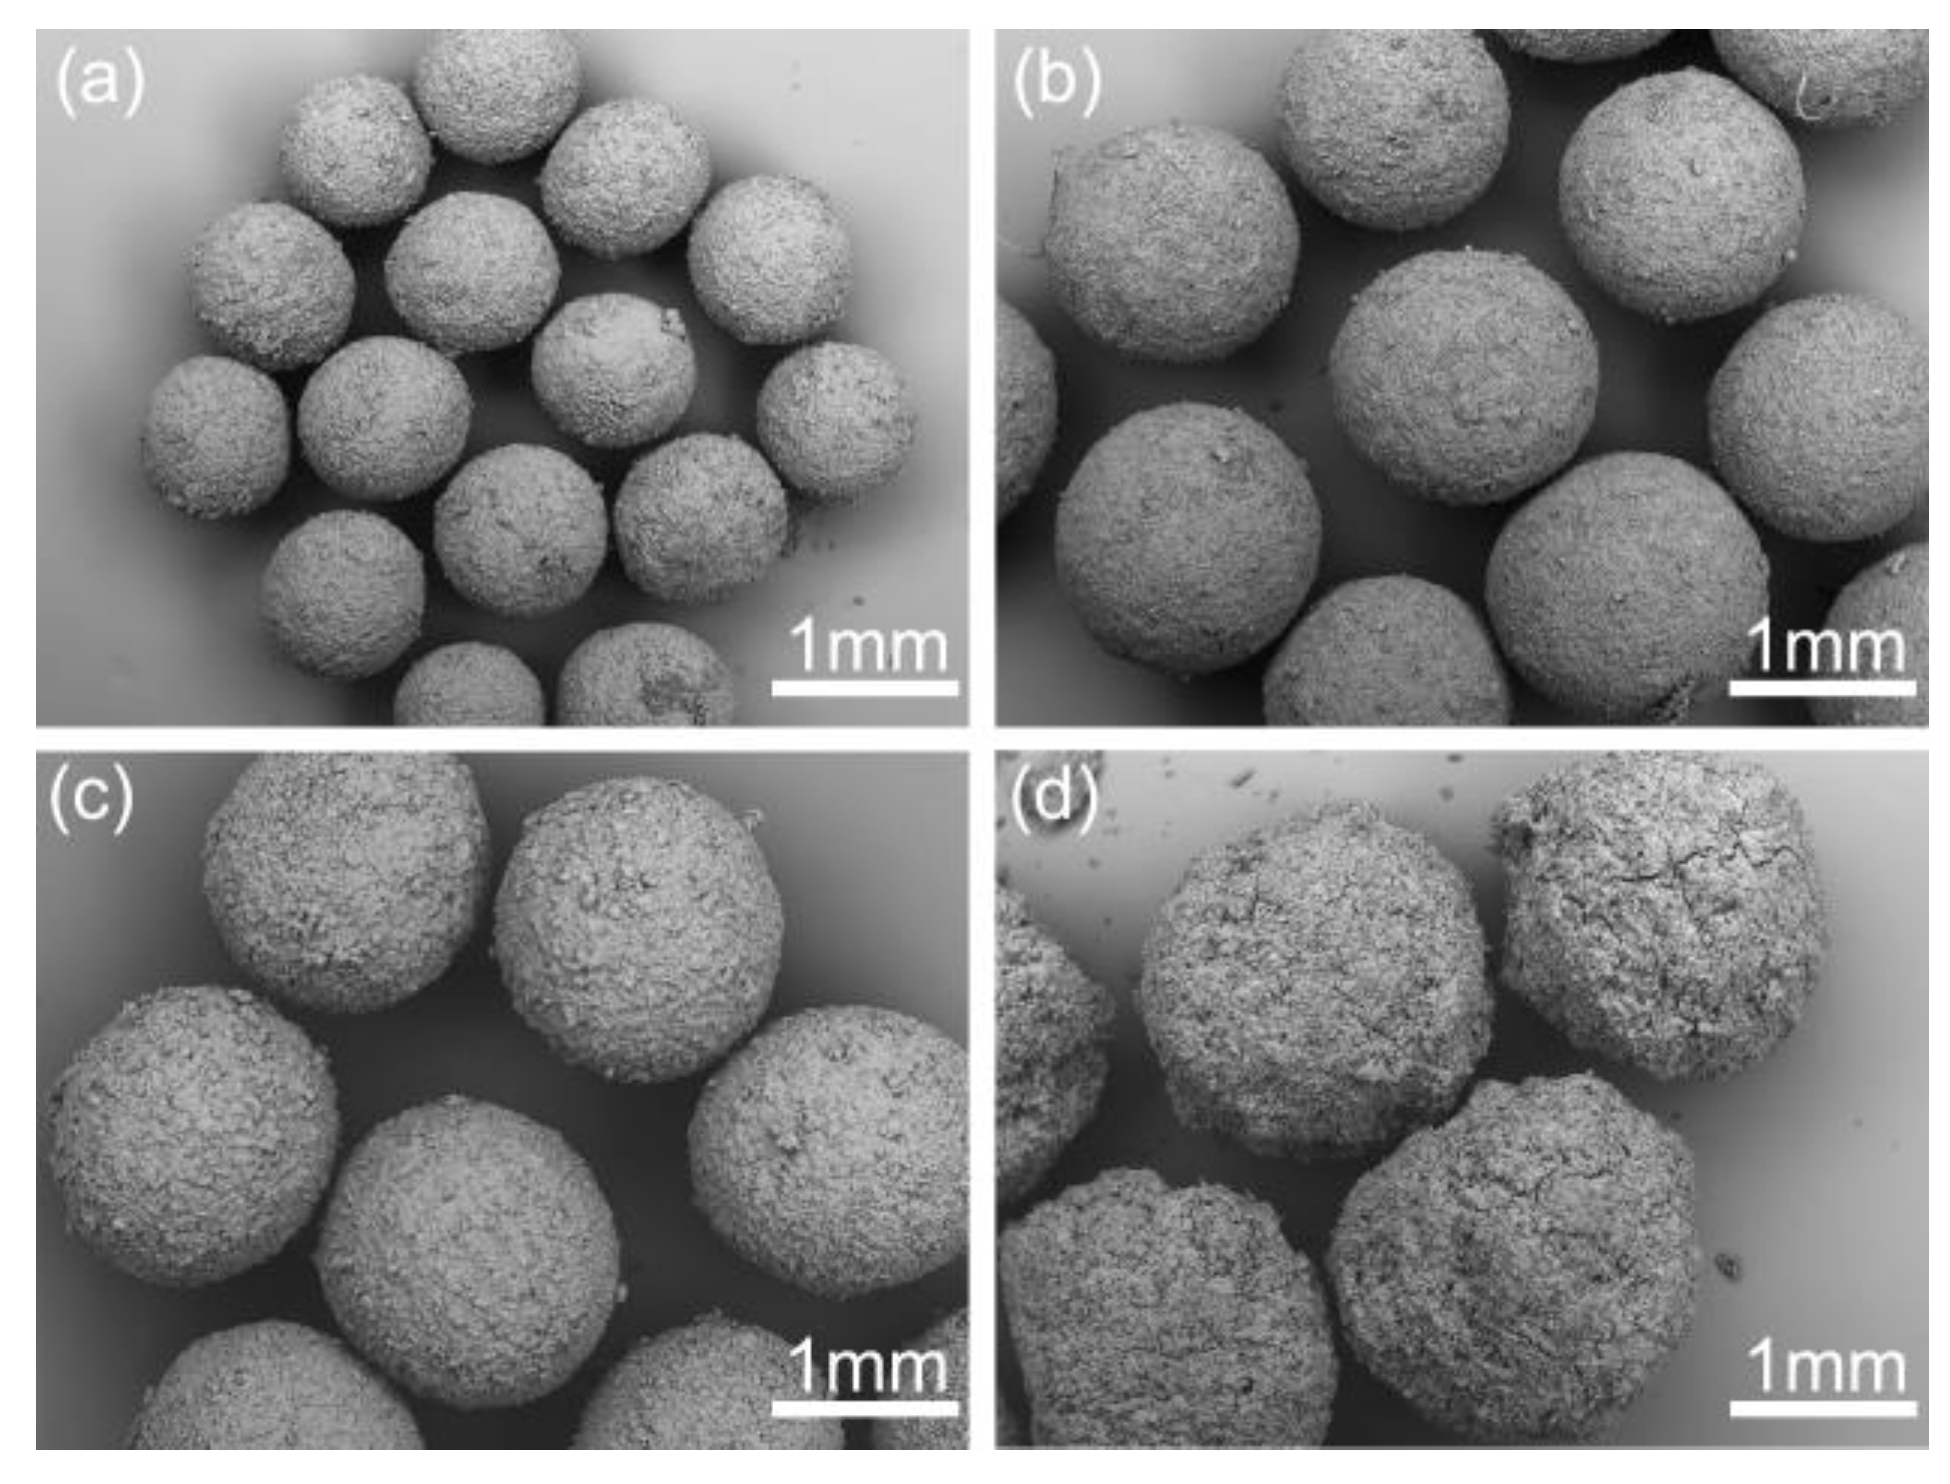
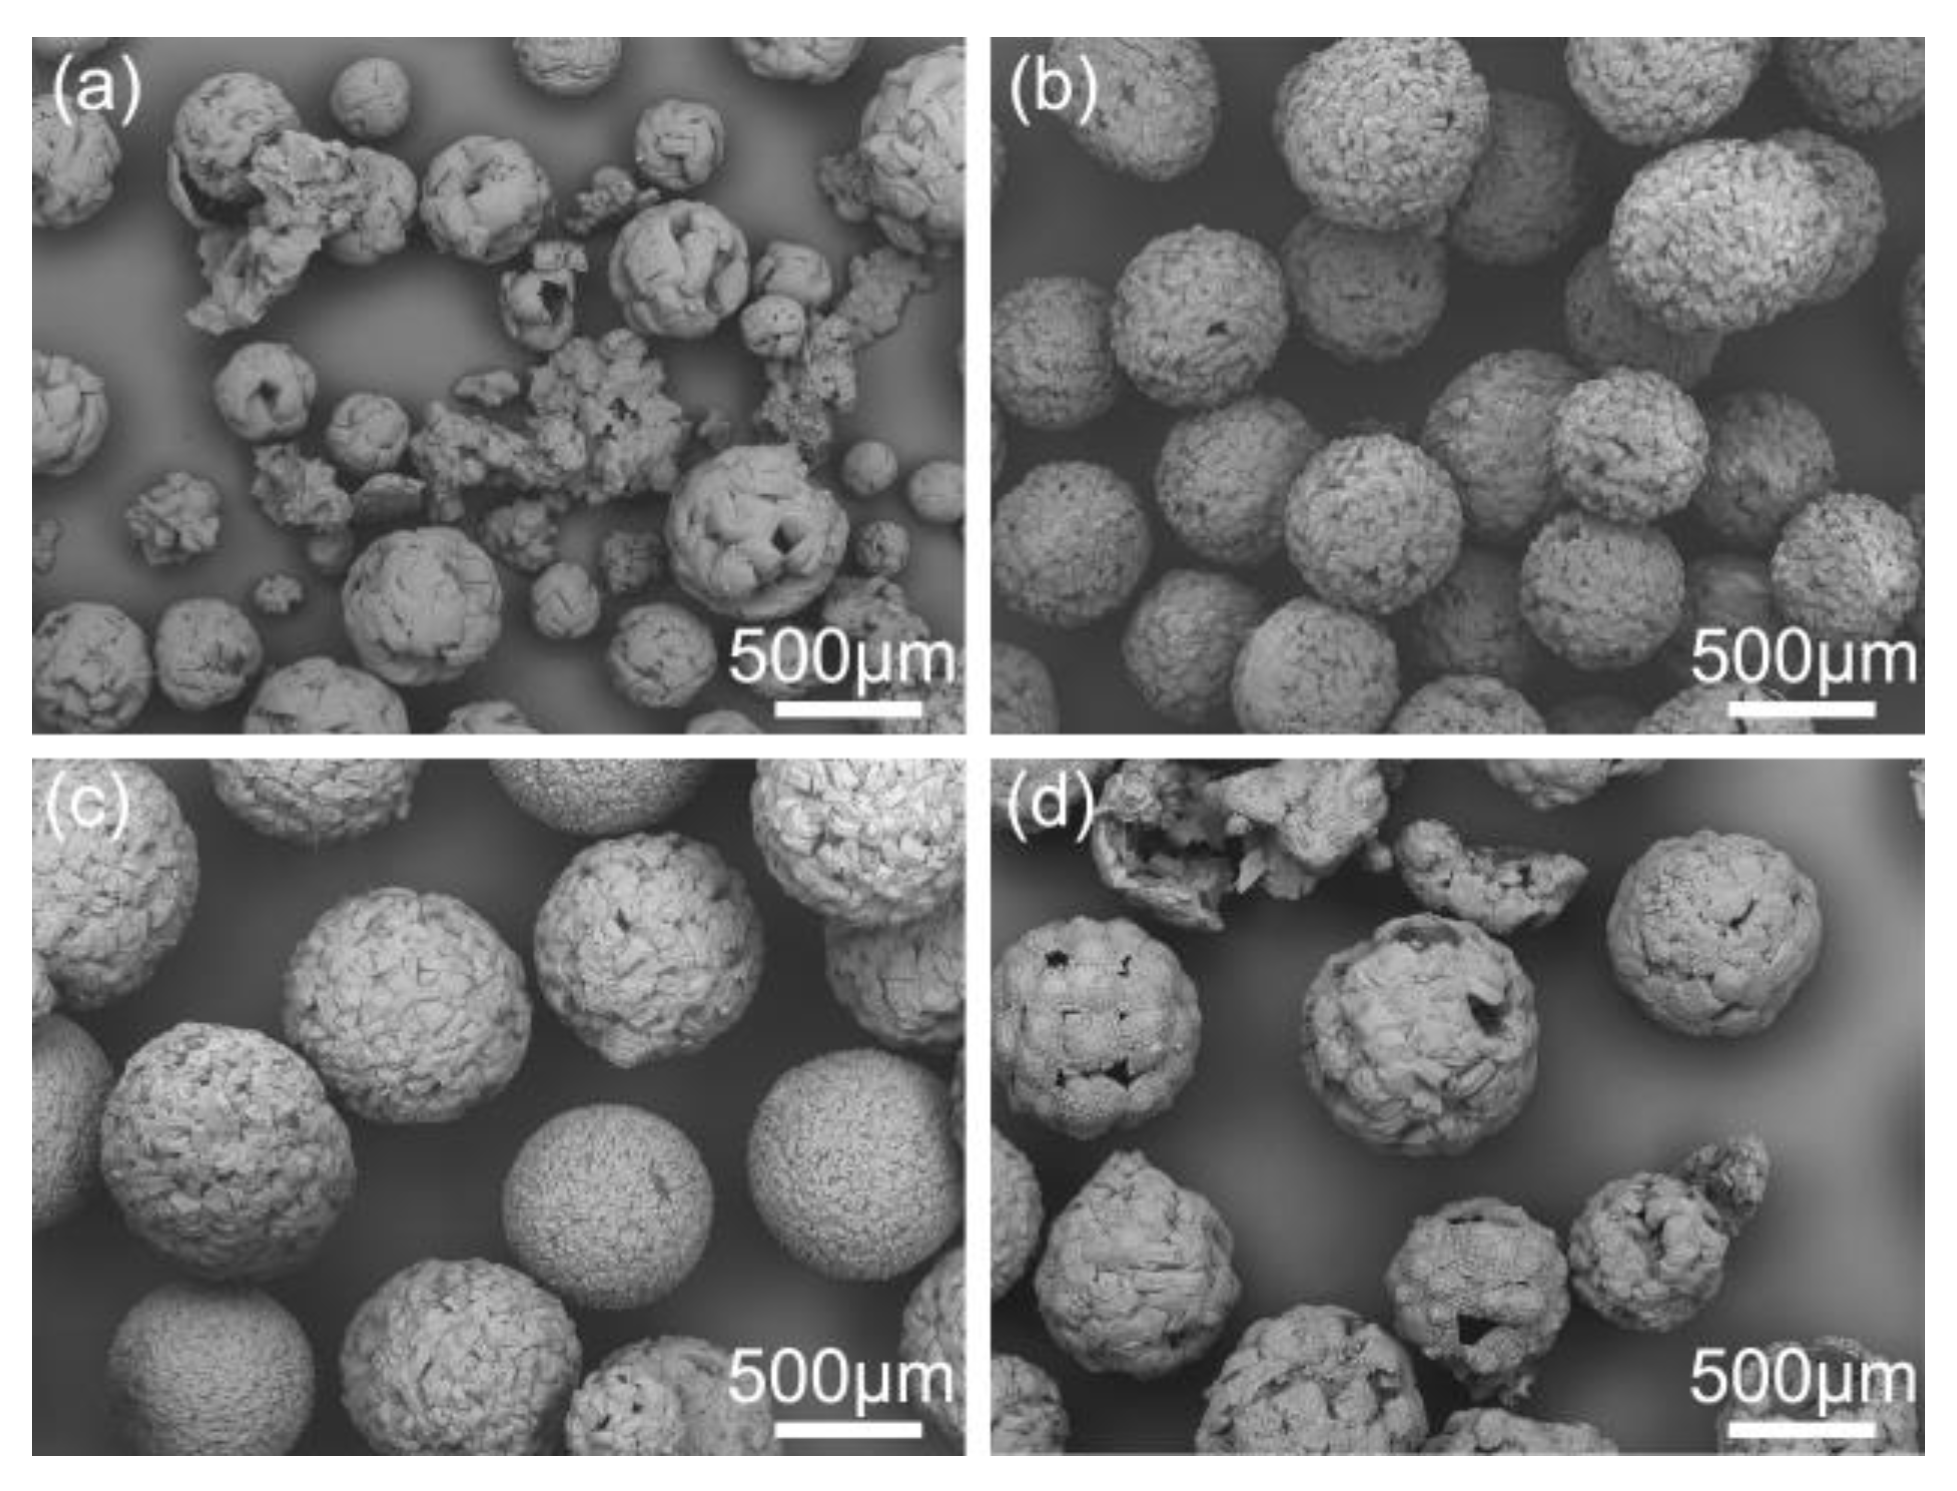
3.1. Characterization of Spherical Products
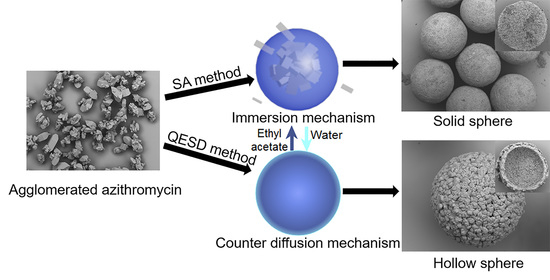
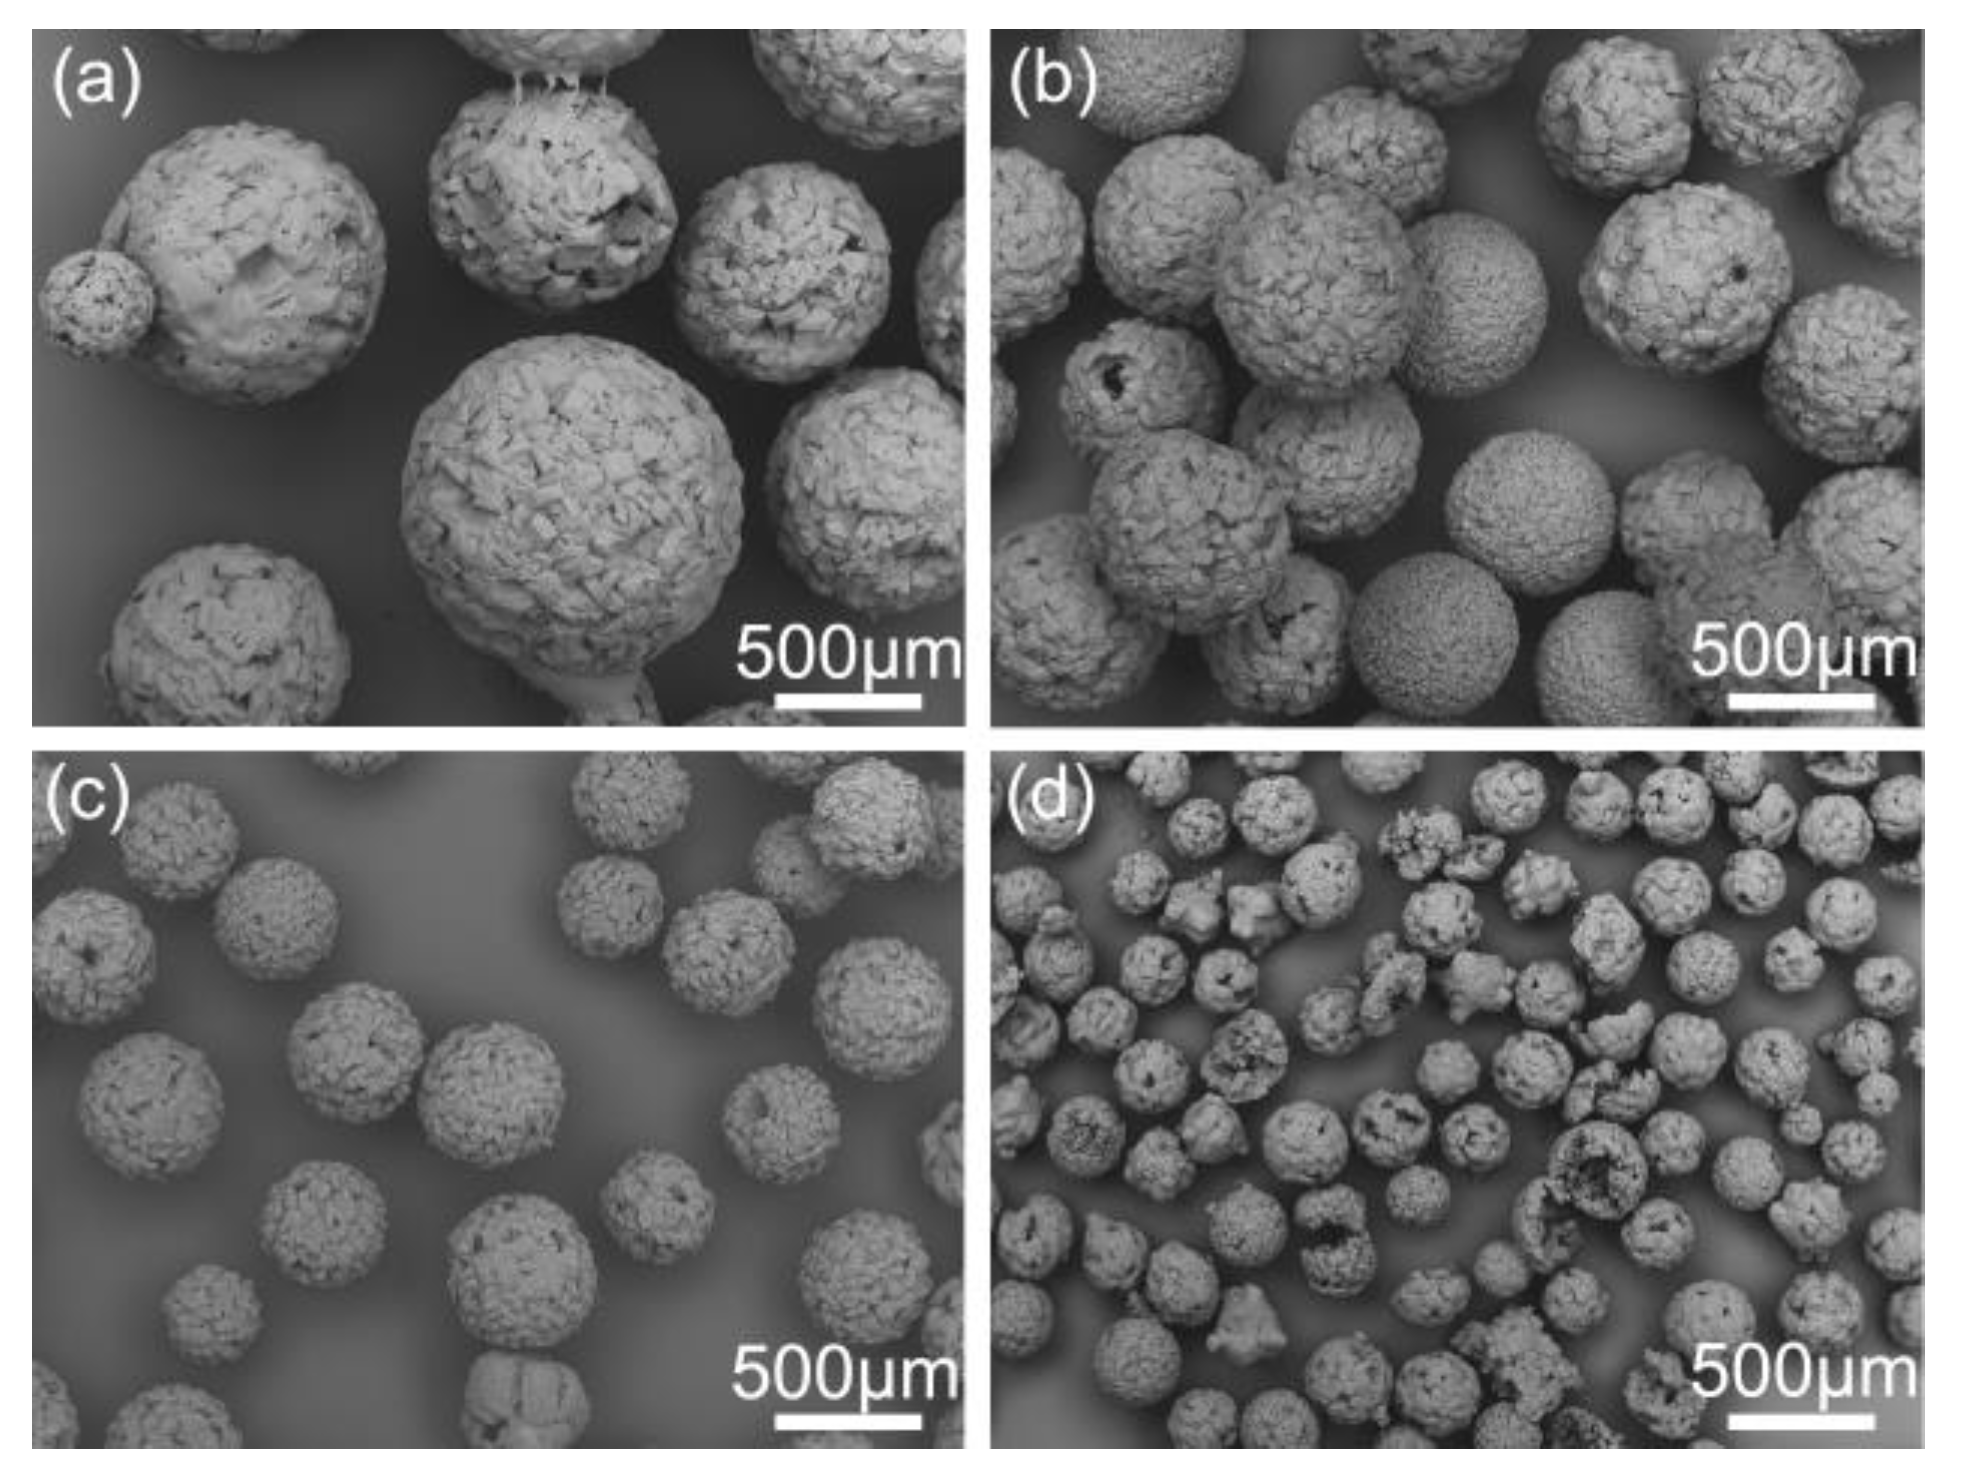
3.2. Formation Mechanisms of Spherical Crystals
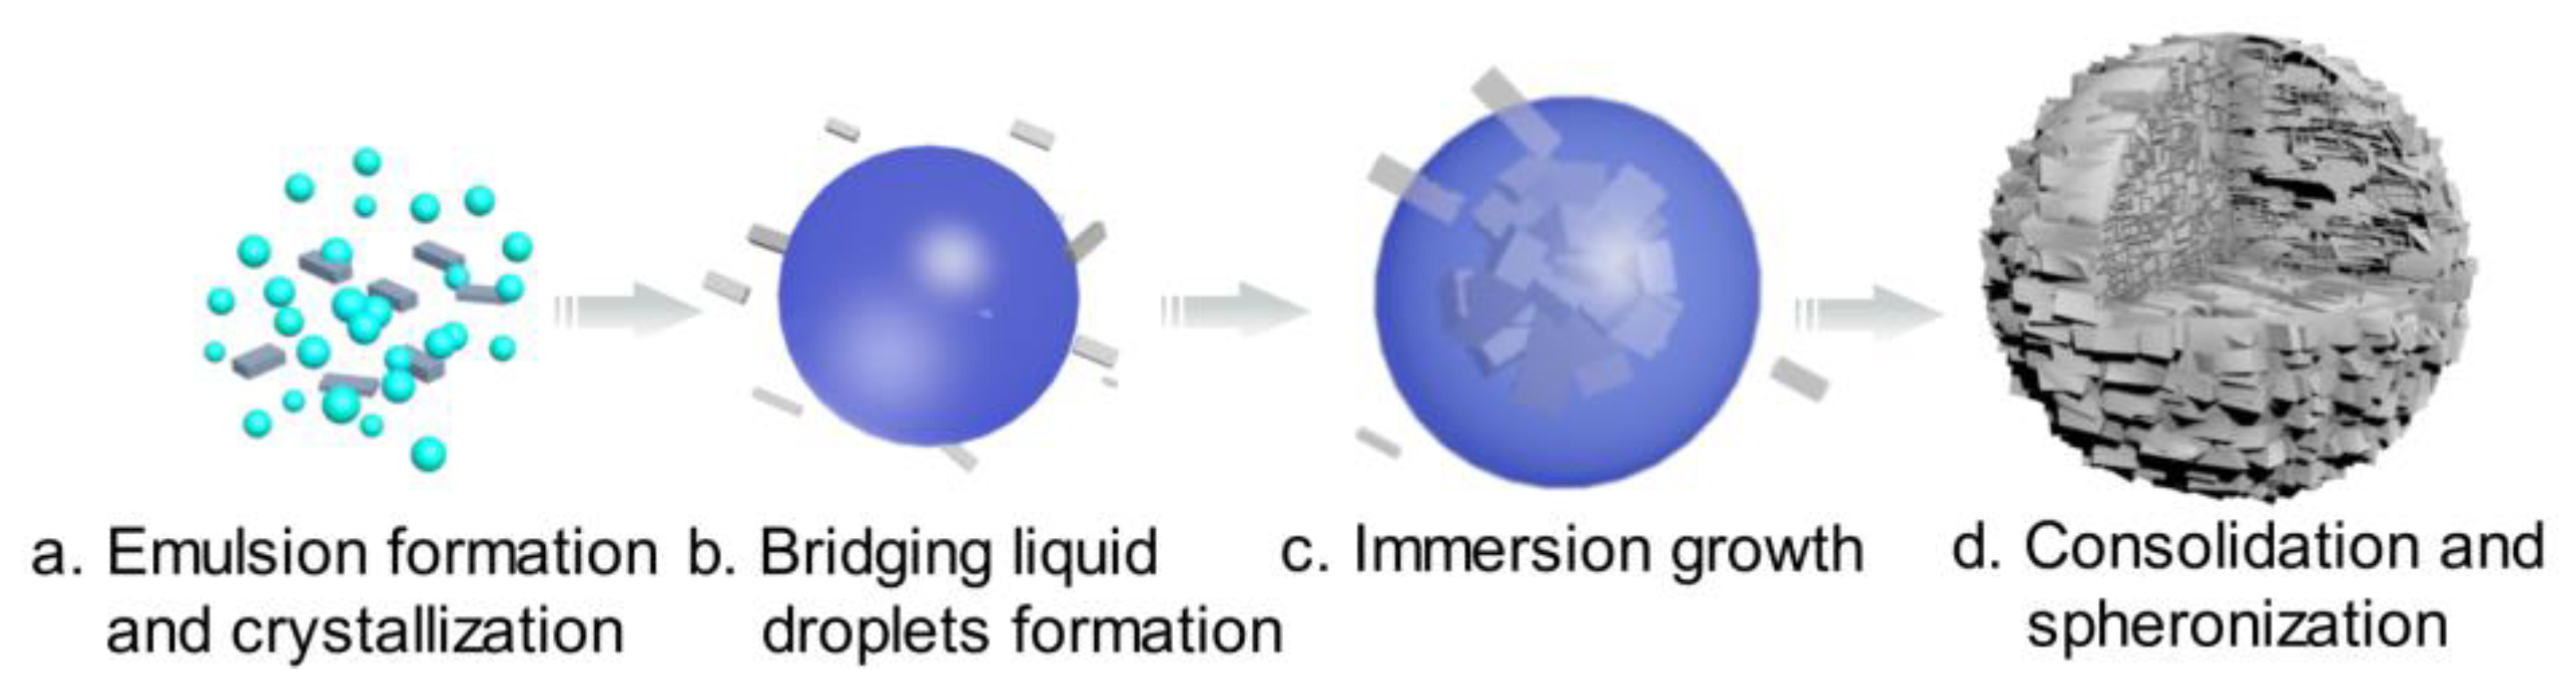
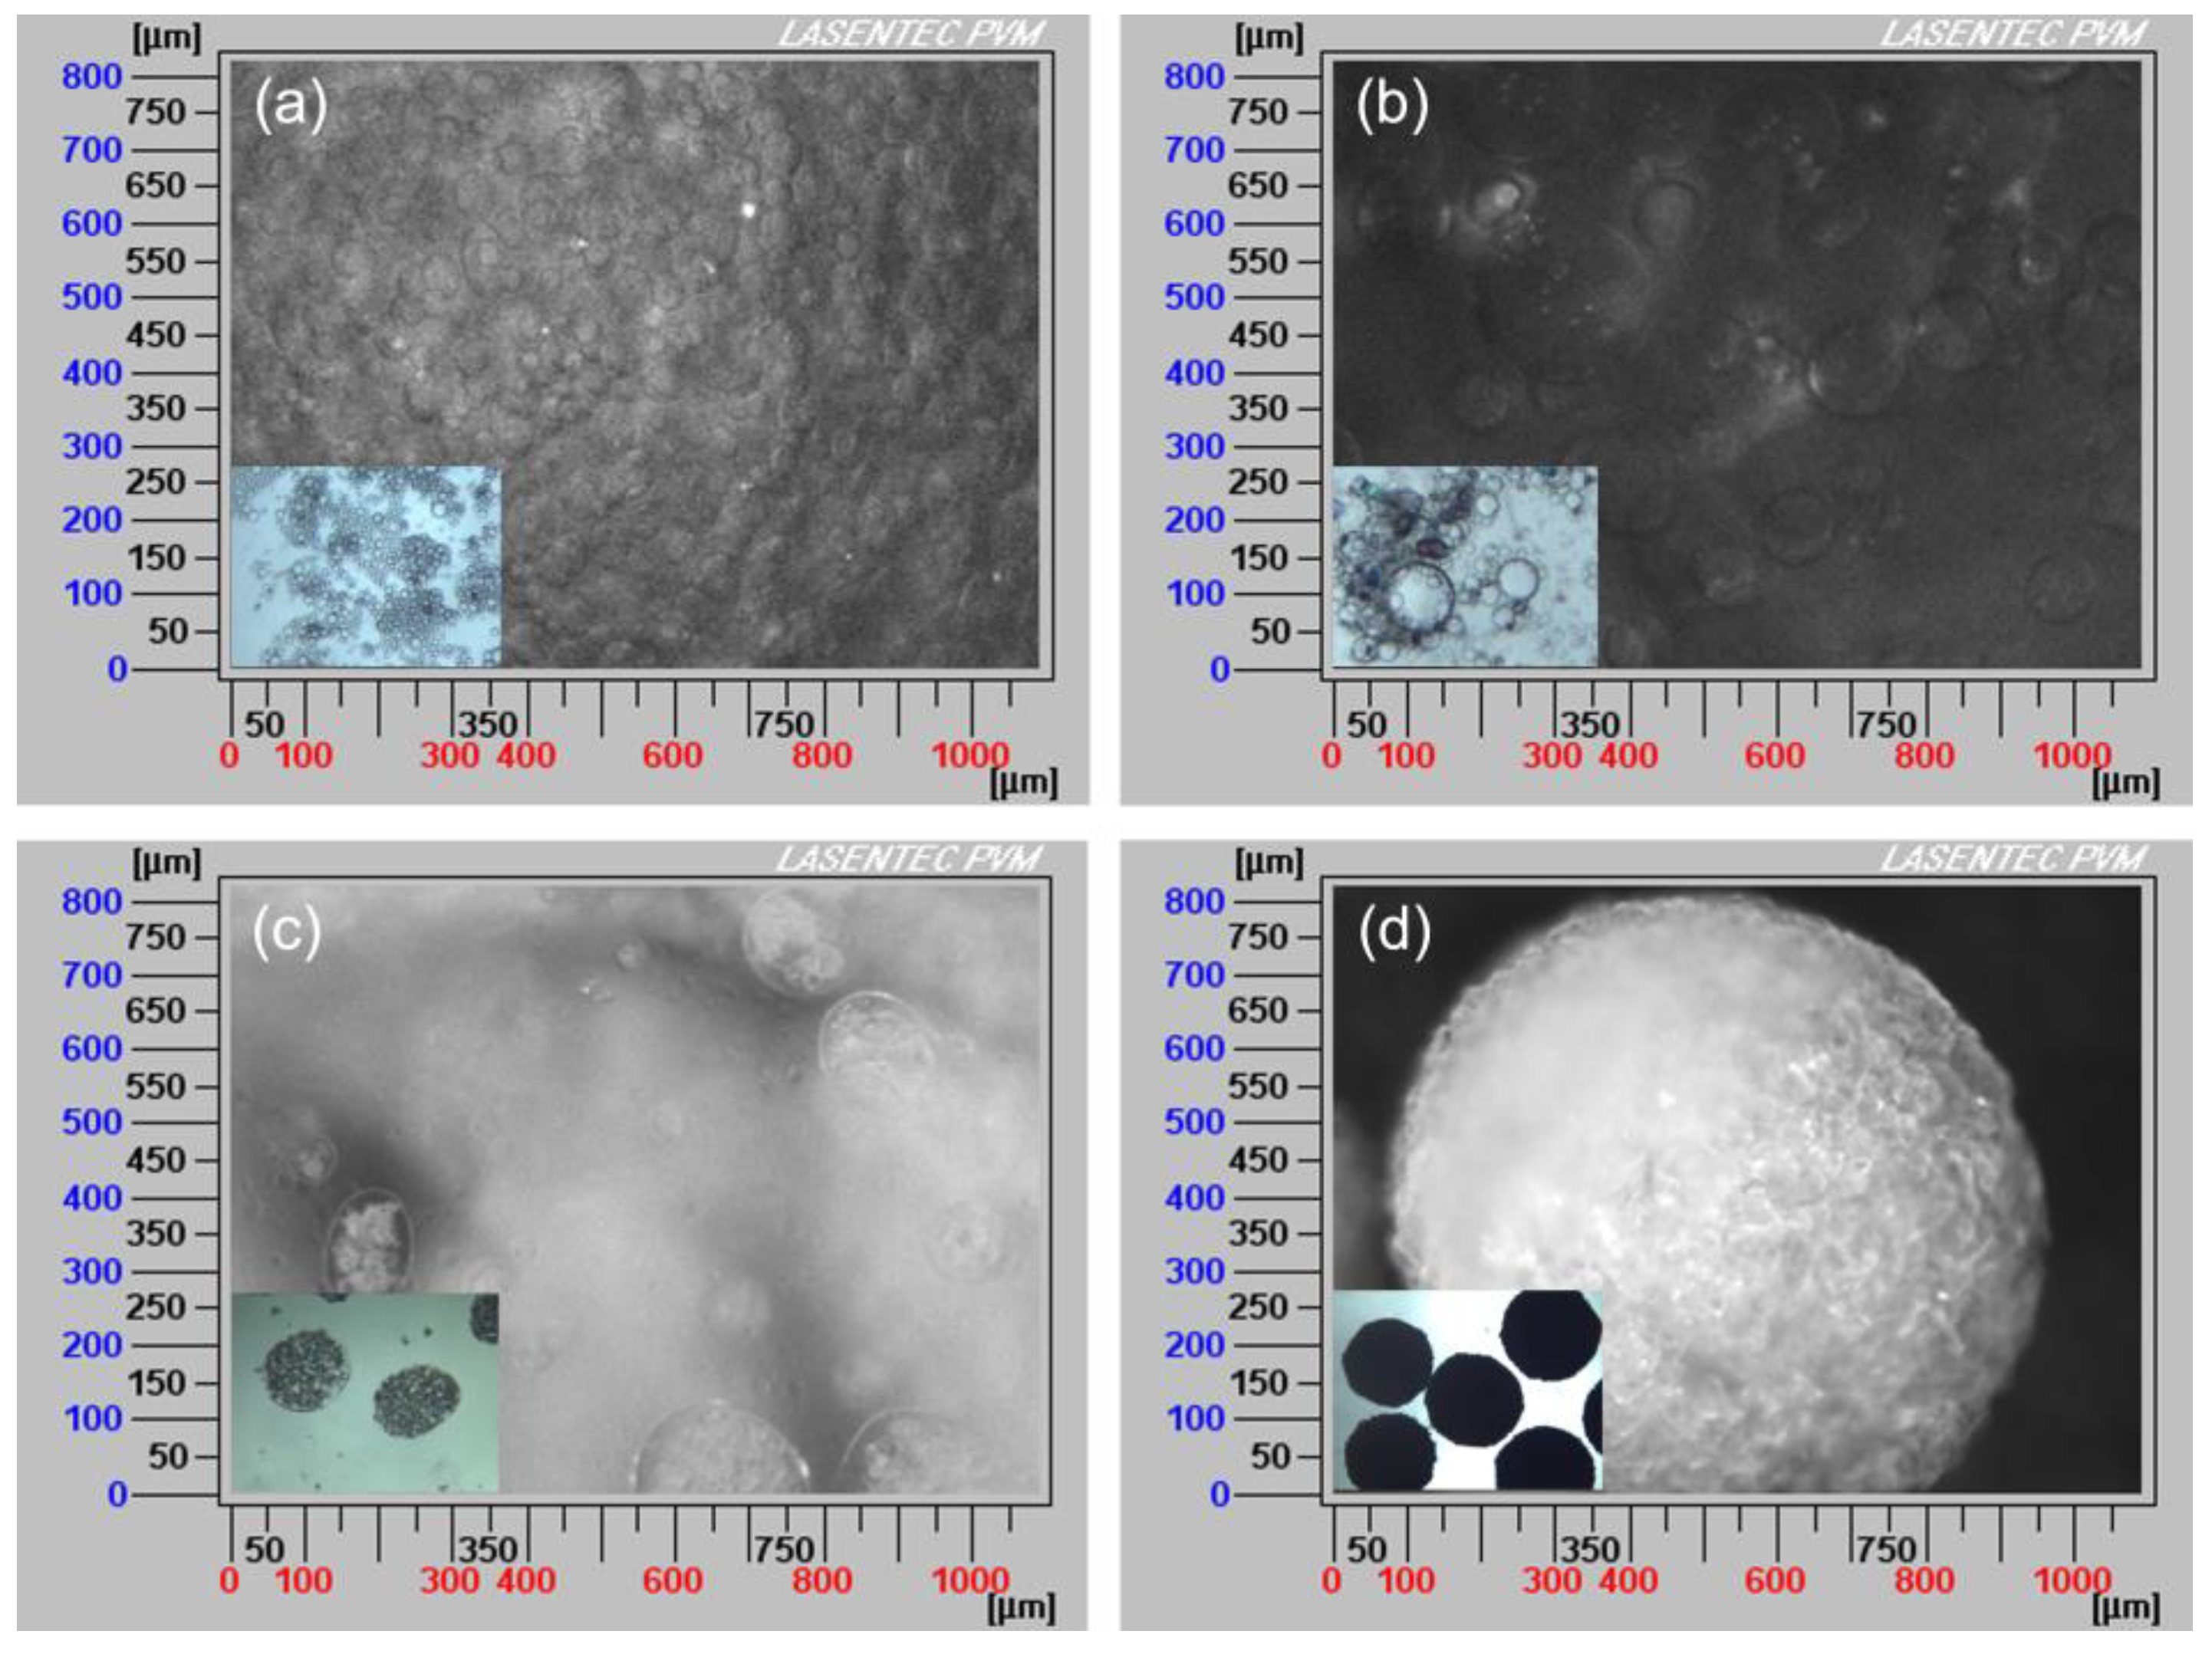
3.2.1. SA Process
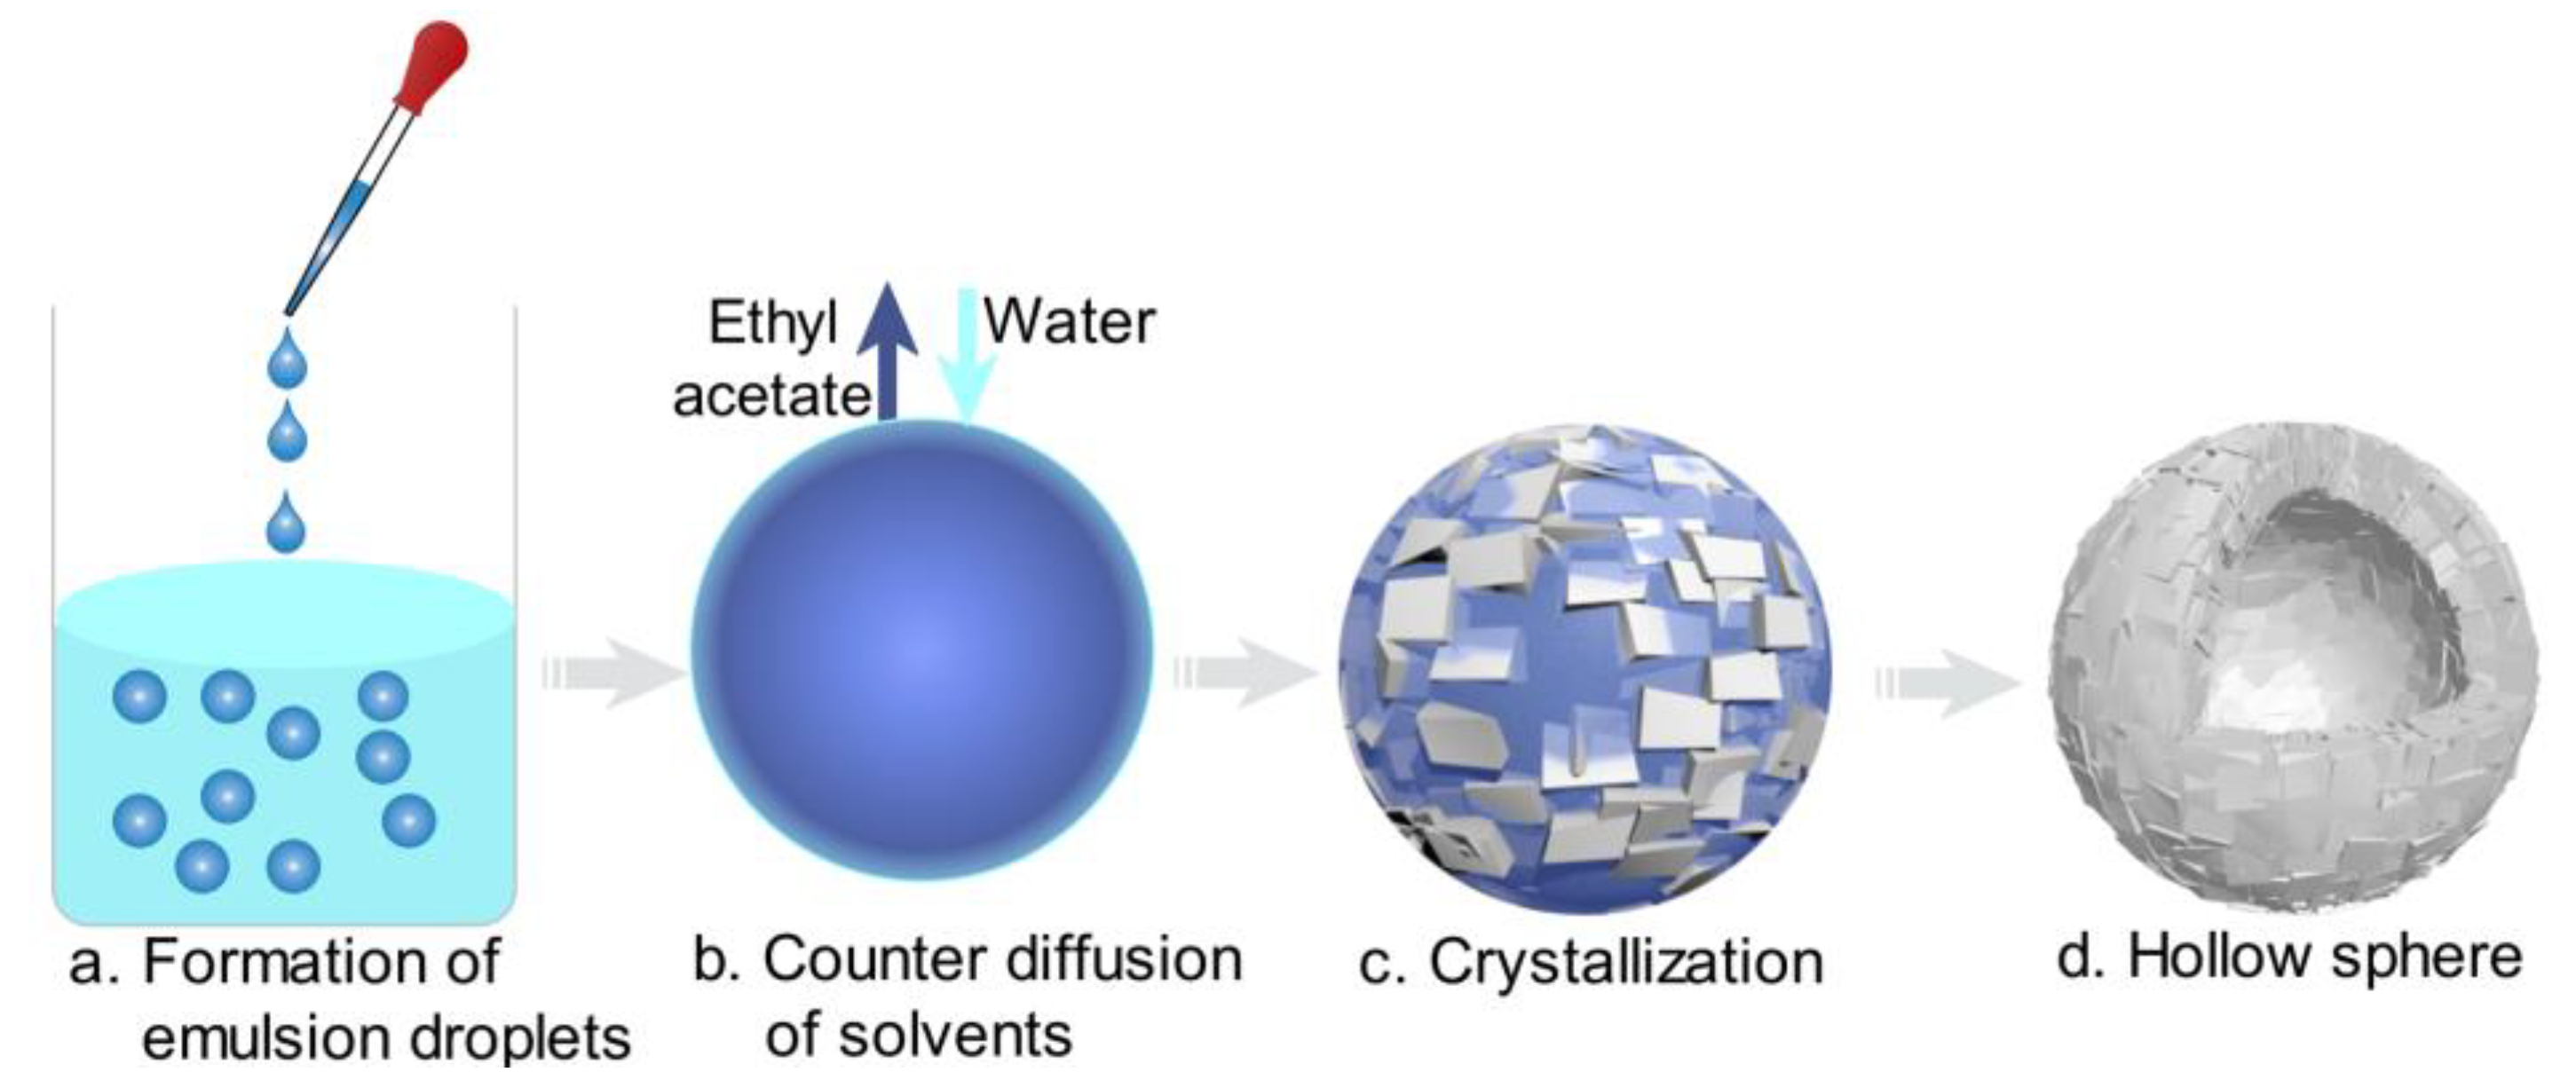
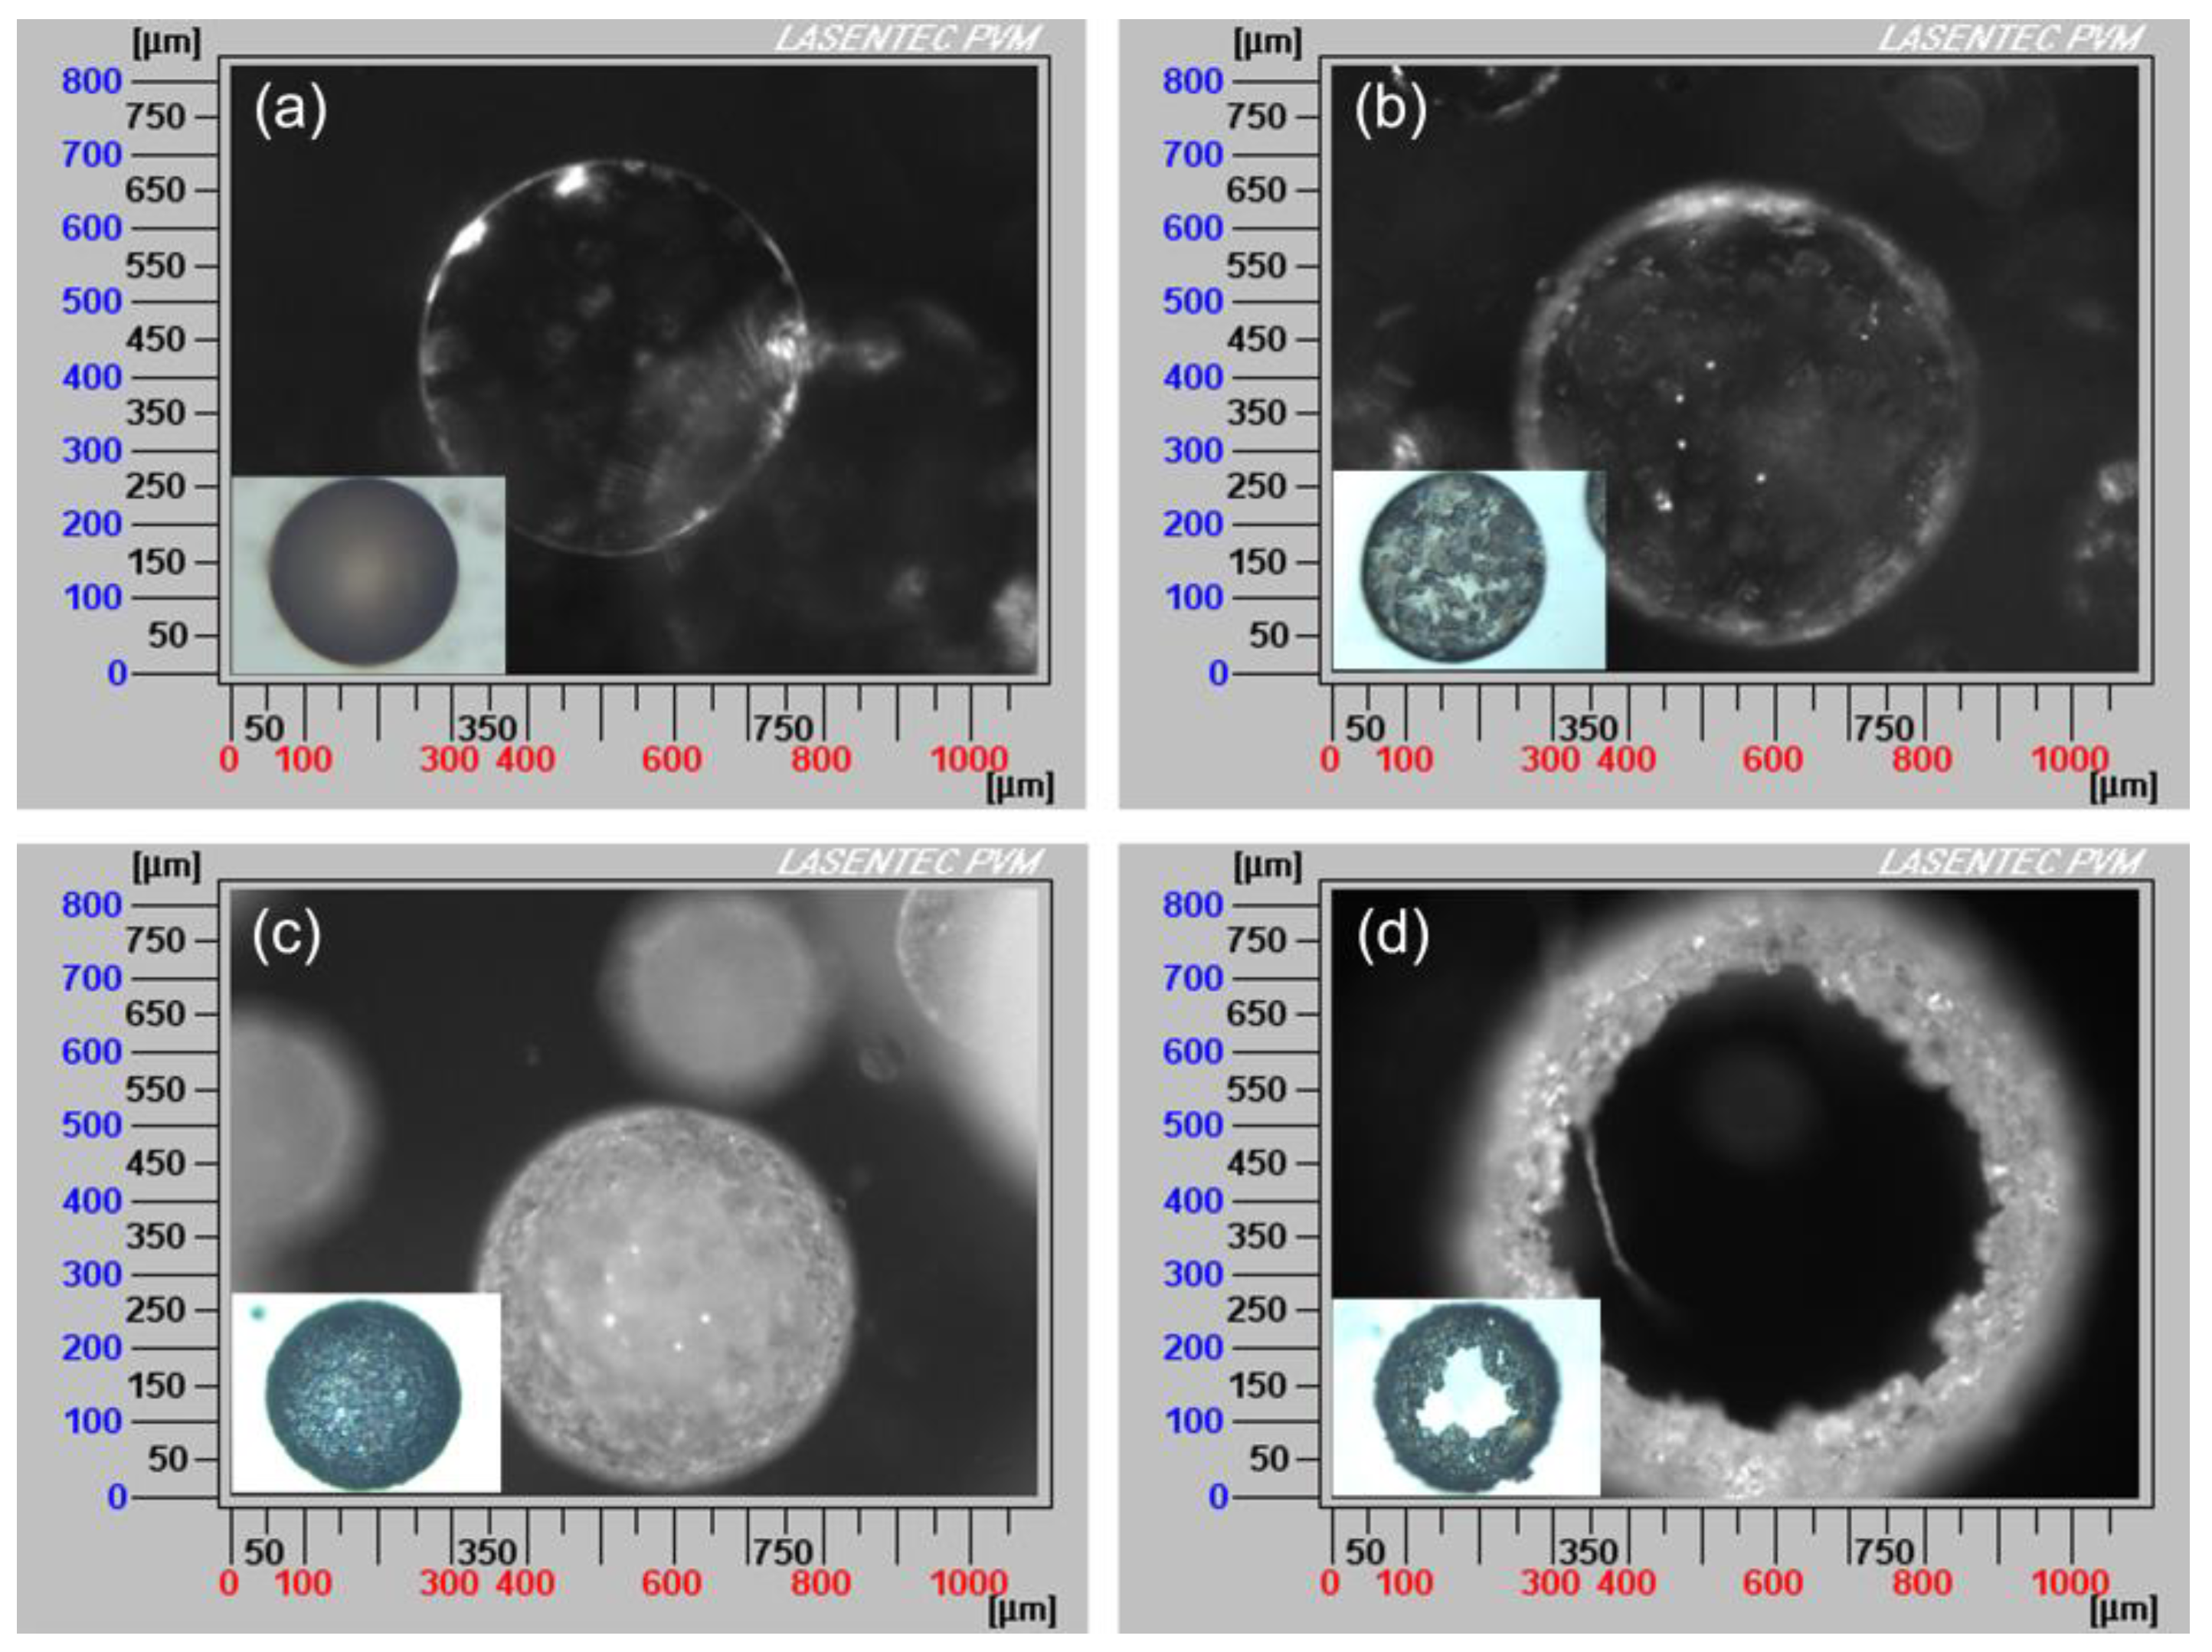
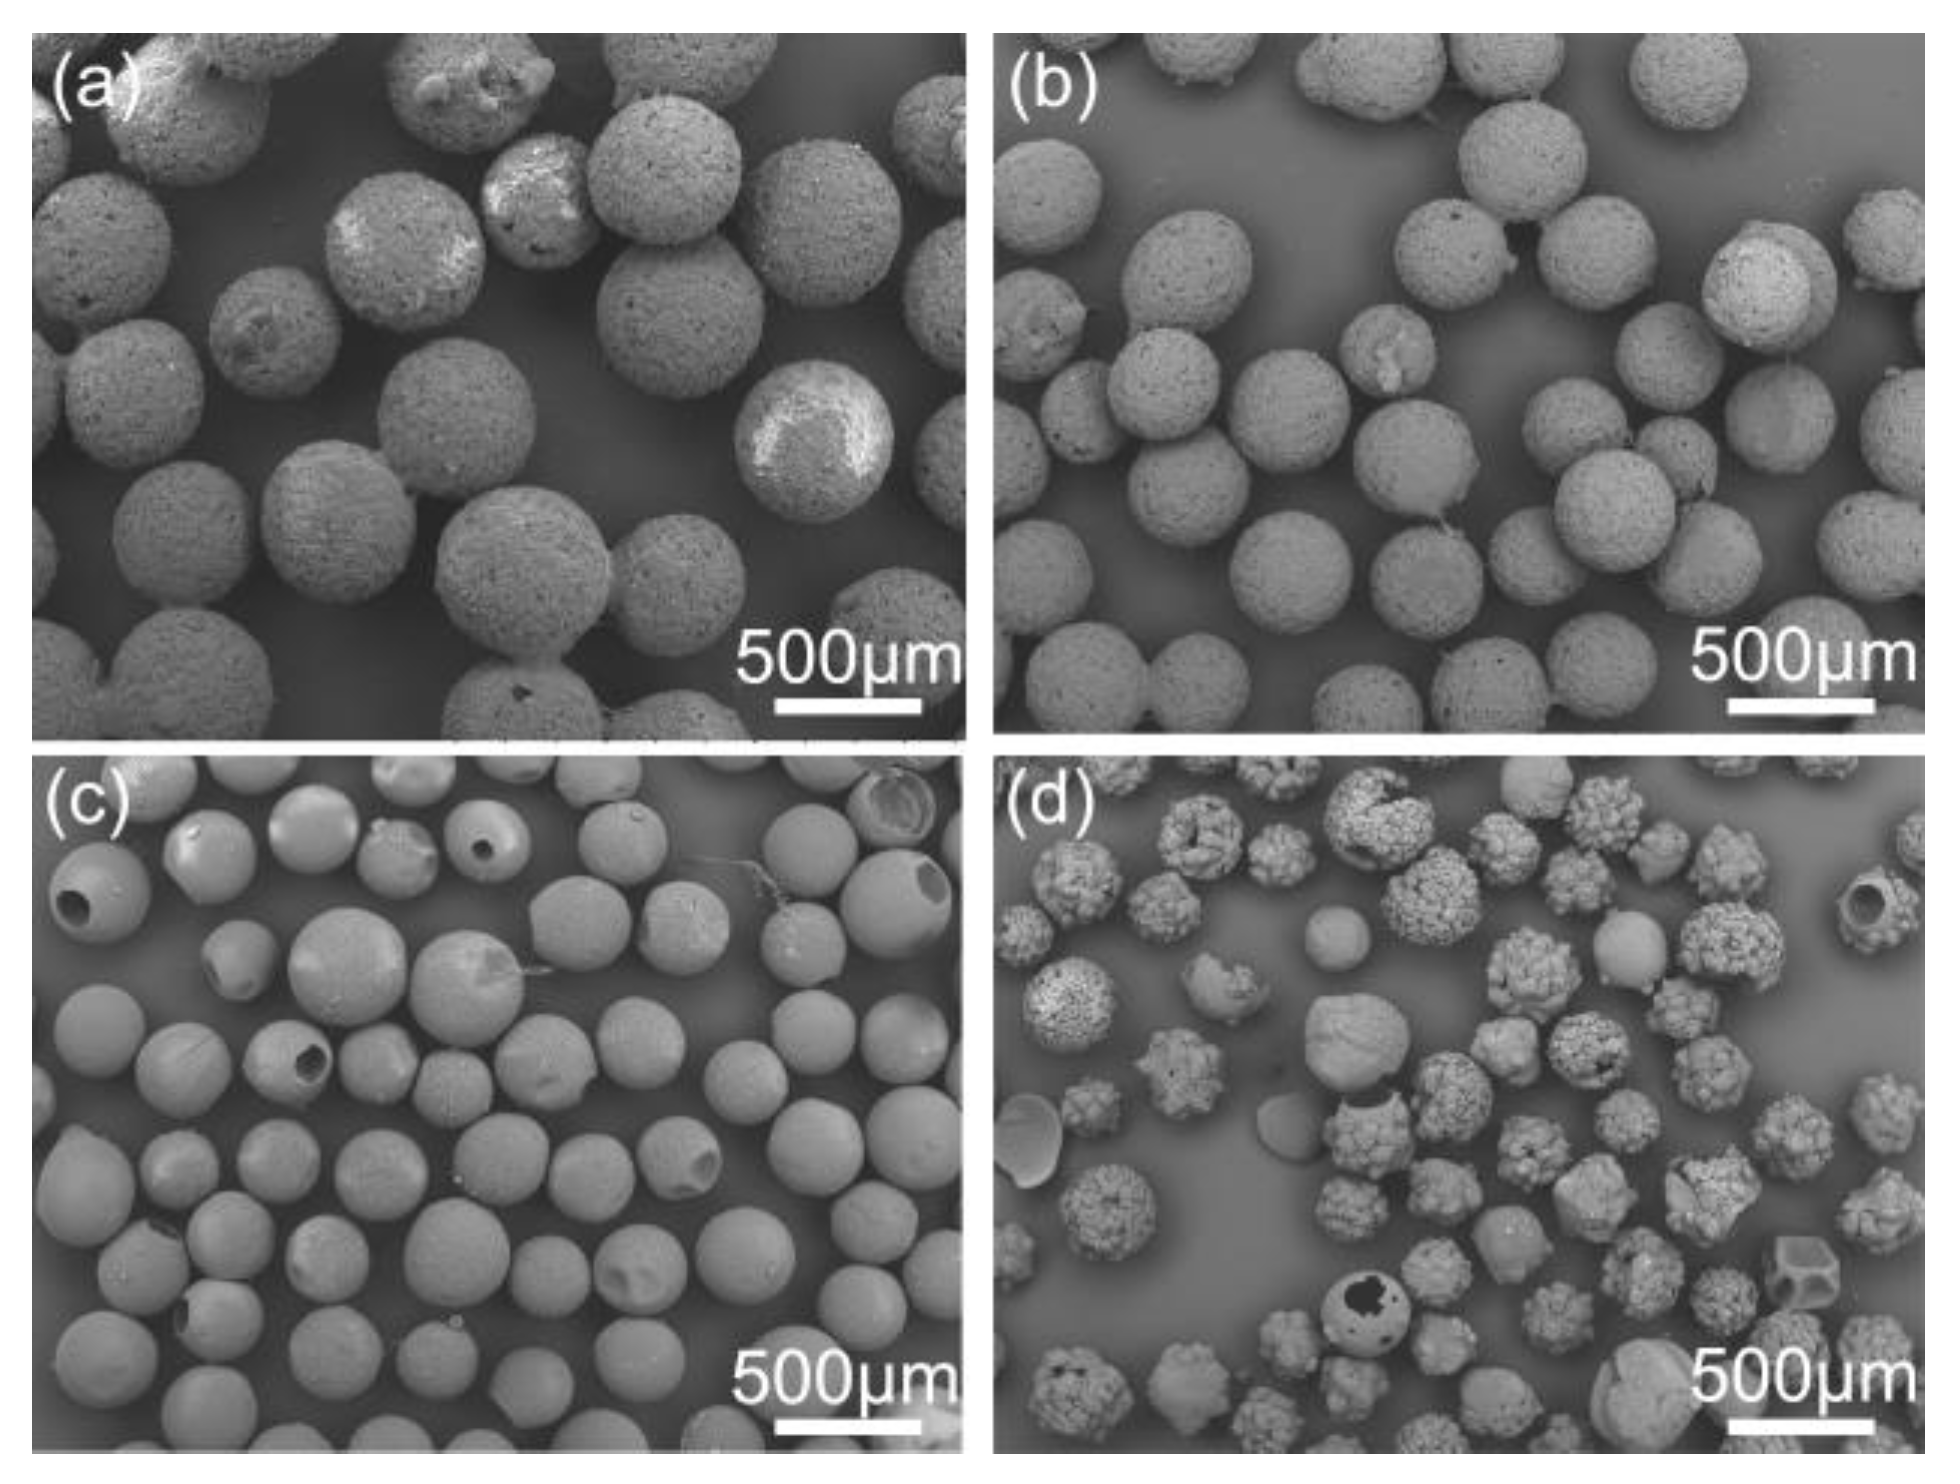
3.2.2. QESD Process
3.3. Effect of Process Parameters on Spherical Crystallization Processes
3.3.1. Effect of Crystallization Parameters on SA Process
3.3.2. Effect of Crystallization Parameters on QESD Process
3.4. Evaluation of Spherical Crystal Properties
3.4.1. Flowability
3.4.2. Packability
3.4.3. Determination of the Residual Solvents
3.5. Evaluation of Tablet Properties
4. Conclusions
Supplementary Materials
Author Contributions
Funding
Conflicts of Interest
References
- Ferguson, S.; Ortner, F.; Quon, J.; Peeva, L.; Livingston, A.; Trout, B.L.; Myerson, A.S. Use of Continuous MSMPR Crystallization with Integrated Nanofiltration Membrane Recycle for Enhanced Yield and Purity in API Crystallization. Cryst. Growth Des. 2014, 14, 617–627. [Google Scholar] [CrossRef]
- Jung, J.-W.; Kim, K.-J. Effect of Supersaturation on the Morphology of Coated Surface in Coating by Solution Crystallization. Ind. Eng. Chem. Res. 2011, 50, 3475–3482. [Google Scholar] [CrossRef]
- Barrett, M.; McNamara, M.; Hao, H.; Barrett, P.; Glennon, B. Supersaturation tracking for the development, optimization and control of crystallization processes. Chem. Eng. Res. Des. 2010, 88, 1108–1119. [Google Scholar] [CrossRef]
- Lu, J.; Rohani, S. Polymorphism and Crystallization of Active Pharmaceutical Ingredients (APIs). Curr. Med. Chem. 2009, 16, 884–905. [Google Scholar] [CrossRef] [PubMed]
- Huang, Y.; Jiang, Y.; Yang, X.; Ren, Y.; Zhan, D.; Cölfen, H.; Hou, Z.; Liu, X.Y. Direct Growth of Microspheres on Amorphous Precursor Domains in Polymer-Controlled Crystallization of Indomethacin. Cryst. Growth Des. 2016, 16, 1428–1434. [Google Scholar] [CrossRef]
- Yazdanpanah, N.; Langrish, T.A.G. Crystallization and Drying of Milk Powder in a Multiple-Stage Fluidized Bed Dryer. Drying Technol. 2011, 29, 1046–1057. [Google Scholar] [CrossRef]
- Barrett, M.; Hao, H.; Maher, A.; Hodnett, K.; Glennon, B.; Croker, D. In Situ Monitoring of Supersaturation and Polymorphic Form of Piracetam during Batch Cooling Crystallization. Org. Process Res. Dev. 2011, 15, 681–687. [Google Scholar] [CrossRef]
- Gyulai, O.; Szabó-Révész, P.; Aigner, Z. Comparison Study of Different Spherical Crystallization Methods of Ambroxol Hydrochloride. Cryst. Growth Des. 2017, 17, 5233–5241. [Google Scholar] [CrossRef]
- Chattoraj, S.; Sun, C.C. Crystal and Particle Engineering Strategies for Improving Powder Compression and Flow Properties to Enable Continuous Tablet Manufacturing by Direct Compression. J. Pharm. Sci. 2018, 107, 968–974. [Google Scholar] [CrossRef]
- Jivraj, M.; Martini, L.G.; Thomson, C.M. An overview of the different excipients useful for the direct compression of tablets. Pharm. Sci. Technol. Today 2000, 3, 58–63. [Google Scholar] [CrossRef]
- Chen, H.; Wang, C.; Sun, C.C. Profoundly Improved Plasticity and Tabletability of Griseofulvin by in Situ Solvation and Desolvation during Spherical Crystallization. Cryst. Growth Des. 2019, 19, 2350–2357. [Google Scholar] [CrossRef]
- Kawashima, Y.; Okumura, M.; Takenaka, H. Spherical Crystallization: Direct Spherical Agglomeration of Salicylic Acid Crystals During Crystallization. Science 1982, 216, 1127. [Google Scholar] [CrossRef]
- Chatterjee, A.; Gupta, M.M.; Srivastava, B. Spherical crystallization: A technique use to reform solubility and flow property of active pharmaceutical ingredients. Int. J. Pharm. Investig. 2017, 7, 4–9. [Google Scholar]
- Zhang, Z.-B.; Shen, Z.-G.; Wang, J.-X.; Zhang, H.-X.; Zhao, H.; Chen, J.-F.; Yun, J. Micronization of silybin by the emulsion solvent diffusion method. Int. J. Pharm. 2009, 376, 116–122. [Google Scholar] [CrossRef]
- Zhang, D.; Tan, T.; Gao, L.; Zhao, W.; Wang, P. Preparation of Azithromycin Nanosuspensions by High Pressure Homogenization and its Physicochemical Characteristics Studies. Drug Dev. Ind. Pharm. 2007, 33, 569–575. [Google Scholar] [CrossRef] [PubMed]
- Mohammadi, G.; Valizadeh, H.; Barzegar-Jalali, M.; Lotfipour, F.; Adibkia, K.; Milani, M.; Azhdarzadeh, M.; Kiafar, F.; Nokhodchi, A. Development of azithromycin–PLGA nanoparticles: Physicochemical characterization and antibacterial effect against Salmonella typhi. Colloids Surf. B 2010, 80, 34–39. [Google Scholar] [CrossRef]
- Adeli, E. The use of spray freeze drying for dissolution and oral bioavailability improvement of Azithromycin. Powder Technol. 2017, 319, 323–331. [Google Scholar] [CrossRef]
- Peña, R.; Jarmer, D.J.; Burcham, C.L.; Nagy, Z.K. Further Understanding of Agglomeration Mechanisms in Spherical Crystallization Systems: Benzoic Acid Case Study. Cryst. Growth Des. 2019, 19, 1668–1679. [Google Scholar] [CrossRef]
- Mukhopadhyay, I.; Mohandas, V.P.; Desale, G.R.; Chaudhary, A.; Ghosh, P.K. Crystallization of Spherical Common Salt in the Submillimeter Size Range without Habit Modifier. Ind. Eng. Chem. Res. 2010, 49, 12197–12203. [Google Scholar] [CrossRef]
- Jitkar, S.; Thipparaboina, R.; Chavan, R.B.; Shastri, N.R. Spherical Agglomeration of Platy Crystals: Curious Case of Etodolac. Cryst. Growth Des. 2016, 16, 4034–4042. [Google Scholar] [CrossRef]
- Wu, H.; Wang, J.; Xiao, Y.; Huang, X.; Guo, Y.; Zong, S.; Liu, Q.; Hao, Y.; Hao, H. Manipulation of Crystal Morphology of Zoxamide Based on Phase Diagram and Crystal Structure Analysis. Cryst. Growth Des. 2018, 18, 5790–5799. [Google Scholar] [CrossRef]
- Lamešić, D.; Planinšek, O.; Lavrič, Z.; Ilić, I. Spherical agglomerates of lactose with enhanced mechanical properties. Int. J. Pharm. 2017, 516, 247–257. [Google Scholar] [CrossRef] [PubMed]
- Maghsoodi, M.; Esfahani, M. Preparation of microparticles of naproxen with Eudragit RS and Talc by spherical crystallization technique. Pharm. Dev. Technol. 2009, 14, 442–450. [Google Scholar] [CrossRef] [PubMed]
- Nokhodchi, A.; Maghsoodi, M.; Hassanzadeh, D. An Improvement of Physicomechanical Properties of Carbamazepine Crystals. Iran. J. Pharm. Res. 2010, 6, 83–93. [Google Scholar]
- Curatolo, W.; Liu, P.; Johnson, B.A.; Hausberger, A.; Quan, E.; Vendola, T.; Vatsaraj, N.; Foulds, G.; Vincent, J.; Chandra, R. Effects of Food on a Gastrically Degraded Drug: Azithromycin Fast-Dissolving Gelatin Capsules and HPMC Capsules. Pharm. Res. 2011, 28, 1531–1539. [Google Scholar] [CrossRef]
- Adeli, E. A comparative evaluation between utilizing SAS supercritical fluid technique and solvent evaporation method in preparation of Azithromycin solid dispersions for dissolution rate enhancement. J. Supercrit. Fluids 2014, 87, 9–21. [Google Scholar] [CrossRef]
- Wu, S.; Shen, H.; Li, K.; Yu, B.; Xu, S.; Chen, M.; Gong, J.; Hou, B.H. Agglomeration Mechanism of Azithromycin Dihydrate in Acetone–Water Mixtures and Optimization of the Powder Properties. Ind. Eng. Chem. Res. 2016, 55, 4905–4910. [Google Scholar] [CrossRef]
- Schæfer, T.; Mathiesen, C. Melt pelletization in a high shear mixer. IX. Effects of binder particle size. Int. J. Pharm. 1996, 139, 139–148. [Google Scholar] [CrossRef]
- Pitt, K.; Peña, R.; Tew, J.D.; Pal, K.; Smith, R.; Nagy, Z.K.; Litster, J.D. Particle design via spherical agglomeration: A critical review of controlling parameters, rate processes and modelling. Powder Technol. 2018, 326, 327–343. [Google Scholar] [CrossRef]
- Jiang, Y.; Gower, L.; Volkmer, D.; Cölfen, H. Hierarchical DL-Glutamic Acid Microspheres from Polymer-Induced Liquid Precursors. Cryst. Growth Des. 2011, 11, 3243–3249. [Google Scholar] [CrossRef]
- Peña, R.; Nagy, Z.K. Process Intensification through Continuous Spherical Crystallization Using a Two-Stage Mixed Suspension Mixed Product Removal (MSMPR) System. Cryst. Growth Des. 2015, 15, 4225–4236. [Google Scholar] [CrossRef]
- Cui, F.; Yang, M.; Jiang, Y.; Cun, D.; Lin, W.; Fan, Y.; Kawashima, Y. Design of sustained-release nitrendipine microspheres having solid dispersion structure by quasi-emulsion solvent diffusion method. J. Control. Release 2003, 91, 375–384. [Google Scholar] [CrossRef]
- Kawashima, Y.; Capes, C.E. Further studies of the kinetics of spherical agglomeration in a stirred vessel. Powder Technol. 1976, 13, 279–288. [Google Scholar] [CrossRef]
- Thakur, A.; Thipparaboina, R.; Kumar, D.; Sai Gouthami, K.; Shastri, N.R. Crystal engineered albendazole with improved dissolution and material attributes. Cryst. Eng. Comm. 2016, 18, 1489–1494. [Google Scholar] [CrossRef]
- Nokhodchi, A.; Maghsoodi, M.; Hassan-Zadeh, D.; Barzegar-Jalali, M. Preparation of agglomerated crystals for improving flowability and compactibility of poorly flowable and compactible drugs and excipients. Powder Technol. 2007, 175, 73–81. [Google Scholar] [CrossRef]


| Product Type | Angle of Reponse (deg) | CI | HR | Mean Size (mm) |
|---|---|---|---|---|
| Commercial product | 42.7 | 19.5 | 1.19 | 0.473 |
| SA product | 19.5 | 6.67 | 1.07 | 0.481 |
| QESD product | 24.2 | 7.14 | 1.08 | 0.478 |
| Product Type | a | b | R2 |
|---|---|---|---|
| Commercial product | 0.3731 | 0.0427 | 0.9978 |
| SA product | 0.2635 | 0.0388 | 0.9981 |
| QESD product | 0.3268 | 0.0369 | 0.9985 |
| Product Type | Azithromycin Purity, wt% | Residual Solvent, wt% | |||
|---|---|---|---|---|---|
| Water | Acetone | Ethyl Acetate | Tween80 | ||
| Commercial product | 95.05 | 4.73 | 0.12 | - | - |
| SA product | 94.95 | 4.81 | 0.18 | 0.13 | - |
| QESD product | 94.81 | 4.92 | - | 0.17 | 0.008 |
| Tablet Properties | Commercial Product | SA Product | QESD Product |
|---|---|---|---|
| Hardness (N) a | 70.0 ± 0.26 | 85.0 ± 0.38 | 82.0 ± 0.32 |
| Friability (%) a | 1.35 ± 0.56 | 0.78 ± 0.41 | 0.83 ± 0.45 |
| Content uniformity (%) a | 96.6 ± 4.1 | 99.8 ± 1.31 | 99.2 ± 1.56 |
| Tablet weight (mg) a | 489 ± 2.31 | 498 ± 1.27 | 496 ± 1.69 |
| Disintegration time (Min) a | 8.23 ± 1.15 | 7.36 ± 0.86 | 6.79 ± 1.72 |
© 2019 by the authors. Licensee MDPI, Basel, Switzerland. This article is an open access article distributed under the terms and conditions of the Creative Commons Attribution (CC BY) license (http://creativecommons.org/licenses/by/4.0/).
Share and Cite
Chen, K.; Hou, B.; Wu, H.; Huang, X.; Li, F.; Xiao, Y.; Li, J.; Bao, Y.; Hao, H. Hollow and Solid Spherical Azithromycin Particles Prepared by Different Spherical Crystallization Technologies for Direct Tableting. Processes 2019, 7, 276. https://doi.org/10.3390/pr7050276
Chen K, Hou B, Wu H, Huang X, Li F, Xiao Y, Li J, Bao Y, Hao H. Hollow and Solid Spherical Azithromycin Particles Prepared by Different Spherical Crystallization Technologies for Direct Tableting. Processes. 2019; 7(5):276. https://doi.org/10.3390/pr7050276
Chicago/Turabian StyleChen, Kui, Baohong Hou, Hao Wu, Xin Huang, Fei Li, Yan Xiao, Jing Li, Ying Bao, and Hongxun Hao. 2019. "Hollow and Solid Spherical Azithromycin Particles Prepared by Different Spherical Crystallization Technologies for Direct Tableting" Processes 7, no. 5: 276. https://doi.org/10.3390/pr7050276
APA StyleChen, K., Hou, B., Wu, H., Huang, X., Li, F., Xiao, Y., Li, J., Bao, Y., & Hao, H. (2019). Hollow and Solid Spherical Azithromycin Particles Prepared by Different Spherical Crystallization Technologies for Direct Tableting. Processes, 7(5), 276. https://doi.org/10.3390/pr7050276