Article

Numerical and Experimental Investigation of External Characteristics and Pressure Fluctuation of a Submersible Tubular Pumping System

1
College of Hydraulic Science and Engineering, Yangzhou University, Yangzhou 225009, China
2
School of Electric Power, North China University of Water Resources and Electric Power, Zhengzhou 450045, China
3
Jiangsu Surveying and Design Institute of Water Resources Co., Ltd., Yangzhou 225009, China
*
Author to whom correspondence should be addressed.
Processes 2019, 7(12), 949; https://doi.org/10.3390/pr7120949
Submission received: 31 October 2019 / Revised: 6 December 2019 / Accepted: 9 December 2019 / Published: 12 December 2019
(This article belongs to the Special Issue Smart Flow Control Processes in Micro Scale)

Abstract

:
This paper presents an investigation of external flow characteristics and pressure fluctuation of a submersible tubular pumping system by using a combination of numerical simulation and experimental methods. The steady numerical simulation is used to predicted the hydraulic performance of the pumping system, and the unsteady calculation is adopted to simulate the pressure fluctuation in different components of a submersible tubular pumping system. A test bench for a model test and pressure pulsation measurement is built to validate the numerical simulation. The results show that the performance curves of the calculation and experiment are in agreement with each other, especially in the high efficiency area, and the deviation is minor under small discharge and large discharge conditions. The pressure pulsation distributions of different flow components, such as the impeller outlet, middle of the guide vane, and guide vane outlet and bulb unit, are basically the same as the measurement data. For the monitoring points on the impeller and the wall of the guide vane especially, the main frequency and its amplitude matching degree are higher, while the pressure pulsation values on the wall of the bulb unit are quite different. The blade passing frequency and its multiples are important parameters for analysis of pressure pulsation; the strongest pressure fluctuation intensity appears in the impeller outlet, which is mainly caused by the rotor–stator interaction. The farther the measuring point from the impeller, the less the pressure pulsation is affected by the blade frequency. The frequency amplitudes decrease from the impeller exit to the bulb unit.

1. Introduction

A submersible tubular pump is a kind of horizontal pump with a low head and large discharge, which uses a postpositive tubular-type structure with a motor and pump coaxial. It has the advantages of low cost, high efficiency, and easy-to-realize automatic or semi-automatic control [1,2]. In recent years, this type of pump has been widely used in small and medium-sized pumping stations, such as in agricultural irrigation and urban flood control, especially in the plain areas [3,4,5]. All pumps experience pressure pulsation due to changes, discontinuities, and variations that occur in their pumping or pressure generating action, and submersible tubular pumps are no exception. The pressure pulsation and unstable flow in the vane pump is mainly caused by the rotor–stator interaction between the impeller and the guide vane. These pulsations can sometimes be very severe and cause damage to the piping or other components in a pumping system, which may give rise to vibration [6,7,8,9], generate hydraulic noise [10,11,12], and affect the performance of the pumping system, thus affecting the stable operation of the pumping system. Therefore, the distribution of pressure pulsations in the pump needs to be studied to ensure the safe, efficient, and stable operation of the pumping station.
With the development of computational fluid dynamics (CFD) technology, more scholars are using CFD to study complex flow fields in pumps [13,14,15], but the results of numerical simulation need to be verified by experimental data. Therefore, combining numerical simulation and experiments is more reliable. To ensure the safe and stable operation of pumping stations, many researchers are paying attention to the pressure pulsation and the unsteady flow inside the centrifugal pumps [16,17,18,19,20,21,22,23] and axial-flow pumps [24,25,26,27,28,29]. Studies on tubular pumps are relatively rare. Yang et al. [30] studied the pressure fluctuation of an S-shaped shaft extension tubular pumping system by CFD and experimentation, where the pressure fluctuations at 21 measurement locations in inlet and outlet passages were obtained and analyzed in time and frequency domains for three typical working conditions of different flow rates. Zhang et al. [31] investigated the three-dimensional turbulent flow and the pressure fluctuation in a submersible axial-flow pump by adopting the RNG (Renormalization Group) k-ε turbulence model and the SIMPLEC (Semi-Implicit Method for Pressure-Linked Equation) algorithm, with which the pressure pulsation distribution of the impeller inlet and outlet was obtained.
In this paper, an experimental system for model and pressure pulsation tests is built to validate the numerical simulation results using six transient pressure sensors in different sections of the pump. Unsteady numerical simulations are used to reveal the complex flow fluctuations, and the fast Fourier transform (FFT) method is used to obtain the amplitudes of pressure fluctuations. The results can provide references for further analysis of the pressure fluctuation of submersible tubular pumps, and ensure the safe and stable operation of submersible tubular pump stations.

2. Numerical Simulation
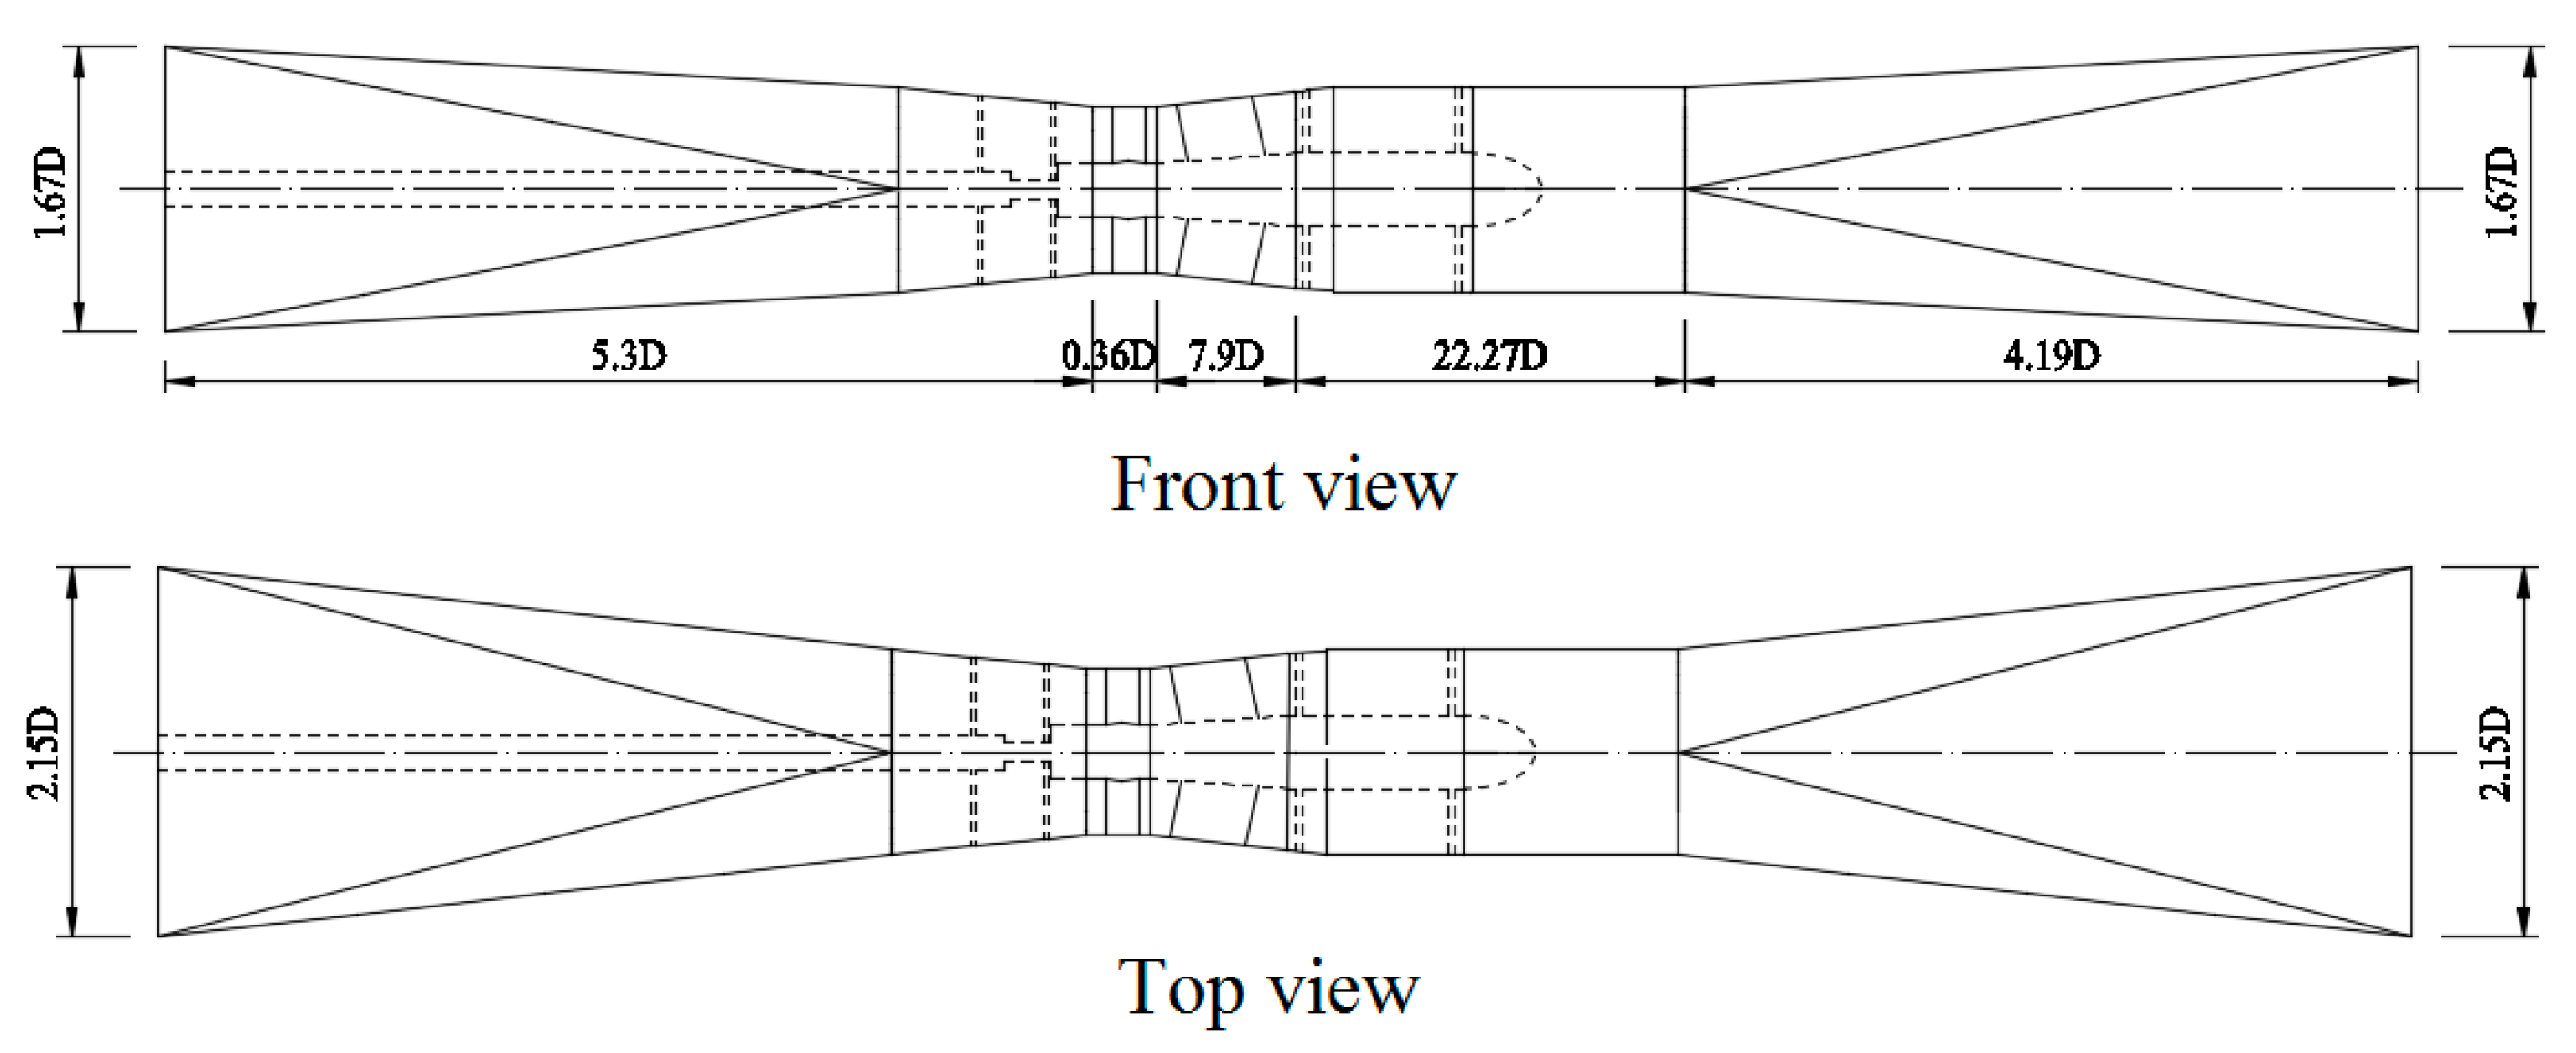
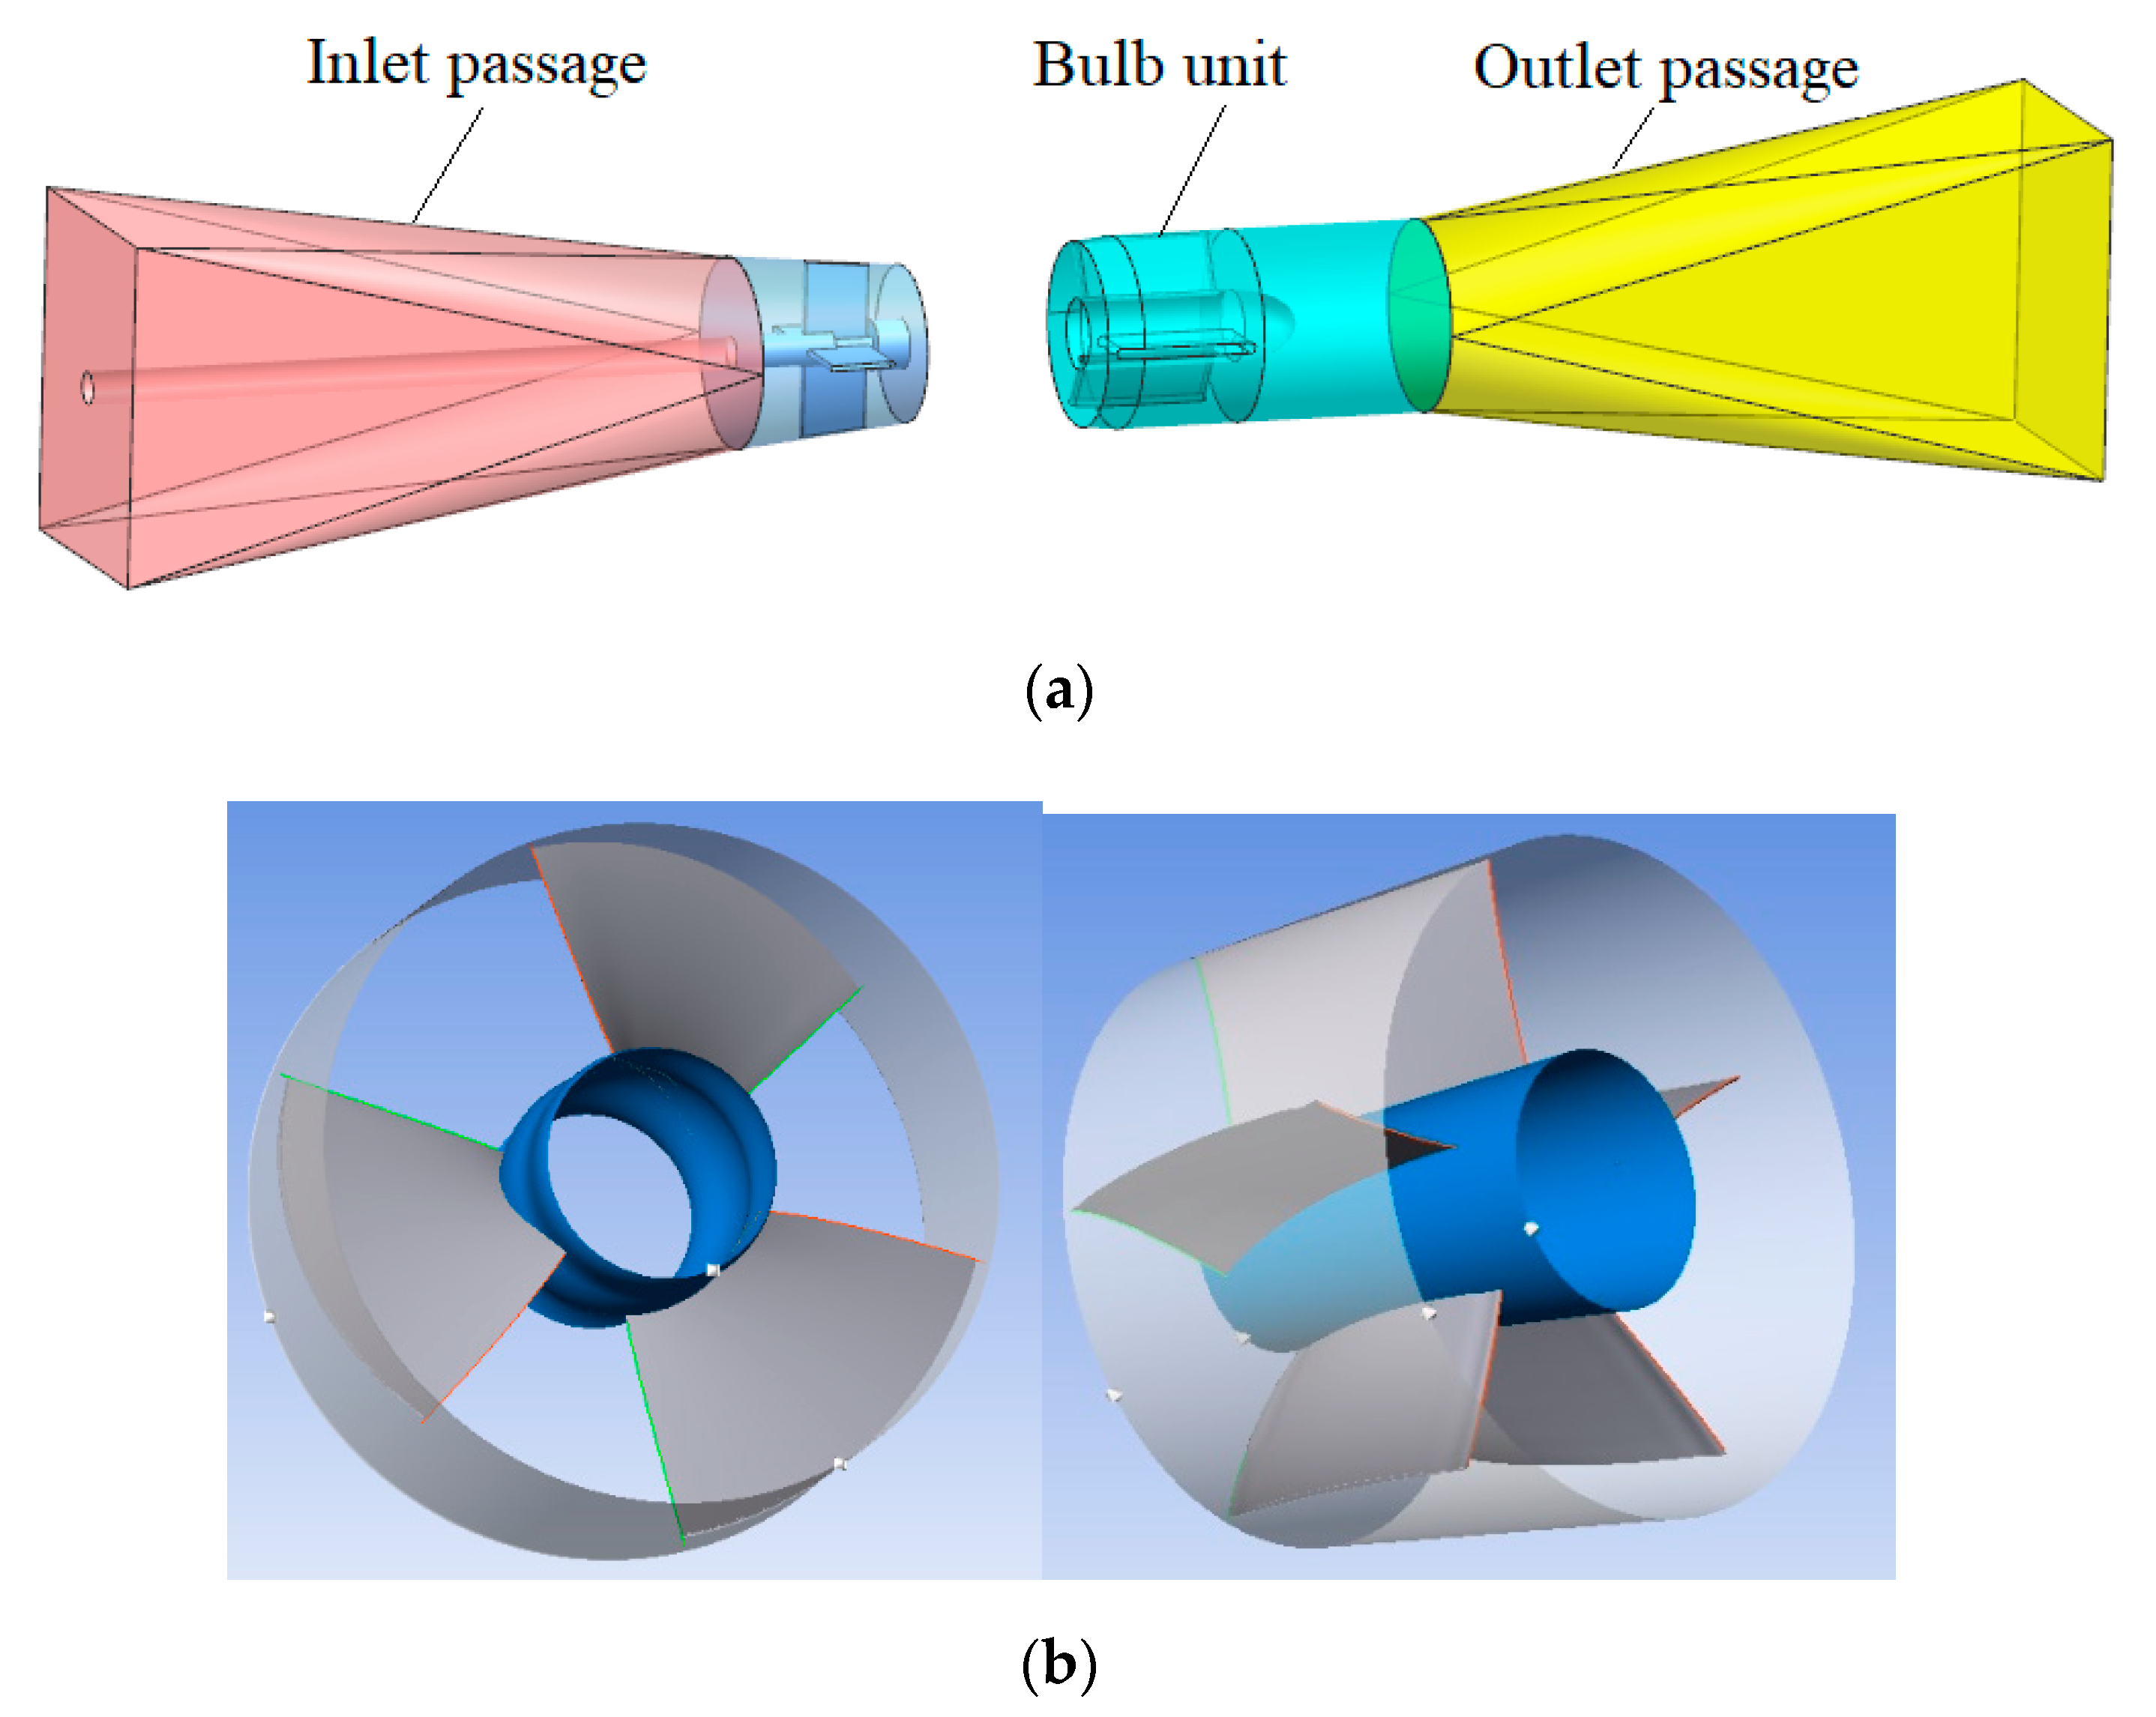
2.1. Pump Geometry

The simulated object is a submersible turbine pump device. Figure 1 shows a single-line diagram of the pump used in the numerical simulation and experiment, including the inlet passage, impeller, guide vane, bulb unit, and outlet passage. The dimensions given in the figure are values relative to the diameter D of the impeller. The main geometric parameters of the pump device are shown in Table 1.

2.2. Pump Modeling

The numerical simulation study in this paper is for the entire submersible tubular pump device, in which the inlet passage, the outlet passage, and the bulb unit are modeled by Unigraphics NX (11.0, Siemens PLM Software, Shanghai, China, 2016) for 3-D solid modeling, as shown in Figure 2a. The impeller and guide vane components are generated automatically in the TurboGrid software (14.5, ANSYS Inc., Pittsburgh, PA, USA, 2013); as shown in Figure 2b, the distance between the blade tip and the impeller chamber is set to 0.2 mm.

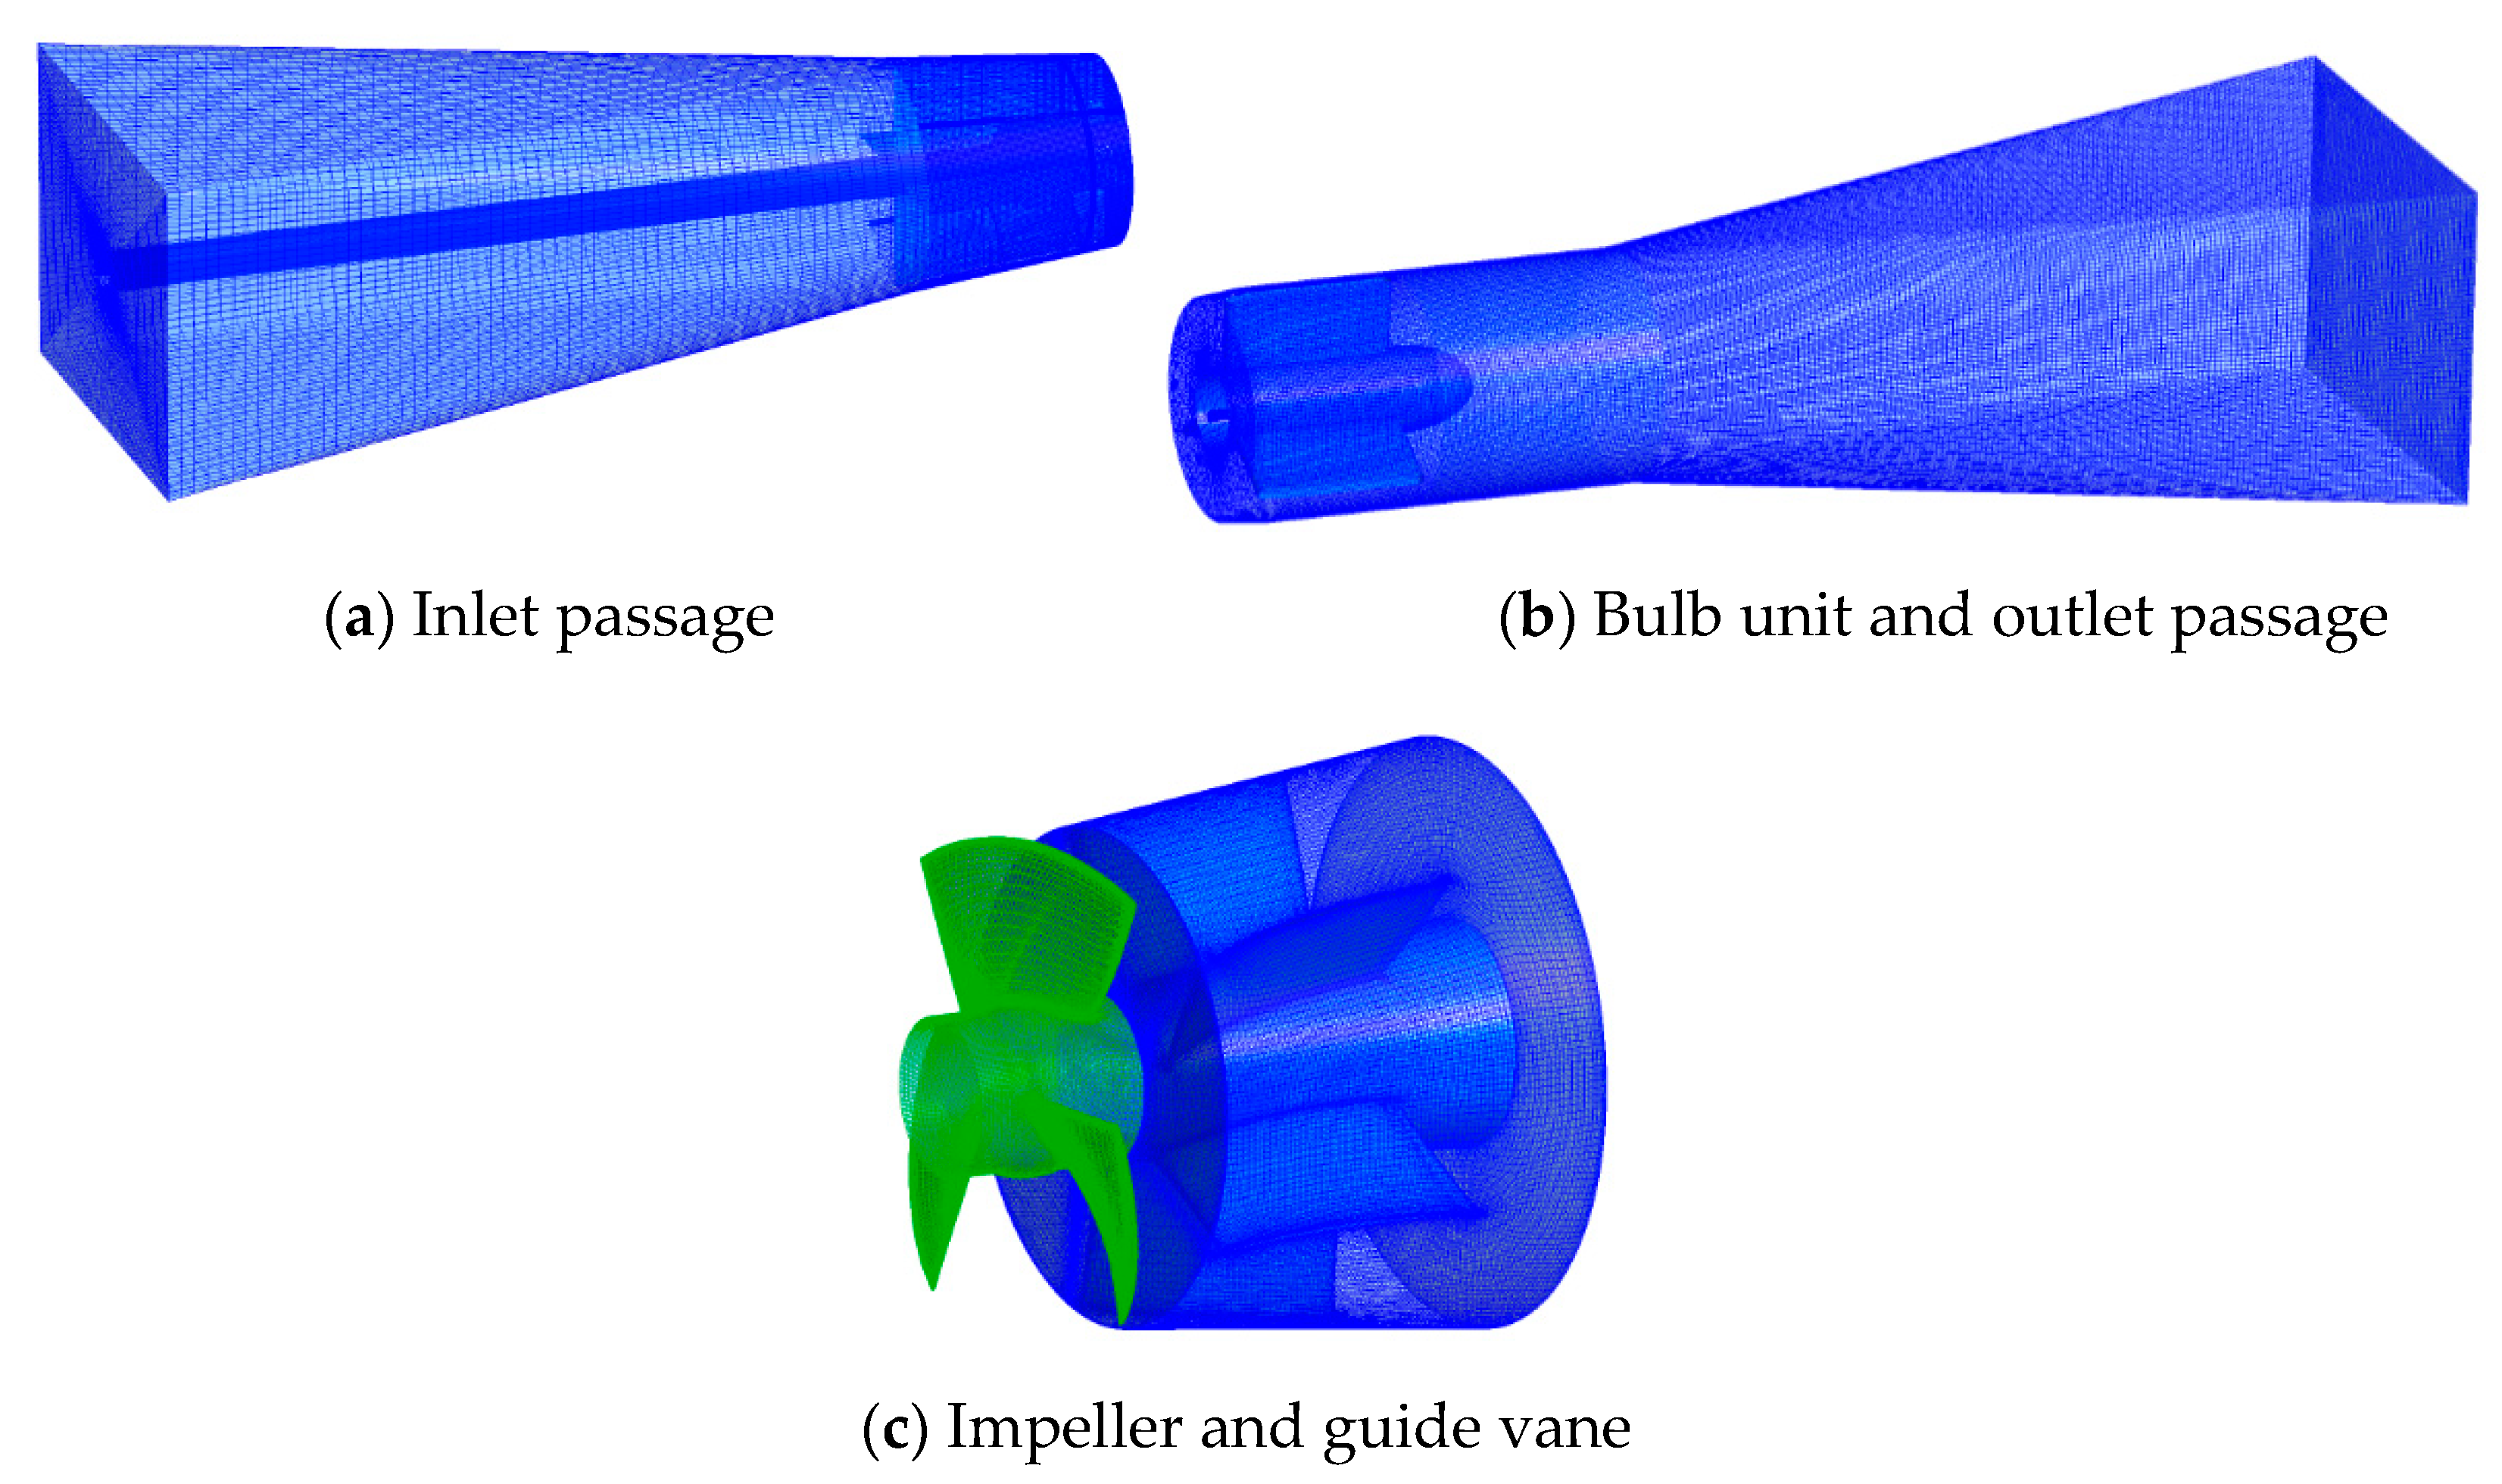
2.3. Numerical Model and Grid Generation

The numerical simulation of this paper adopts the current common commercial CFD software ANSYS CFX-14.5 (14.5, ANSYS Inc., Pittsburgh, PA, USA, 2013), which performs the steady and unsteady calculations for the submerged tubular pump devices under different working conditions. The three-dimensional Reynolds-averaged Navier–Stokes equations were solved by CFX code. The turbulence effects were modeled by the standard k-ε turbulence model. The pressure–velocity coupling was performed using the SIMPLEC algorithm. The criterion for convergence was considered to be 10−4, allowing an optimal number of iterations for each time step.
In this calculation, structured hexahedral cells were used to define the computational domain. The grids of the inlet passage, bulb unit, and outlet passage were generated by ICEM-CFD (14.5, ANSYS Inc., Pittsburgh, PA, USA, 2013), while the grids of the impeller and guide vane were generated by TurboGrid (14.5, ANSYS Inc., Pittsburgh, PA, USA, 2013). In order to ensure the grid quality, the grid independence calculation was carried out, and the total grid number was about 4.19 × 10⁶. Figure 3 shows the grid details for each component of the pumping system.
The boundary conditions were set as follows: the inlet pressure was specified at the entrance of the inlet passage. The inlet adopts the total pressure and the pressure is set to 1 for the atmosphere. The mass outflow condition was defined at the exit of the outlet passage. The transient rotor–stator model was used for the unsteady calculation. The shroud of the impeller was set as absolutely stationary, and the blade and hub of the impeller were relatively stationary. No slip boundary conditions or wall functions were used for the solid walls.
In this paper, the result of the steady calculation was taken as the initial flow field of the unsteady calculation, and then the unsteady numerical simulation was carried out using the sliding mesh technique. The time step of the unsteady calculations was Δt = 3.4483 × 10⁻⁴ s. The impeller rotated 3° at each time step, so it took 120 steps to complete the rotation. The chosen time step was small enough to get the necessary time resolution.

3. Experiment System
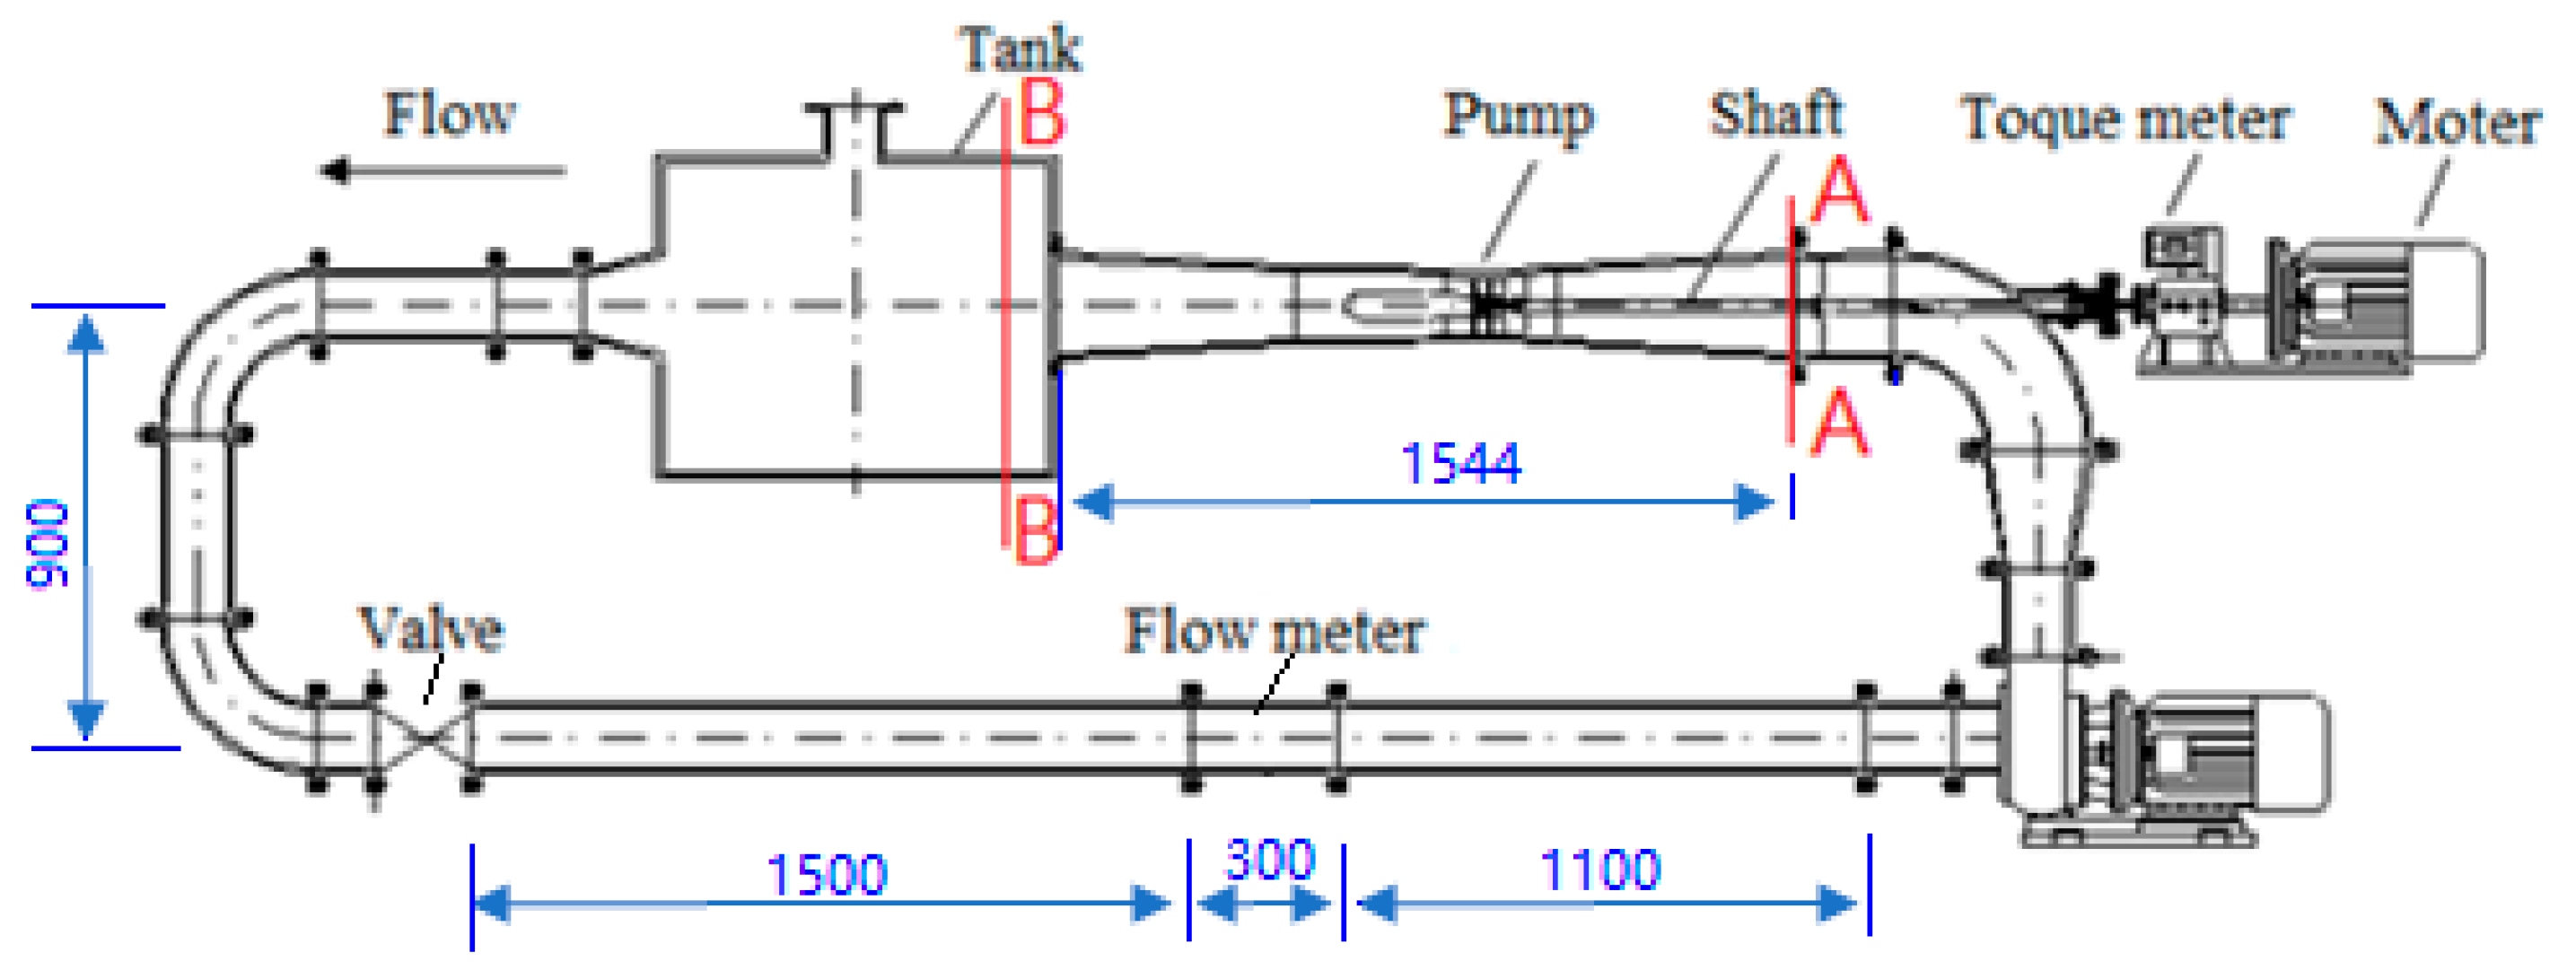
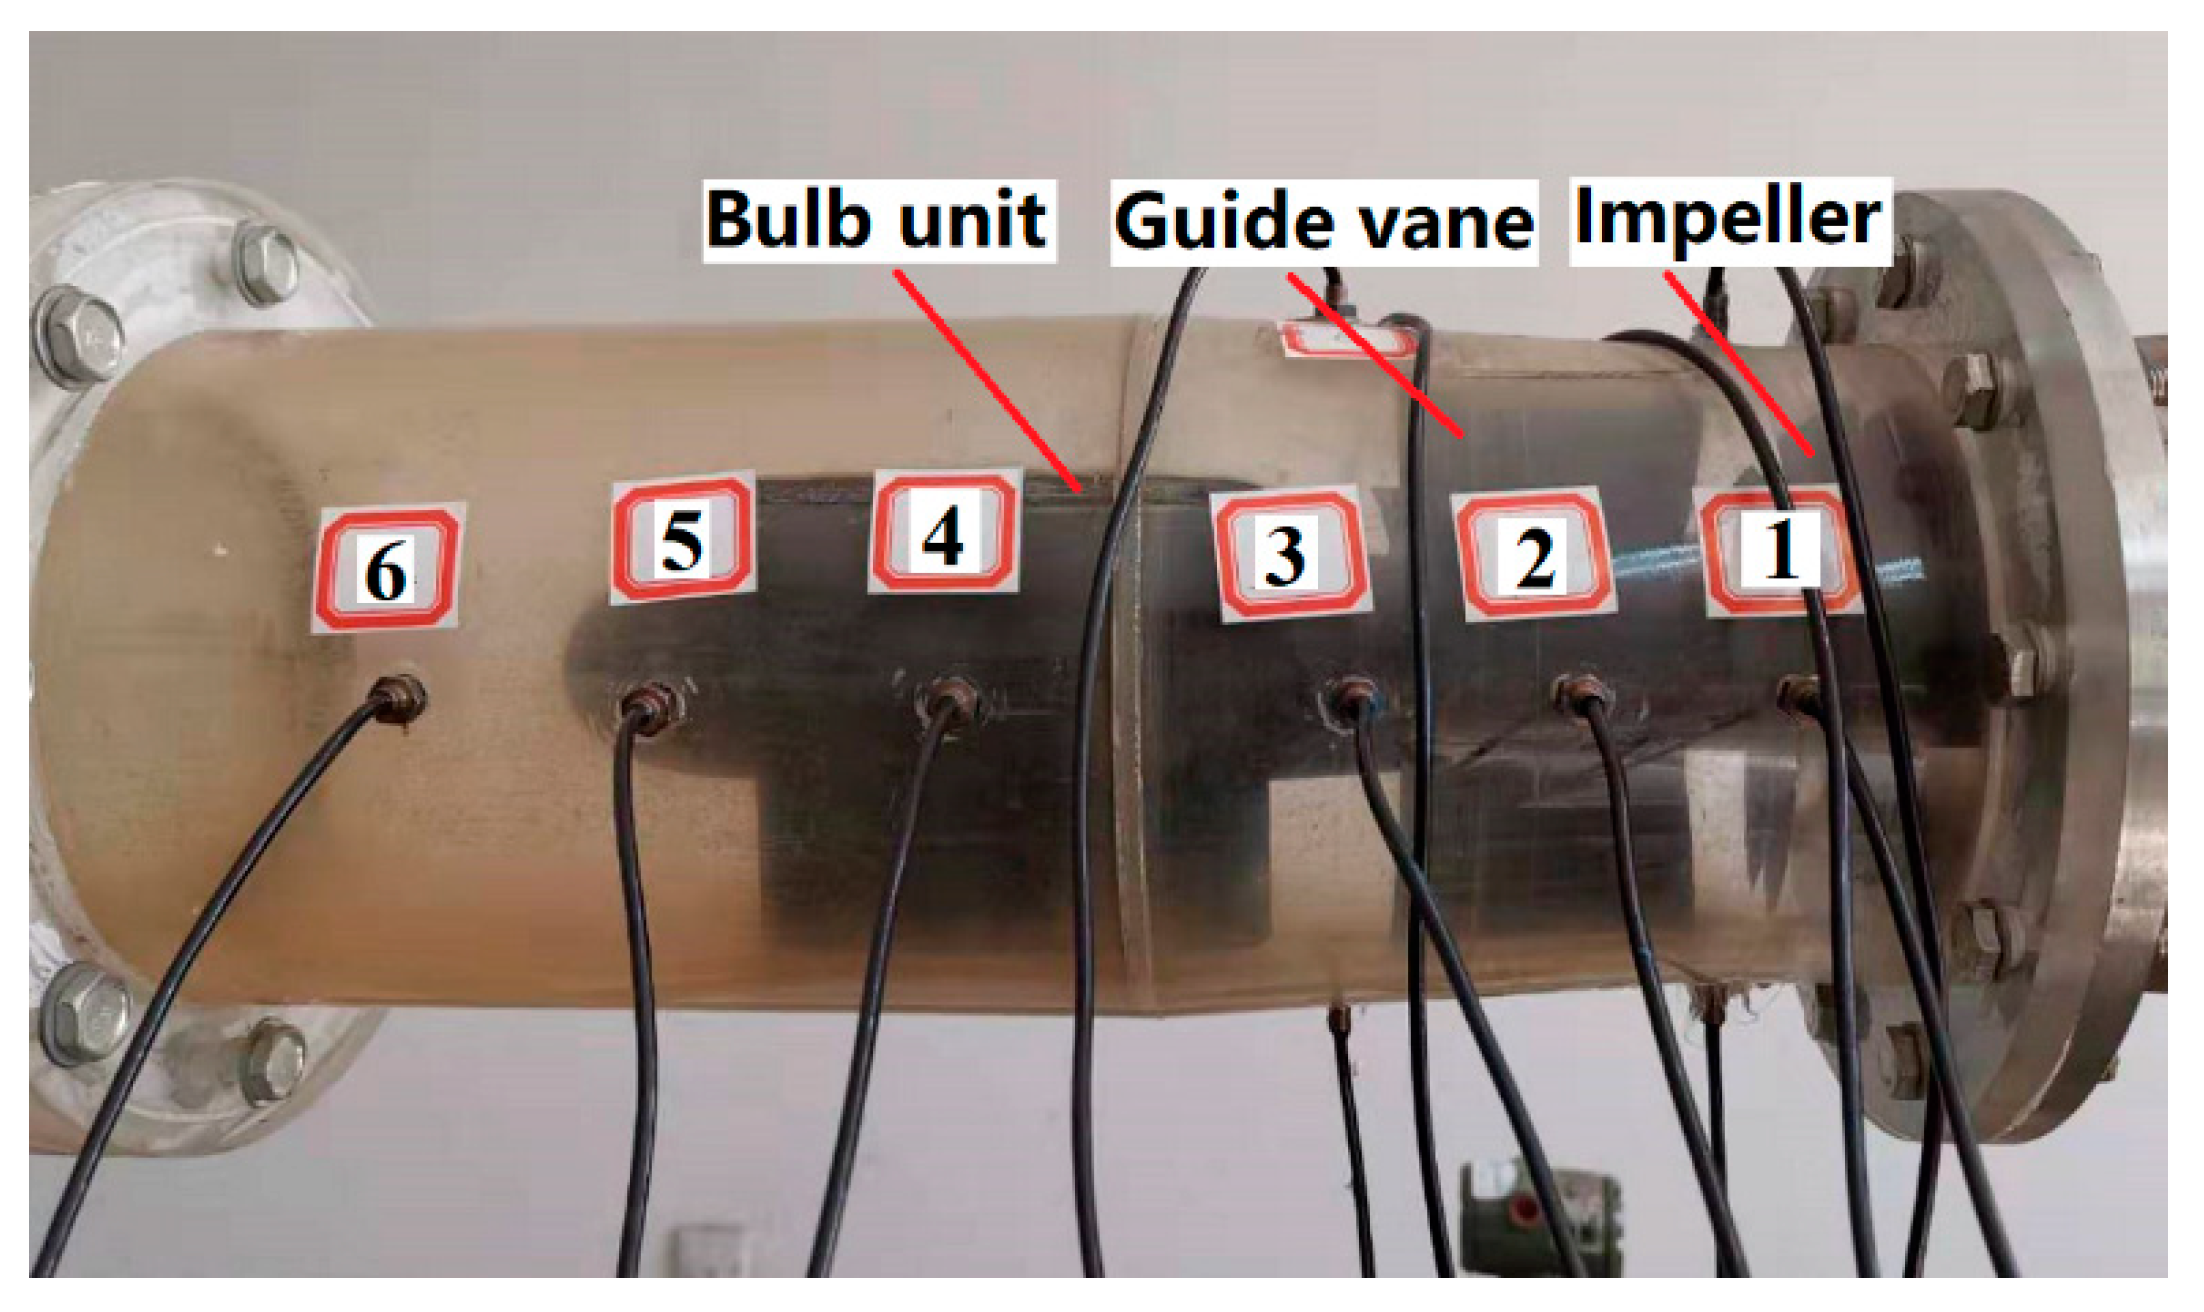
3.1. Test Bench

In order to test the external and internal characteristics of the pump, a small submersible tubular pump test bench for model tests and pressure pulsation tests was established. The test cycle piping system is shown in Figure 4, which had a length of 4.2 m and a height of 1.2 m (excluding the pressure tank and the suspended height). The main dimensions of the test system are shown in Figure 4 (unit is mm). The pipeline included a thick pipe section with an inner diameter of 200 mm, a tapered section with an inner diameter of 200 mm to 120 mm, and a pipe section with an inner diameter of 120 mm. The test bench layout was divided into two layers. The upper layer included the submersible pump, the pressure tank, the torquemeter, and the motor. From the inlet passage to the outlet passage, the entire submersible tubular pump unit was made of plexiglass for flow visualization and internal flow field measurements based on laser testing technology. The lower part contained an electromagnetic flowmeter, auxiliary pump, butterfly valve, and other pipe accessories. The electromagnetic flowmeter satisfies the installation requirements as the water inlet pipe was greater than 10 D and the water outlet pipe was longer than 5 D.
The external characteristic parameters of the pump device include discharge, lift head, power, and efficiency. The instruments generally used for testing are mainly electromagnetic flowmeters, torque meters, and differential pressure transmitters.
The discharge was measured by an electromagnetic flowmeter. The average discharge obtained during a period of time was used as the discharge value under this operating condition.
Pressure measurement sections A-A and B-B in the system can be seen in Figure 4. The equation for lift head is written as [32]:
H = ( p 1 ρ g + V 1 2 2 g + Z 1 ) ( p 2 ρ g + V 2 2 2 g + Z 2 )
The torque moment and the rotational speed values are read from the tacho-torquemeter directly, and converted to power through Equation (2):
P = M ω ,   ω = 2 π n 60
When the above data are obtained, the efficiency is computed through Equation (3):
η = ρ g Q H p

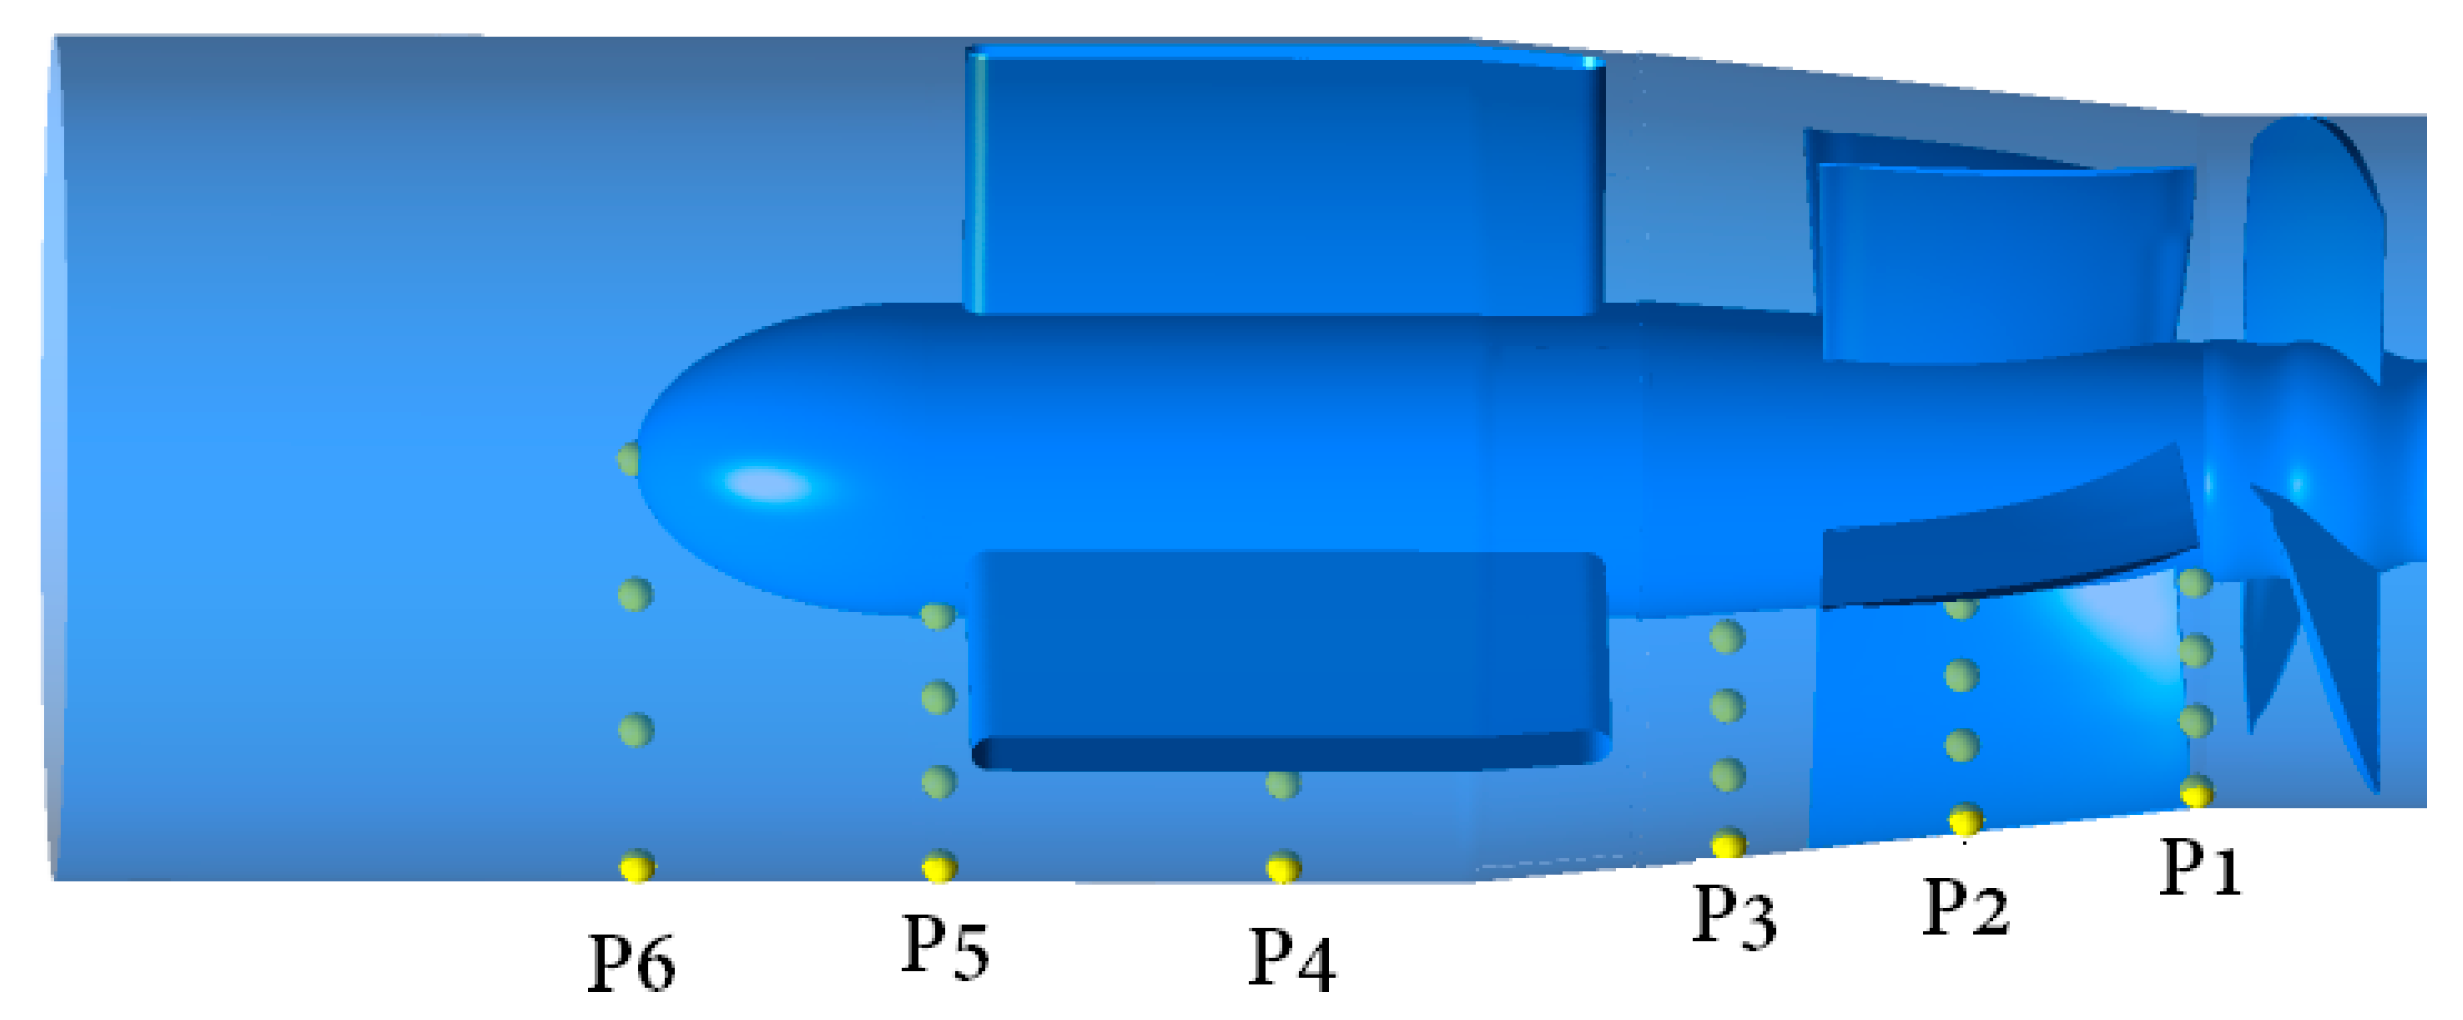
3.2. Pressure Pulsation Measurement

The pump device pressure pulsation test mainly uses multiple dynamic pressure sensors to collect pulsation data. The micropressure sensor used in this test was a CYG1505GSLF made by Kunshan Shuangqiao Sensor Measurement Controlling Company (Kunshan, China, 2016). The basic parameters are given in Table 2. The SQCJ-USB-36 data acquisition instrument was also produced by Kunshan Shuangqiao Sensor Measurement Controlling Company (Kunshan, China, 2016). The number of analog channels was 36 channels, and the sampling frequency was 100 kHz.
In order to compare the different pressure pulsations in the various flow components of the submersible pump device, dynamic pressure sensors were arranged at the impeller outlet (P1), middle of the guide vane (P2), the guide vane outlet (P3), and the bulb unit (P4, P5 and P6) to monitor the pressure pulsation, as shown in Figure 5. All the measuring points were arranged on the line where the horizontal longitudinal section intersected the wall surface.

4. Results and Analysis

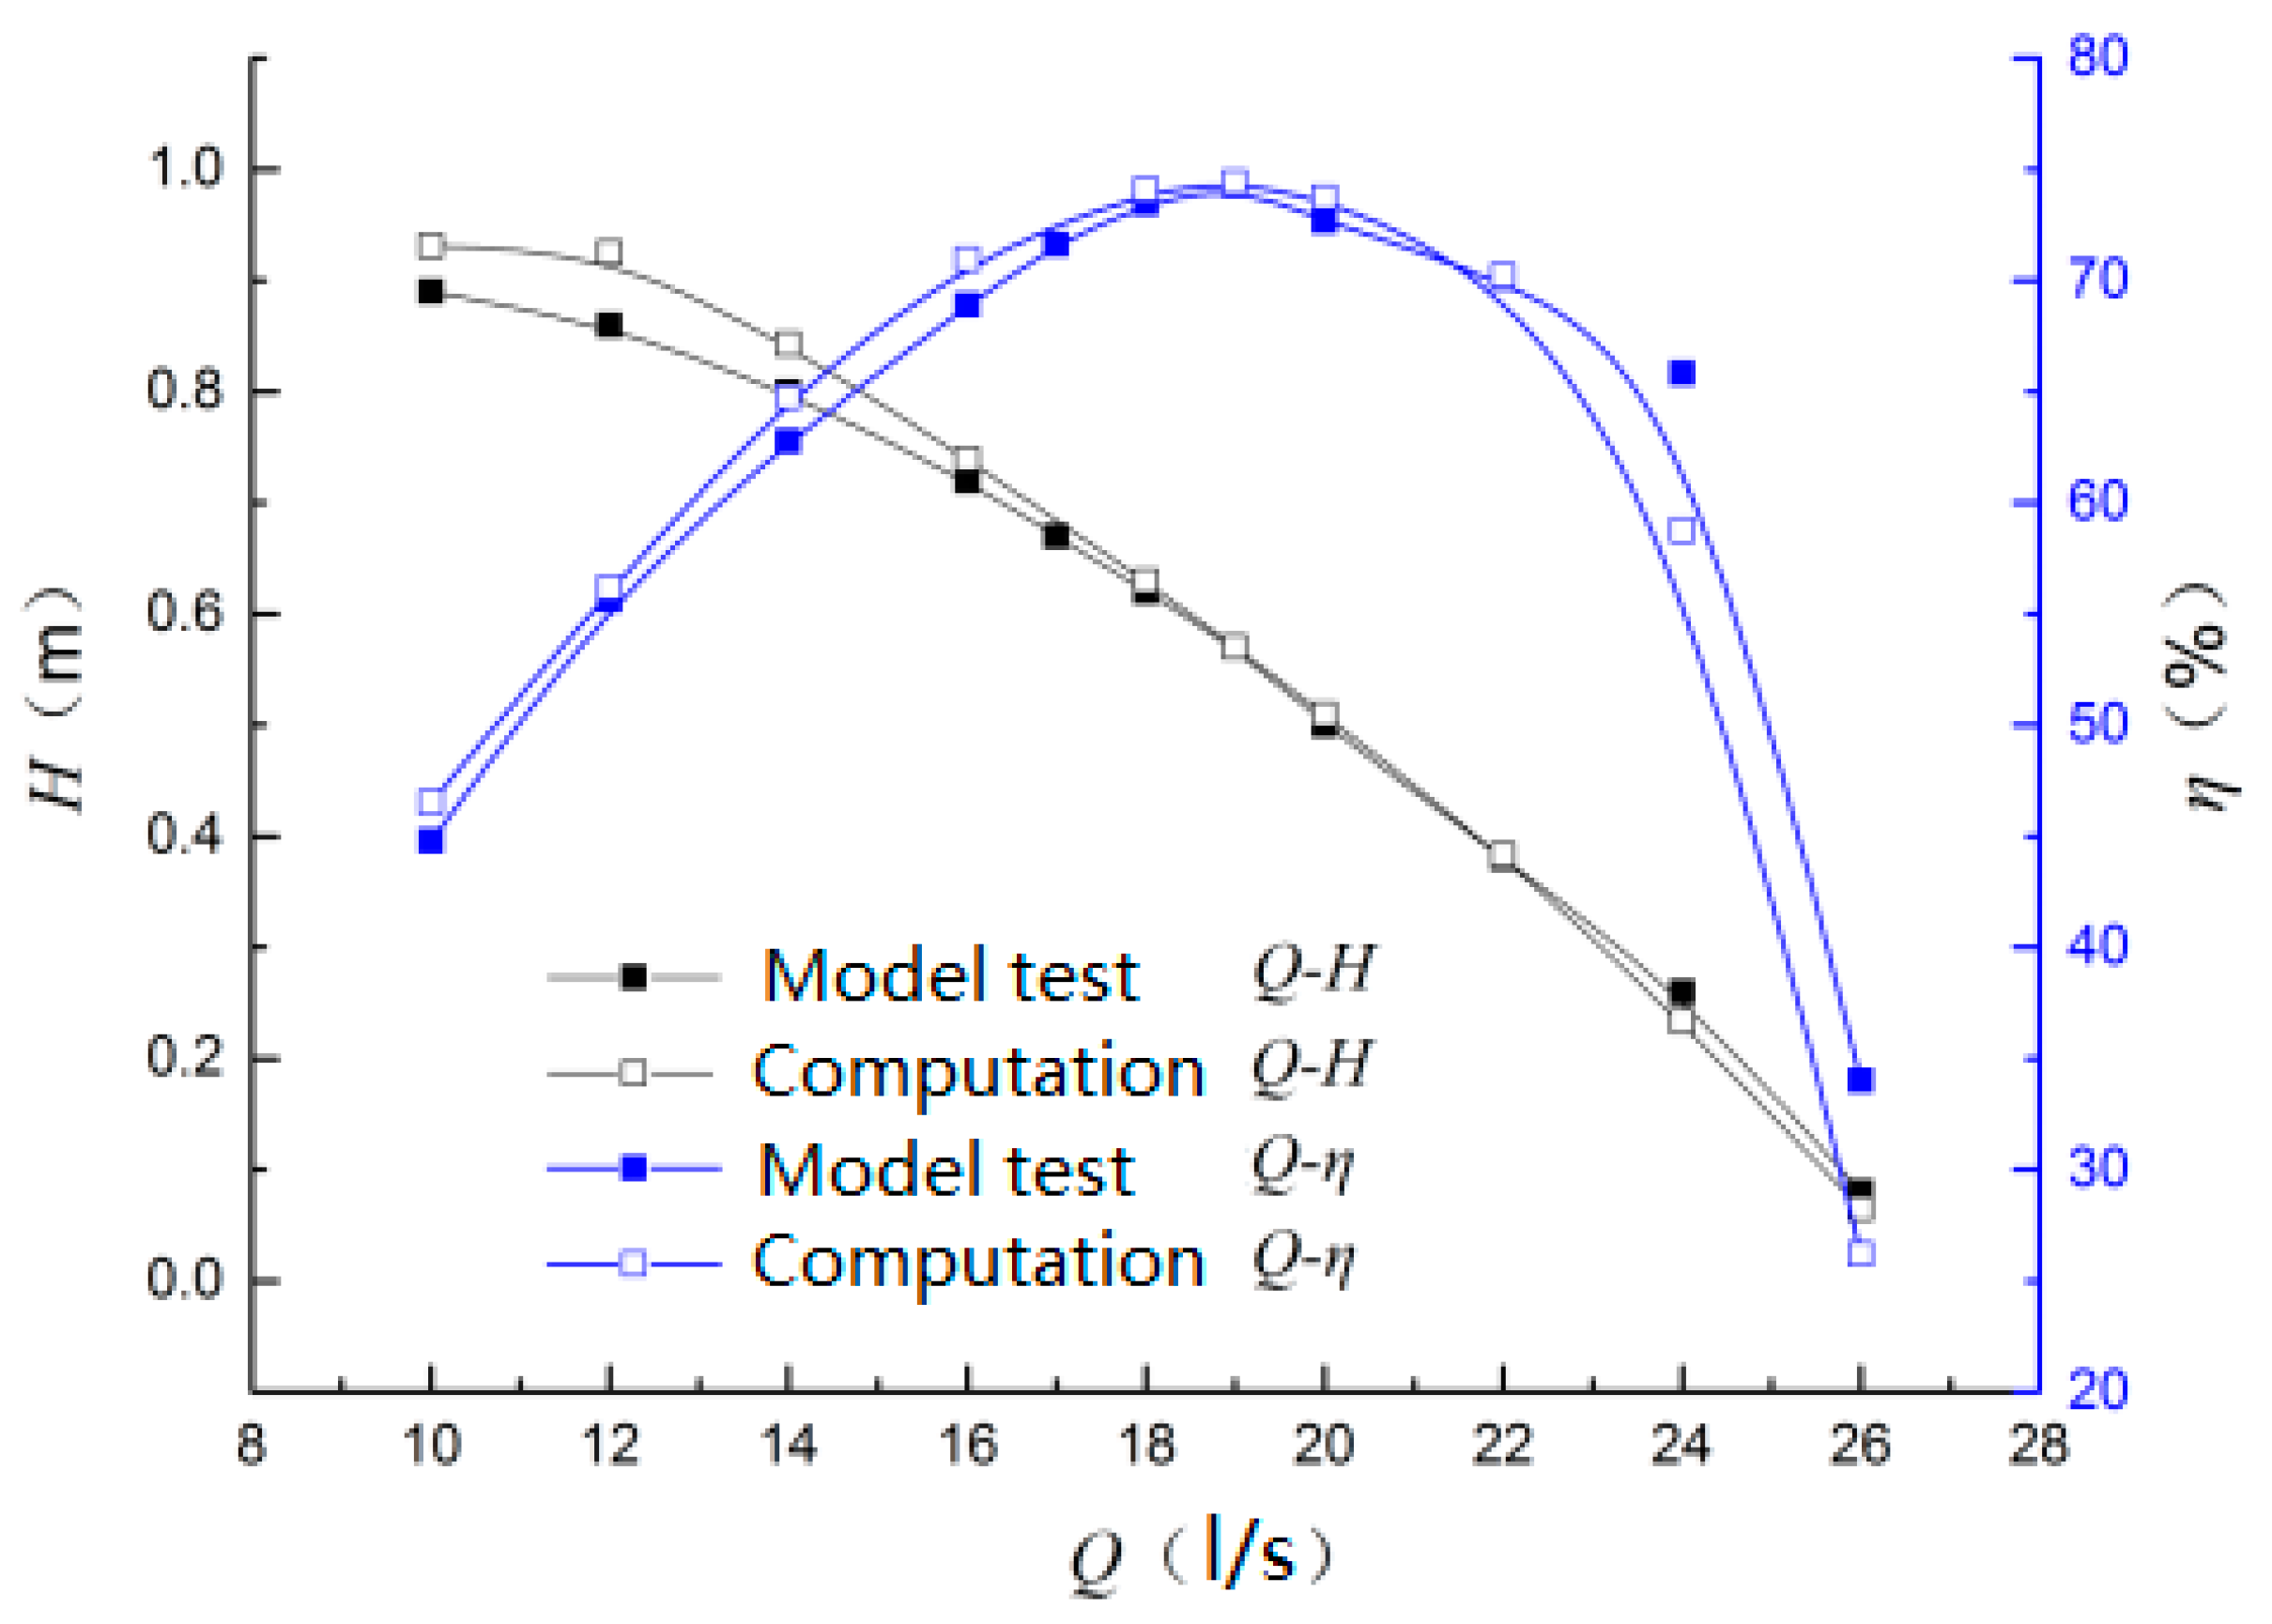
4.1. External Characteristics of Pumping System

The external characteristic data of the submersible pumping system obtained by the model test was compared with the performance of the pumping system predicted by CFD calculation. The comparison results of the two are shown in Figure 6 (the solid square points in the figure are the data points obtained by the model test, and the hollow square points are the data points obtained by the numerical simulation. These points are respectively fitted with a quadratic curve to obtain the final performance curve). It can be seen that the numerical simulation results agree well with the experimental results, especially in the high efficiency area, where the high efficiency point appears in the same flow rate at about 19 L/s, and the corresponding maximum efficiency is 74.4%. Under the small flow condition, the numerical calculation results were higher than the model test values, while under large flow conditions, the model test value was slightly higher than the calculated value. From the comparison of calculated and measured results, the calculated data can be considered accurate and reliable.

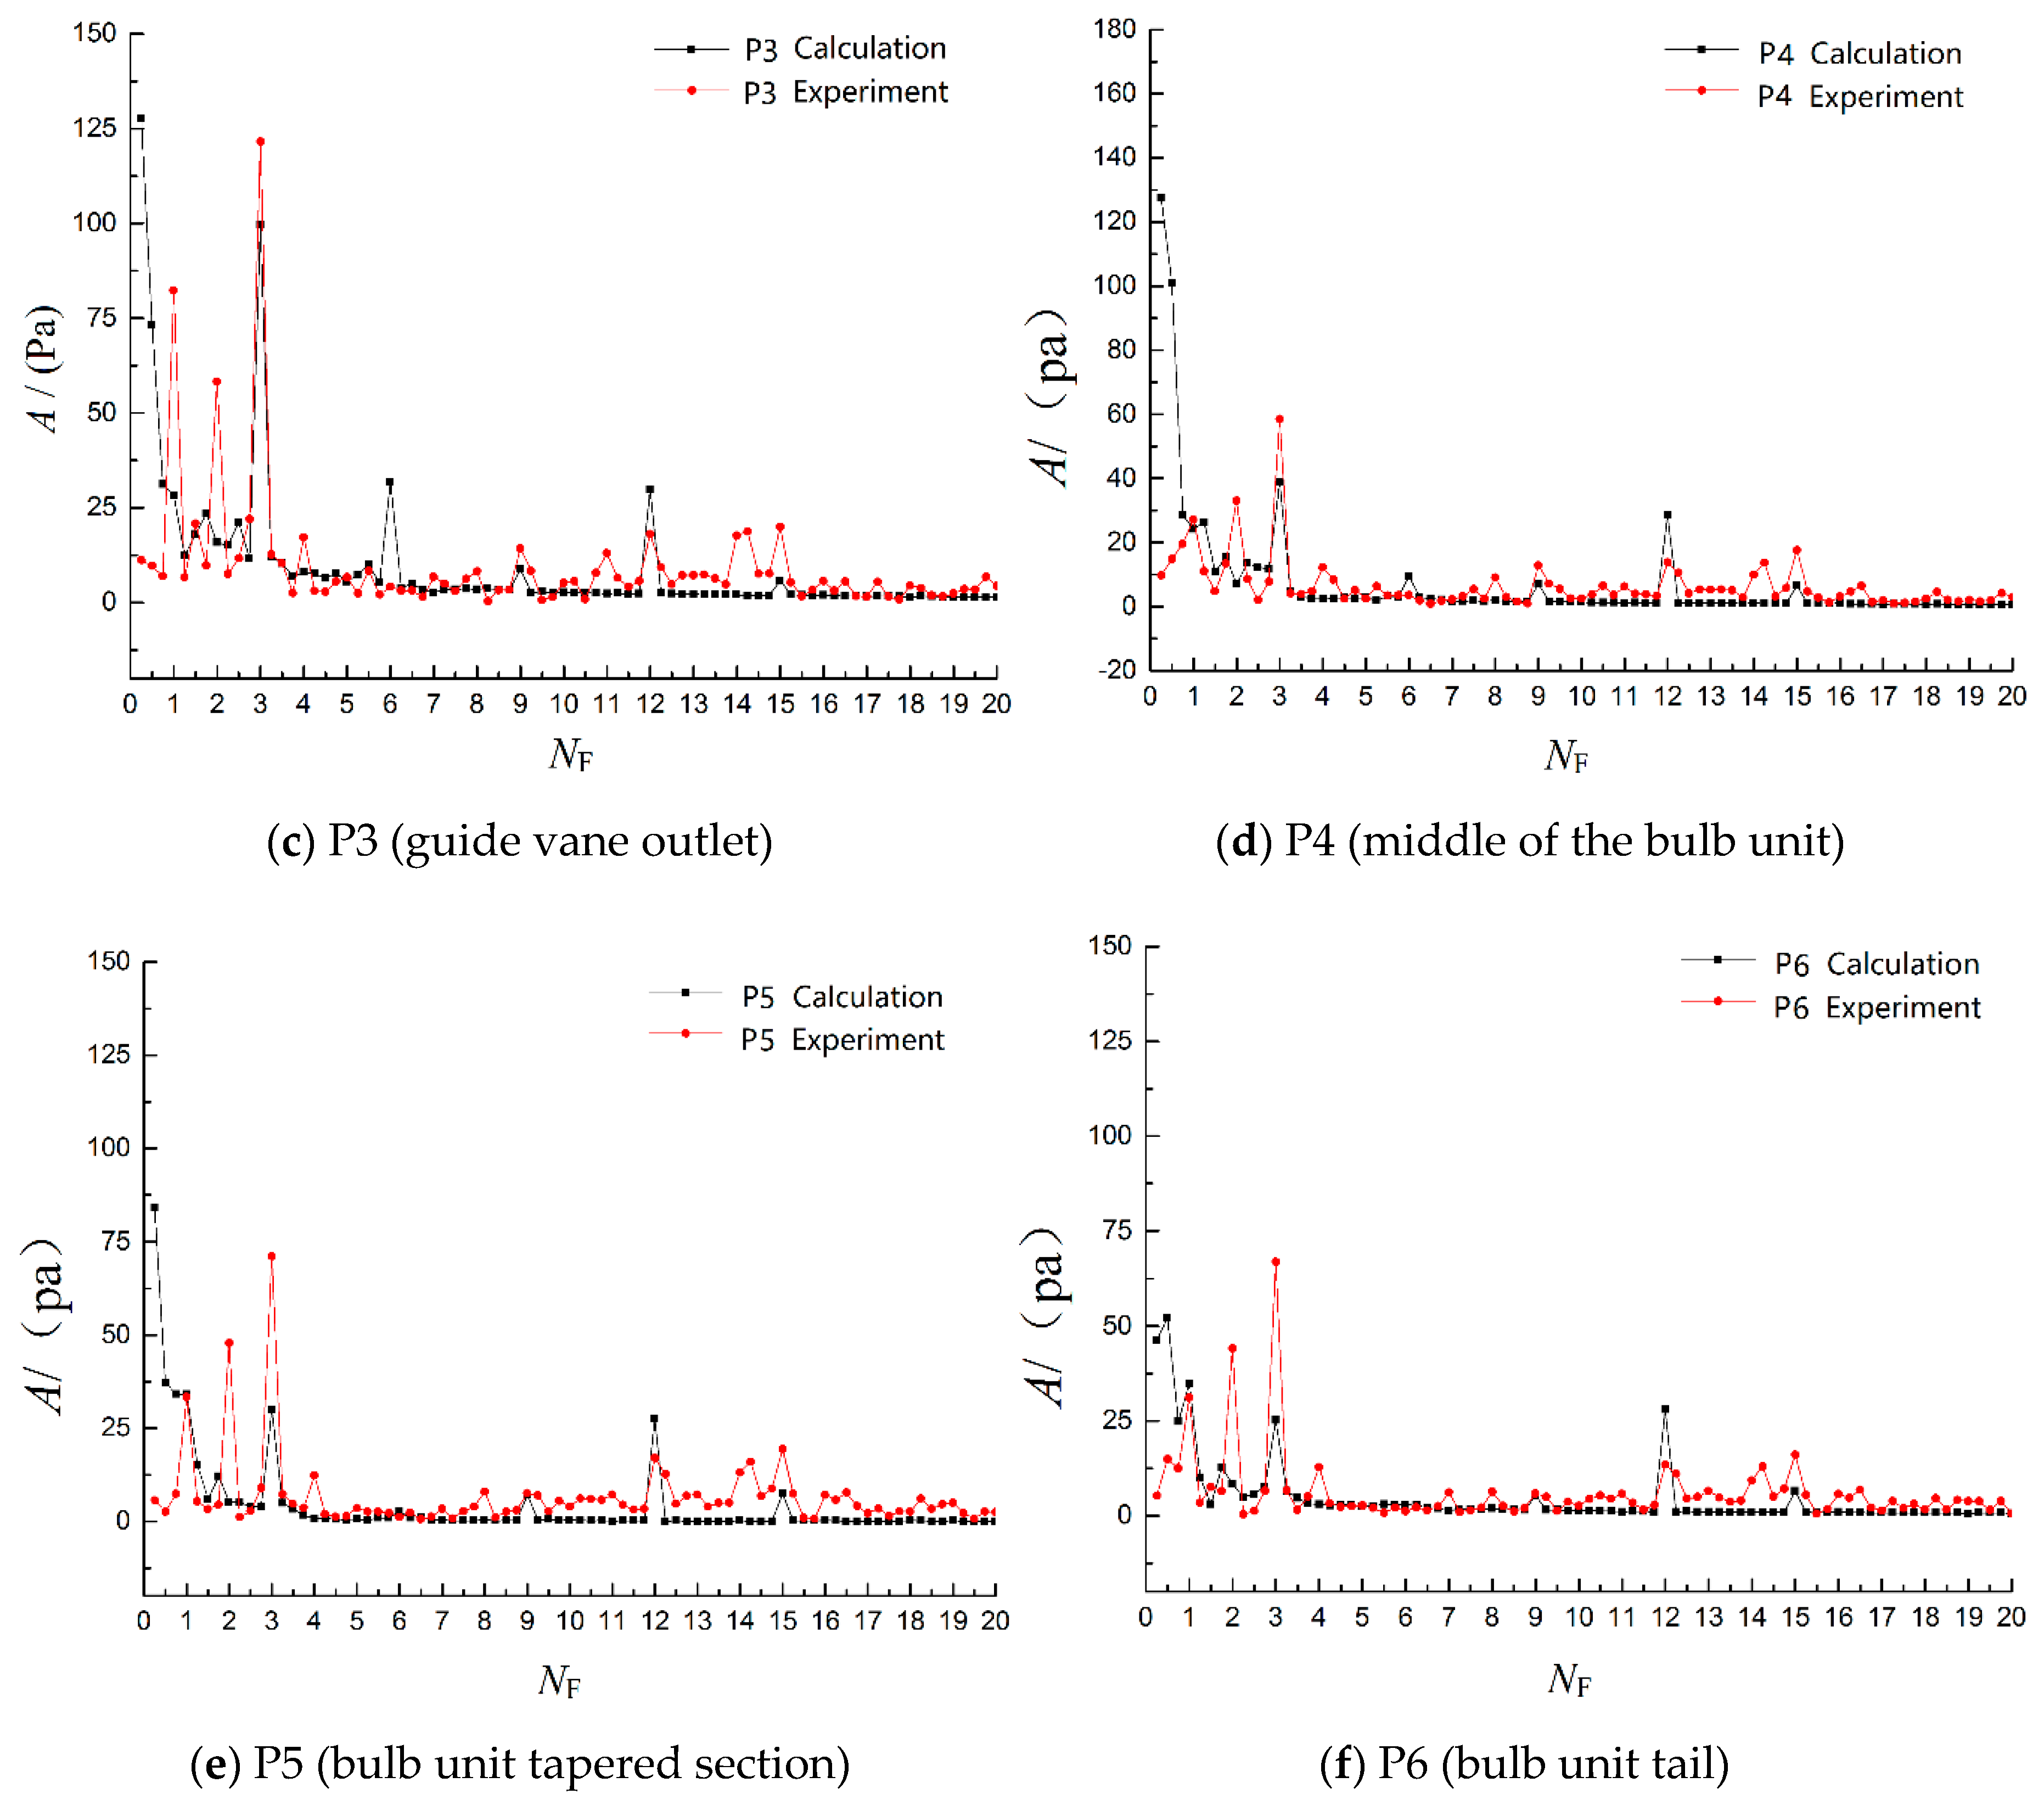
4.2. Pressure Pulsation Analysis

In order to compare the results of the pressure pulsation measurements, the monitoring points set in the numerical calculation were the same as those in the experiment (P1, P2, P3, P4, P5, and P6), and additionally the monitoring points inside the pump, which cannot be measured by testing, were added to obtain more pulsation information for the pump. The detailed location of the monitoring points is shown in Figure 7. Since the actual measurement points are distributed from the plane parallel to the ground plane, this arrangement makes each point on the line appears to coincide, and only one point can be seen in the front view. In order to show the location of the measuring points, Figure 7 is the actual calculation domain rotated 90° clockwise along the axis.
The pressure pulsation data of each point was subjected to fast Fourier transform analysis to obtain the frequency domain diagram of each point. The results were compared with the experimental data in different sections, as shown in Figure 8. (The red points in the figure are the pulsation data points measured experimentally, while the black points are the pulsation data points obtained by numerical calculation. Each point is connected with a straight line to obtain the final pressure pulsation curve.) Only the pressure pulsation values for the six points P1–P6 were taken: P1 is the impeller outlet, P2 is the middle guide vane, P3 is the guide vane outlet, P4 is the middle of the bulb unit, P5 is the bulb unit tapered section, and P6 is the bulb unit tail in the optimum condition (Qopt = 19 L/s), where the abscissa is the rotational frequency multiple, NF, and the ordinate is the amplitude, A. Here, NF is defined as follows:
NF = 60 zF/n = F/Fn
Figure 8 shows that the pressure pulsation measurement at the monitoring point P1 has a significant amplitude at the full-fold frequency, and the numerical calculation of the frequency domain map is only due to small adverse effects, such as noise interference. The blade passing frequency (BPF) and its integer multiples have a large amplitude. However, both of them obtain the maximum amplitude at BPF. The amplitude of the pressure pulsation test at the impeller exit monitoring point is 1.14 times the unsteady calculated amplitude. The reasons for the error may be: (1) The influence of dynamic and static interference. (2) The submerged cross-flow pump has a small bulb unit, and the motor is placed outside the pump device and connected to the impeller through the rotating shaft. During the rotation of the impeller, the rotating shaft also drives the water in the inflow passage to rotate, so under test conditions, the pressure pulsation value is too large. (3) There are many interference factors in the test case. (4) There is a certain relationship between the form of the Fourier transform and the selection and length of the window function. However, the overall pressure pulsation test and numerical simulation have a high degree of agreement for the main frequency. At monitoring point P2, due to the restriction effect of the inlet vane on the water flow, the amplitude of the blade frequency is significantly reduced with respect to the impeller outlet, and the amplitudes of the 1x rotation frequency and the 2x rotation frequency do not change much. The amplitude of the model test at the blade frequency is 1.07 times the unsteady calculated amplitude. At the integer frequency of the blade frequency, the amplitude of the test and the numerical calculation is in good agreement, and the model test is caused by the influence of bubbles. The frequency domain map has more components at high frequencies. At monitoring point P3 (the vane outlet), the amplitude of the model test and the unsteady calculation result of the blade frequency are somewhat reduced, and the amplitude of the model test at this point is 1.23 times the unsteady calculated amplitude. The amplitudes of the measurement and the unsteady calculation result are obviously increased with the 12-fold frequency shift, which may cause undesirable flow states. such as backflows and vortexes at the exit of the guide vane.
The bulb unit also has a certain inhibitory effect on the pressure pulsation due to the rectifying action of the supports. At monitoring point P4 (in the middle of the bulb unit), the pressure pulsation amplitude is significantly reduced relative to the vane section. At the blade frequency, the amplitude of the pressure pulsation test is 1.5 times the amplitude of the unsteady calculation. The amplitude of the pressure pulsation test is significantly larger than the unsteady calculation result, but the difference between the amplitudes of these two is smaller at 1x frequency. Probably because the monitoring point is far from the impeller, the influence of the impeller on the pressure pulsation is reduced, which leads to a large numerical error in the calculation of the amplitude at the 3x frequency shift. The frequency domain diagram of monitoring point P5 is shown at the blade frequency, and the amplitude of the pressure pulsation test is 2.4 times the amplitude of the unsteady calculation. The amplitude difference between the test and the digital mode gradually increases, and the distance from the pulsating source impeller also increases. The amplitude becomes smaller, and the influence of interference on the test results is more obvious. At the same time, the flow path of the gradual section is widened, and certain bad flow patterns occur when the water flow is fast. The model test has a large amplitude at high frequencies. At the end of bulb section monitoring point P6, the test and numerical calculations have large amplitudes at low frequencies. At the blade frequency, the amplitude of the model test is 2.8 times the unsteady calculated amplitude. Due to the poor flow pattern in the tail of the bulb body, the frequency domain diagram of monitoring point P6 obtained as measured by the pressure pulsation test also has a large amplitude at high frequencies.
In summary, under the optimal working conditions, the pressure pulsation values of the monitoring points obtained by the pressure pulsation test are basically the same as the general trend for the unsteady calculation results. In the impeller and vane parts especially, the monitoring points are at the main frequency and amplitude. The upper abundance is higher, and the amplitude of the blade frequency increases up to 11%. It can be seen that the pressure pulsation test and the pressure pulsation data obtained by the nonfixed constant value simulation are more accurate, which further studies the internal characteristics of the pump device through a nonfixed constant value simulation.

5. Conclusions

The study presents a numerical simulation and experiment of external characteristics and pressure pulsation of a submersible tubular pumping system. The following results are obtained:
(1)
Comparing the numerical simulation results and experimental data of pump performance under different working conditions, the results of the calculation and the experiment are in good agreement, especially in the high efficiency area, and some deviations under high flow and small flow conditions.
(2)
The pressure pulsation values of the six monitoring points in the axial direction of the wall of the pumping system calculated by the unsteady simulation are basically the same as the overall trend of the pressure pulsation test results. The pressure fluctuation intensity is strongest in the impeller outlet, and then it gradually weakens. The main frequency and the amplitude matching degree are higher, and the pressure pulsation values on the wall of the bulb unit are quite different.
(3)
The blade passing frequency and its multiples play a leading role in pressure pulsation. Due to the rotor–stator interaction at the exit of the impeller, the influence of the blade frequency is obvious. The farther the measuring point is from the impeller, the less affected the pressure pulsation is by the blade frequency. The frequency amplitudes decrease from the impeller exit to the bulb unit.
(4)
Based on this research, the experimental pressure pulsation monitoring points can be increased in the future to further reveal the internal pulsation distribution law of submersible tubular pumping systems.

Author Contributions

Y.J. conceived and designed the experiments. X.H. participated in numerical simulation and proposed the modification suggestions to the original manuscript. H.C., Y.Z., and S.Z. performed the experiments and simulation. H.C. and Y.Z. analyzed the data. Y.J. wrote the paper. C.L. performed funding acquisition.

Funding

This work was supported by a project funded by the Priority Academic Program Development of Jiangsu Higher Education Institutions (PAPD), Nature Science Foundation of China (Grant No. 51609210), and Nature Science Foundation of Jiangsu Province (Grant No. SBK2019041842).

Conflicts of Interest

The authors declare no conflicts of interest.

Nomenclature

AAmplitude, Pa
FActual frequency after Fourier transform, Hz
FnBlade passing frequency, Hz
gGravity, m/s2
HLift head, m
MTorque, Nm
nRotational speed, r/min
NFRotational frequency multiple
p1,p2Static pressure of section A-A and B-B, Pa
PShaft power, kW
QDischarge, L/s
QoptDischarge of optimal condition, L/s
TPeriod, s
V1,V2Flow velocity of section A-A and B-B, m/s
zBlade number of impeller, 3
ηEfficiency
ρDensity of water, kg/m3
ωAngular velocity of rotation, rad/s
△tTime step, s

References

  1. Wu, C.; Jin, Y.; Wang, D.; Yang, H.; Yang, F.; Liu, C. Study and application of large bidirectional submersible tubular pump system. J. Hydroelectr. Eng. 2012, 31, 265–270. [Google Scholar]
  2. Liu, C.; Zhou, Q.; Qian, J.; Jin, Y. Flow characteristics of two way passage vertical submersible pump system. Trans. Chin. Soc. Agric. Mach. 2016, 47, 59–65. [Google Scholar]
  3. Tang, F.; Liu, C.; Xie, W. Experimental studies on hydraulic Models for a reversible, Tubular, and Submersible axial-flow P ump Installation. Trans. Chin. Soc. Agric. Mach. 2004, 35, 74–77. [Google Scholar]
  4. Yang, F.; Jin, Y.; Liu, C. Performance test and numerical analysis of bidirectional submersible tubular pump. J. Agric. Eng. 2012, 28, 60–67. [Google Scholar]
  5. Xia, C. Research on the flow pattern of low-lift diving tubular pumping system by 3D CFD. Earth Environ. Sci. 2016, 49, 032010. [Google Scholar] [CrossRef]
  6. Zhu, Y.; Tang, S.; Wang, C.; Jiang, W.; Yuan, X.; Lei, Y. Bifurcation Characteristic research on the load vertical vibration of a hydraulic automatic gauge control system. Processes 2019, 7, 718. [Google Scholar] [CrossRef] [Green Version]
  7. Zhu, Y.; Qian, P.; Tang, S.; Jiang, W.; Li, W.; Zhao, J. Amplitude-frequency characteristics analysis for vertical vibration of hydraulic AGC system under nonlinear action. Aip Adv. 2019, 9, 035019. [Google Scholar] [CrossRef] [Green Version]
  8. Ye, S.; Zhang, J.; Xu, B.; Zhu, S. Theoretical investigation of the contributions of the excitation forces to the vibration of an axial piston pump. Mech. Syst. Signal Process. 2019, 129, 201–217. [Google Scholar] [CrossRef]
  9. Khalifa, A.E.; Al-Qutub, A.M.; Ben-Mansour, R. Study of pressure fluctuations and induced vibration at blade-passing frequencies of a double volute pump. Arab. J. Sci. Eng. 2011, 36, 1333–1345. [Google Scholar] [CrossRef]
  10. Zhang, J.; Xia, S.; Ye, S.; Xu, B.; Song, W.; Zhu, S.; Xiang, J. Experimental investigation on the noise reduction of an axial piston pump using free-layer damping material treatment. Appl. Acoust. 2018, 139, 1–7. [Google Scholar] [CrossRef]
  11. Chu, S.; Dong, R.; Katz, J. Relationship between unsteady flow, pressure fluctuations, and noise in a centrifugal pump—part A: Use of PDV data to compute the pressure field. J. Fluids Eng. 1995, 117, 24–29. [Google Scholar] [CrossRef]
  12. Chu, S.; Dong, R.; Katz, J. Relationship between unsteady flow, pressure fluctuations, and noise in a centrifugal pump—Part B: Effects of blade-tongue interactions. J. Fluids Eng. 1995, 117, 30–35. [Google Scholar] [CrossRef]
  13. Parrondo, J.; Pérez, J.; Barrio, R.; Gonzales, J. A simple acoustic model to characterize the internal low frequency sound field in centrifugal pumps. Appl. Acoust. 2011, 72, 59–64. [Google Scholar] [CrossRef]
  14. He, X.; Jiao, W.; Wang, C.; Cao, W. Influence of surface roughness on the pump performance based on Computational Fluid Dynamics. IEEE Access 2019, 7, 105331–105341. [Google Scholar] [CrossRef]
  15. Wang, C.; Hu, B.; Zhu, Y.; Wang, X.; Luo, C.; Cheng, L. Numerical study on the gas-water two-phase flow in the self-priming process of self-priming centrifugal pump. Processes 2019, 7, 330. [Google Scholar] [CrossRef] [Green Version]
  16. Si, Q.; Yuan, J.; Yuan, S.; Wang, W.; Zhu, L.; Bois, G. Numerical investigation of pressure fluctuation in centrifugal pump volute vased on SAS model and experimental validation. Adv. Mech. Eng. 2014, 6, 972081. [Google Scholar] [CrossRef] [Green Version]
  17. Li, Y.; Li, X.; Zhu, Z.; Li, F. Investigation of unsteady flow in a centrifugal pump at low flow rate. Adv. Mech. Eng. 2016, 8, 1–8. [Google Scholar] [CrossRef] [Green Version]
  18. Dai, C.; Kong, F.; Dong, L. Pressure fluctuation and its influencing factors in circulating water pump. J. Cent. South Univ. 2013, 20, 149–155. [Google Scholar] [CrossRef]
  19. Wang, C.; He, X.; Zhang, D.; Hu, B.; Shi, W. Numerical and experimental study of the self-priming process of a multistage self-priming centrifugal pump. Int. J. Energy Res. 2019, 43, 4074–4092. [Google Scholar] [CrossRef]
  20. Wang, C.; He, X.; Shi, W.; Wang, X.; Wang, X.; Qiu, N. Numerical study on pressure fluctuation of a multistage centrifugal pump based on whole flow field. Aip Adv. 2019, 9, 035118. [Google Scholar] [CrossRef] [Green Version]
  21. Feng, J.; Benra, F.K.; Dohmen, H.J. Unsteady flow investigation in rotor-stator interface of a radial diffuser pump. Forsch. Ingen. 2010, 74, 233–242. [Google Scholar] [CrossRef]
  22. Wang, C.; Shi, W.; Wang, X.; Jiang, X.; Yang, Y.; Li, W.; Zhou, L. Optimal design of multistage centrifugal pump based on the combined energy loss model and computational fluid dynamics. Appl. Energy 2017, 187, 10–26. [Google Scholar] [CrossRef]
  23. Pavesi, G.; Cavazzini, G.; Ardizzon, G. Time-frequency characterization of the unsteady phenomena in a centrifugal pump. Int. J. Heat Fluid Flow 2008, 29, 1527–1540. [Google Scholar] [CrossRef]
  24. Xie, C.; Tang, F.; Zhang, R.; Zhou, W.; Zhang, W.; Yang, F. Numerical calculation of anial-flow pump’s pressure fluctuation and model test analysis. Adv. Mech. Eng. 2018, 10, 1–13. [Google Scholar] [CrossRef]
  25. Feng, J.; Luo, X.; Guo, P.; Wu, G. Influence of tip clearance on pressure fluctuations in an axial flow pump. J. Mech. Sci. Technol. 2016, 30, 1603–1610. [Google Scholar] [CrossRef]
  26. Wang, F.; Zhang, L.; Zhang, Z. Analysis on pressure fluctuation of unsteady flow in axial-flow pump. J. Hydraul. Eng. 2007, 38, 1003–1009. [Google Scholar]
  27. Zhang, D.; Wang, H.; Shi, W.; Pan, D.; Shao, P. Experimental investigation of pressure fluctuation with multiple flow rates in scaled axial flow pump. Trans. Chin. Soc. Agric. Mach. 2014, 45, 139–145. [Google Scholar]
  28. Zhang, D.; Geng, L.; Shi, W.; Pan, D.; Wang, H. Experimental investigation on pressure fluctuation and vibration in axial-flow pump model. Trans. Chin. Soc. Agric. Mach. 2015, 46, 66–72. [Google Scholar]
  29. Gao, Q. Study of Pressure Fluctuation in a Mixed-Flow Pump with Vaned Diffuser; Lanzhou University of Technology: Lanzhou, China, 2014. [Google Scholar]
  30. Yang, F.; Liu, C.; Tang, F.; Zhou, J.; Cheng, L. Numerical analysis on pressure fluctuations of time-varying turbulent flow in tubular pumping system with S-shaped shaft extension. J. Hydroelectr. Eng. 2015, 34, 175–180. [Google Scholar]
  31. Zhang, Y.; Wang, X.; Ding, P.; Tang, X. Numerical analysis of pressure fluctuation of internal flow in submersible axial-flow pump. J. Drain. Irrig. Mach. Eng. 2014, 32, 302–307. [Google Scholar]
  32. Jin, Y.; Liu, C.; Qiu, Z.; Zhou, J.; Cheng, L. Numerical simulation and experimental study on postpositive bulb tubular pump. In Proceedings of the 6th International Symposium on Fluid Machinery and Fluid Engineering, Wuhan, China, 22–25 October 2014. [Google Scholar]
Figure 1. Single-line diagram of the pumping system.
Processes 07 00949 g001
Figure 2. A 3-D model of the pump device: (a) passages and bulb unit; (b) impeller and guide vane.
Processes 07 00949 g002
Figure 3. Grid generation.
Processes 07 00949 g003
Figure 4. Single-line diagram of pump test stand.
Processes 07 00949 g004
Figure 5. Location of pressure measurements.
Processes 07 00949 g005
Figure 6. Hydraulic performance of the pumping system.
Processes 07 00949 g006
Figure 7. Pressure monitoring points.
Processes 07 00949 g007
Figure 8. Comparison of numerical calculation results of pressure pulsation for each part with experimental data.
Processes 07 00949 g008aProcesses 07 00949 g008b
Table 1. Parameters of the model pump.
Impeller diameter (mm)120
Rotational speed (r/min)1450
Hub to tip ratio0.4
Discharge range (L/s)14~24
Number of blades3
Number of guide vane blades5
Blade angle (°)0
Tip clearance (mm)0.2
Table 2. Parameters of the pressure sensor.
Sensor ModelCYG1505GSLF
Range (kPa)50
Output (V)0~5
Accuracy (%)0.25

