Article

Experimental Studies on Corrosion Behavior of Ceramic Surface Coating using Different Deposition Techniques on 6082-T6 Aluminum Alloy

1
Department of Mechanical Engineering, College of Engineering, King Khalid University, Abha 61413, Saudi Arabia
2
Research Center for Advanced Materials Science (RCAMS), King Khalid University, Abha 61413, Saudi Arabia
3
Department of Mechanical Engineering, Faculty of Engineering, Islamic University of Madinah, Medina 41411, Saudi Arabia
4
Central Metallurgical Research and Development Institute (CMRDI), Cairo 11421, Egypt
*
Author to whom correspondence should be addressed.
Processes 2018, 6(12), 240; https://doi.org/10.3390/pr6120240
Submission received: 24 October 2018 / Revised: 18 November 2018 / Accepted: 21 November 2018 / Published: 26 November 2018
(This article belongs to the Special Issue Thin Film Processes)

Abstract

:
Aluminum alloys cannot be used in aggressive corrosion environments application. In this paper, three different surface coating technologies were used to coat the 6082-T6 aluminum alloy to increase the corrosion resistance, namely Plasma Electrolytic Oxidation (PEO), Plasma Spray Ceramic (PSC) and Hard Anodizing (HA). The cross-sectional microstructure analysis revealed that HA coating was less uniform compared to other coatings. PEO coating was well adhered to the substrate despite the thinnest layer among all three coatings, while the PSC coating has an additional loose layer between the coat and the substrate. X-ray diffraction (XRD) analysis revealed crystalline alumina phases in PEO and PSC coatings while no phase was detected in HA other than an aluminum element. A series of electrochemistry experiments were used to evaluate the corrosion performances of these three types of coatings. Generally, all three-coated aluminum showed better corrosion performances. PEO coating has no charge transfer under all Inductive Coupled Plasma (ICP) tests, while small amounts of Al3+ were released for both HA and PSC coatings at 80 °C. The PEO coating showed the lowest corrosion current density followed by HA and then PSC coatings. The impedance resistance decreased as the immersion time increased, which indicated that this is due to the degradation and deterioration of the protective coatings. The results indicate that the PEO coating can offer the most effective protection to the aluminum substrate as it has the highest enhancement factor under electrochemistry tests compared to the other two coatings.

1. Introduction

Aluminum alloy 6082 has the highest strength of the 6000 series alloys and it used in many highly stressed applications such as aeronautics, trusses, bridges, transport applications, cranes and aerospace industries [1]. Aluminum is a metal which has a natural corrosion resistance due to the oxide layer that forms on its surface [1]. This dense layer is formed in a short time when it is exposed to the environment. However, under aggressive environments, aluminum is subjected to different types of corrosion such as pitting corrosion [2], intergranular corrosion [3] and stress corrosion cracking [4]. Pitting corrosion usually attacks aluminum surfaces causing localized holes in the protective film under chloride corrosive environments [5]. Regarding the atmospheric corrosion of aluminum, El-Mahdy et al. [6] studied the effects of aluminum corrosion rate under cyclic wet-dry environments. They found that aluminum corrosion rate can be affected by temperature, surface inclination and relative humidity. The corrosion rate increases with increasing temperature and decreases by increasing the angle of inclination [6]. Corrosion plays a significant role in human life and safety. Corrosion attacks the component and affects its function negatively and consequently, reduces its service lifetime. The economic costs of corrosion are obviously enormous in many industrial fields [7,8]. As a result, relatively poor corrosion resistance often decreases the lifetime of the aluminum alloy components. Thus, some surface engineering techniques on aluminum alloys would be indispensable to their applications.
Extensive researches on surface engineering that enhances the material resistance against corrosion, specifically, started in the 1980s and became a recognized manufacturing technology in the 1990s [9]. There are two main advantages of using surface treatments. Firstly, surface engineering techniques can enhance the tribological performances of the component’s surfaces against the surrounding environments and consequently, increase service lifetime and reduce the cost of replacement and maintenance [10]. Secondly, they can give a wide range of options for selecting cheaper substrate materials for certain applications with surface engineering technology [11,12].
Surface engineering technology can be classified based on the change of the surface of the substrate [13]. The first group can enhance the surface without changing the chemical composition of the substrate using heat treatments or mechanical working. Enhancing the surface by the second group through changing the chemical composition of the substrate such as electroplating and thermal diffusion treatments, oxide coatings, anodizing and sulphur treatments. The third group can enhance the surface by adding a layer such as welding, laser alloying and thermal spraying [14,15,16].
Plasma Electrolytic Oxidation (PEO) is an electrochemical surface treatment that produces a protective surface coating on metals and alloys [17,18,19]. This surface coating, which is ceramic, is produced by passing a modulated electrical current through a path of the electrolyte solution. The applied electrical potential should be high enough to the plasma discharges and sparks to be formed and generate oxide films with relatively higher thickness [20,21,22]. The applied potential exceeds the breakdown strength of the growing oxide film. The coated surface produced is well adhered to the substrate and possesses good wear and corrosion resistance, in addition to a good surface barrier for thermal conductivity [23,24].
The Hard Anodizing (HA) technique is an electrolytic passivation process, which forms a thick oxide layer on the metal surface. It is considered to be a traditional coating method and it has been used since 1923 and commercially available since 1940 [25,26,27]. HA is relatively a cheap process and does not give good wear resistance due to low hardness. This process can give better surface corrosion resistance, which varies according to the substrate material, parameters of the process and treatments conditions [28]. The microstructure of the anodized aluminum is considered amorphous alumina. This porous layer slightly increases the corrosion resistance of the substrate, however, for significant corrosion protection, a sealing process is required [29,30].
Plasma Spray Ceramics (PSC) is used to produce a coating in which molten or softened particles are applied by impacting onto a substrate. It was first introduced by Schoop while studying the production of metallic particles from a molten metal for coating [31,32,33,34]. There are three main stages to form this coating. Firstly, plasma particles are created as small droplets stream [35]. Secondly, these particles are subjected to a high temperature using heat source generating thermal energy. The particles’ composition is changed due to the chemical reaction between the droplet material and the flame. After that, they are flattened while striking a cold surface at high velocities. A common feature of lamellar grain microstructure is formed as a result of the rapid solidification and cooling processes [36].
The characteristics of the PEO coating interface on AA1060 aluminum alloy were investigated by Wang et al., as a function of PEO processing time using scanning electron microscopy and X-ray diffraction. Hundreds of coatings were detached from the substrate by an electrochemical method and ground into homogeneous powders [37]. Shifeng et al. [38] investigated the morphology and protective properties of the PEO coatings produced on 5754 aluminum alloy in a mixed electrolyte. The current density on the sample surface increased, the coating grew faster, the thickness increased and the roughness gradually decreased. The coating corrosion resistance first increased and then decreased [38]. Cerchier et al. [39] used the Plasma Electrolytic Oxidation coating technique on samples of 7075 aluminum alloy and they obtained thick and adherent coatings [39]. Abdel-Gawad et al. [40] studied the corrosion behavior of the hard-anodizing coating formed on different groups of aluminum alloys in the sulphuric acid electrolyte. The corrosion resistance and the anodized coating layer are influenced by the type of the alloy and the anodizing conditions such as current density, acid concentration and time of duration [40]. The influence of the hard-anodizing process parameters such as H2SO4 concentration, electrolyte temperature, Al3+ concentration and current density for the AA2011-T3 was evaluated. Higher H2SO4 concentration and higher current density have improved coating hardness and defectiveness, however, potentiodynamic polarizations have revealed that they do not enhance corrosion resistance [41].
Many authors have evaluated the wear and corrosion behavior of surface coatings and most of them agreed that these coating materials increased the wear and corrosion resistance as compared to the uncoated ones [22,23,42,43]. The oxide film can be affected by changing treatment parameters depending on the purpose of the coating [44]. Also, it was found that as the thickness of the PEO coating increased, the corrosion resistance increased. For example, Qiu et al. [45] showed that the corrosion performances of the PEO coating on ZK60 Mg alloy could be improved by increasing the current density in the PEO process [45].
This work has investigated the enhancements of the three coatings; plasma electrolytic oxidation, plasma spray ceramic and hard anodizing on the performances of 6082 aluminum alloy surface against different corrosion experiments. The microstructure of the coating layer was detailed investigated and the comprehensive results are presented. In addition, the corrosion behavior of the coating layers was evaluated. The results are followed with the discussion of such behavior.

2. Materials and Methods

The substrate used in this study was 6082-T6 aluminum alloy with chemical composition listed in Table 1. T6 refers to the temper number which means solution heat-treated and artificially aged. The substrates were cut into discs with a diameter of 25.40 mm and a thickness of 10 ± 0.01 mm to be fitted in the holder for electrochemistry experiments suitable for the rig available in the lab. Three types of materials coatings were formed on the substrate, that is, Plasma Electrolytic Oxidation (PEO) and Plasma Spray Ceramic (PSC) and Hard Anodizing (HA). For PEO samples, a 3 mm diameter hole was drilled in the aluminum substrates for the anode to be inserted in the sample to allow for the anodization process and sent to Keronite International Ltd., Haverhill Suffolk, UK. For PSC samples, the aluminum substrate was sent to Bodycote Plc., Cheshire, UK where the Metco® 101NS Grey Alumina Powder was used. The HA samples, coatings were provided by MP Eastern Ltd., Suffolk, UK.
A special sample holder for electrochemistry tests has been designed to allow testing the materials in a more convenient way as shown in Figure 1. This holder allows both faces of the sample to be tested without using resin. An Inductively Coupled Plasma (ICP) test was performed on all the coated samples together with the aluminum substrate to assess the number of ions (Al3+) released to the 3.5% NaCl solution after 24 h of immersing the samples into the solution at different test conditions. Then, the samples were polarized up to 400 mV against the reference electrode for another 24 h. A series of electrochemistry experiments was used to evaluate the corrosion performances of three types of coatings deposited on 6082 aluminum alloy in the electrolyte of 3.5% NaCl solution. The reference electrode is sliver/sliver chloride (Ag/AgCl). The first experiment was Open Circuit Potential (OCP) tests where the potential (in Volts) was recorded against time (in seconds) for 24 h. The second experiment was direct current (DC) anodic polarization measurements which involve changing the electrode potential from its OCP in a certain direction and a given scan rate. Anodic Polarization (AP) tests are involved in measuring the scan from OCP to more positive voltages (up to 1 V from OCP) to reveal more information about the kinetics of the corrosion and its type. The determination of the corrosion current density icorr will be done graphically from the plot of E. versus Log i, which is the intersection point of two lines. The third experiment was the AC impedance test which applied to the materials using an electrochemical measurement unit called Solarton (SI 1280B). The amplitude of the sinusoidal voltage was 10 mV which was selected to keep the system linear. The measurements were performed at frequencies ranging from the high value of 20 kHz to low-frequency value of 0.1 kHz to minimize the sample perturbation.
The microstructures of the coated layers and substrates were investigated using Leica optical microscope and Scanning electron microscope (Philips XL30 ESEM environmental SEM, Leeds, UK) equipped with Oxford Instruments INCA 250 EDX system analyzer after standard methods of metallography. The substrate and the coated layers were analyzed by X-ray diffractometer, (XRD, D8 Discover with GADDS system, 35 kV, 80mA, MoKα radiation, Leeds, UK) to identify the phases.

3. Results and Discussion

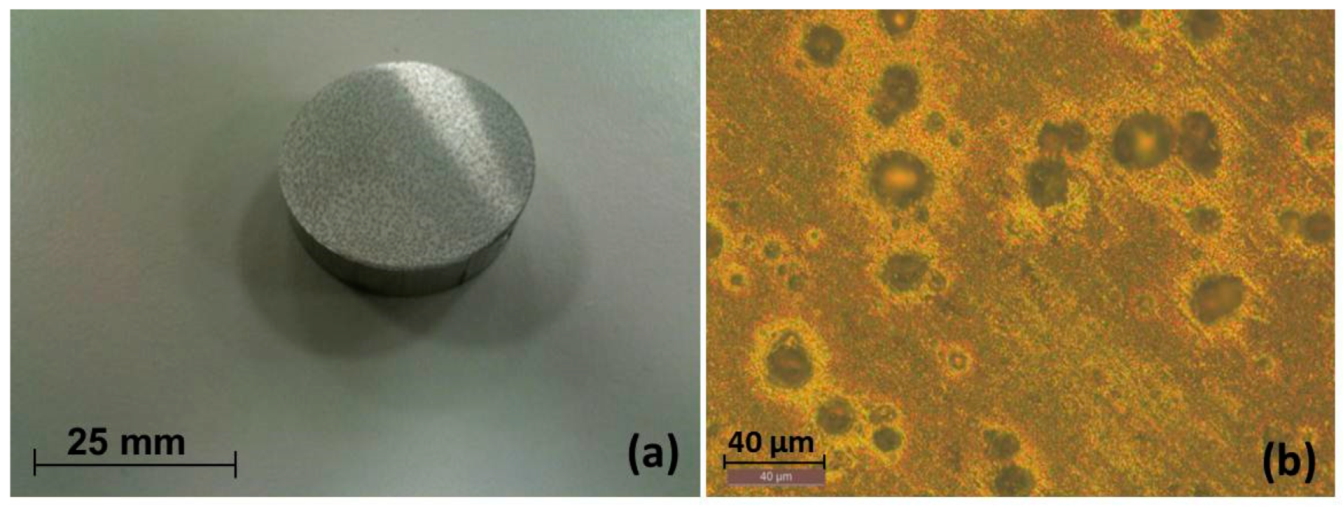
3.1. Macrol Microstructure Analysis

Figure 2 shows the microstructure of the substrate 6082-T6 aluminum alloy in polished and etched conditions. The micrographs revealed particles of different sizes distributed within the Al matrix. These particles may be the well-known intermetallics (β-Al5FeSi, Mg2Si, Al9Mn3Si, Mg2Si, α-Al(FeMn)Si) shown in this type of Al alloy [46,47]. These intermetallics support and strengthen the matrix. For that, the alloy 6082 is considered one of the highest strength of the aluminum alloys.
The cross-sectional macrostructures of the coatings are shown in Figure 3. For all the three coatings, two main distinct layers can be seen in the cross-sectional view of the coating which is inner and outer layers. For HA (Figure 3a) the inner layer is dense and is composed of a thickness of 50 µm while the outer one is more porous with 10 µm in thickness. It can be shown that HA coating is less uniform and had more porosity compared with PEO coatings (Figure 3b). For PEO coating, the inner interface layer which is dense and well adhered to the substrate. This layer composes the major part of the coatings and it has a thickness of approximately 40 µm (Figure 3b). This interface coating layer has a uniform distribution with the substrate for both of them. From Figure 3c,d, PSC coating has the largest coating thickness of about 350 µm starting with a loose layer in the interface region of 85 µm. This layer is followed with the intermediate layer of approximately 250 µm and finally the top porous layer of 55 µm. The intermediate layer contains many laminar structures with white colors which could be the aluminum substrate. The dark layer (gap) at the interface is probably due to debonding of the PSC coating from the substrate. Although the deboning can be attributed to the metallographic preparation (sectioning/polishing); it also indicates a weaker bond with the substrate.
The EDX spectra of hard anodizing reveal that the main element is oxygen followed with aluminum and sulphur which is due to the sulfuric acid (H2SO4) used in the electrolyte chemical composition during the HA process [48,49]. For PEO coatings, the main elements are aluminum, oxygen, manganese and magnesium as detected from the EDX analysis. These elements are due to the inclusion of the aluminum alloy elements. In addition, the EDX spectra showed titanium for PSC coating. The PSC coating was prepared using grey alumina powder (PSC Metco® 101NS, Cheshire, UK) which contains 2.5% of titanium dioxide according to the supplier [50].
For the XRD analysis, there are no phases detected for HA in XRD apart from aluminum element as shown in Figure 4 a,b. That is because the HA coating is amorphous in nature and is believed to be due to oxide hydration [51]. The main phases detected in the PEO coating are alumina phases (α-Al2O3, γ-Al2O3) as is shown in Figure 4c. This result is consistent with the literature where α-Al2O3 was formed on the PEO applied on aluminum alloy on the inner layer of the coating due to the high temperature during the discharge stage of the PEO process. Also, the amorphous γ-Al2O3 alumina is abundant in the outer layer which is formed during the cooling stages because of the contact between the molten alumina and the electrolyte. Similar to PEO coatings, PSC coating has α-Al2O3 and γ-Al2O3 phases but with lower intensity peaks (Figure 4d).

3.2. Electrochemistry

3.2.1. Inductive Coupled Plasma (ICP) Test

The amounts of aluminum ions (Al3+) detected from the 3.5% NaCl solutions using ICP technique after each test condition for the three coated samples are presented in Table 2. It can be seen that no ions were found in the absence of any potential applied, except at high temperature for PSC sample only. After the 80 °C free corrosion tests, the samples were immersed in the solution for another 24 h and very small amounts of Al3+ were released for both HA and PSC coatings. However, PEO coating has no charge transfer under all test conditions.

3.2.2. Mass Loss (Al3+) from Polarization Tests

The amount of aluminum alloys released after polarizing the samples up to 400 mV from the OCP in 3.5% NaCl solution for 24 h are determined using the ICP method. Figure 5 shows the potential current versus time plots to calculate charge transfer at 400 mV for HA, PEO and PSC. There was a sharp increase in the current for the first 1200 s for HA then the current stabilized and steadily increased with some fluctuation in the rest of the test period. However, the PEO coating showed a gradual increase in current density throughout the test period without any sudden increase of the current which indicates a low rate of ion transfer through the coating. Also, the current values were an order of magnitude lower. There was no stability of the current in the case of the PSC sample as a high variation of the curve occurred during the 24 h polarization test and the current was significantly high compared to the other two coatings. The first increase of the current occurred at about 1000 s from 1.5 × 10⁻² A/cm2 to 3.0 × 10⁻² A/cm2 which could be attributed to high movements of Al3+ movement through the coating due to its high porosity. However, the current increased from about 2.5 × 10⁻² A/cm2 to 5.0 × 10⁻² A/cm2 around 7000 s where it is expected that the PSC coating has completely removed from the substrate. The current fluctuation on the polarization curves for all coatings could be attributed for electrochemical activities taking place on the surfaces such as localized pitting corrosion in the substrate/coating interface region.

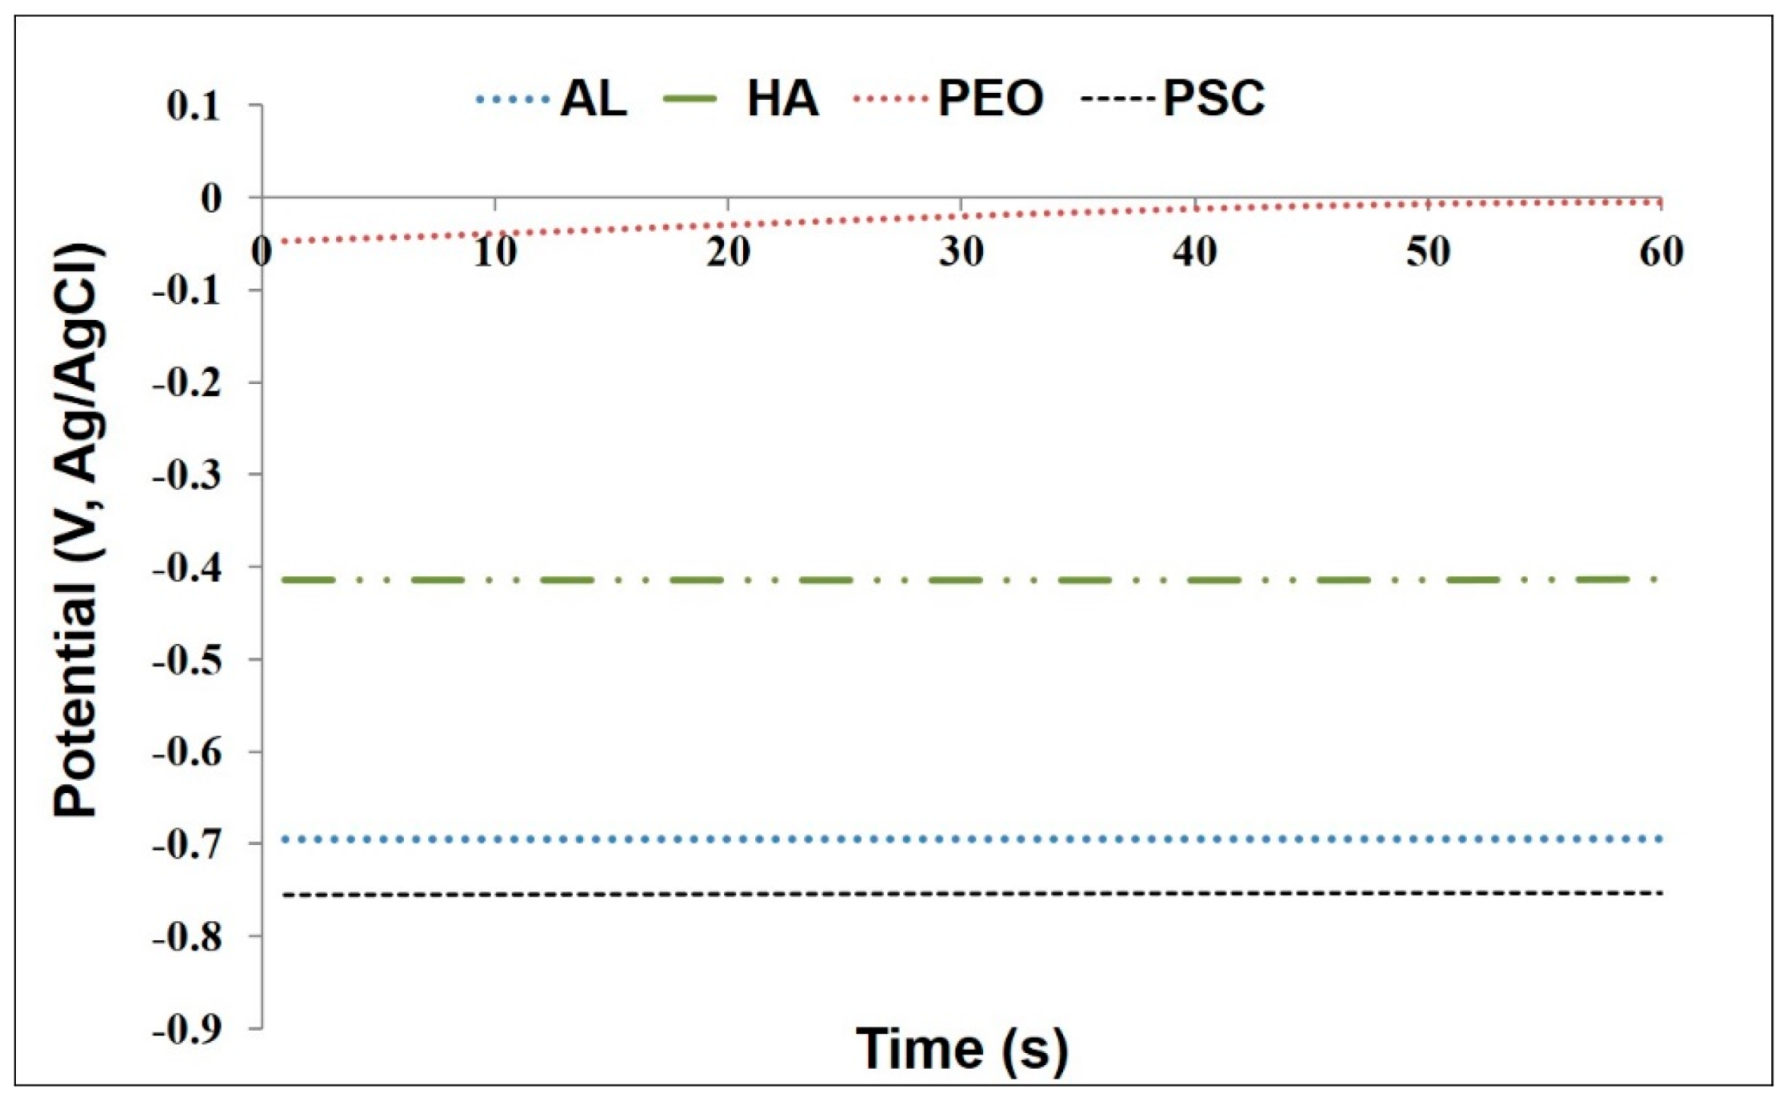
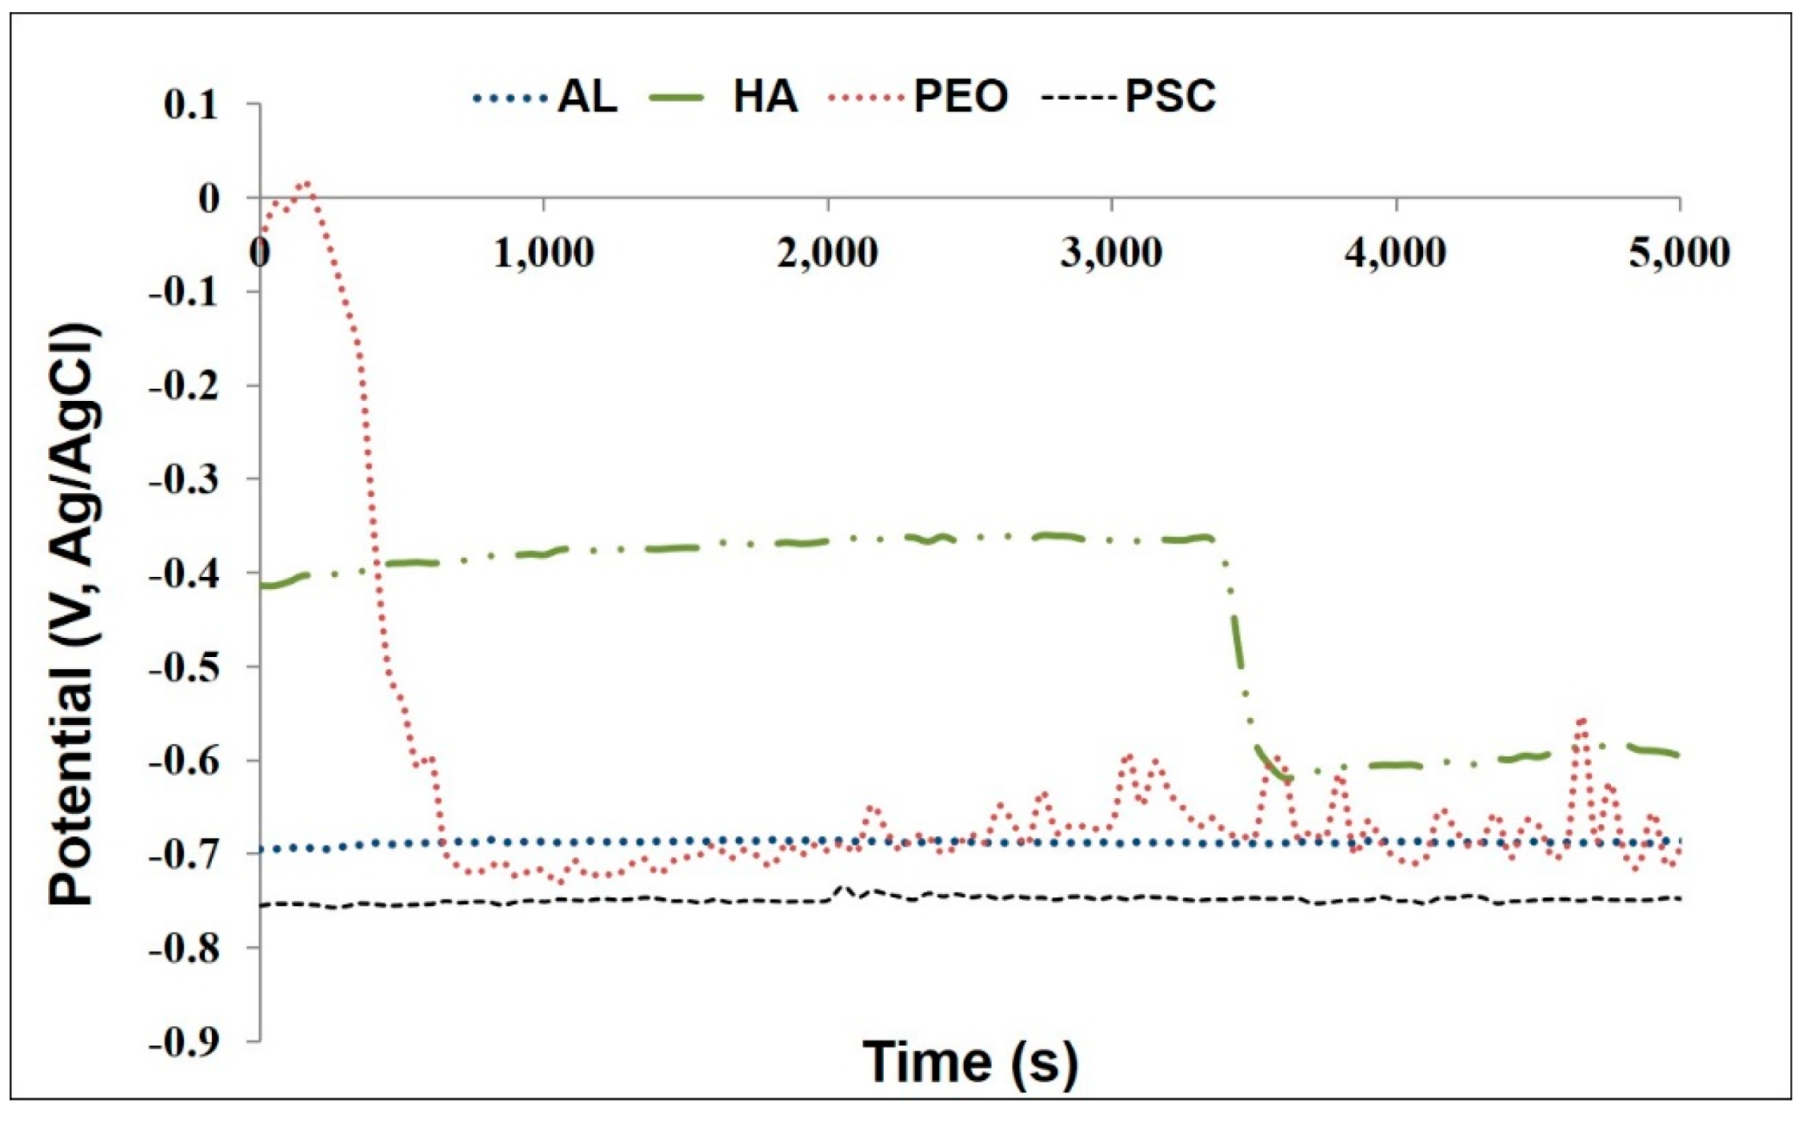
3.2.3. Open Circuit Potential (OCP) Measurements

The Open Circuit Potential (OCP) measurements were carried out for the 30 s to find the starting OCP values for all the three coating. Many measurements were made and the average values are presented in Figure 6 for all the samples. This represented the initial OCP measurements when the samples were immersed in 3.5% NaCl without applying any potential. Firstly, it can be seen that the PSC sample has the most negative OCP value of about −0.76 V followed with the Al substrate with −0.69 V. It is expected that Al has a low negative value of Ecorr since it can release three electrons per atom and consequently make the Al to be used as an anode in power sources applications. Also, it has been reported that in chloride solutions it has an Ecorr value of −0.75 V/SCE [52]. However, PEO coating has the highest starting OCP value with −0.048 nV while HA has around −0.4 V. According to [53], a high OCP value refers to better corrosion protection, which indicates the enhancements of these two coatings in the anticorrosion performances.
The OCP measurements have been extended for 5000 s, as shown in Figure 7 and it has been observed that the OCP value for the PEO sample dropped to the OCP value for the substrate after about 650 s. This sudden change in the OCP curve can indicate a rapid movement of ions through the coating part (insulator). However, the HA coating continued until approximately 3350 s then it decreased sharply to the OCP value for Al. The rapid decrease of the OCP value for PEO coating compared with the HA coating could be due to the difference in coating thickness where HA (42 µm) is higher than PEO (34 µm) which increase the resistance of Al3+ ions to penetrate through the coating [54]. However, the OCP value of the PSC coating keeps constant at a lower value than the OCP of the aluminum throughout the time of immersion.
In general, anodic areas are, at least in the early stages, much smaller than cathodic areas. So, in the early stages, the corrosion potential is more positive. However, with an increase in anodic sites during immersion, the corrosion potential becomes more negative.

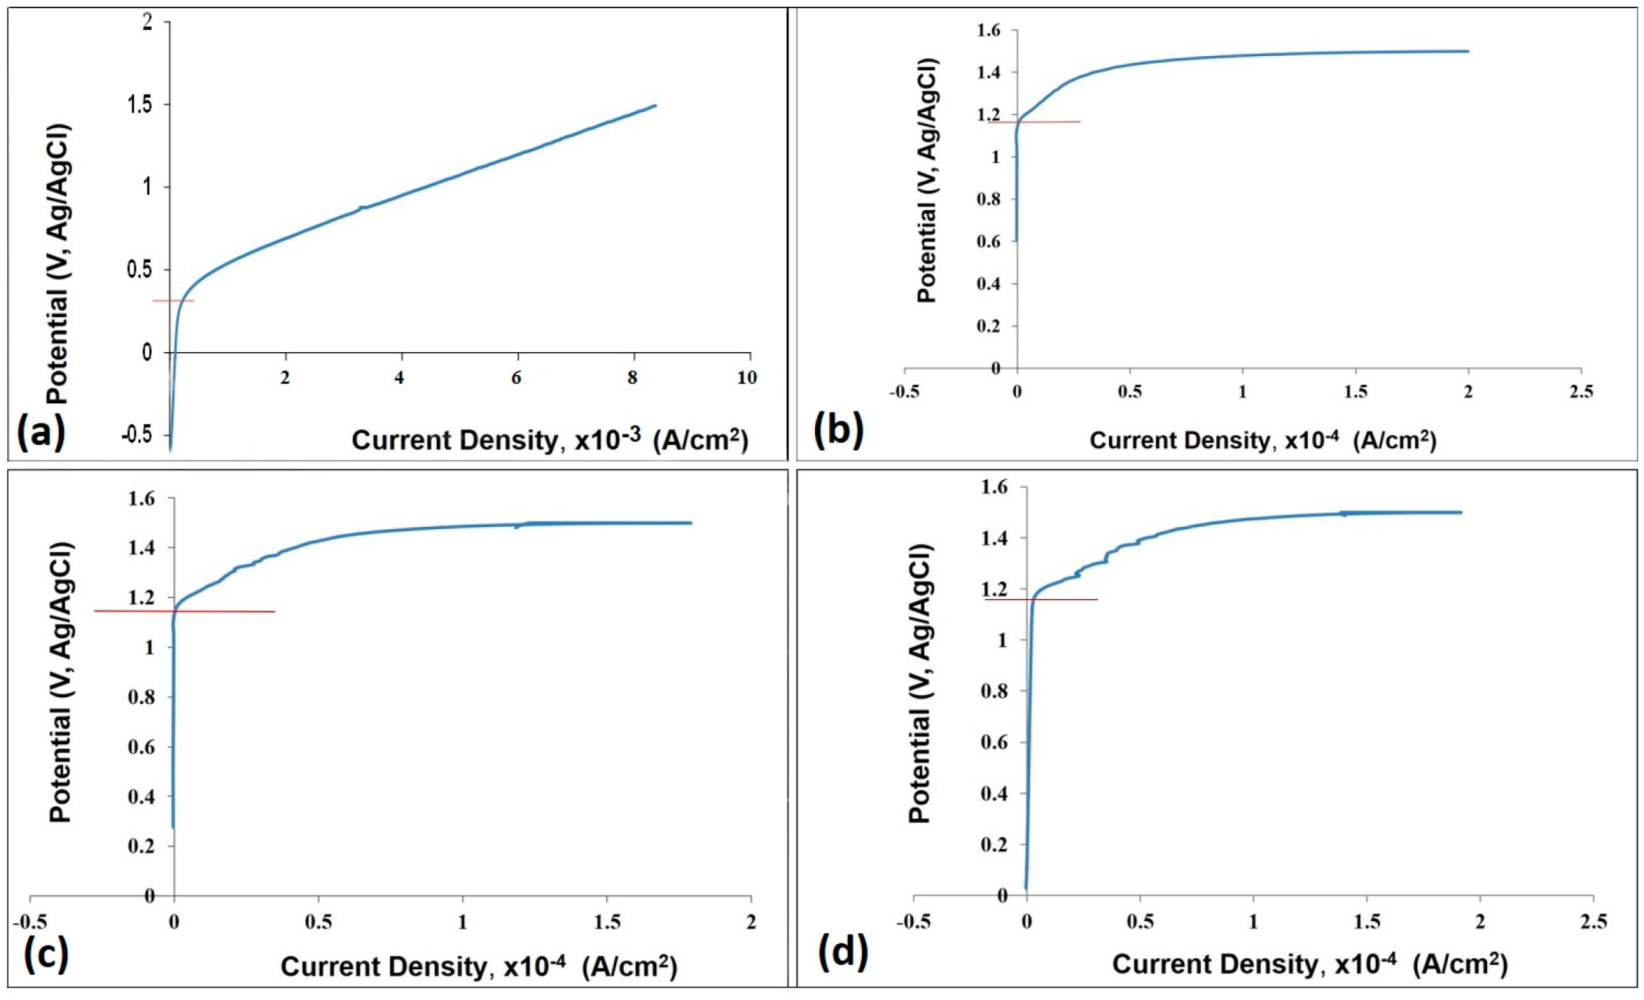
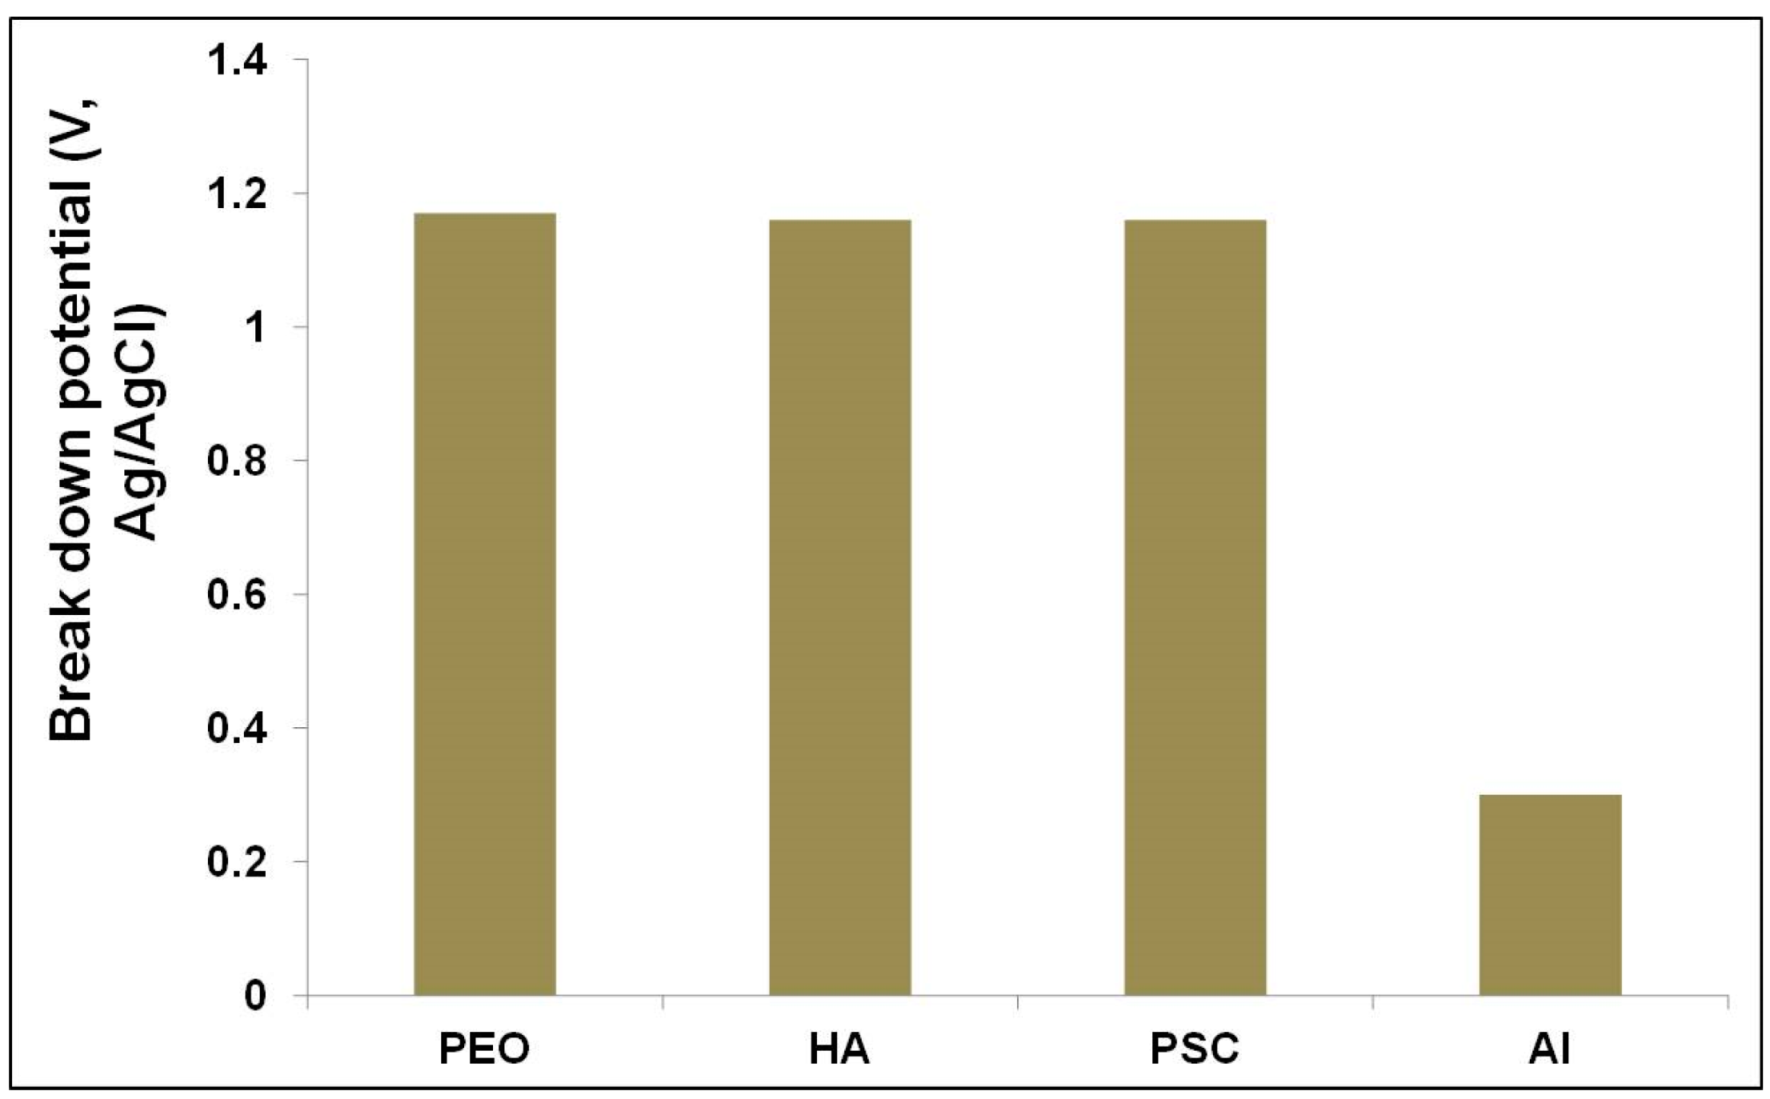
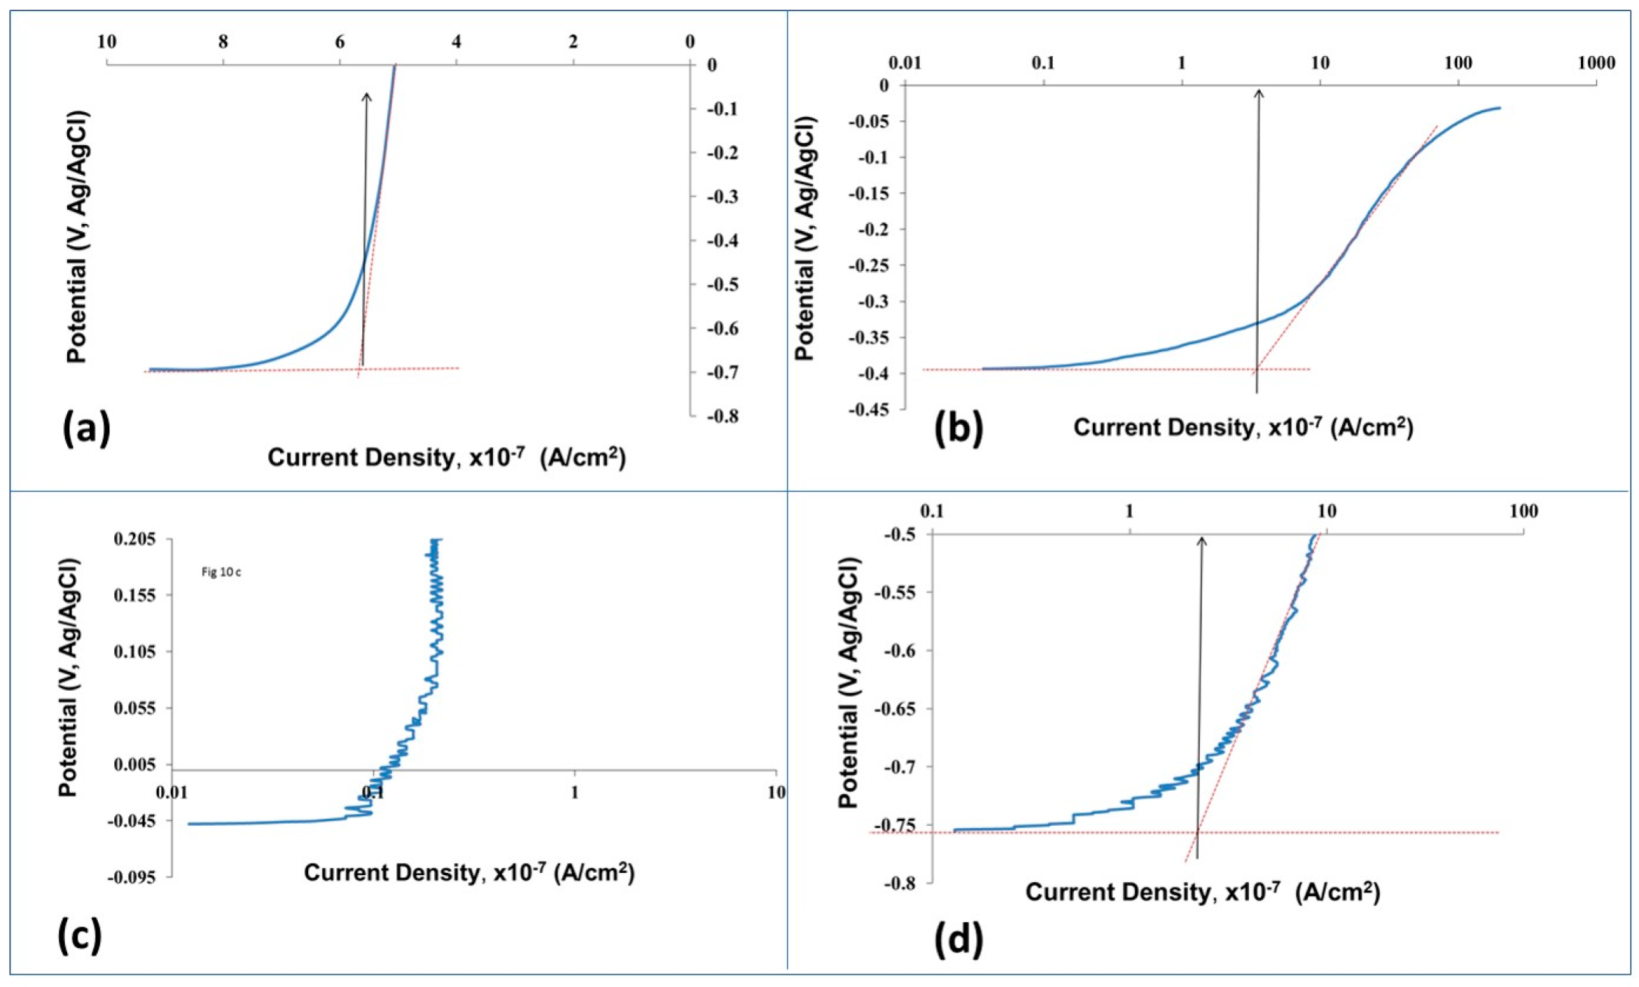
3.2.4. Anodic Polarization (AP) Resistance

The results of the AP resistance for all materials Al, HA, PEO and PSC samples are shown in Figure 8. The breakdown potential (Eb) is the potential where the passive film of the surface breaks down. It is expected that the coatings would decrease the possibility of breaking down the aluminum passive film and consequently decrease the current density and improve the corrosion resistance. Eb can be obtained from the AP curve (E. vs. i) where the current density increases sharply after this point. If there is no crevice corrosion, Eb refers to the pitting corrosion. However, Eb for the ceramic materials indicates the penetration of the electrolyte ions through the coating defects to the substrate metal. As a result, material’s failure can be formed as localized pitting corrosion. When the potential reaches a voltage of ±1000 mV from OCP or reaching a given magnitude of current density (referred to as the threshold current), the potential decreased towards the OCP value. The breakdown voltages for all the materials systems can be determined from the anodic polarization curves at the potential value where the current increased rapidly and deviated from the initial growing rate. The values of the breakdown potentials of the materials were determined from the plots and the red lines in these graphs are just to show the method and not indicating the exact Eb values. These values are summarized in Figure 9.

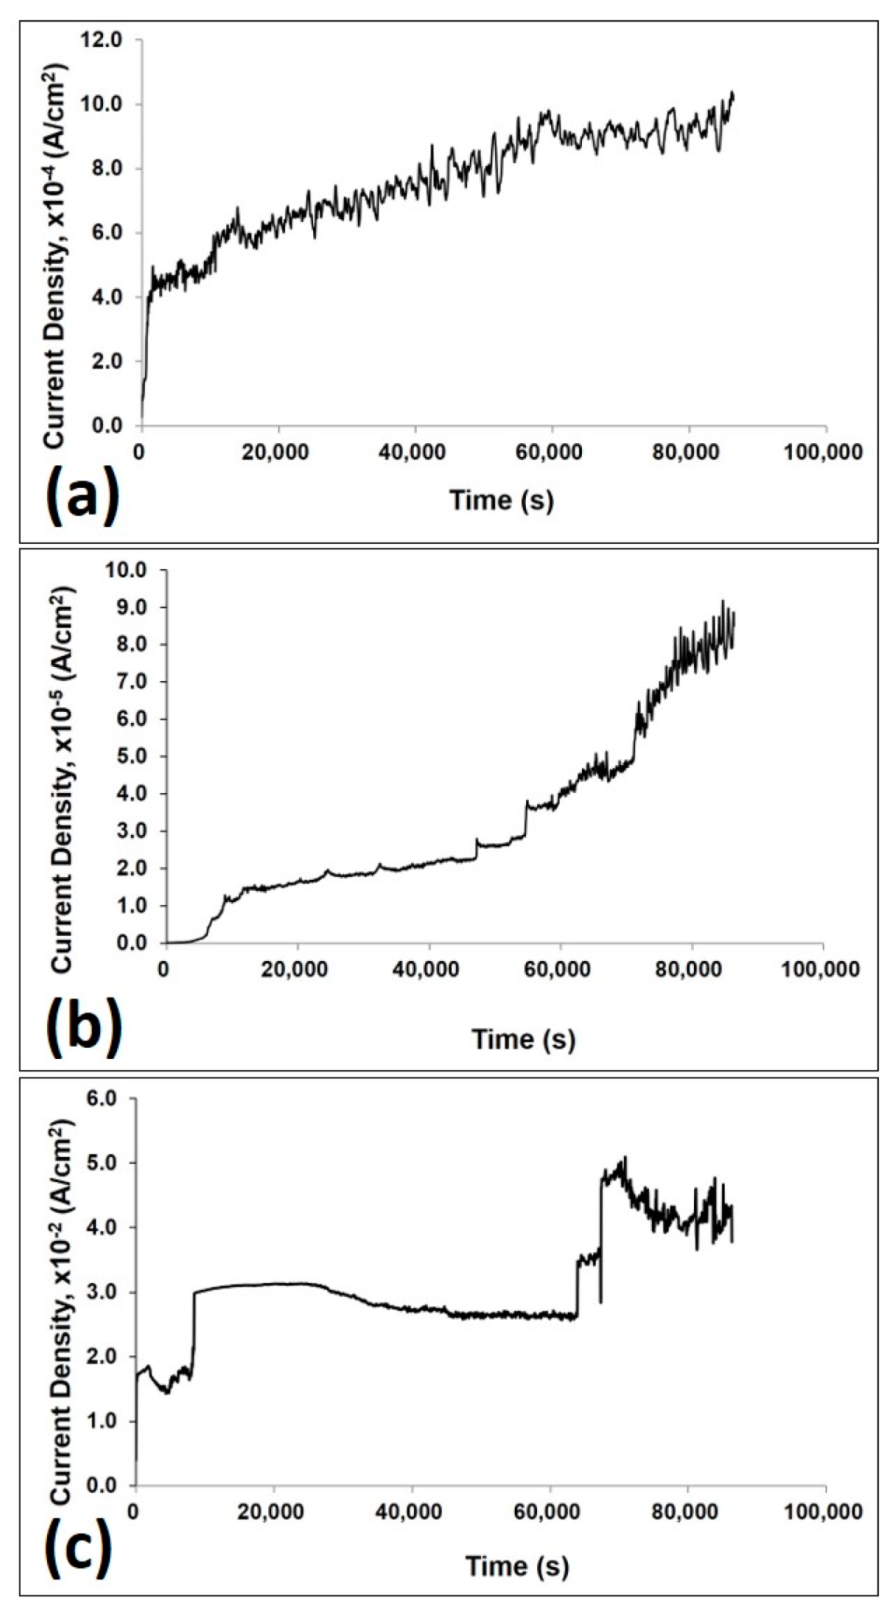
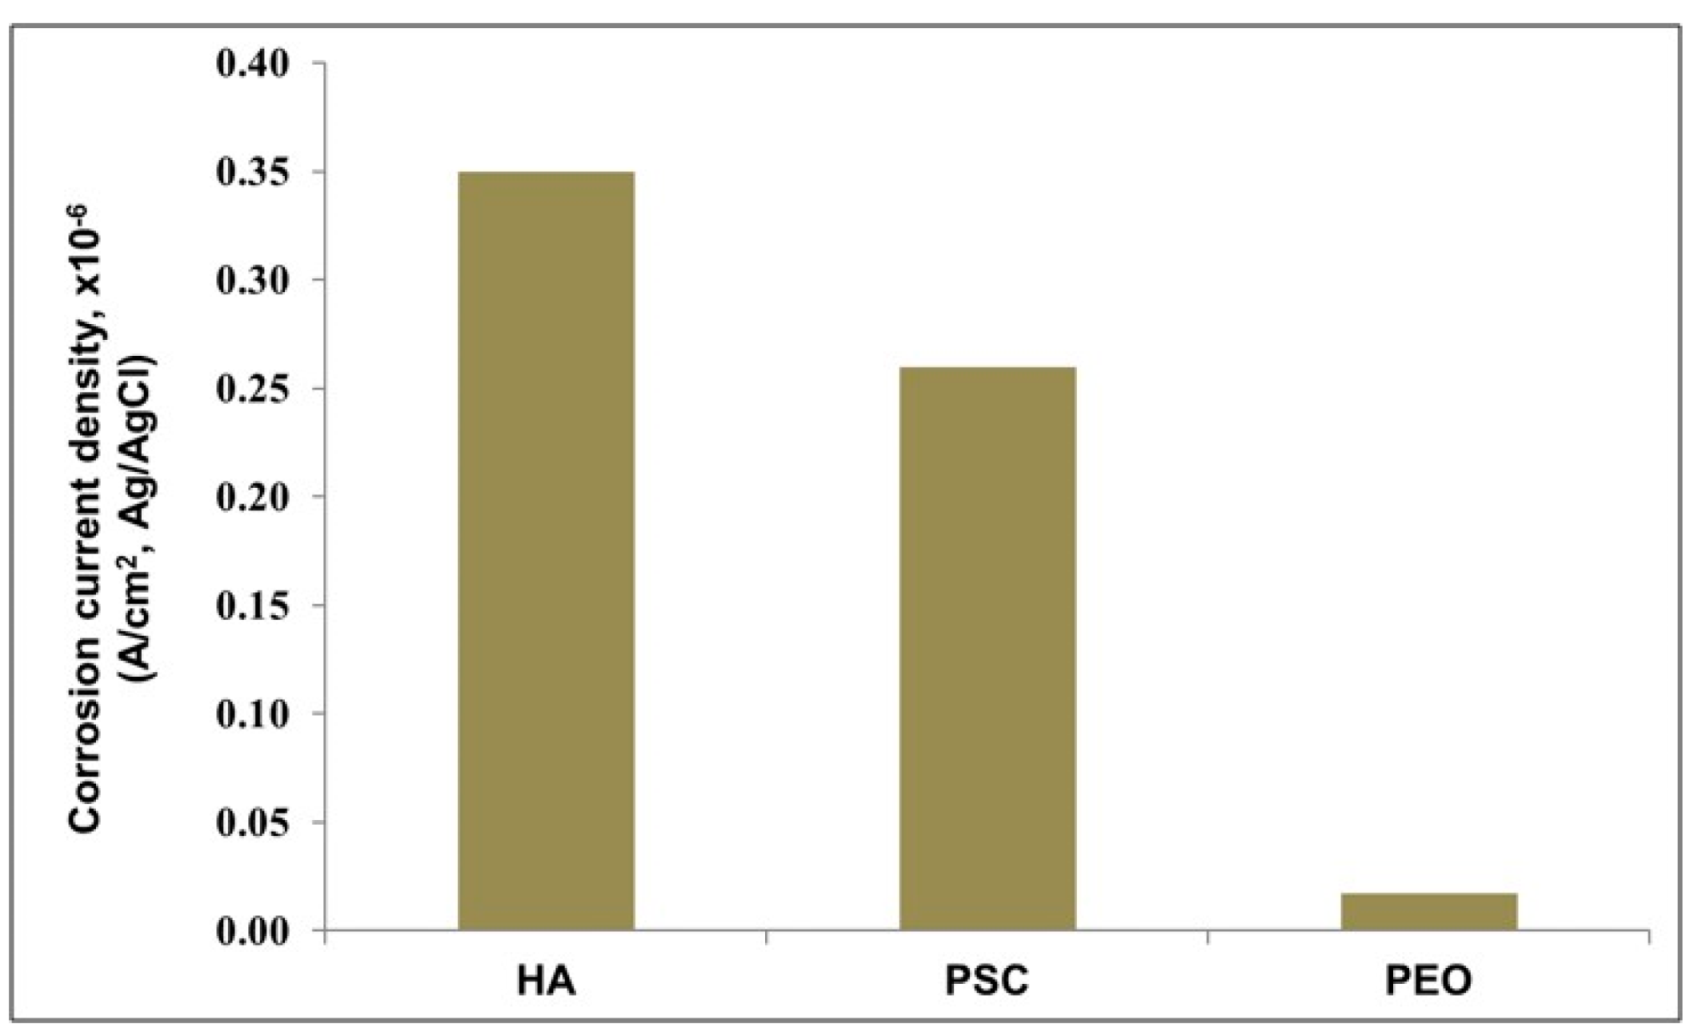
3.2.5. Corrosion Current Density

The corrosion current densities for the materials tested in this study were determined from the logarithmic scale of the current density in the anodic polarization curves as shown in Figure 10. The potential was shifted from the OCP value of the material to 250 mV in the opposite direction to ensure that the cathodic and anodic currents are different to measure the corrosion current density on the sample by extrapolating the anodic branch line from OCP value. Also, a comparison of the corrosion current density (icorr) between all the coated materials is shown in Figure 11. The result of Al substrate was not included due to the huge difference values of icorr between the aluminum substrate and other coatings. It is clear form this comparison chart that the PEO coating showed the lowest corrosion current density followed by HA and then PSC coatings.

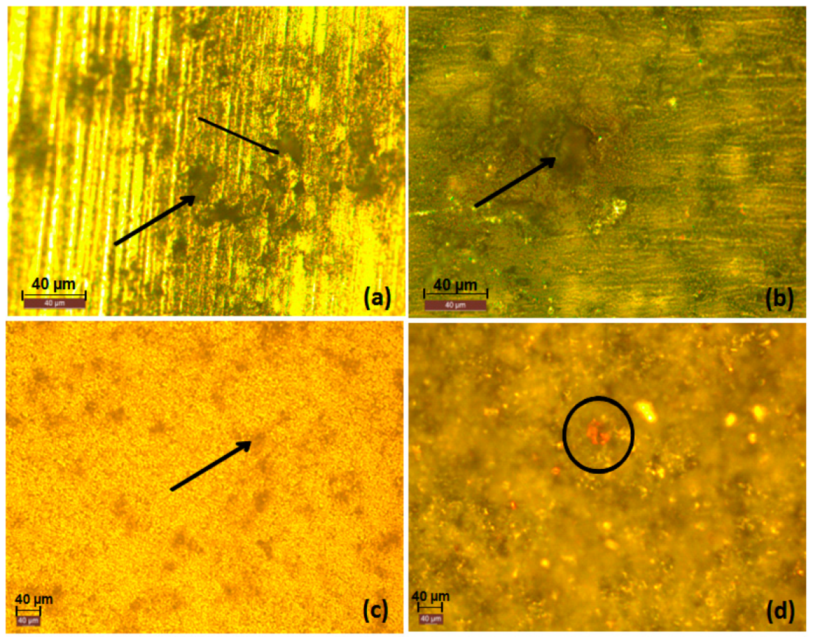
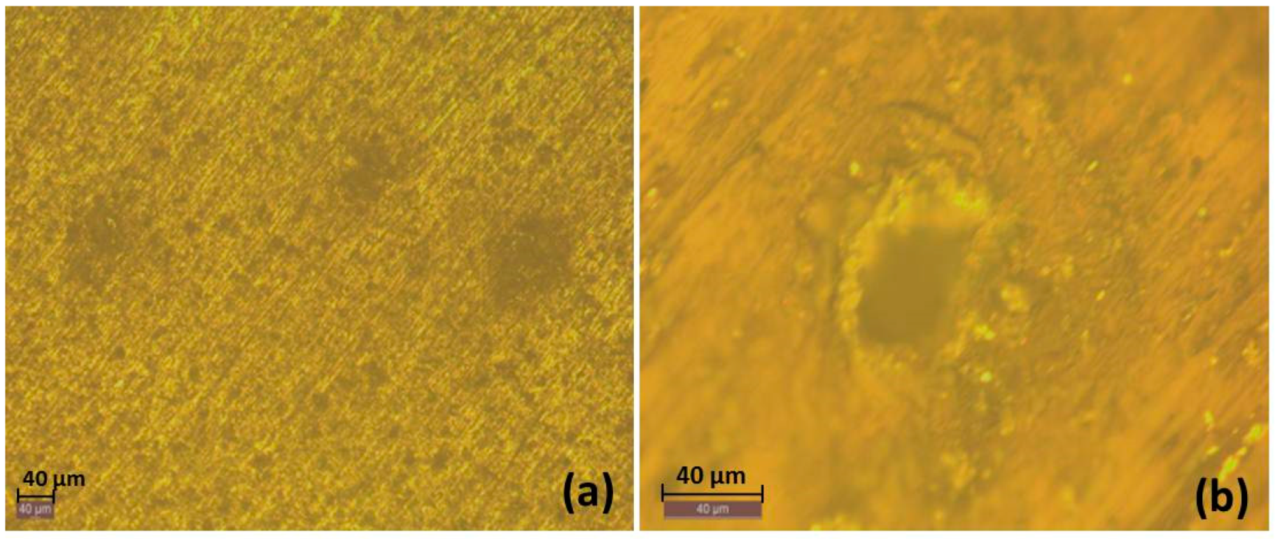
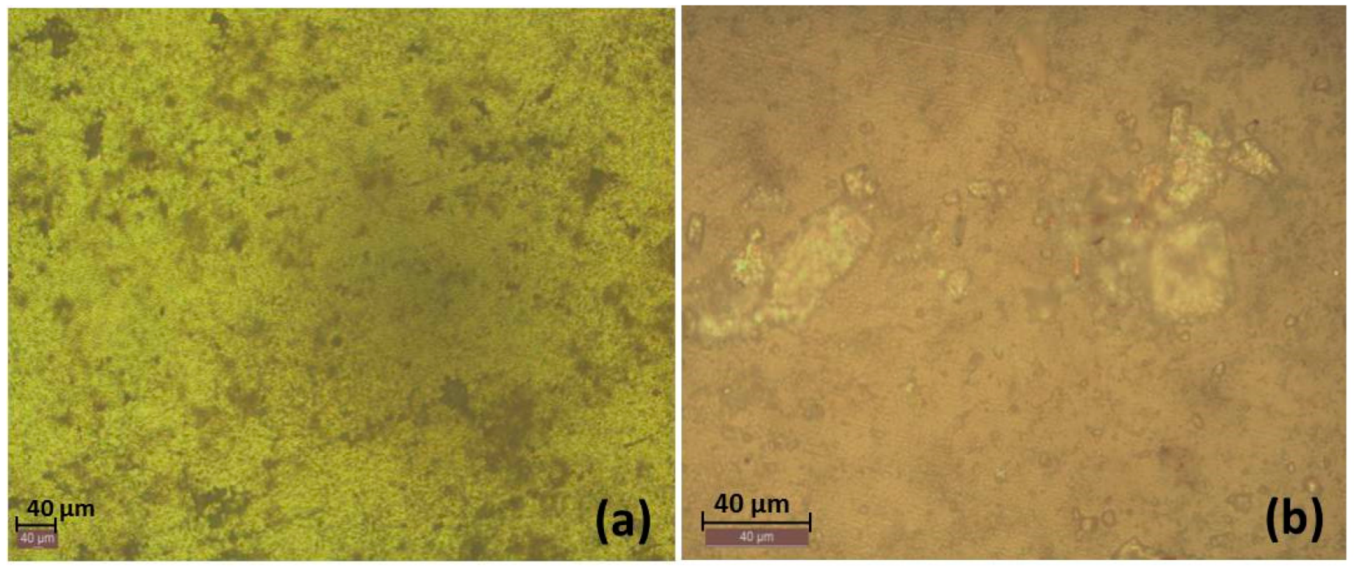
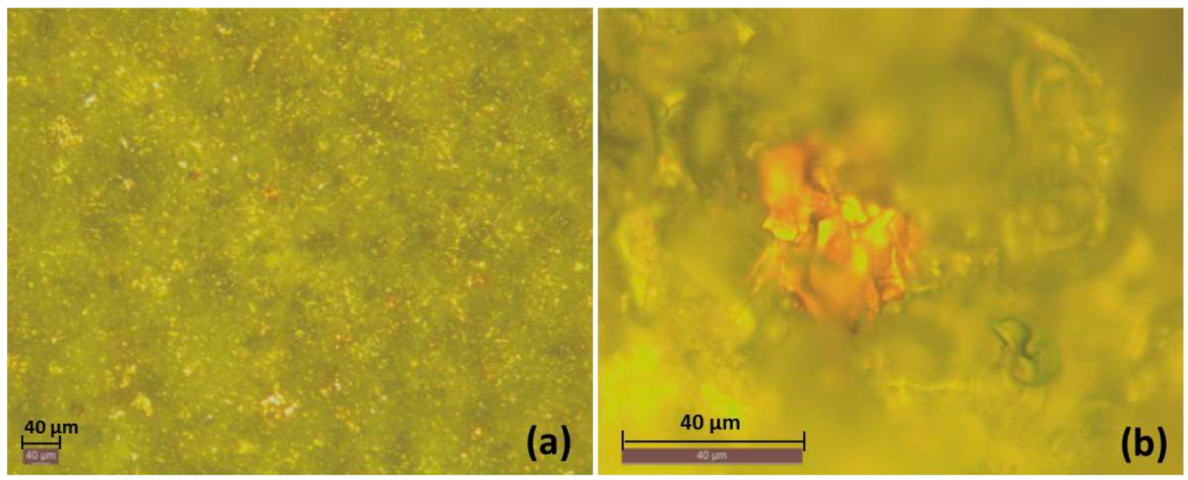
3.2.6. Optical Images of the Surfaces after Polarization tests

Figure 12 shows the surface behavior of the tested materials after Polarization scan in 3.5% NaCl solution. The aluminum surface (Figure 12a) has wide corrosion attack in the form of pits (see arrows). However, HA and PEO samples (Figure 12b,c, respectively) have fewer corrosion defects on the exposed surfaces. Regarding the PSC sample, a significant number of white spots (Figure 12d) on its surface can be seen which correspond to the aluminum substrate. From all these figures, the aluminum surface had more corrosion products as large-scale pits were initiated on its surface after the polarization test.
Table 3 summarizes the main corrosion parameters of the materials that were determined by the DC electrochemistry plots (anodic polarization curves). Therefore, PEO coating has lower corrosion current density (1.7 × 10⁻⁸ A/cm2) than the HA coating (3.5 × 10⁻⁷ A/cm2) and PSC coating (2.6 × 10⁻⁷ A/cm2) under static anodic polarization tests.

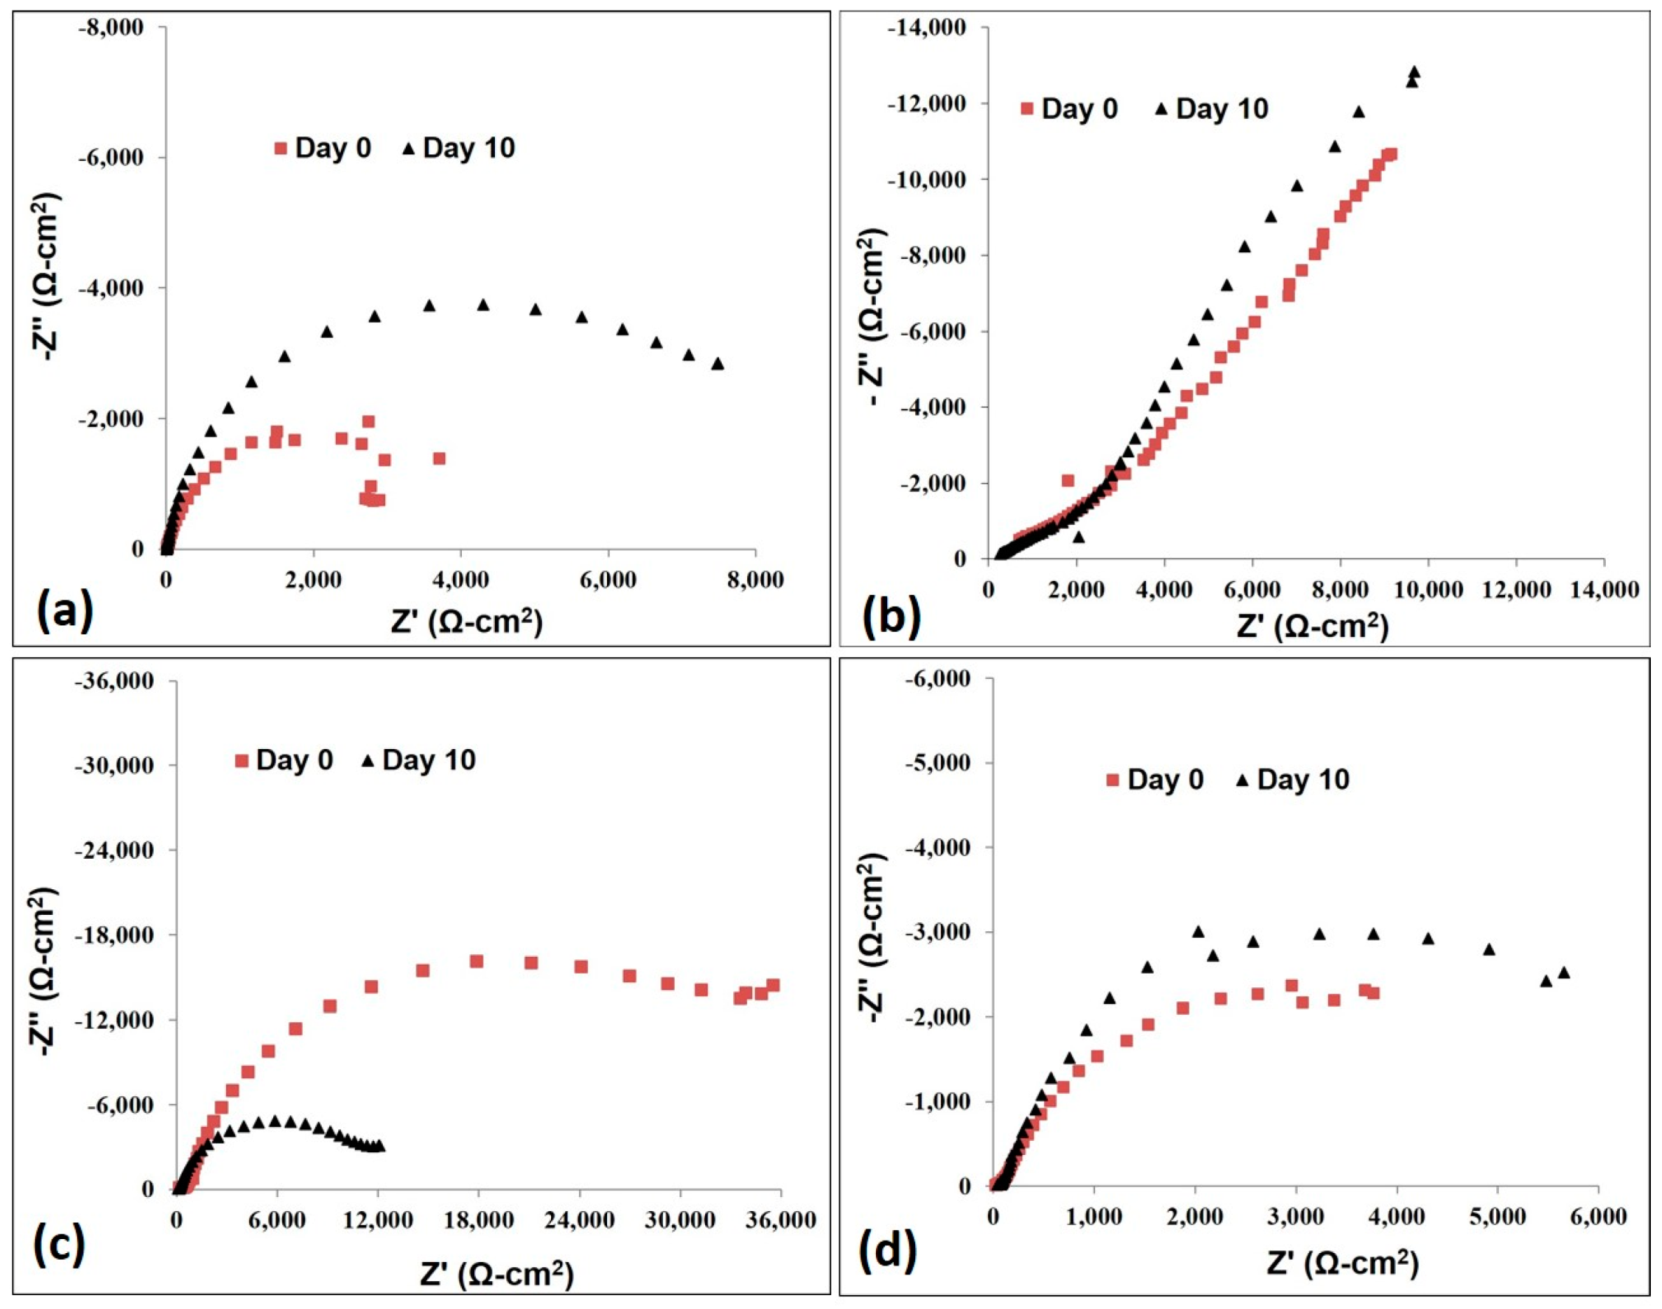
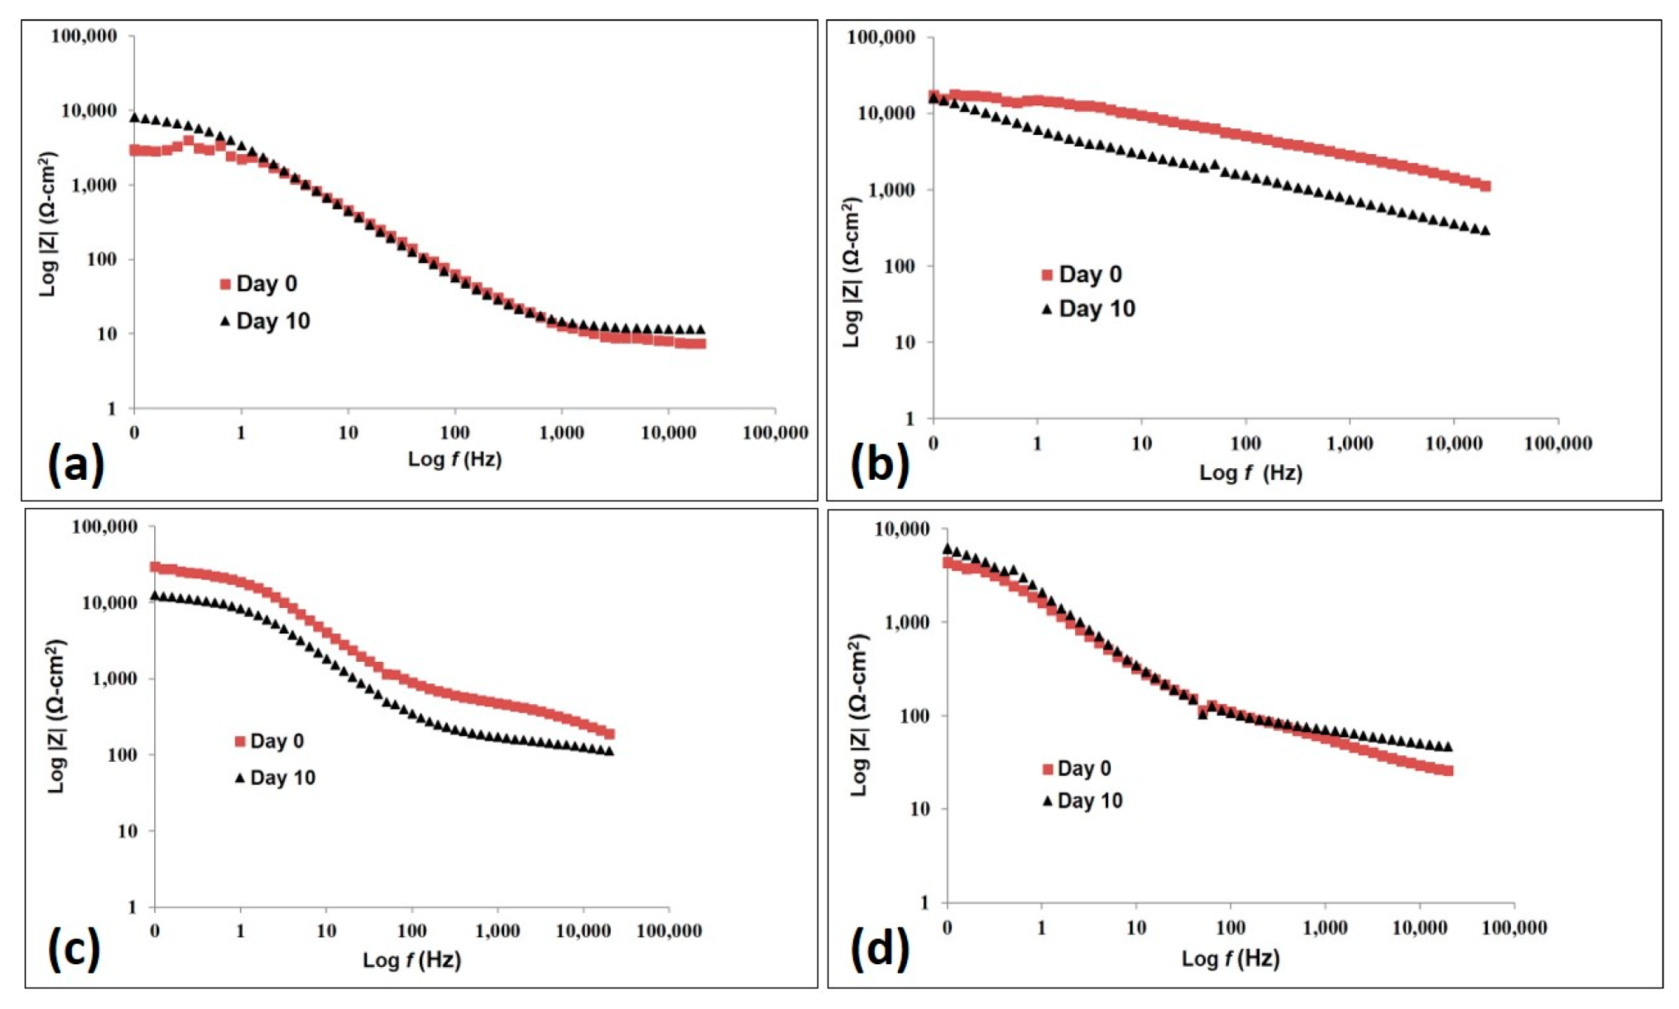
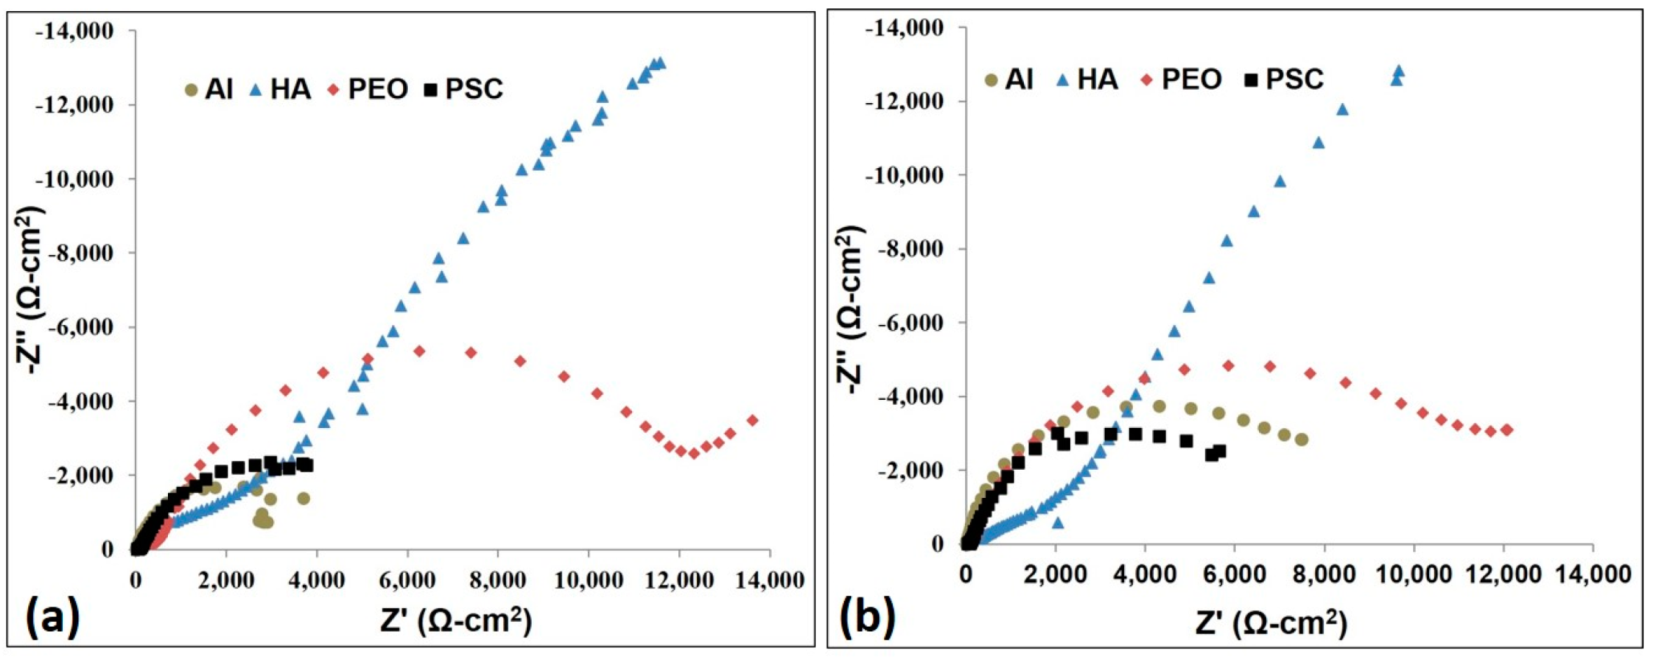
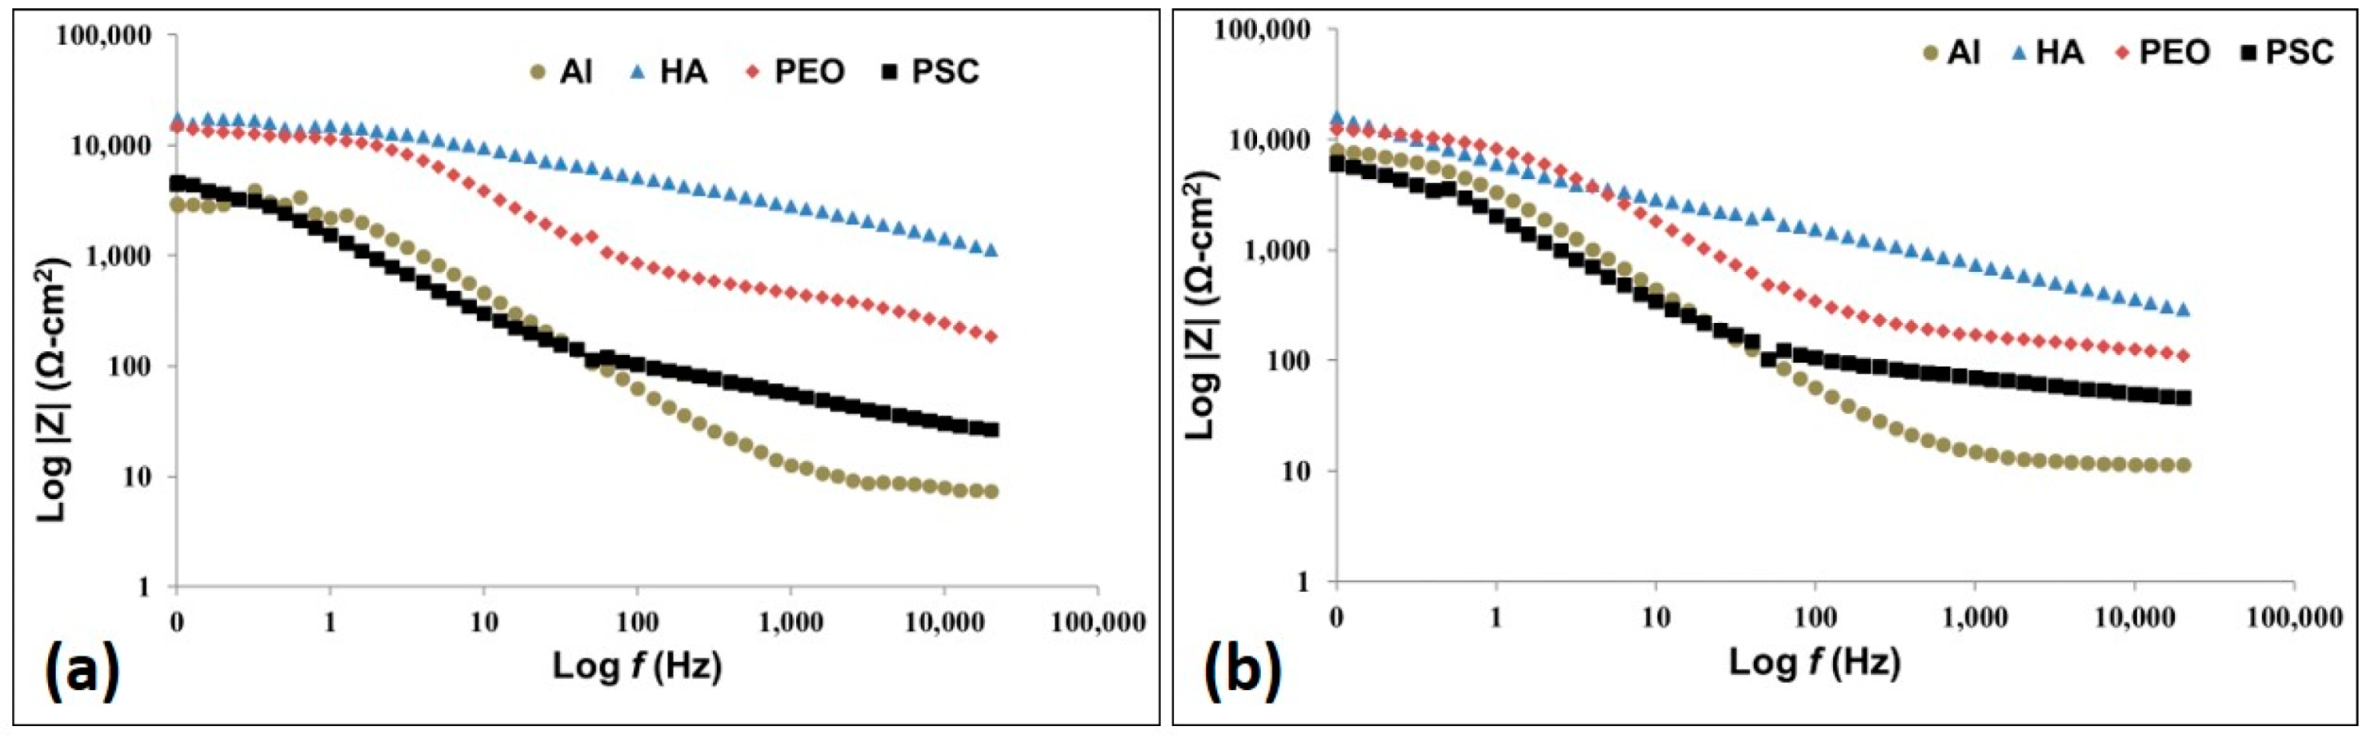
3.2.7. AC Impedance Test

The Nyquist plots for all materials are presented (Figure 13 and Figure 14) for 10 days of immersion the samples in 3.5% NaCl solution to study the stability of the materials (aluminum passive film of the substrate and coating part of the other materials) and observe the change in the total resistance during the long exposure period. Also, the impedance data of the materials were fitted with equivalent circuit models using ZView software (Ametrek, NC, USA).
The impedance of all spectra from Day 0 and Day 10 of the Al substrate exhibits a capacitive behavior pattern (single semicircle) as shown in Figure 13a. At initial immersion, the aluminum has the highest value of the total resistance (Rtot) which is corresponding to the large difference in the imaginary impedance after 24 h of immersion. The charge transfer resistance seems to increase as the exposure time increases and the maximum Rtot (maximum radius) is observed at day 10 (Figure 13a). Also, the highest peak in the Bode diagram is recorded on the last day as in Figure 14a. Therefore, it is consistent with the increase in the radius in Nyquist plots over the entire period. Many cavities with different sizes, some of them can be seen by eyes (Figure 15a), were formed on the passive aluminum surface due to the contact of the corrosive aqueous media (3.5% NaCl). Although the mechanism of the pitting corrosion is not fully understood, it can be explained by two consequent stages. Firstly, the pits are developed due to the adsorption of chloride ions Cl on the oxide film which cracks at weak areas causing micro-cracks and these pits get re-passivated as in Figure 15b. The intermetallic phases under the oxide layer have a low oxygen level driving the aluminum to by highly oxidized at the film broken sites. Secondly, the pits propagate due to the oxidation at the anode site (inside the pit) and the reduction at the cathode suite (outside the pits).
The AC Nyquist spectra for HA for all the period exhibited capacitive behavior (Figure 13b). Also, the stability of the capacitive behavior of HA is related to the high corrosion resistance of the HA coating. However, the slight decrease of the capacitive response at Day 10 (Figure 14b) could indicate the dissolution of the coating thickness or high porous coating was formed to allow electrolyte ions movements through the coated part [54]. For the surface behavior of HA sample after AC impedance test, different sizes of pits have been initiated on HA surface after 10 days of immersion the sample in 3.5% NaCl as shown in Figure 16. Similar pits were found in an anodized aluminum surface after a polarization test in 0.5 M NaCl solution performed by Ren et al. [55], which indicates penetration defect in the anodic film.
Regarding the AC impedance of the PEO coating, as shown in Figure 13c and Figure 14c, there is an arc at the high frequency side with a change to a diffusion tail at the low frequency side. The starting peaks of the impedance in the Bode magnitude plot is the highest for PEO sample in the initial immersion time. The drop of the starting peak after 10 days of the immersion (Figure 14c) indicates a change in the corrosion process taking place in the interface layer between the Al substrate and PEO coating during this period. The surface behavior of PEO coating after AC tests is shown in Figure 17. General corrosion products on the PEO surface is shown in Figure 17a while some materials degradation take place as shown in the magnified image in Figure 17b.
The arc radius in the Nyquist plot of PSC coating was slightly increased after the full period of immersion test (Figure 13d). This corresponds to the minimal change in the total resistance from the Bode plot shown in Figure 14d. The aluminum substrate can be seen after the corrosion test (Figure 18) which indicates that a relatively high amount of PSC coating degradation has occurred due to this chemical reaction.
The Nyquist and Bode curves for all tested materials have been combined in one plot to compare their AC impedance spectra. The Nyquist and Bode plots for all materials at the initial and after 10 days measurements are shown in Figure 19 and Figure 20, respectively. It can be seen that both Al and PSC have depressed one semicircle, which means that only one-time constant has occurred in the system for both of them. This corresponds to one single peak in the Bode plot for Al and PSC. On the other hand, the PEO sample has two-time constants while HA has an infinite curve which is the behavior of a capacitive response. This capacitive form of HA indicates the stability of the coating passive film. After 10 days of immersion, the samples in the 3.5% NaCl solution, the Nyquist and Bode plots were obtained; and they are represented in Figure 19b and Figure 20b, respectively.
From the Bode magnitude plots, it can be seen that for all the material systems, the impedance resistance |Z| decreases as the immersion time increases; this indicates that material degradation is taking place in the protective nature of the coatings. This decrease makes the response less capacitive behavior which indicates that the solution ions penetrated through the pores in the coating to the substrate as the time of the immersion increased [54]. The sudden alteration of the |Z| versus frequency curve (Bode plot) is related to the coating degradation and significant changes in coating capacitance Cc and coating resistance Rc are noticed. The coating resistance slowly decreases when coating capacitance increases. This can be attributed to the higher porosity of the coating, which then creates heterogeneities in the coating and makes the water maneuver easier.

4. Conclusions

This research has investigated the enhancements of different ceramic coatings (Plasma Electrolytic Oxidation (PEO), Plasma Spray Ceramic (PSC) and Hard Anodizing (HA)) on the performances of 6082-T6 aluminum alloy surface against corrosion environments. Coatings properties have been characterized using various metallurgical tools. A series of electrochemistry experiments were used to evaluate the corrosion performances of the three types of coatings. It has been shown that the corrosion performances of aluminum alloy can be highly increased using different surface treatments. PEO coating gives a higher level of corrosion resistance compared to the HA and the PSC coatings. The findings are summarized as follows:
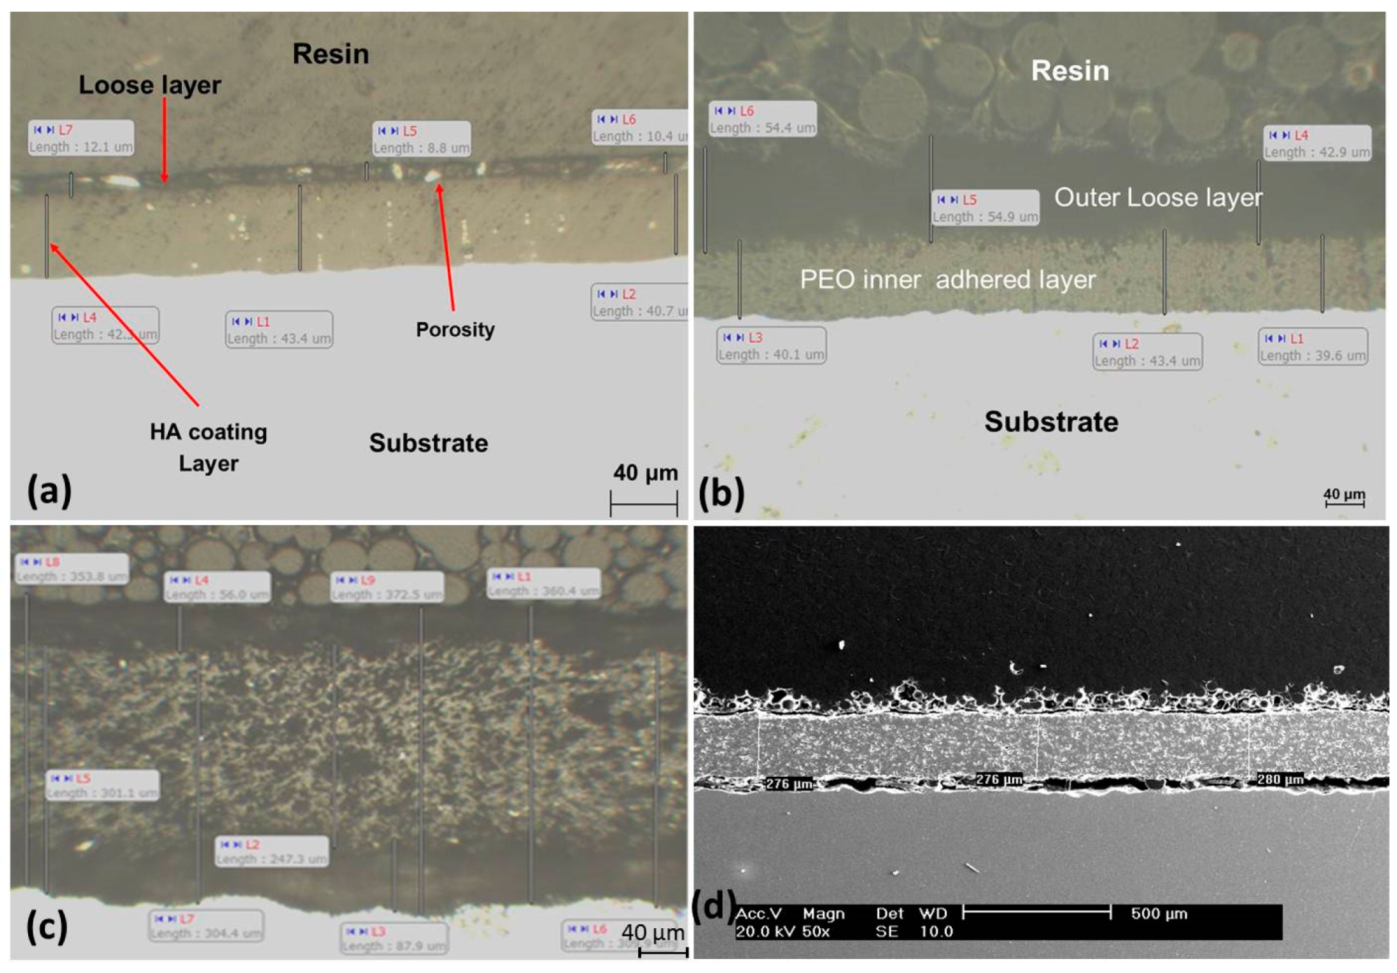
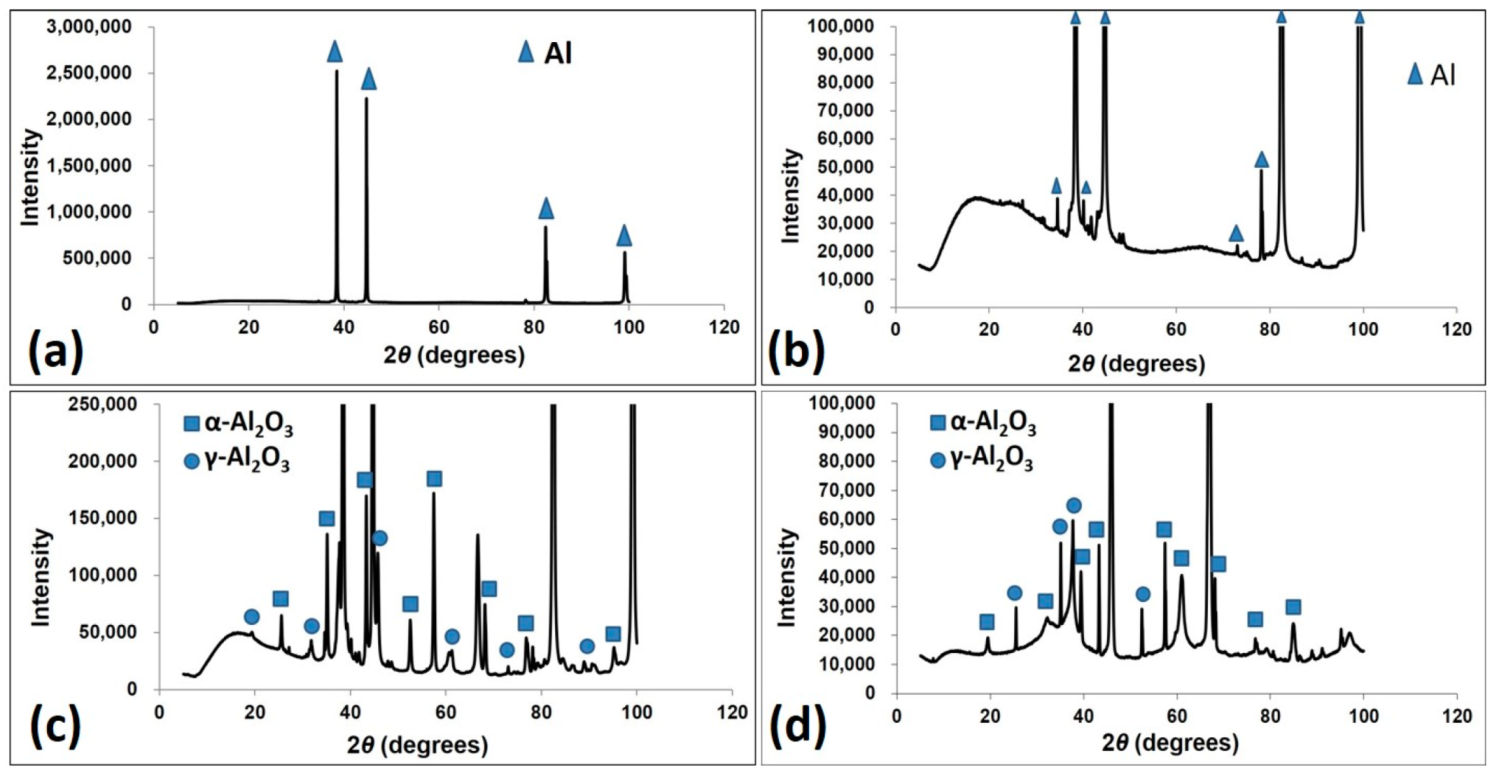
  • PEO coatings are denser, more uniform and well adhered to the substrate compared to the HA and the PSC coatings and show crystalline alumina phases (α-Al2O3, γ-Al2O3) structure.
  • The PEO coating has the lowest amount of aluminum ions (Al3+) released from the coating samples after immersion in 3.5% NaCl solution for 24 h followed with HA then PSC samples.
  • The impedance decreases as the immersion time increases. It is concluded that this is due to the degradation and deterioration of the protective coatings.
  • All the three coatings (PEO, HA and PSC) have better corrosion resistance than the aluminum substrate.

Author Contributions

Conceptualization, A.A.; Methodology, E.R.I.M and S.Z.K.; Validation, V.T.; Formal Analysis, A.A., E.R.I.M. and S.Z.K.; Investigation, V.T.; Data Curation, A.A.; Writing—Original Draft Preparation, E.R.I.M. and A.A.; Writing—Review & Editing, E.R.I.M. and S.Z.K.; Supervision, A.A.; Project Administration, A.A.; Funding Acquisition, A.A.

Funding

This research was funded by [Scientific Research Deanship, King Khalid University (KKU)] grant number [G.R.P.2/6/38].

Acknowledgments

Authors thankfully acknowledge the funding and support provided by the Scientific Research Deanship, King Khalid University (KKU), Abha-Asir, Saudi Arabia, with grant number G.R.P.2/6/38 under the research group “Materials & Production” to complete the research work.

Conflicts of Interest

The authors declare no conflict of interest.

References

  1. Mraied, H.; Cai, W.; Sagüés, A.A. Corrosion resistance of Al and Al–Mn thin films. Thin Solid Film 2016, 615, 391–401. [Google Scholar] [CrossRef] [Green Version]
  2. Navaser, M.; Atapour, M. Effect of Friction Stir Processing on Pitting Corrosion and Intergranular Attack of 7075 Aluminum Alloy. J. Mater. Sci. Technol. 2017, 33, 155–165. [Google Scholar] [CrossRef]
  3. De Bonfils-Lahovary, M.; Laffont, L.; Blanc, C. Characterization of intergranular corrosion defects in a 2024 T351 aluminum alloy. Corros. Sci. 2017, 119, 60–67. [Google Scholar] [CrossRef]
  4. She, H.; Chu, W.; Shu, D.; Wang, J.; Sun, B. Effects of silicon content on microstructure and stress corrosion cracking resistance of 7050 aluminum alloy. Trans. Nonferrous Met. Soc. China 2014, 24, 2307–2313. [Google Scholar] [CrossRef]
  5. Panagopoulos, C.N.; Georgiou, E.P. Corrosion and wear of 6082 aluminum alloy. Tribol. Int. 2009, 42, 886–889. [Google Scholar] [CrossRef]
  6. El-Mahdy, G.A.; Kim, K.B. AC impedance study on the atmospheric corrosion of aluminum under periodic wet-dry conditions. Electrochim. Acta 2004, 49, 1937–1948. [Google Scholar] [CrossRef]
  7. Nascimento, M.P.; Voorwald, H.J.C. Considerations on corrosion and weld repair effects on the fatigue strength of a steel structure critical to the flight-safety. Int. J. Fatigue 2010, 32, 1200–1209. [Google Scholar] [CrossRef]
  8. Olajire, A.A. Corrosion inhibition of offshore oil and gas production facilities using organic compound inhibitors—A review. J. Mol. Liq. 2017, 248, 775–808. [Google Scholar] [CrossRef]
  9. Wood, R.J.K. Tribo-corrosion of coatings: A review. J. Phys. D Appl. Phys. 2007, 40, 5502–5521. [Google Scholar] [CrossRef]
  10. Ibatan, T.; Uddin, M.S.; Chowdhury, M.A.K. Recent development on surface texturing in enhancing tribological performances of bearing sliders. Surf. Coat. Technol. 2015, 272, 102–120. [Google Scholar] [CrossRef]
  11. Kwok, C.T.; Man, H.C.; Cheng, F.T.; Lo, K.H. Developments in laser-based surface engineering processes: with particular reference to protection against cavitation erosion. Surf. Coat. Technol. 2016, 291, 189–204. [Google Scholar] [CrossRef]
  12. Bebelis, S.; Bouzek, K.; Cornell, A.; Ferreira, M.G.S.; Walsh, F.C. Highlights during the development of electrochemical engineering. Chem. Eng. Res. Des. 2013, 91, 1998–2020. [Google Scholar] [CrossRef]
  13. England, G. Surface Engineering in a Nutshell. Available online: http://www.surfaceengineer.co.uk/ (accessed on 10 November 2017).
  14. Wang, C.; Bai, S.; Xiong, Y. Recent advances in surface and interface engineering for electrocatalysis. Chin. J. Catal. 2015, 36, 1476–1493. [Google Scholar] [CrossRef]
  15. Zhang, X.; Chen, W. Review on corrosion-wear resistance performances of materials in molten aluminum and its alloys. Trans. Nonferrous Met. Soc. China 2015, 25, 1715–1731. [Google Scholar] [CrossRef]
  16. Chi, Y.; Gu, G.; Yu, H.C.; Chen, C. Laser surface alloying on aluminum and its alloys: A review. Opt. Lasers Eng. 2018, 100, 23–37. [Google Scholar] [CrossRef]
  17. Morks, M.F.; Corrigan, I.C.P.; Kobayashi, A. Electrochemical Characterization of Plasma Sprayed Alumina Coatings. J. Surf. Eng. Mater. Adv. Technol. 2011, 1, 107–111. [Google Scholar] [CrossRef]
  18. Kossenko, A.; Zinigrad, M. A universal electrolyte for the plasma electrolytic oxidation of aluminum and magnesium alloys. Mater. Des. 2015, 88, 302–309. [Google Scholar] [CrossRef]
  19. Martin, J.; Leone, P.; Nominé, A.; Veys-Renaux, D.; Belmonte, T. Influence of electrolyte ageing on the Plasma Electrolytic Oxidation of aluminum. Surf. Coat. Technol. 2015, 269, 36–46. [Google Scholar] [CrossRef]
  20. Martin, J.; Melhem, A.; Ihchedrina, I.; Duchanoy, T.; Belmonte, T. Effects of electrical parameters on plasma electrolytic oxidation of aluminum. Surf. Coat. Tech. 2013, 221, 70–76. [Google Scholar] [CrossRef]
  21. Kasalica, B.; Petkovic, M.; Belca, I.; Stojadinovic, S.; Zekovic, L. Electronic transitions during plasma electrolytic oxidation of aluminum. Surf. Coat. Tech. 2009, 203, 3000–3004. [Google Scholar] [CrossRef]
  22. Simchen, F.; Sieber, M.; Lampke, T. Electrolyte influence on ignition of plasma electrolytic oxidation processes on light metals. Surf. Coat. Tech. 2017, 315, 205–213. [Google Scholar] [CrossRef]
  23. Xie, H.; Cheng, Y.; Li, S.; Cao, J.; Cao, L. Wear and corrosion resistant coatings on surface of cast A356 aluminum alloy by plasma electrolytic oxidation in moderately concentrated aluminate electrolytes. Trans. Nonferrous Met. Soc. China 2017, 27, 336–351. [Google Scholar] [CrossRef]
  24. Jiang, Y.; Zhang, Y.; Bao, Y.; Yang, K. Sliding wear behavior of plasma electrolytic oxidation coating on pure aluminum. Wear 2011, 271, 1667–1670. [Google Scholar] [CrossRef]
  25. Massimiliano, B.; Manuela, C.; Roberto, G.; Andrea, B. Hard anodizing of AA2099-T8 aluminum-lithium-copper alloy: Influence of electric cycle, electrolytic bath composition and temperature. Surf. Coat. Technol. 2017, 325, 627–635. [Google Scholar]
  26. Andrea, B.; Roberto, G.; Tiziano, M.; Paolo, M. Pulsed current effect on hard anodizing process of 7075-T6 aluminum alloy. Surf. Coat. Technol. 2016, 270, 139–144. [Google Scholar]
  27. Massimiliano, B.; Roberto, G.; Andrea, B. Pulsed current hard anodizing of heat treated aluminum alloys: Frequency and current amplitude influence. Surf. Coat. Technol. 2016, 307, 861–870. [Google Scholar] [CrossRef]
  28. Blawert, C.; Dietzel, W. Anodizing treatments for magnesium alloys and their effect on corrosion resistance in various environments. Adv. Eng. Mater. 2006, 8, 511–533. [Google Scholar] [CrossRef]
  29. Huang, Y.; Shih, H. Evaluation of the corrosion resistance of anodized aluminum 6061 using electrochemical impedance spectroscopy (EIS). Corros. Sci. 2008, 50, 3569–3575. [Google Scholar] [CrossRef]
  30. Wang, Y.; Jiang, S.L.; Zheng, Y.G.; Ke, W.; Wang, J.Q. Effect of porosity sealing treatments on the corrosion resistance of high-velocity oxy-fuel (HVOF)-sprayed Fe-based amorphous metallic coatings. Surf. Coat. Tech. 2011, 206, 1307–1318. [Google Scholar] [CrossRef]
  31. Singh, H.; Sidhu, B.S. Use of plasma spray technology for deposition of high temperature oxidation/corrosion resistant coatings—A review. Mater. Corros. 2007, 58, 92–102. [Google Scholar] [CrossRef]
  32. Kumar, S.; Kumar, A.; Kumar, D.; Jain, J. Thermally sprayed alumina and ceria-doped-alumina coatings on AZ91 Mg alloy. Surf. Coat. Tech. 2017, 332, 533–541. [Google Scholar] [CrossRef]
  33. Thirumalaikumarasamy, D.; Shanmugam, K.; Balasubramanian, V. Corrosion performances of atmospheric plasma sprayed alumina coatings on AZ31B magnesium alloy under immersion environment. J. Asian Ceram. Soc. 2014, 2, 403–415. [Google Scholar] [CrossRef]
  34. Sivakumar, S.; Praveen, K.; Shanmugavelayutham, G.; Yugeswaran, S. Thermo-physical behavior of atmospheric plasma sprayed high porosity lanthanum zirconate coatings. Surf. Coat. Tech. 2017, 326, 173–182. [Google Scholar] [CrossRef]
  35. Li, C.; Wang, W. Quantitative characterization of lamellar microstructure of plasma-sprayed ceramic coatings through visualization of void distribution. Mater. Sci. Eng. A 2004, 386, 10–19. [Google Scholar] [CrossRef]
  36. Li, C.J. Thermal spraying of light alloys. In Surface Engineering of Light Alloys, 1st ed.; Hanshan, D., Ed.; Woodhead Publishing: Cambridge, UK, 2010; pp. 184–241. ISBN 9781845699451. [Google Scholar]
  37. Wang, R.Q.; Wu, Y.K.; Wu, G.R.; Chen, D.; He, D.L.; Li, D.; Guo, C.; Zhou, Y.; Shen, D.; Nash, P. An investigation about the evolution of microstructure and composition difference between two interfaces of plasma electrolytic oxidation coatings on Al. J. Alloys Compd. 2018, 753, 272–281. [Google Scholar] [CrossRef]
  38. Liu, S.; Zeng, J. Effects of negative voltage on microstructure and corrosion resistance of red mud plasma electrolytic oxidation coatings. Surf. Coat. Tech. 2018, 352, 15–25. [Google Scholar] [CrossRef]
  39. Cerchier, P.; Luca, P.; Emanuela, M.; Leonardo, C.; Marie, G.M.O.; Isabella, M.; Maurizio, M. Antifouling properties of different Plasma Electrolytic Oxidation coatings on 7075 aluminum alloy. Int. Biodeterior. Biodegrad. 2018, 133, 70–78. [Google Scholar] [CrossRef]
  40. Abdel-Gawad, S.A.; Walid, M.O.; Amany, M.F. Characterization and Corrosion behavior of anodized Aluminum alloys for military industries applications in artificial seawater. Surf. Interfaces 2018, in press. [Google Scholar] [CrossRef]
  41. Massimiliano, B.; Roberto, G. Hard anodizing of AA2011-T3 Al-Cu-Pb-Bi free-cutting alloy: improvement of the process parameters. Corros. Sci. 2018, 141, 63–71. [Google Scholar]
  42. Vatan, H.N.; EbrHAimi-kHArizsangi, R.; Kasiri-asgarani, M. Structural, tribological and electrochemical behavior of SiC nanocomposite oxide coatings fabricated by plasma electrolytic oxidation (PEO) on AZ31 magnesium alloy. J. Alloys Compd. 2016, 683, 241–255. [Google Scholar] [CrossRef]
  43. Tjiang, F.; Ye, L.; Huang, Y.; Chou, C.; Tsai, D. Effect of processing parameters on soft regime behavior of plasma electrolytic oxidation of magnesium. Ceram. Int. 2017, 43, s567–s572. [Google Scholar] [CrossRef]
  44. Hussein, R.O.; Northwood, D.O.; Nie, X. The effect of processing parameters and substrate composition on the corrosion resistance of plasma electrolytic oxidation (PEO) coated magnesium alloys. Surf. Coat. Tech. 2013, 237, 357–368. [Google Scholar] [CrossRef]
  45. Qiu, Z.; Wang, R.; Wu, X.; Zhang, Y. Influences of Current Density on the Structure and Corrosion Resistance of Ceramic Coatings on ZK60 Mg Alloy by Plasma Electrolytic Oxidation. Int. J. Electrochem. Sci. 2013, 8, 1957–1965. [Google Scholar]
  46. Majid, V.; Hyoung, S.K. A combination of severe plastic deformation and ageing phenomena in Al–Mg–Si Alloys. Mater. Des. 2012, 36, 735–740. [Google Scholar] [CrossRef]
  47. Grażyna, M.N.; Sieniawski, J. Influence of heat treatment on the microstructure and mechanical properties of 6005 and 6082 aluminum alloys. J. Mater. Process. Technol. 2005, 162, 367–372. [Google Scholar] [CrossRef]
  48. Malayoglu, U.; Tekin, K.C.; Malayoglu, U.; Shrestha, S. An investigation into the mechanical and tribological properties of plasma electrolytic oxidation and hard-anodized coatings on 6082 aluminum alloys. Mater. Sci. Eng. A 2011, 528, 7451–7460. [Google Scholar] [CrossRef]
  49. Shrestha, S.; Shashkov, F. Microstructural and thermo-optical properties of black Keronite PEO coating on aluminum alloy AA7075 for spacecraft materials applications. In Proceedings of the 10th International Symposium, Materials in a Space Environment, Collioure, France, 19–23 June 2006. [Google Scholar]
  50. Metco, S. Metco® 101NS Grey Alumina Powder. Available online: https://www.oerlikon.com/ecomaXL/files/metco/oerlikon_DSMTS-0083.2_Al2O3_40TiO2.pdf&download=1 (accessed on 22 March 2017).
  51. Krishna, L.R.; Purnima, A.S.; Sundararajan, G. A comparative study of tribological behavior of microarc oxidation and hard-anodized coatings. Wear 2006, 261, 1095–1101. [Google Scholar] [CrossRef]
  52. Emregül, K.C.; Aksüt, A.A. The behavior of aluminum in alkaline media. Corrosion Science 2000, 42, 2051–2067. [Google Scholar] [CrossRef]
  53. Wang, C.; Neville, A. Erosion-corrosion of engineering steels—Can it be managed by use of chemicals? Wear 2018, 267, 2018–2026. [Google Scholar] [CrossRef]
  54. Cai, F.; Yang, Q.; Huang, X. The Roles of Diffusion Factors in Electrochemical Corrosion of TiN and CrN (CrSiCN) Coated Mild Steel and Stainless Steel. In Materials Processing and Interfaces; Wiley Online Library: Hoboken, NJ, USA, 2012; Volume 1. [Google Scholar] [CrossRef]
  55. Ren, J.; Zuo, Y. The growth mechanism of pits in NaCl solution under anodic films on aluminum. Surf. Coat. Technol. 2005, 191, 311–316. [Google Scholar] [CrossRef]
Figure 1. Designed sample holder for electrochemistry tests.
Processes 06 00240 g001
Figure 2. Microstructure of the substrate 6082-T6 aluminum alloy in (a) SEM polished micrograph and (b) Optical micrograph of the etched conditions.
Processes 06 00240 g002
Figure 3. Optical cross-sectional micrographs of coating layers after polarization tests for (a) Hard Anodizing (HA), (b) Plasma Electrolytic Oxidation (PEO), (c) Plasma Spray Ceramic (PSC) and (d) SEM image of PSC.
Processes 06 00240 g003
Figure 4. XRD spectra for coating layer of (a) HA, for highlighting lower peaks zoomed XRD spectra for (b) HA, (c) PEO and (d) PSC.
Processes 06 00240 g004
Figure 5. Current density versus time plots to calculate charge transfer for coating by (a) HA, (b) PEO and (c) PSC at +400 mV (Ag/AgCl).
Processes 06 00240 g005
Figure 6. Initial Open Circuit Potential (OCP) measurements of the coating materials versus the Ag/AgCl reference electrode.
Processes 06 00240 g006
Figure 7. OCP measurements of the coating materials for 5000 s in Ag/AgCl reference electrode.
Processes 06 00240 g007
Figure 8. AP Measurements for (a) Al substrate, (b) HA, (c) PEO and (d) PSC coatings.
Processes 06 00240 g008
Figure 9. Comparison of breakdown potential from AP measurements for the tested materials against the Ag/AgCl reference electrode.
Processes 06 00240 g009
Figure 10. Determination of corrosion current density for (a) Al substrate, (b) HA, (c) PEO and (d) PSC coatings.
Processes 06 00240 g010
Figure 11. Comparison of corrosion current density values from AP measurements for the coated test specimens.
Processes 06 00240 g011
Figure 12. Optical images of coating surfaces after polarization tests for (a) Al, (b) HA, (c) PEO and (d) PSC coatings.
Processes 06 00240 g012
Figure 13. Nyquist plots for (a) Al substrate, (b) HA, (c) PEO and (d) PSC coatings at different immersion times.
Processes 06 00240 g013
Figure 14. Bode plots for (a) Al substrate, (b) HA, (c) PEO and (d) PSC coatings at different immersion times.
Processes 06 00240 g014
Figure 15. Optical images of aluminum surface after 10 days of immersion in 3.5% NaCl solution at (a) low magnification, (b) enlarged magnification.
Processes 06 00240 g015
Figure 16. Optical images of HA coating surface after 10 days of immersion in 3.5% NaCl solution (a) low magnification, (b) enlarged magnification.
Processes 06 00240 g016
Figure 17. Optical images of PEO coating surface after 10 days of immersion in 3.5% NaCl solution (a) low magnification, (b) enlarged magnification.
Processes 06 00240 g017
Figure 18. Optical images of PSC coating surface after 10 days of immersion in 3.5% NaCl solution (a) low magnification, (b) higher magnification.
Processes 06 00240 g018
Figure 19. Nyquist plots for the materials after (a) 0 day and (b) 10 days.
Processes 06 00240 g019
Figure 20. Bode plots for the materials after (a) 0 day and (b) 10 days.
Processes 06 00240 g020
Table 1. Chemical compositions of the 6082-T6 aluminum alloy; wt%.
SiMgMnFeCrCuZnTiAl
0.9570.8360.6340.550.250.120.240.13Balance
Table 2. Al3+ (in grams) detected from 3.5% NaCl solution after 24 h free corrosion test.
Test ConditionHAPEOPSC
Free Corrosion at 20 °C0.0000.0000.000
Free Corrosion at 80 °C0.0000.0000.590
Free Corrosion at 20 °C after 80 °C0.0080.0000.077
Table 3. Summary of corrosion parameters of the materials.
Corrosion ParameterPEOHAPSCAl
Open circuit potential (OCP) (V)−0.05 ± 0.00246−0.40 ± 0.01375−0.76 ± 0.05542−0.7 ± 0.005
Breaking down potential (Eb) (V)1.07 ± 0.11.11 ± 0.051.12 ± 0.040.2 ± 0.1
Corrosion current density (icorr) (A/cm2) from AP Curve1.7 × 10−83.5 × 10−72.6 × 10−71.2 × 10⁻⁵

