Article

Production Process Optimization of Metal Mines Considering Economic Benefit and Resource Efficiency Using an NSGA-II Model

1
School of Resources and Civil Engineering, Northeastern University, Shenyang 110819, China
2
Key Laboratory of Ministry of Education on Safe Mining of Deep Metal Mines, Northeastern University, Shenyang 110819, China
3
Research Center of Mining Trade and Investment, Jiangxi University of Science and Technology, Ganzhou 341000, China
*
Authors to whom correspondence should be addressed.
Processes 2018, 6(11), 228; https://doi.org/10.3390/pr6110228
Submission received: 30 September 2018 / Revised: 8 November 2018 / Accepted: 13 November 2018 / Published: 19 November 2018
(This article belongs to the Section Process Control and Monitoring)

Abstract

:
The optimization of the production process of metal mines has been traditionally driven only by economic benefits while ignoring resource efficiency. However, it has become increasingly aware of the importance of resource efficiency since mineral resource reserves continue to decrease while the demand continues to grow. To better utilize the mineral resources for sustainable development, this paper proposes a multi-objective optimization model of the production process of metal mines considering both economic benefits and resource efficiency. Specifically, the goals of the proposed model are to maximize the profit and resource utilization rate. Then, the fast and elitist Non-Dominated Sorting Genetic Algorithm (NSGA-II) is used to optimize the multi-objective optimization model. The proposed model has been applied to the optimization of the production process of a stage in the Huogeqi Copper Mine. The optimization results provide a set of Pareto-optimal solutions that can meet varying needs of decision makers. Moreover, compared with those of the current production indicators, the profit and resource utilization rate of some points in the optimization results can increase respectively by 2.99% and 2.64%. Additionally, the effects of the decision variables (geological cut-off grade, minimum industrial grade and loss ratio) on objective functions (profit and resource utilization rate) were discussed using variance analysis. The sensitivities of the Pareto-optimal solutions to the unit copper concentrate price were studied. The results show that the Pareto-optimal solutions at higher profits (with lower resource utilization rates) are more sensitive to the unit copper concentrate prices than those obtained in regions with lower profits.

1. Introduction

As an important natural resource, mineral resource provides the raw material for industrial development and is an indispensable resource for economic development. With the continuous mining of mineral resources, the reserves of mineral resources have gradually decreased worldwide. However, the global increase in demand for minerals will continue [1]. Therefore, it is an urgent realistic problem to optimize the production process of metal mines for mining mineral resources with the greatest economic benefits and resource efficiency to better utilize the mineral resources for sustainable development [2].
The production process of metal mines is a complex industrial process, consisting of three unit processes in series, i.e., the exploration process, the mining process and the beneficiation process. The input of the latter unit process is the output of the previous one [3,4]. The optimization of the production process of metal mines is to determine the best production technology indicators that have a significant impact on economic benefits and resource efficiency [5,6]. Technical production indicators include the recoverable reserves, average ore grade, geological cut-off grade, minimum industrial grade, loss ratio, dilution ratio, raw ore grade and volume, concentrate grade and volume, and concentration ratio. As the market changes and production technology advances, it is necessary to adjust and optimize these indicators in time to achieve the best results. The optimization of the metal mines production process is an effective way to raise the economic benefits of enterprises and contribute to the sustainable development of resources.
In recent years, researchers have studied the optimization of the production process of metal mines in terms of three major aspects. The first is the optimization of metal mine production in the beneficiation process [7,8,9,10,11]. Obviously, the local optimization of a unit process does not guarantee the global optimization of the process. Therefore, technical indicators of all units should be optimized jointly to achieve the global optimization of the production process [12,13,14]. The second is the optimization of the production process of metal mines, in which the objective is to maximize economic benefits while ignoring the resource efficiency [15,16,17,18,19]. These works emphasized the optimization targeting at maximizing economic benefits. The third aspect is the optimization of the production process of metal mines considering economic benefit and resource efficiency with either constraint or weight methods [4,20,21,22,23]. These methods convert multiple objectives into a single objective, thus the optimization results depend largely on subjective assignment of the constraint or weight value [8].
The above-mentioned works have progressed the optimization method of the production process of metal mines and some have attempted to use these methods for application. However, the previous work can only figure out a single optimization results since they treated the optimization process as a single-objective optimization problem. The production process optimization of metal mines is a multi-objective problem when considering both the resource efficiency and the economic benefits. The single objective optimization is usually not sufficient for mines where multiple objectives must be considered for the decision makers.
Therefore, it is mandatory to develop multi-objective optimization methods for the production process of metal mines considering multiple objectives, such as the resource efficiency and economic benefits. It has been concluded that it is difficult to approach multi-objective optimization problems with traditional methods [24,25]. To overcome these difficulties, a variety of computational intelligence methods have been incorporated to approach multi-objective prediction and optimization problems [26,27,28,29,30], such as the fast and elitist Non-Dominated Sorting Genetic Algorithm (NSGA-II) [31], the Multi-Objective Particle Swarm Optimization (MOPSO) [32] and the Multi-Objective Differential Evolution (MODEs) [33]. In these multi-objective evolutionary methods, the optimal distribution of the Pareto-optimal frontier can be obtained for decision makers according to their varying objectives [24]. Due to its advantages of good robustness, high computational efficiency and diversity, the NSGA-II method has been introduced to approach multi-objective optimization problems, such as the redundancy allocation [34], hydrogen gas production [35] and process planning [36]. Those contributions examined the possibility of the mathematical algorithms for multi-objective optimization.
The objective of the present paper is to establish a multi-objective model optimized by the NSGA-II method to optimize the production process of metal mines considering both the economic benefits and the resource efficiency. The results provide a set of Pareto-optimal solutions that can provide multiple options for mine decision makers according to their customized demands. The rest of this paper is organized as follows. Section 2 defines the production process of metal mines. Section 3 establishes the multi-objective model optimized by the NSGA-II method with consideration of the economic benefit and resource efficiency. Section 4 applies the optimized multi-objective model for optimization of the production process of the Huogeqi Copper Mine. Section 5 provides the discussion. Section 6 draws the conclusions.

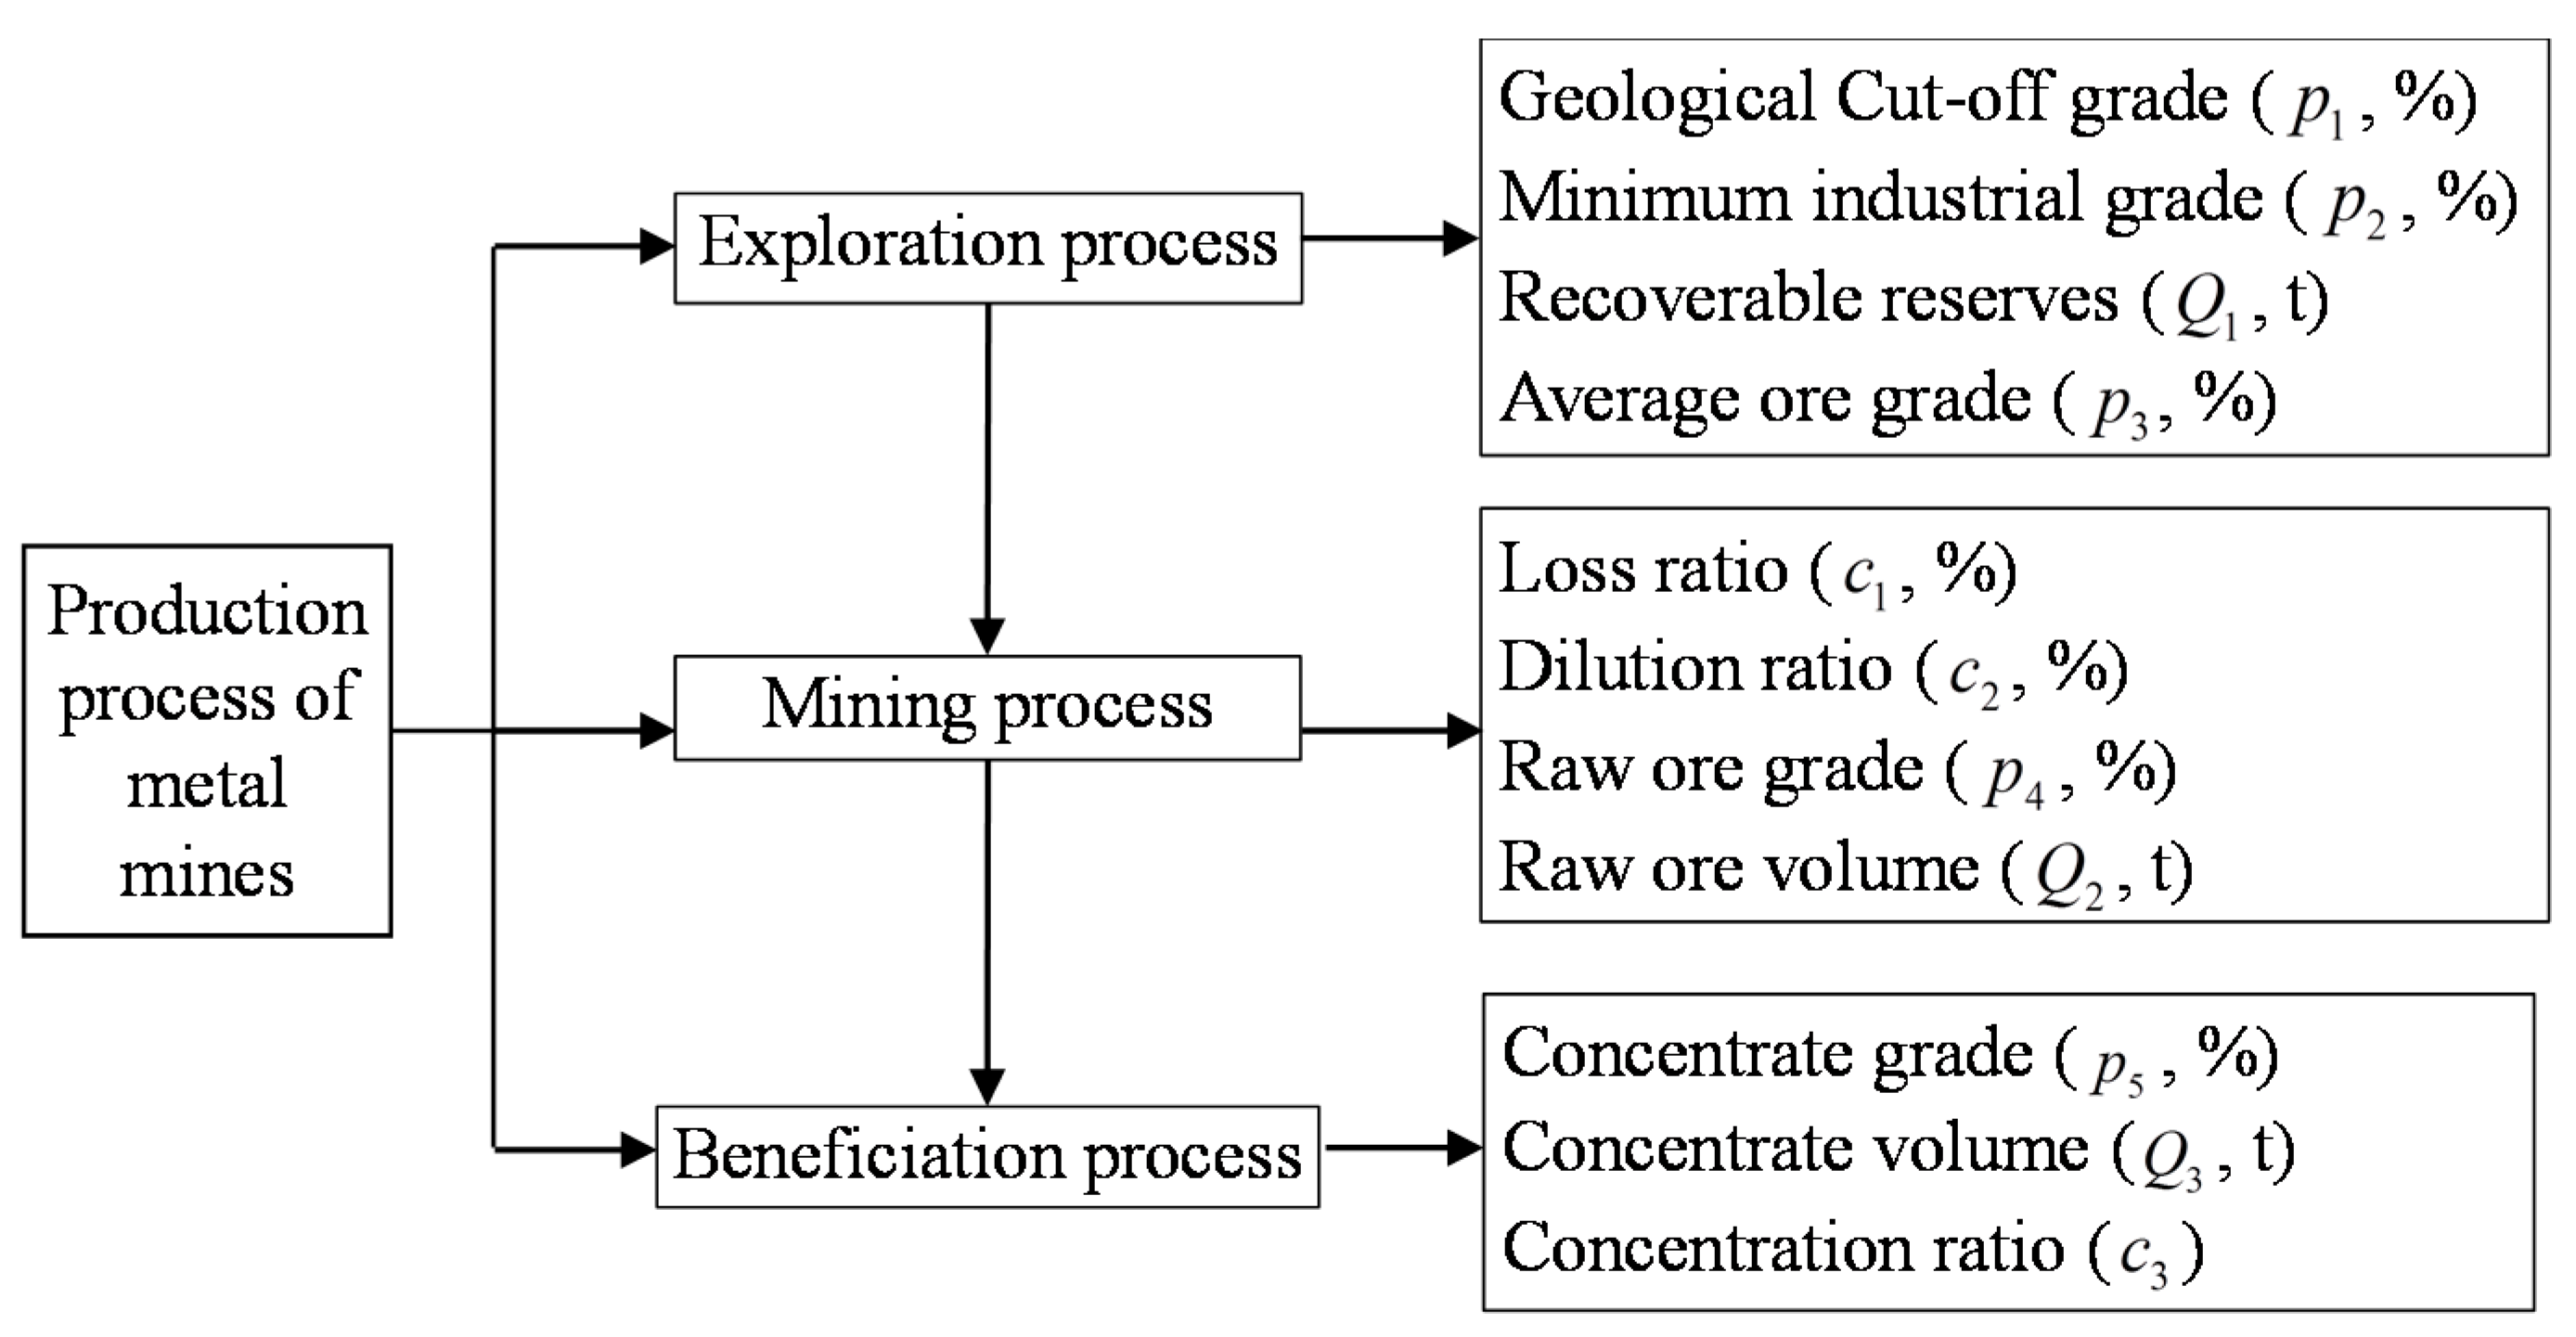
2. Production Process of Metal Mines

The production process of metal mines includes three sub-processes, i.e., the exploration process, the mining process and the beneficiation process (see Figure 1). Due to the fact that the grade of most Chinese mineral deposit is low [37], the international “single grade,” i.e., the cut-off grade, is not sufficient for Chinese miners or engineers to make decisions in mine resources exploration. Most mines in China use the “two-grade” system, i.e., geological cut-off grade and minimum industrial grade [38]. The geological cut-off grade is used to distinguish ore and rock. The minimum industrial grade refers to the lowest ore grade of mineral currently available for mining.
The exploration process is to identify the geological conditions, classification, spatial distribution of the ore body, and estimate the recoverable reserves and average ore grade. The recoverable reserves are those mineral resources that are economically and technically practicable to extract or harvest. The average ore grade is the average grade of recoverable ore deposit.
The mining process is the mining of valuable minerals from the deposit. The loss ratio is the ratio of the loss recoverable reserves during the mining process to the total recoverable reserves. The dilution ratio is the reducing degree of the ore grade during the mining process due to involvement of the rocks in the mined ores.
The beneficiation process is the process of separating commercially valuable minerals from their raw ores. The concentration ratio is the ratio of the raw ore volume to the concentration volume.

2.1. Exploration Process

The exploration process includes four production indicators, i.e., the recoverable reserve, average ore grade, geological cut-off grade and minimum industrial grade. The recoverable reserves and average ore grade are generally dependent on the geological cut-off grade and the minimum industrial grade. Since the MOEAs to optimize problems need to calculate thousands of schemes, it is a very large amount of work to estimate the average grade and geological reserves by mining software (e.g., 3DMine and SURPAC) after delineating the ore body. By summarizing relevant research, a set of mathematical statistical methods [39,40] have been proposed to estimate the recoverable reserves and the average ore grade after a long-term exploration of many years.
The recoverable reserves can be determined from the geological cut-off grade and minimum industrial grade, given the integral functions in Equation (1), i.e.,
Q 1 = f 1 ( p 1 , p 2 ) = Q 0 × p 1 p 2 φ ( x ) g ( x ) f ( x ) d x + p 2 g ( x ) f ( x ) d x p a p b φ ( x ) g ( x ) f ( x ) d x + p b g ( x ) f ( x ) d x
φ ( x ) = ( x p 1 p 2 p 1 ) m      ( p 1 x p 2 )
where p a is the initial value of the geological cut-off grade for statistical calculation, which can be randomly specified; p b is the initial value of the minimum industrial grade; Q 0 is the value of the recoverable reserve corresponding to initial values of the p a and p b , respectively; the value of Q 0 is estimated by 3DMine; φ ( x ) is the mining probability of ore grade with grade between the geological cut-off grade and the minimum industrial grade; g ( x ) is the ore weight function of sample grade; f ( x ) is probability density function of the ore grade distribution; m is a constant depending on the geological conditions of the mines.
The average ore grade is the average value of the grades of the ores. It can be determined from the geological cut-off grade and minimum industrial grade with the given integral functions in Equation (3), i.e.,
p 3 = f 2 ( p 1 , p 2 ) = p 1 p 2 x φ ( x ) g ( x ) f ( x ) d x + p 2 x g ( x ) f ( x ) d x p 1 p 2 φ ( x ) g ( x ) f ( x ) d x + p 2 g ( x ) f ( x ) d x .

2.2. Mining Process

The mining process mainly includes four production indicators, i.e., the loss ratio, dilution ratio, raw ore grade and raw ore volume. In general, the dilution ratio and loss ratio depend on the mining method and ore body lithology, but they may have a certain correlation when the mining method is the same and the ore body lithology is similar. In addition, this correlation is established through production data.
c 2 = f 3 ( c 1 ) .
The dilution ratio is defined as the extent to which the ore grade is reduced during the mining process. It is formulated by
c 2 = ( p 3 p 4 ) / p 3 .
The raw ore grade is calculated by
p 4 = p 3 ( 1 c 2 ) .
Considering the mass conservation of the metallic elements during mining process, one has
Q 2 × p 4 = Q 1 × ( 1 c 1 ) × p 3 .
Thus, the raw ore volume can be obtained by
Q 2 = Q 1 1 c 1 1 c 2 .

2.3. Beneficiation Process

The concentration ratio and the concentrate grade are related to the beneficiation method adopted, the beneficiation plant size and plant design. However, the concentration ratio could have a correlation with the raw ore grade when the beneficiation method, the beneficiation plant size and the plant design are similar. Hence, for a specific mine, one might establish the correlation through production data.
The concentration ratio is
c 3 = f 4 ( p 4 ) .
The concentrate grade is related to the raw ore grade and concentration ratio, whose relationship is complex and nonlinear. This relationship is difficult to be described by a nonlinear or multi-regression function. Therefore, this study uses the artificial neural networks [41] model to establish this relationship
p 5 = f 5 ( p 4 , c 3 )
where f 5 is an artificial neural network model.
The concentration ratio is defined as the ratio of the raw ore volume to the concentration volume, so the concentration volume is
Q 3 = Q 2 / c 3 .
It should be noted that the relationship among the variables might vary when the data of the target mine are different. The correlation functions f3, f4, and f5 depend largely on many factors, such as the rock lithology, mining method, beneficiation method and plant design, in the production process.

3. Multi-Objective Optimization Model Considering Economic Profit and Resource Efficiency

3.1. Decision Variables and Constraints

3.1.1. Decision Variables

As introduced above, in the geological process, the recoverable reserves ( Q 1 ) and average ore grade ( p 3 ) are dependent mainly on the geological cut-off grade ( p 1 ) and the minimum industrial grade ( p 2 ) . In the mining process, the dilution ratio ( c 2 ) is related to the loss ratio ( c 1 ) . The raw ore grade ( p 4 ) is determined by the average ore grade ( p 3 ) and the dilution ratio ( c 2 ) . The raw ore volume ( Q 2 ) is determined by the loss ratio ( c 1 ) , dilution ratio ( c 2 ) and recoverable reserves ( Q 1 ) .
In the beneficiation process, the concentration ratio ( c 3 ) is related to the raw ore grade ( p 4 ) . The concentrate grade ( p 5 ) is related to the raw ore grade ( p 4 ) and concentration ratio ( c 3 ) . The concentrate volume ( Q 3 ) is the ratio of the raw ore volume ( Q 2 ) to the concentration ratio ( c 3 ) .
In summary, the independent variables are the geological cut-off grade ( p 1 ) and minimum industrial grade ( p 2 ) and loss ratio ( c 1 ) . The decision variables are selected by their independency. With the above correlation analysis, one can see there are only three independent variables. The remained independent variables are the geological cut-off grade ( p 1 ) , minimum industrial grade ( p 2 ) and loss ratio ( c 1 ) . Hence, those three variables are selected as the decision variables in the production process optimization.

3.1.2. Constraints

In the metal mines, there are limit values for the geological cut-off grade, minimum industrial grade and loss ratio. As a result, there are upper and lower boundary values of the independent variables, i.e.,
p 1 min p 1 p 1 max
p 2 min p 2 p 2 max
c 1 min c 1 c 1 max .
For a mine, the geological cut-off grade is lower than the minimum industrial grade, i.e.,
p 1 p 2 .
The concentrate grade is higher than the minimum smelter grade p melter , i.e.,
p 5 p melter .

3.2. Objective Function

3.2.1. Economic Benefit Objective

Economic benefit is one of the main goals of a mine company. There are two indicators to evaluate the economic benefits, i.e., the profit and net present value. In this study, we considered the profit to evaluate the economic benefit of a mine. Thus, the purpose is to maximize the profit, i.e.,
max θ = Q 3 q Q 3 ( h 1 + h 2 )
where θ is the profit, q is the concentrate transaction price, h 1 is the unit mining cost, and h 2 is the unit beneficiation cost.

3.2.2. Resource Efficiency Objective

Metal ores are non-renewable resources; thus, resource efficiency should be considered in the metal mine production process. The resource utilization rate R is a measure of resource utilization efficiency, which can be denoted by
max R = Q 3 × p 5 f 1 ( p 1 min , p 2 min ) × f 2 ( p 1 min , p 2 min ) .
The numerator in Equation (18) is the amount of metal in the concentrate, and the denominator is the amount of metal in the natural deposit.

3.3. Multi-Objective Optimization Model

In the production process of metal mines, both the economic benefits and resource efficiency can be involved as the objective functions, especially for mines nowadays where sustainable development of resources is appreciated. Thus, we need to develop a multi-objective optimization model. When one has two objectives of economic benefits and resources efficiency in consideration, the objective function is to simultaneously maximize the values of R and θ . The mathematical model of the multi-objective optimization for the production process of metal mines can thus be formulated by
{ maximize    { R , θ } s . t .   p 1 min p 1 p 1 max    p 2 min p 2 p 2 max    c 1 min c 1 c 1 max    p 1 p 2    p 5 p melter .

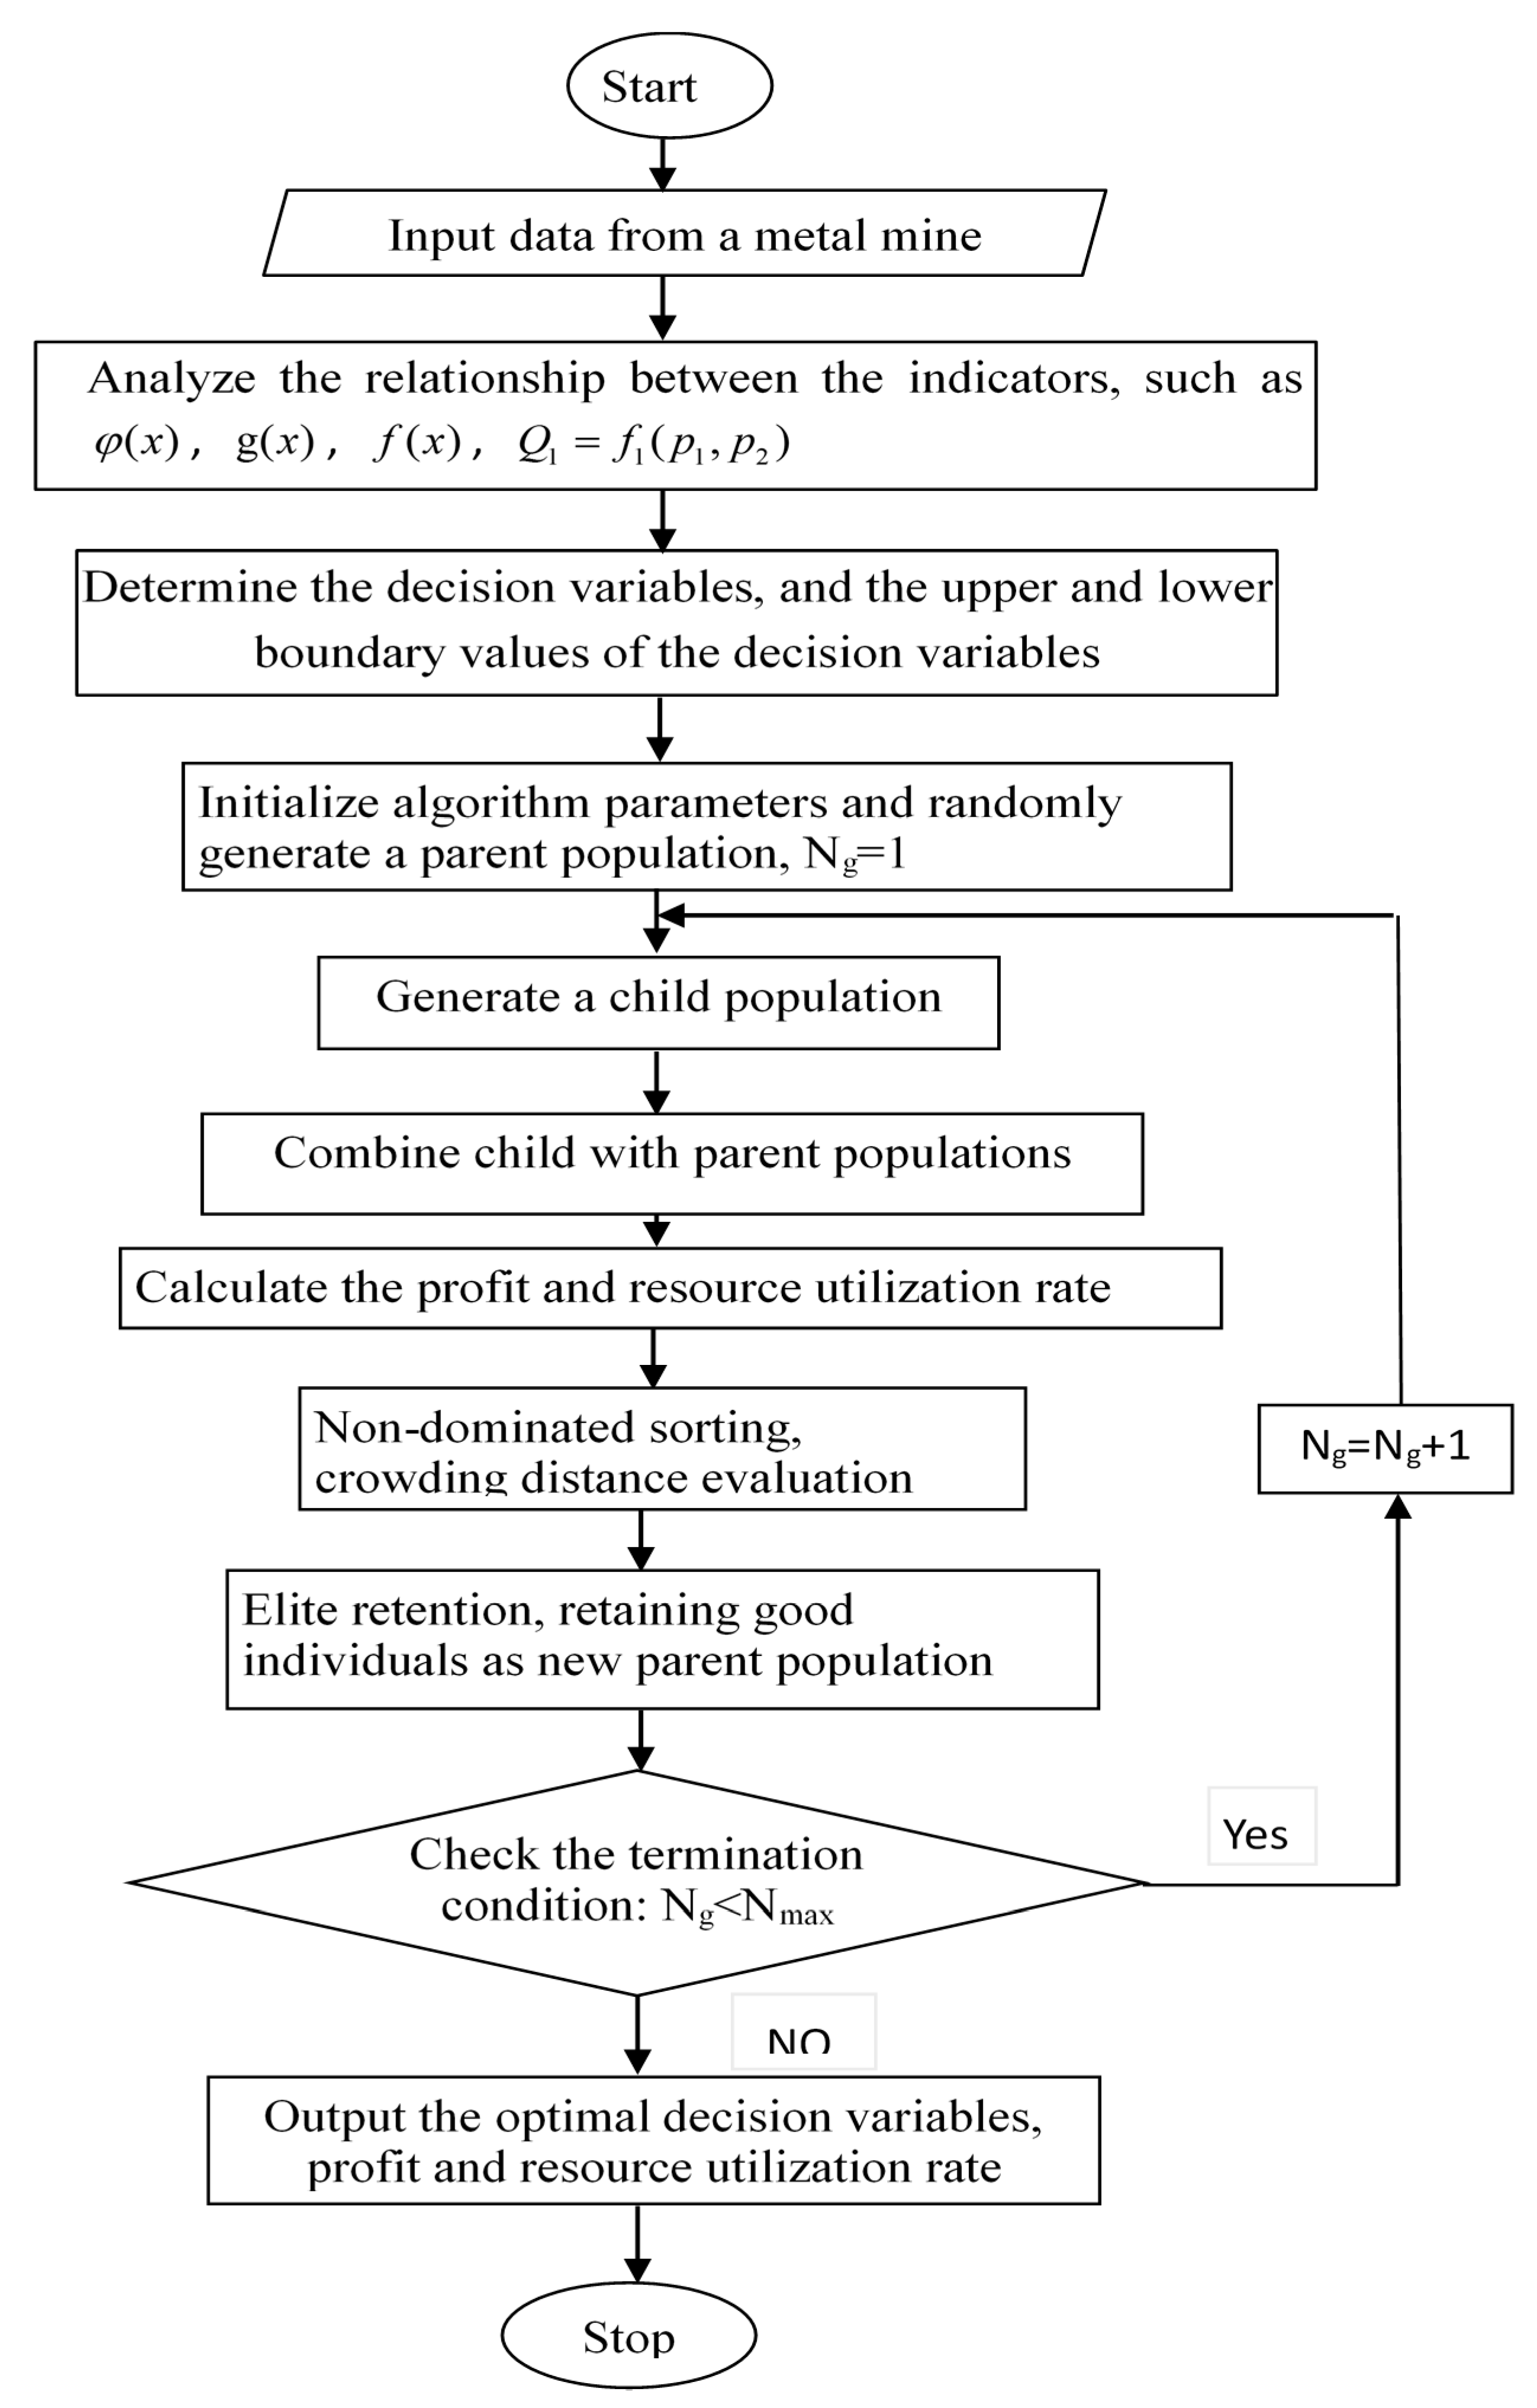
3.4. Development of the NSGA-II Model to Solve the Established Model

The NSGA-II was first proposed by Deb et al. [31] based on the Non-Dominated Sorting Genetic Algorithm (NSGA) [42], and it has achieved multi-objective process optimization in many previous studies [24,43,44,45]. The advantage of the NSGA-II is providing fast non-dominated sorting and crowding distance. The fast, non-dominated sorting can reduce the computational complexity from O(MN3) to O(MN2). The crowding distance can ensure good distribution with small computational complexity. The fast, non-dominated sorting and crowding distance can make the parent population and child population compete together to produce new parent populations, which both achieves convergence and prevents local optimality. This study used the NSGA-II to optimize the production process of metal mines.
The geological cut-off grade, minimum industrial grade and loss ratio were treated as individuals for the MOEAs. The regression models and back-propagation neural network were applied to obtain the connections between the decision variables (geological cut-off grade, minimum industrial grade and loss ratio) and the objective functions (profit and resource utilization rate). Finally, we used the NSGA-II to optimize globally the geological cut-off grade, minimum industrial grade and loss ratio in order to maximize the economic benefit and resource efficiency. The flowchart of the NSGA-II used to optimize the production process of metal mines is shown in Figure 2. The main steps are as follows:
(a)
Collect the data related to the production process of a specific metal mine, i.e., the value of each indicator, and the price of concentrate ores.
(b)
Determine the relationship between the indications, such as φ ( x ) , g ( x ) , f ( x ) , Q 1 = f 1 ( p 1 , p 2 ) , p 3 = f 2 ( p 1 , p 2 ) , c 2 = f 3 ( c 1 ) , c 3 = f 4 ( p 4 ) , p 5 = f 5 ( p 4 , c 3 ) .
(c)
Determine the decision variables according to the dependency analysis, and the upper and lower boundary values of the decision variables according to the production process of the mine.
(d)
The NSGA-II parameters, such as the population size, maximum number of iterations r, crossover probability, mutation probability, crossover index and mutation index, are initialized. Then, n possible individuals are randomly generated as the initial parent population.
(e)
The parent population generates a child population with n possible individuals by selection, mutation and crossover.
(f)
The parent and child populations are mixed to form a new population with 2n possible individuals.
(g)
The profit and resource utilization rate of each individual is calculated in the new population with the input data in (a) and the relationship in (b).
(h)
Based on the values of the objective functions, the mixed population is classified based on the non-dominated level, and the crowded distance is calculated.
(i)
Based on the non-dominated sorting and the crowding distance calculation results of step (h), the top n possible individuals are retained as a new parent population.
(j)
Check the termination condition. If satisfied, the optimization process is terminated and output the optimal decision variables, profit and resource utilization rate; otherwise, goes to step (e).

4. Multi-Objective Optimization of Process of the Huogeqi Copper Mine

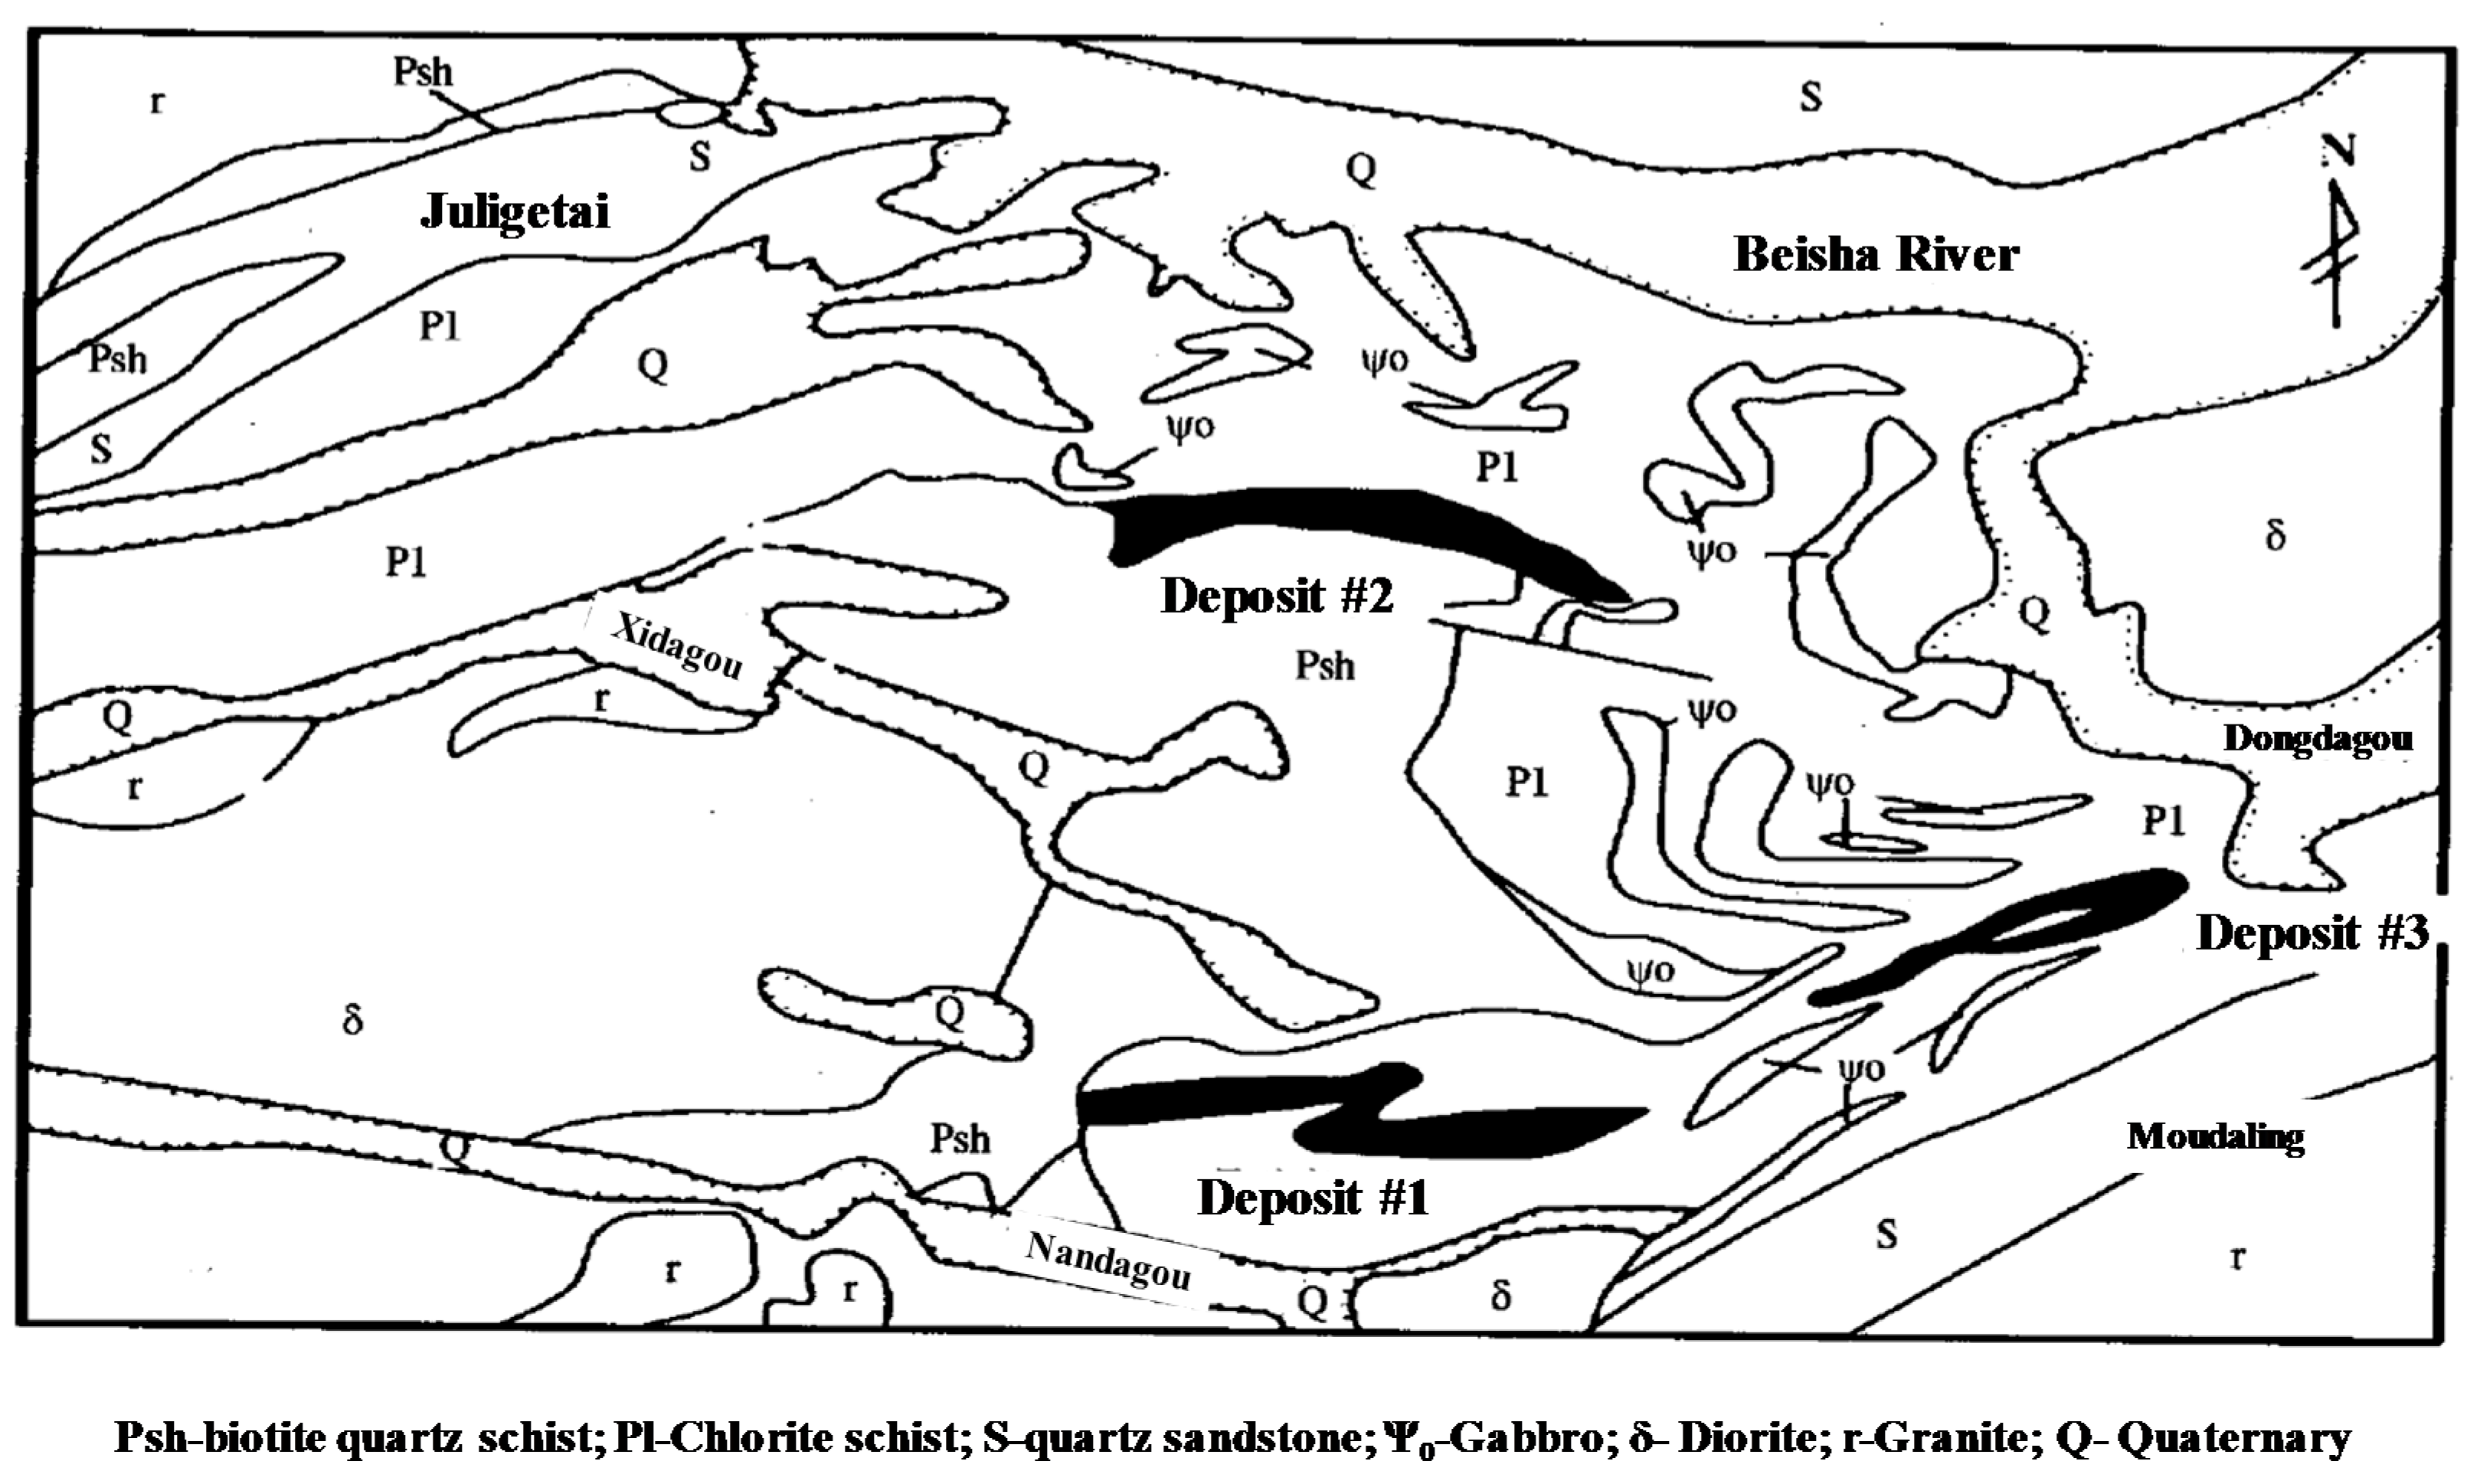
4.1. Brief Introduction of the Huogeqi Copper Mine

The Huogeqi Copper Mine (subsidiary of the Western Mining Group Co., Ltd., an underground copper mine) is located in Bayannaoer, Neimenggu, China, approximately 84 km from Bayannaoer city (see Figure 3). The Huogeqi Copper Mine (41°16′ N, 106°40′ E) has a gentle terrain and is located in a semi-hilly area with altitudes ranging from 1900 to 2100 m and average annual rainfall of 188 mm. The geological map of the Huogeqi Copper Mine is shown in Figure 4. Three ore bodies have been discovered with industrial value in the Huogeqi Copper Mine. The main metallic elements in these ores are copper, lead and zinc. However, the average ore grades of the lead and zinc are under the minimum industrial grade and thus only the copper is the mining target. The deposit has been mined for about 20 years with an annual mining and beneficiation capacity of 3 million tons. It remains approximately 50 million tons of recoverable reserves.
The Huogeqi Copper Mine is a large-scale enterprise in China that involves exploration, mining and beneficiation processes. At present, the following problems exist in the production of the Huogeqi Copper Mine. First, its current production indicators are being determined using the mining and beneficiation processes of the late last century. In recent years, mining and beneficiation technologies and processes have improved, and it is thus necessary to conduct new research now. Second, to achieve the sustainable development of mineral resources, the resource efficiency should be considered during the production process. However, current production technical indicators have not considered resource efficiency. Therefore, it is necessary to carry out the multi-objective optimization of the production process in the Huogeqi Copper Mine. In the next five years, the Huogeqi Copper Mine will mainly mine the ore bodies of the 1450–1570 stage. This paper uses the ore body of the Huogeqi Copper Mine as a research object with which to optimize the production process.
Figure 5 shows the distribution of the geological ore body of the 1450–1570 stage. It is located on the upper plate of the entire deposit with an average dip angle of 71°, an approximate length of 900 m and an average thickness of 25.34 m. The underground water in the 1450–1570 stage ore body is mainly the fractured aquifer water. The upper plate surrounding rock of this part is mica quartz schist, and the lower plate surrounding rock is phyllite and biotite quartz schist. According to the regional geological condition, the surrounding rocks in the 1450–1570 stage ore body have a good global stability with few local unstable blocks [46]. The back-filling mining method is used in the mining of the 1450–1570 stage ore body.
At present, the geological cut-off grade and minimum industrial grade is respectively 0.3% and 0.5% of Cu. The loss ratio in the Huogeqi copper mine is 8% of Cu. The recoverable reserves and average ore grade of the 1450–1570 stage ore body are respectively approximately 9 million tons and 1.32% of Cu. The average ore weight of the 1450–1570 stage ore is 3.16 t/m3. The total cost of the ore production is estimated of 34.76 $/t. This is the addition of the mining cost (15.8 $/t) and the beneficiation cost (18.96 $/t) [47].

4.2. Production Indicators of the Huogeqi Copper Mine

As indicated in Section 2 and Section 3, there are many production indicators involved in the production optimization process. For a specific mine like the Huogeqi Copper Mine, one has to define the relationship between some indicators to give a quantitative optimization of the production process.

4.2.1. Relationship between Ore Weight and Grade

Based on the 156 sets of copper ore weight and grade data collected from the Huogeqi Copper Mine, the scatter plot of weight and grade data can be drawn in Figure 6. It is shown in Figure 6 that there is no apparent correlation between the ore grade and its weight. Thus, the copper ore weight function takes the value of its average, i.e.,
g ( x ) = 3.16 t / m 3

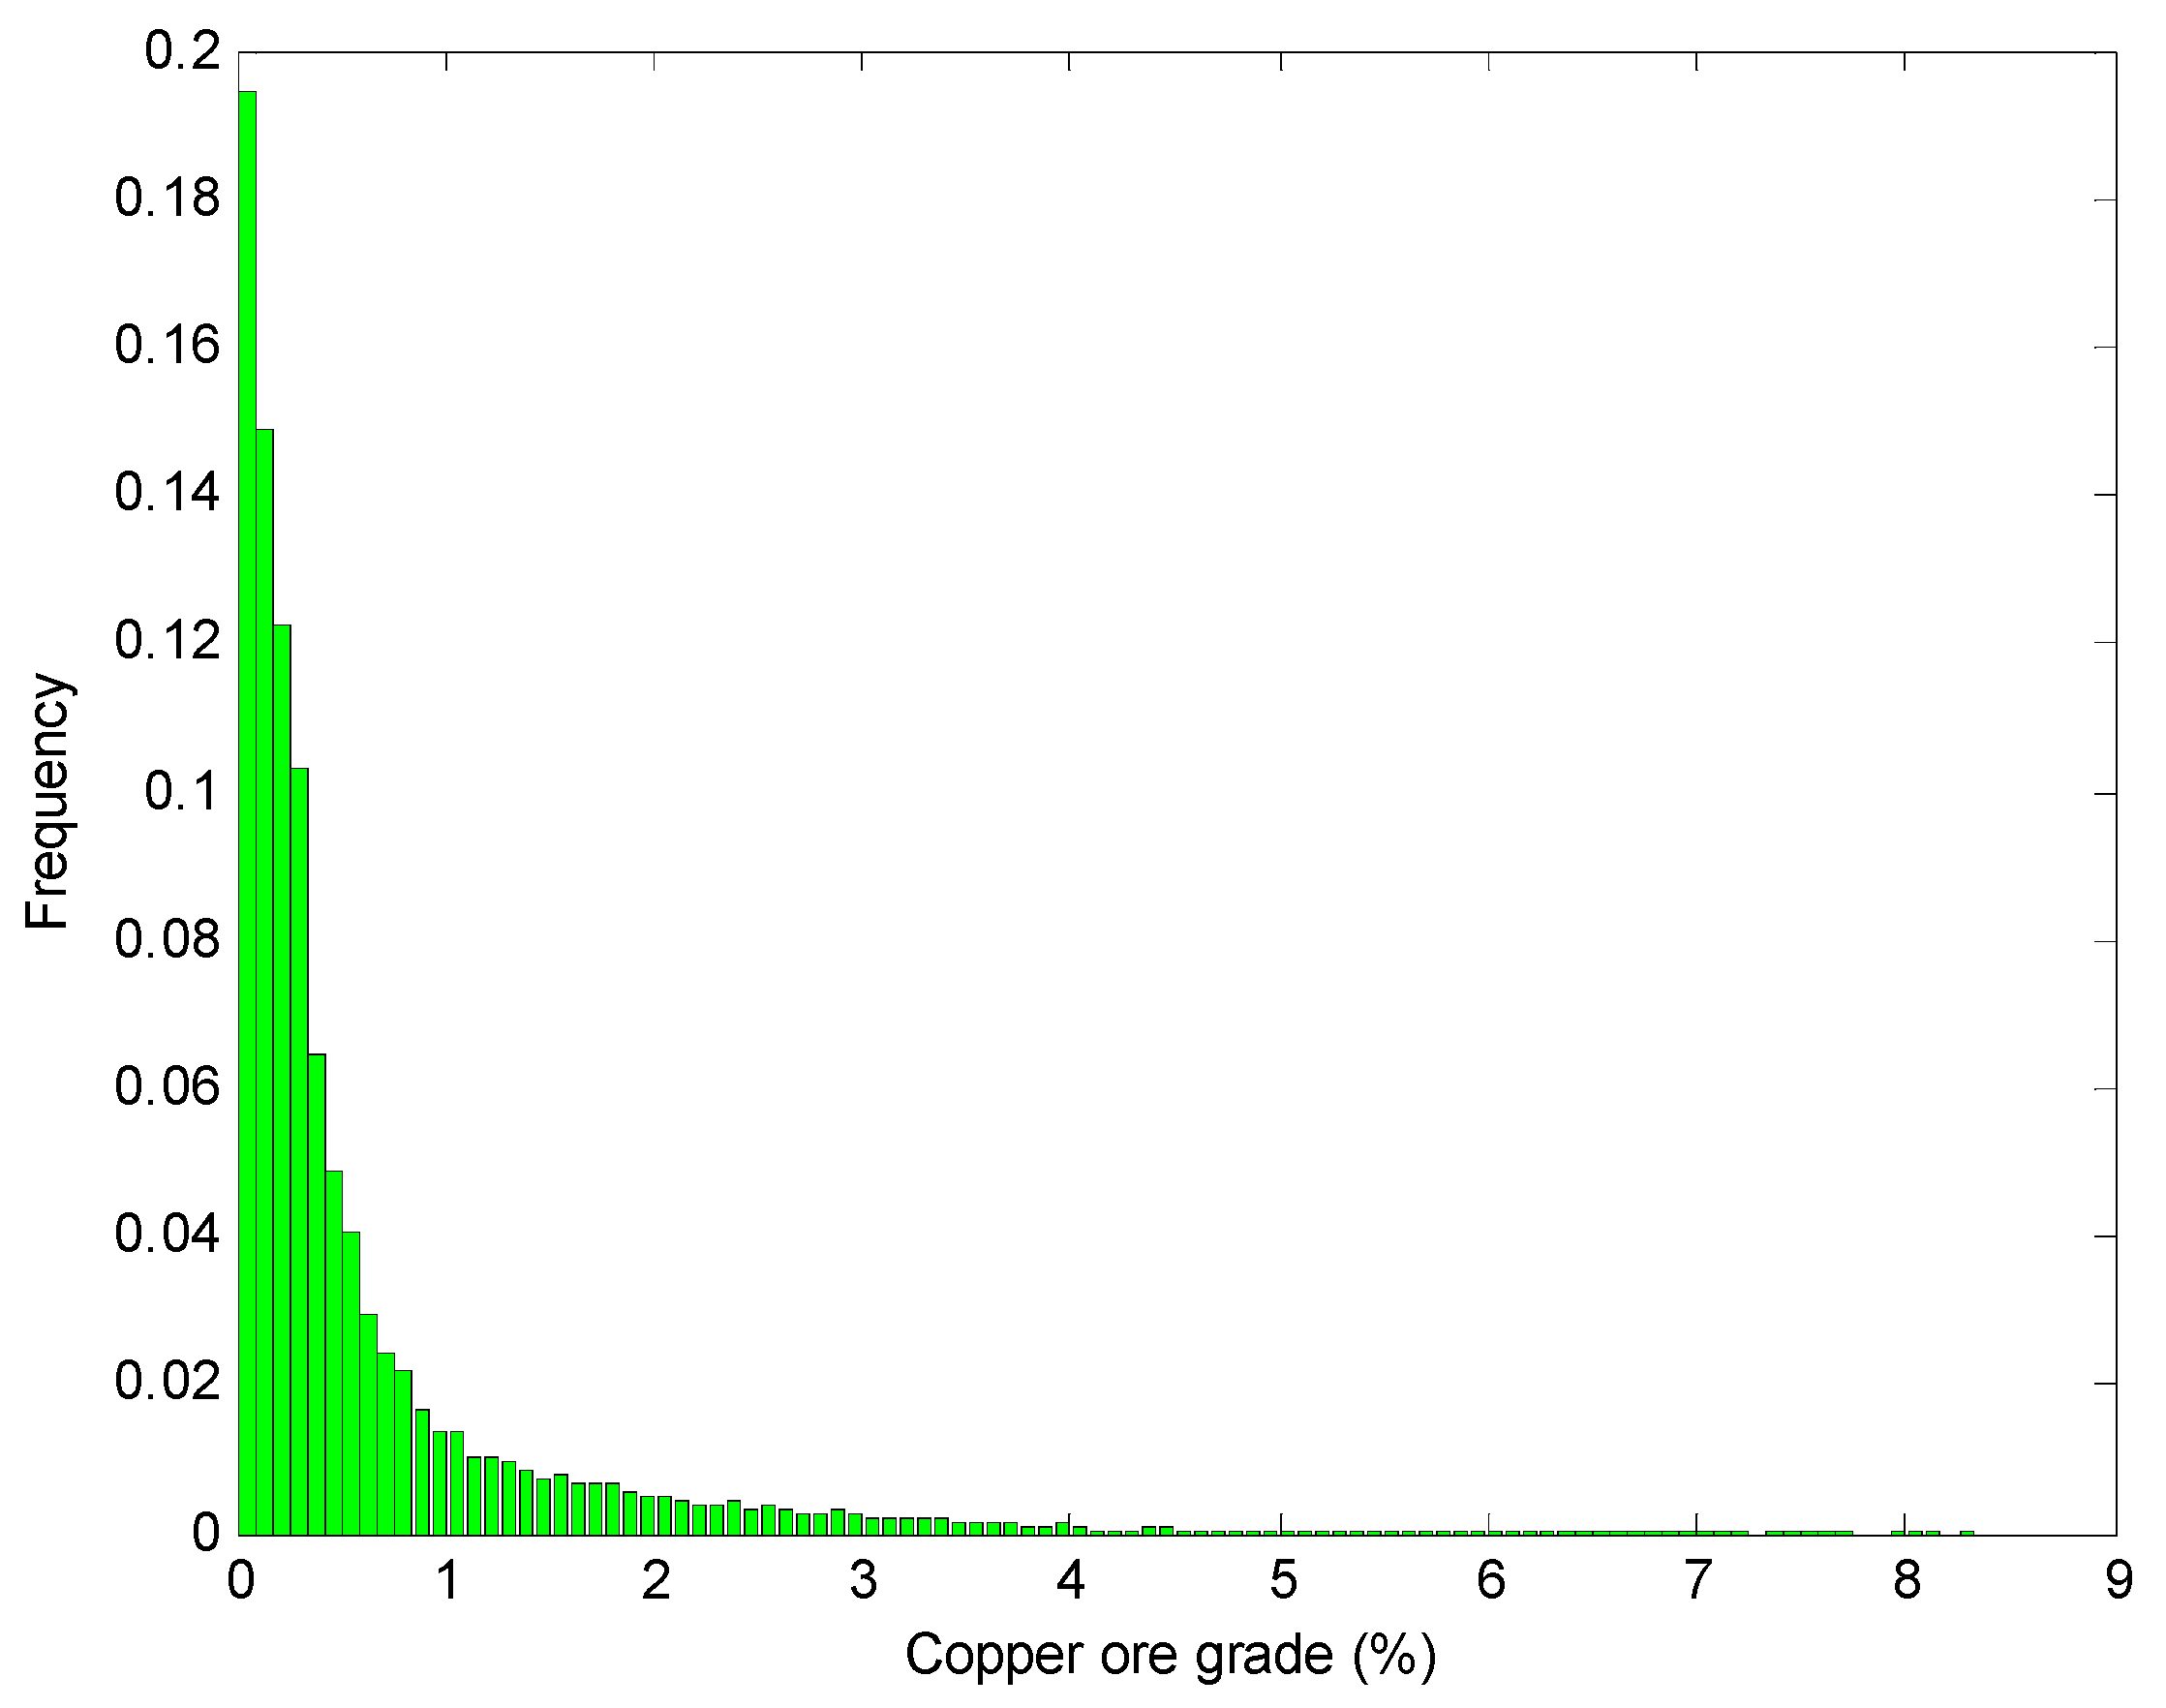
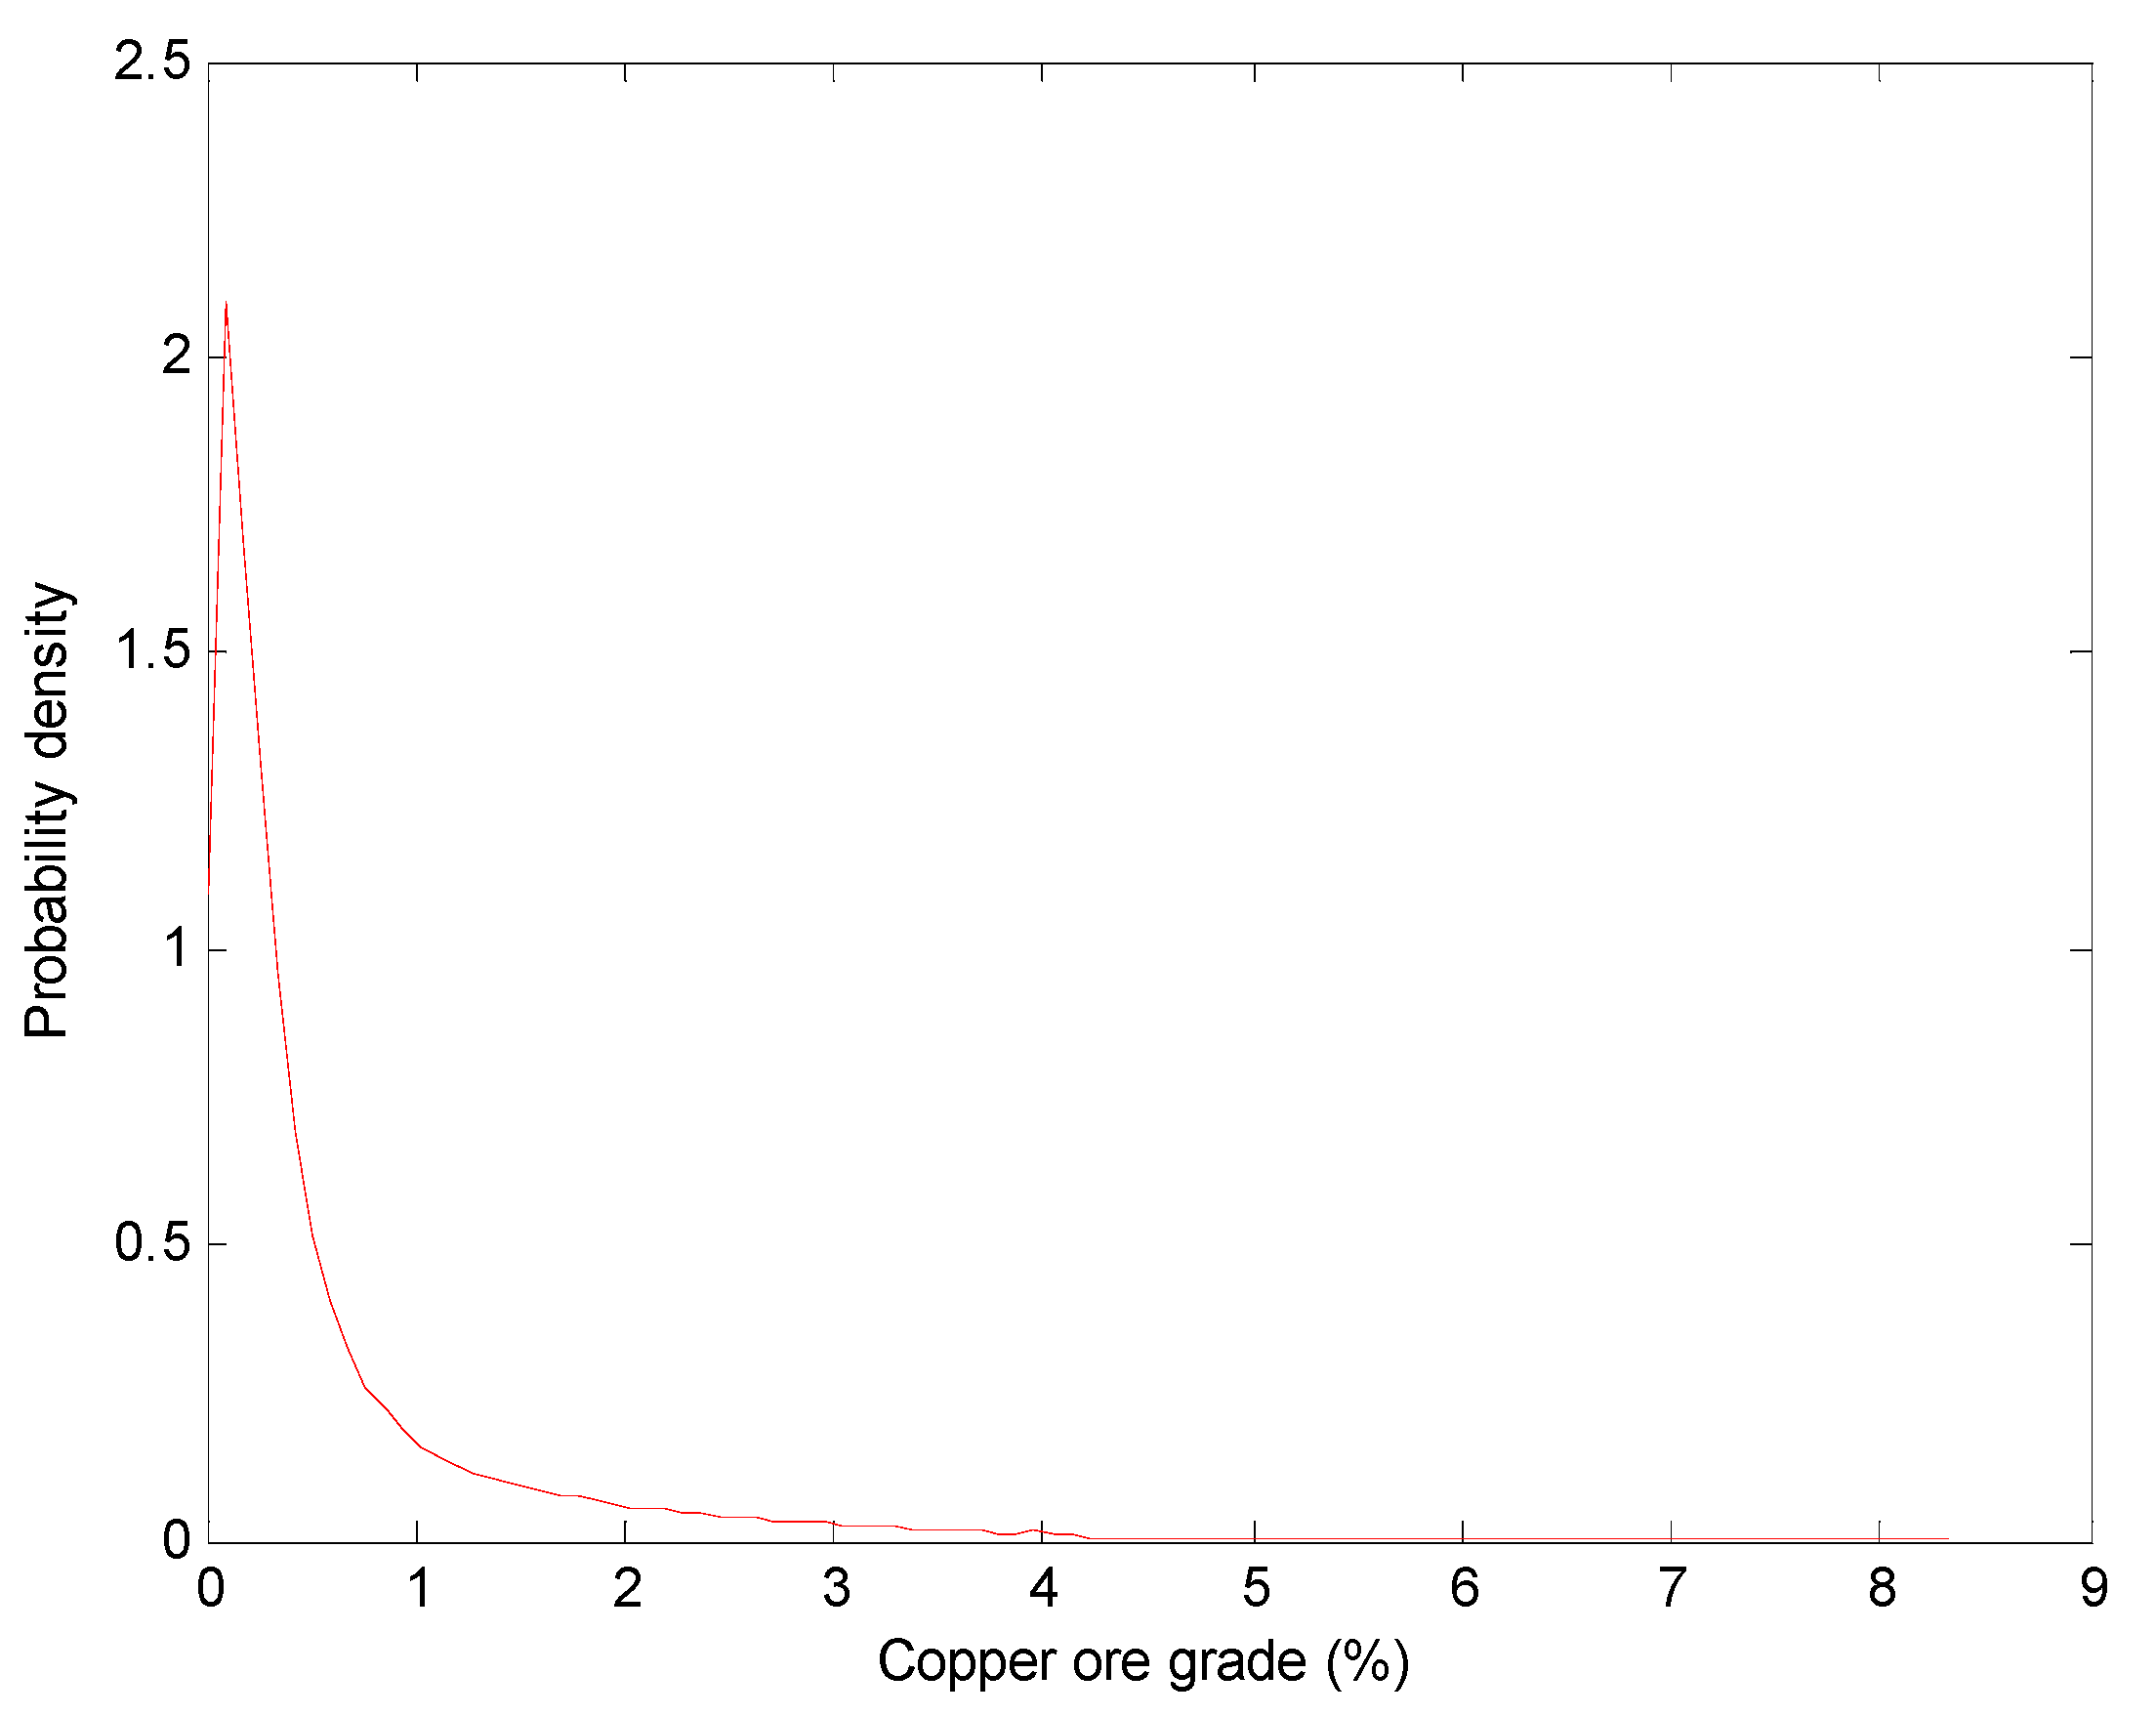
4.2.2. Probability Density of Ore Grade Distribution

The copper ore grade and sample length data provided by the geological department of the Huogeqi Copper Mines. The frequency histogram of the copper ore grade data is shown in Figure 7. The kernel smoothing density function [48] was used to calculate the probability density function of the copper ore grade in Matlab. The density function was then used to calculate the sample size of the probability density function. The probability density function is illustrated in Figure 8. The probability density function obtained by this method is an implicit function, thus it has no specific mathematical expression. It is indicated in the two figures that the probability density function fits well the frequency distribution histogram of copper ore grade.

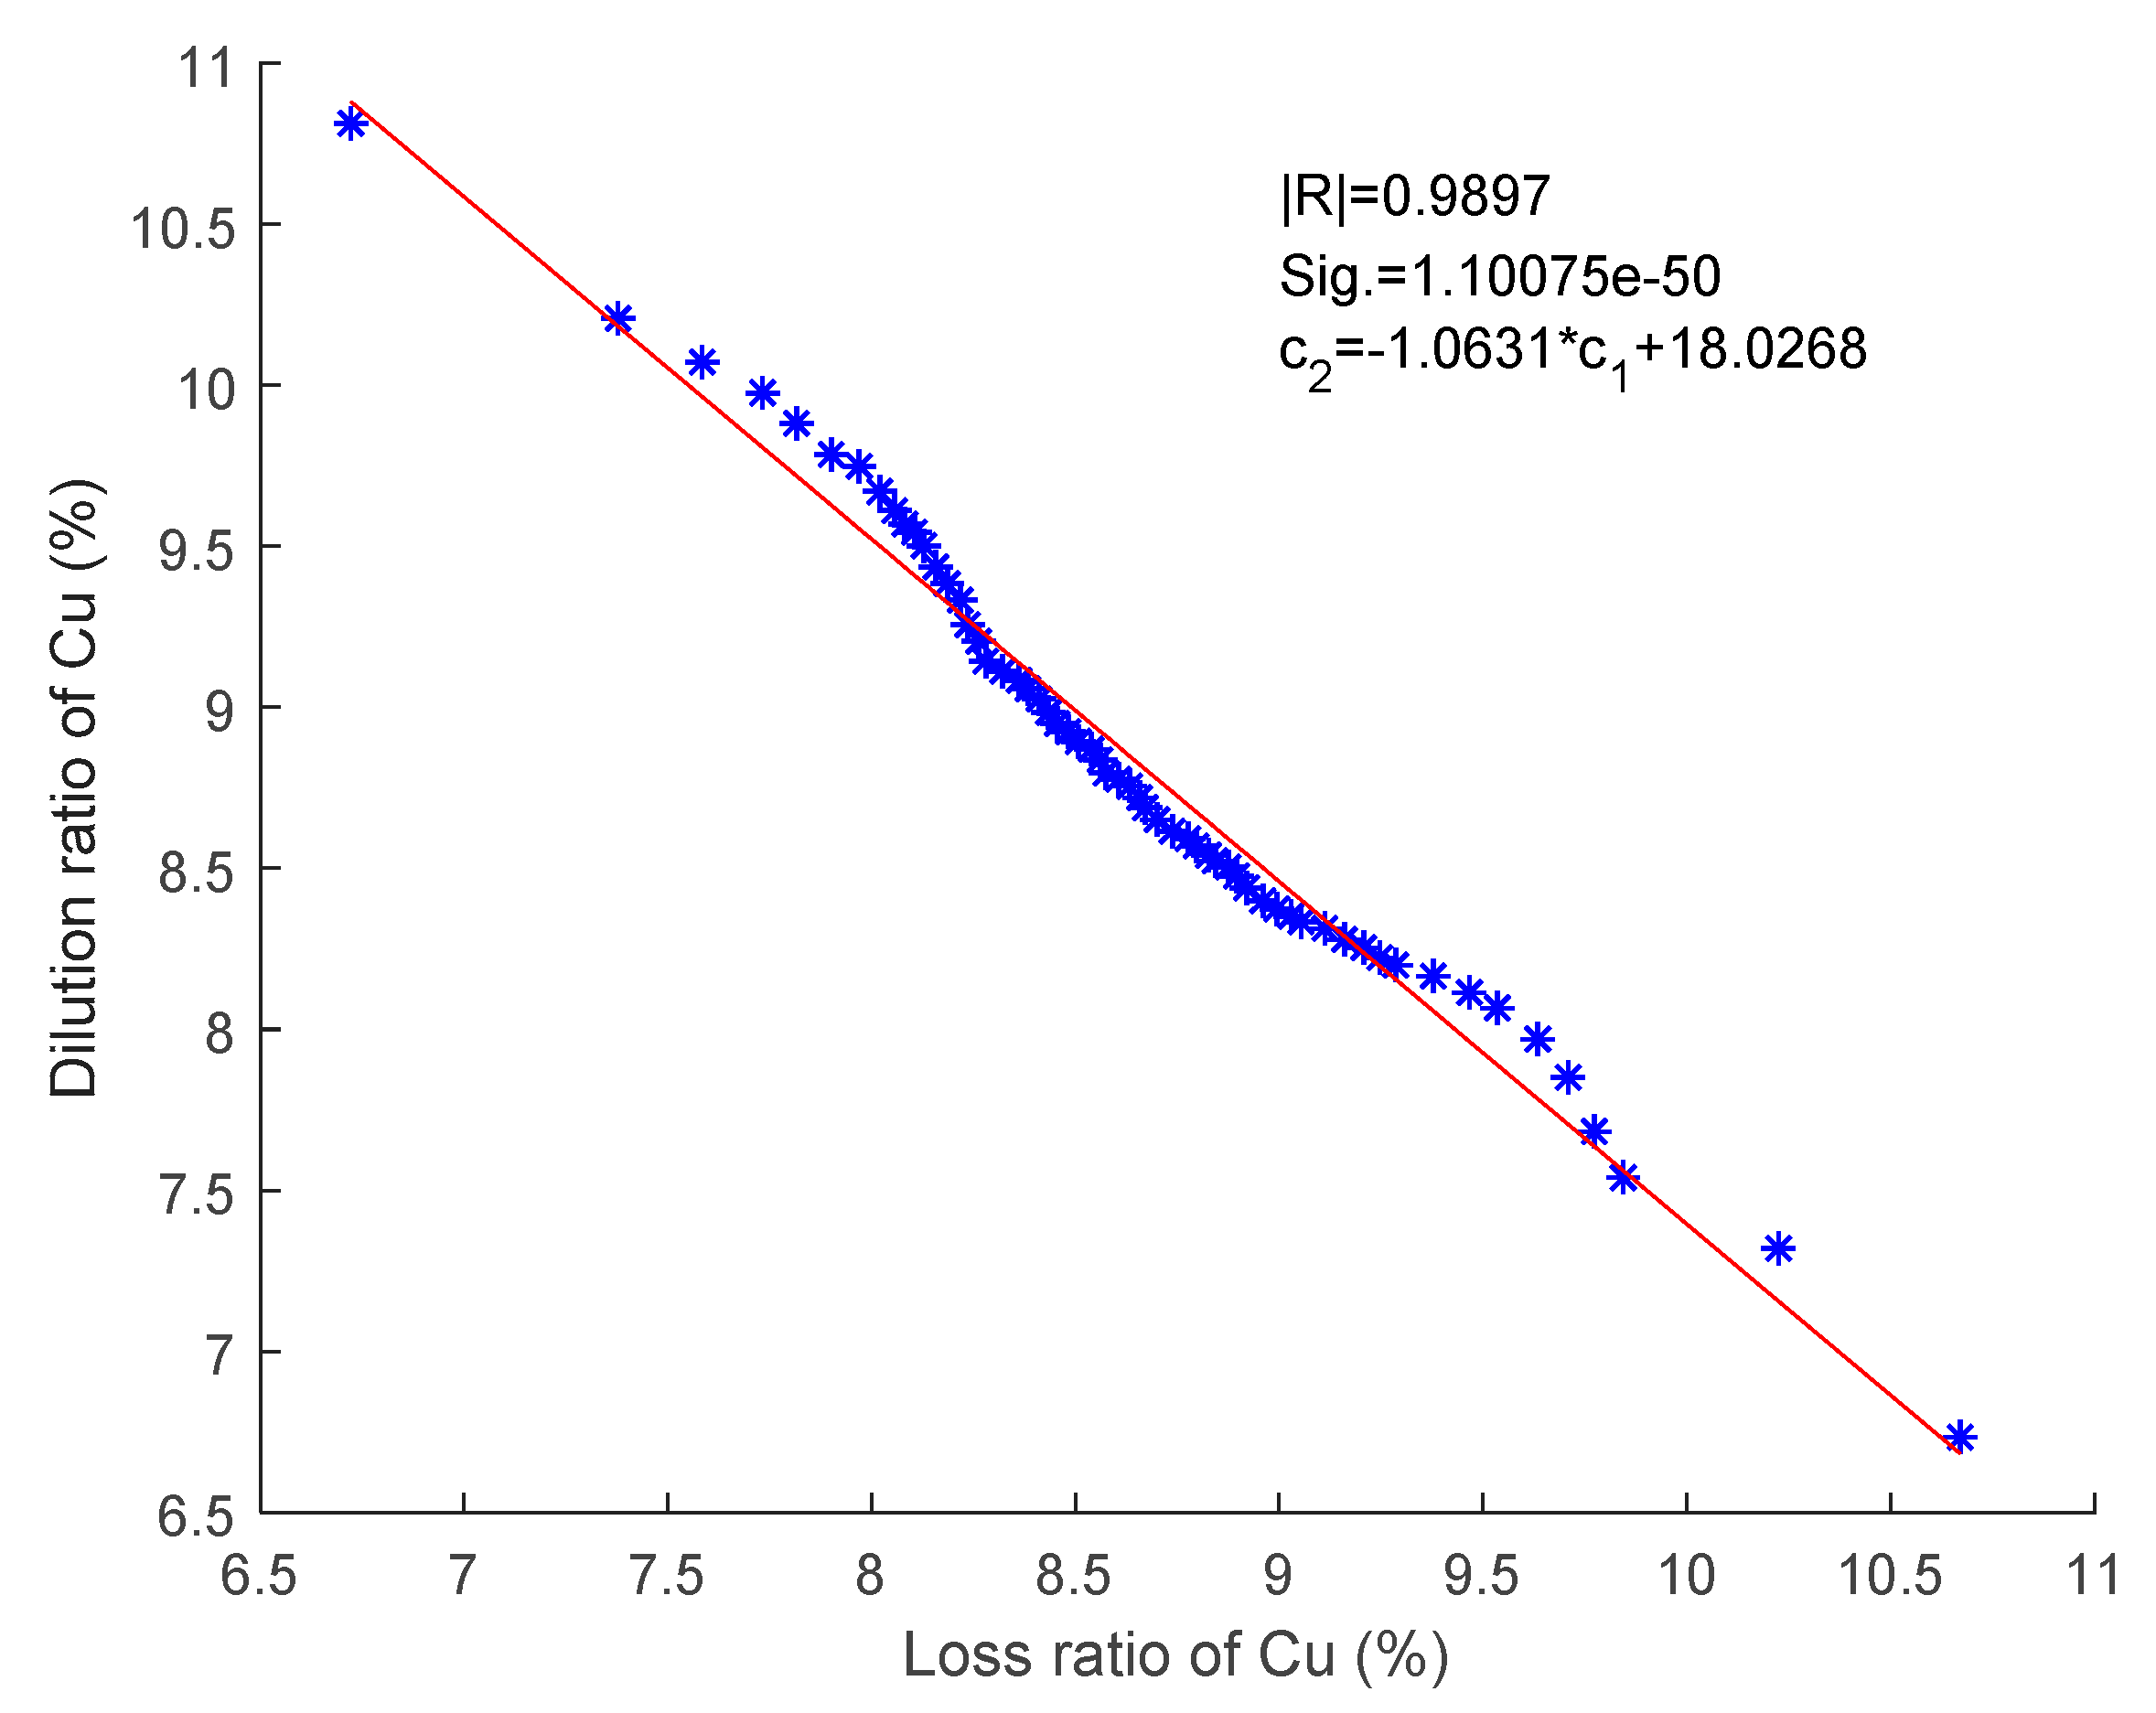
4.2.3. Relationship between Dilution Ratio and Loss Ratio

Dilution ratio and loss ratio of Cu are generally recorded once a month due to the difficulty in measurement. We collected monthly data of the dilution and loss ratio from the Huogeqi Copper Mine. Figure 9 shows that the dilution ratio is linearly correlated with the loss ratio of Cu after filter processing. The calculated linear correlation coefficient between the ratios is −0.9897, and the significance level is 1.0075 × 10−50. As the significance level of 1.0075 × 10−50 is far less than 0.05, the significance test shows that the dilution ratio has a strong linear relationship with the loss ratio of Cu. The dilution ratio of Cu can thus be obtained by
c 2 = f 3 ( c 1 ) = 1.0631 × c 1 + 18.0268 .

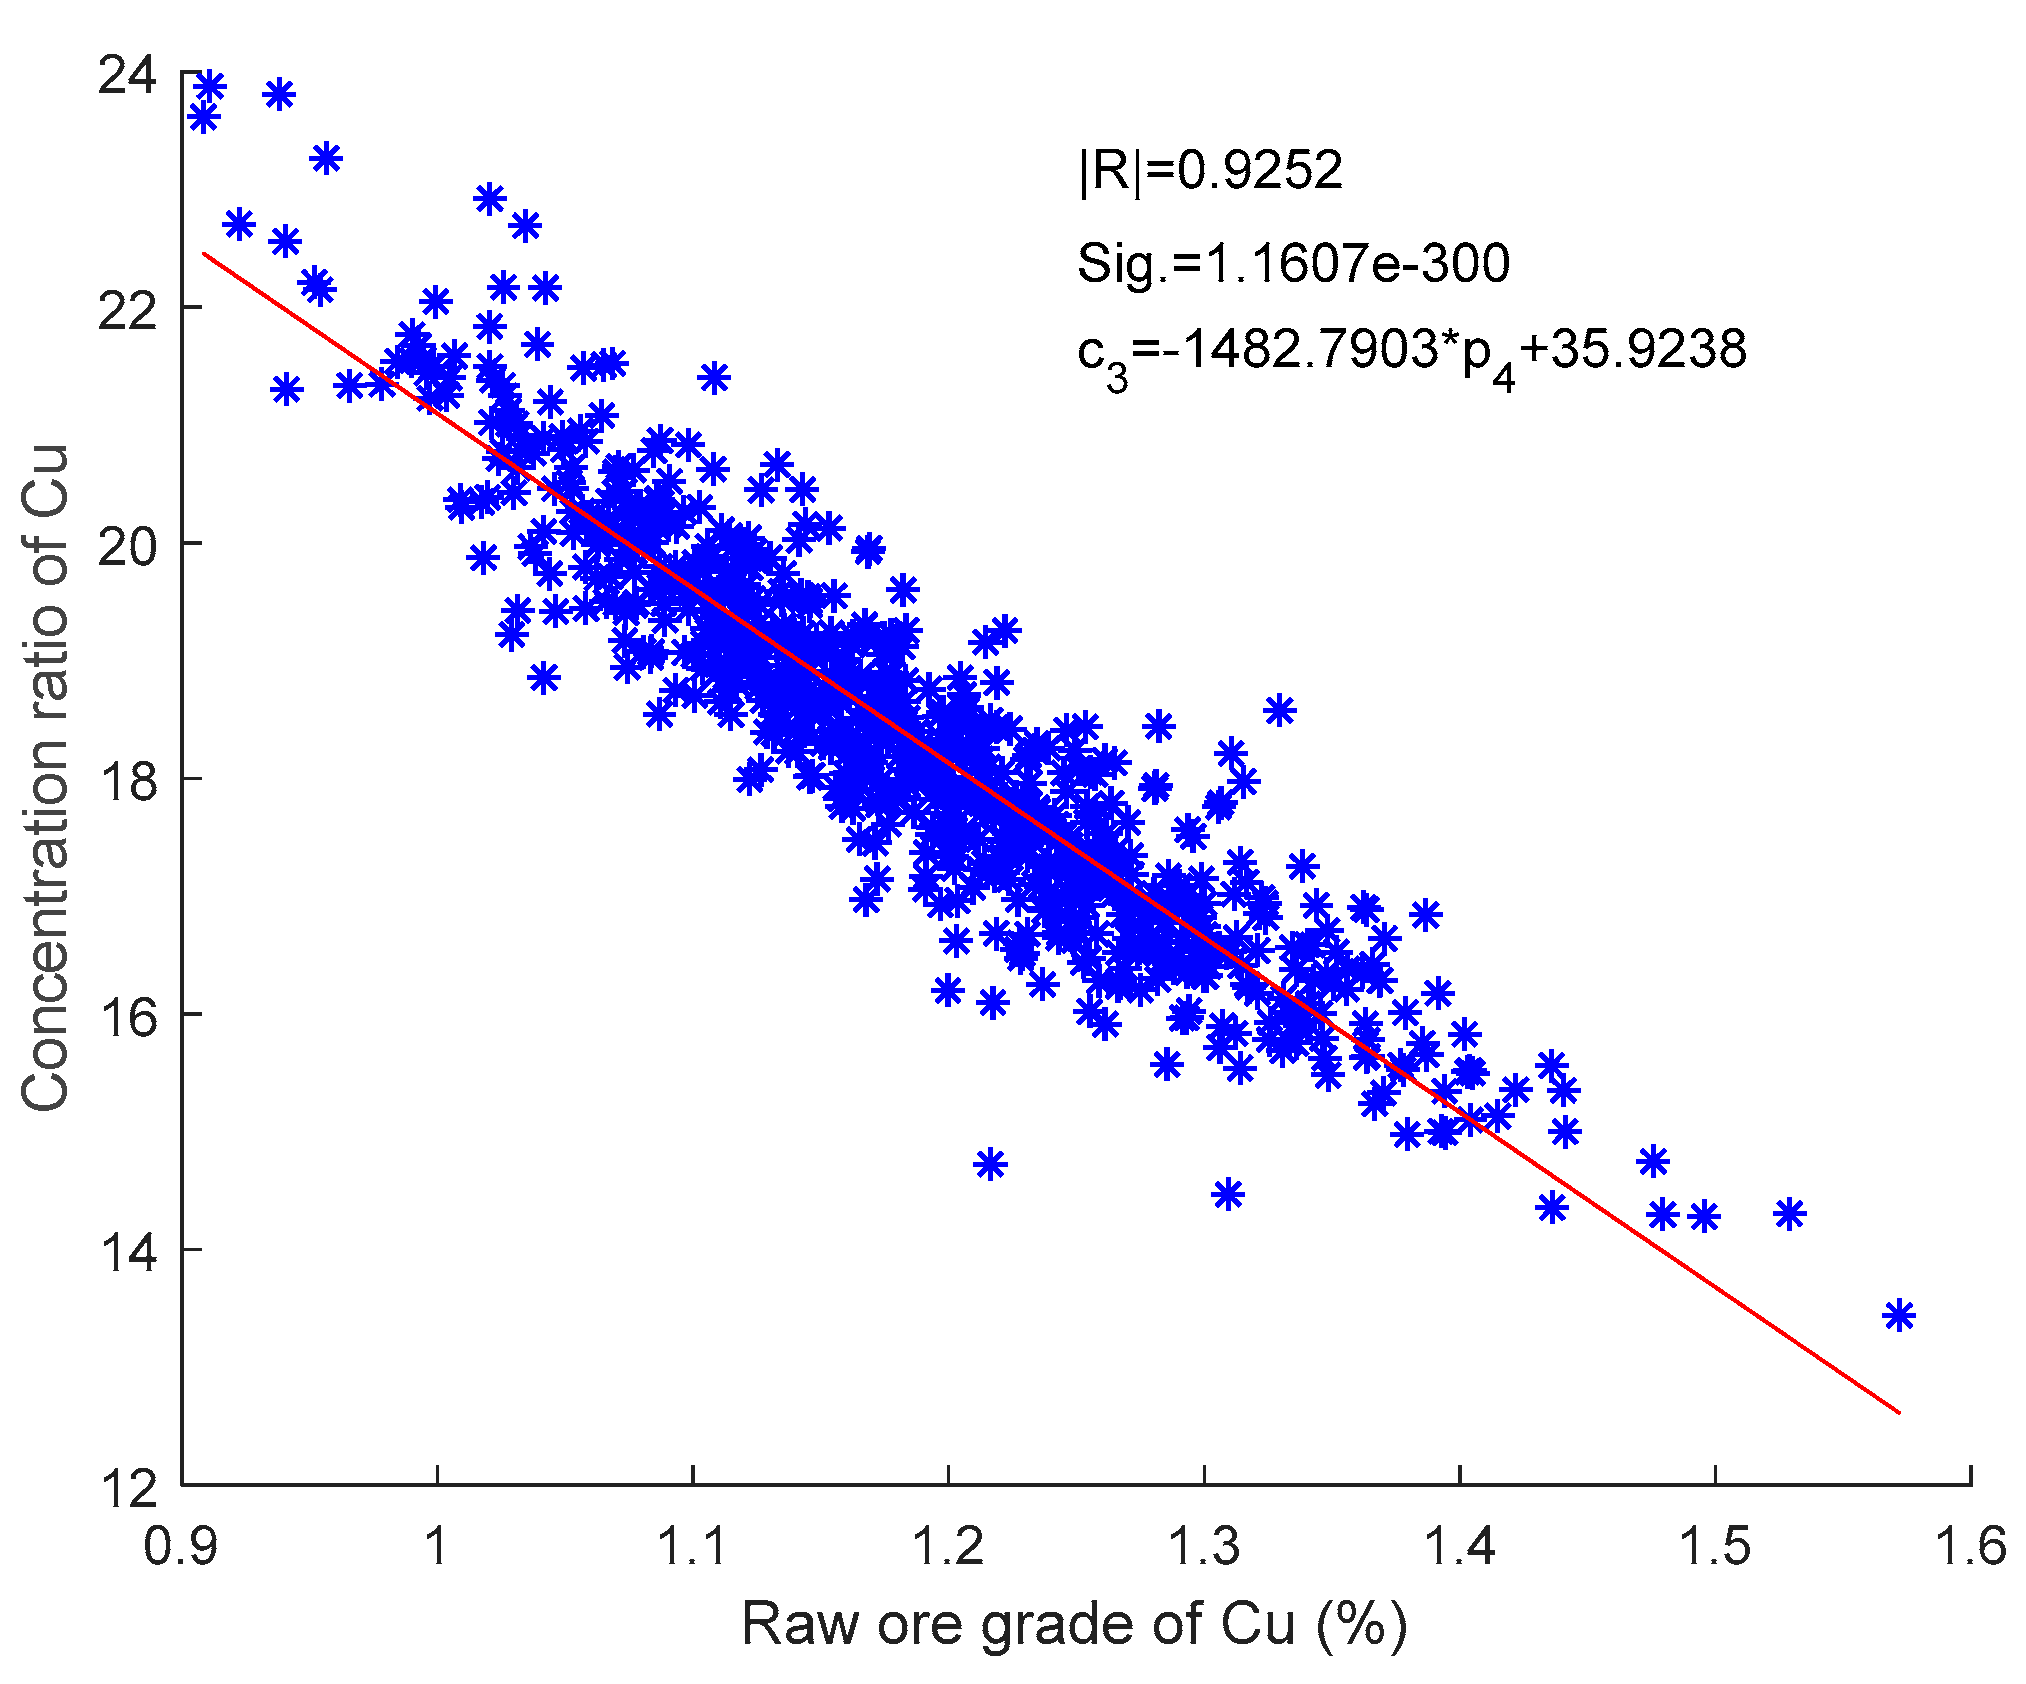
4.2.4. Relationship between Concentration Ratio and Raw Ore Grade

Beneficiation processing data are tested every day. We collected daily data of the minerals from the Huogeqi Copper Mine. Figure 10 shows a clear linear relationship between the concentration ratio and raw ore grade of Cu. The linear correlation coefficient is −0.9252 and the significance level is 1.1607E-300. As the significance level value of 1.1607E-300 is much smaller than 0.05, the significance test shows that the concentration ratio has a strong linear relationship with the raw ore grade of Cu. This concentration ratio of Cu is defined as
c 3 = f 4 ( p 4 ) = 1482.7903 × p 4 + 35.9238 .

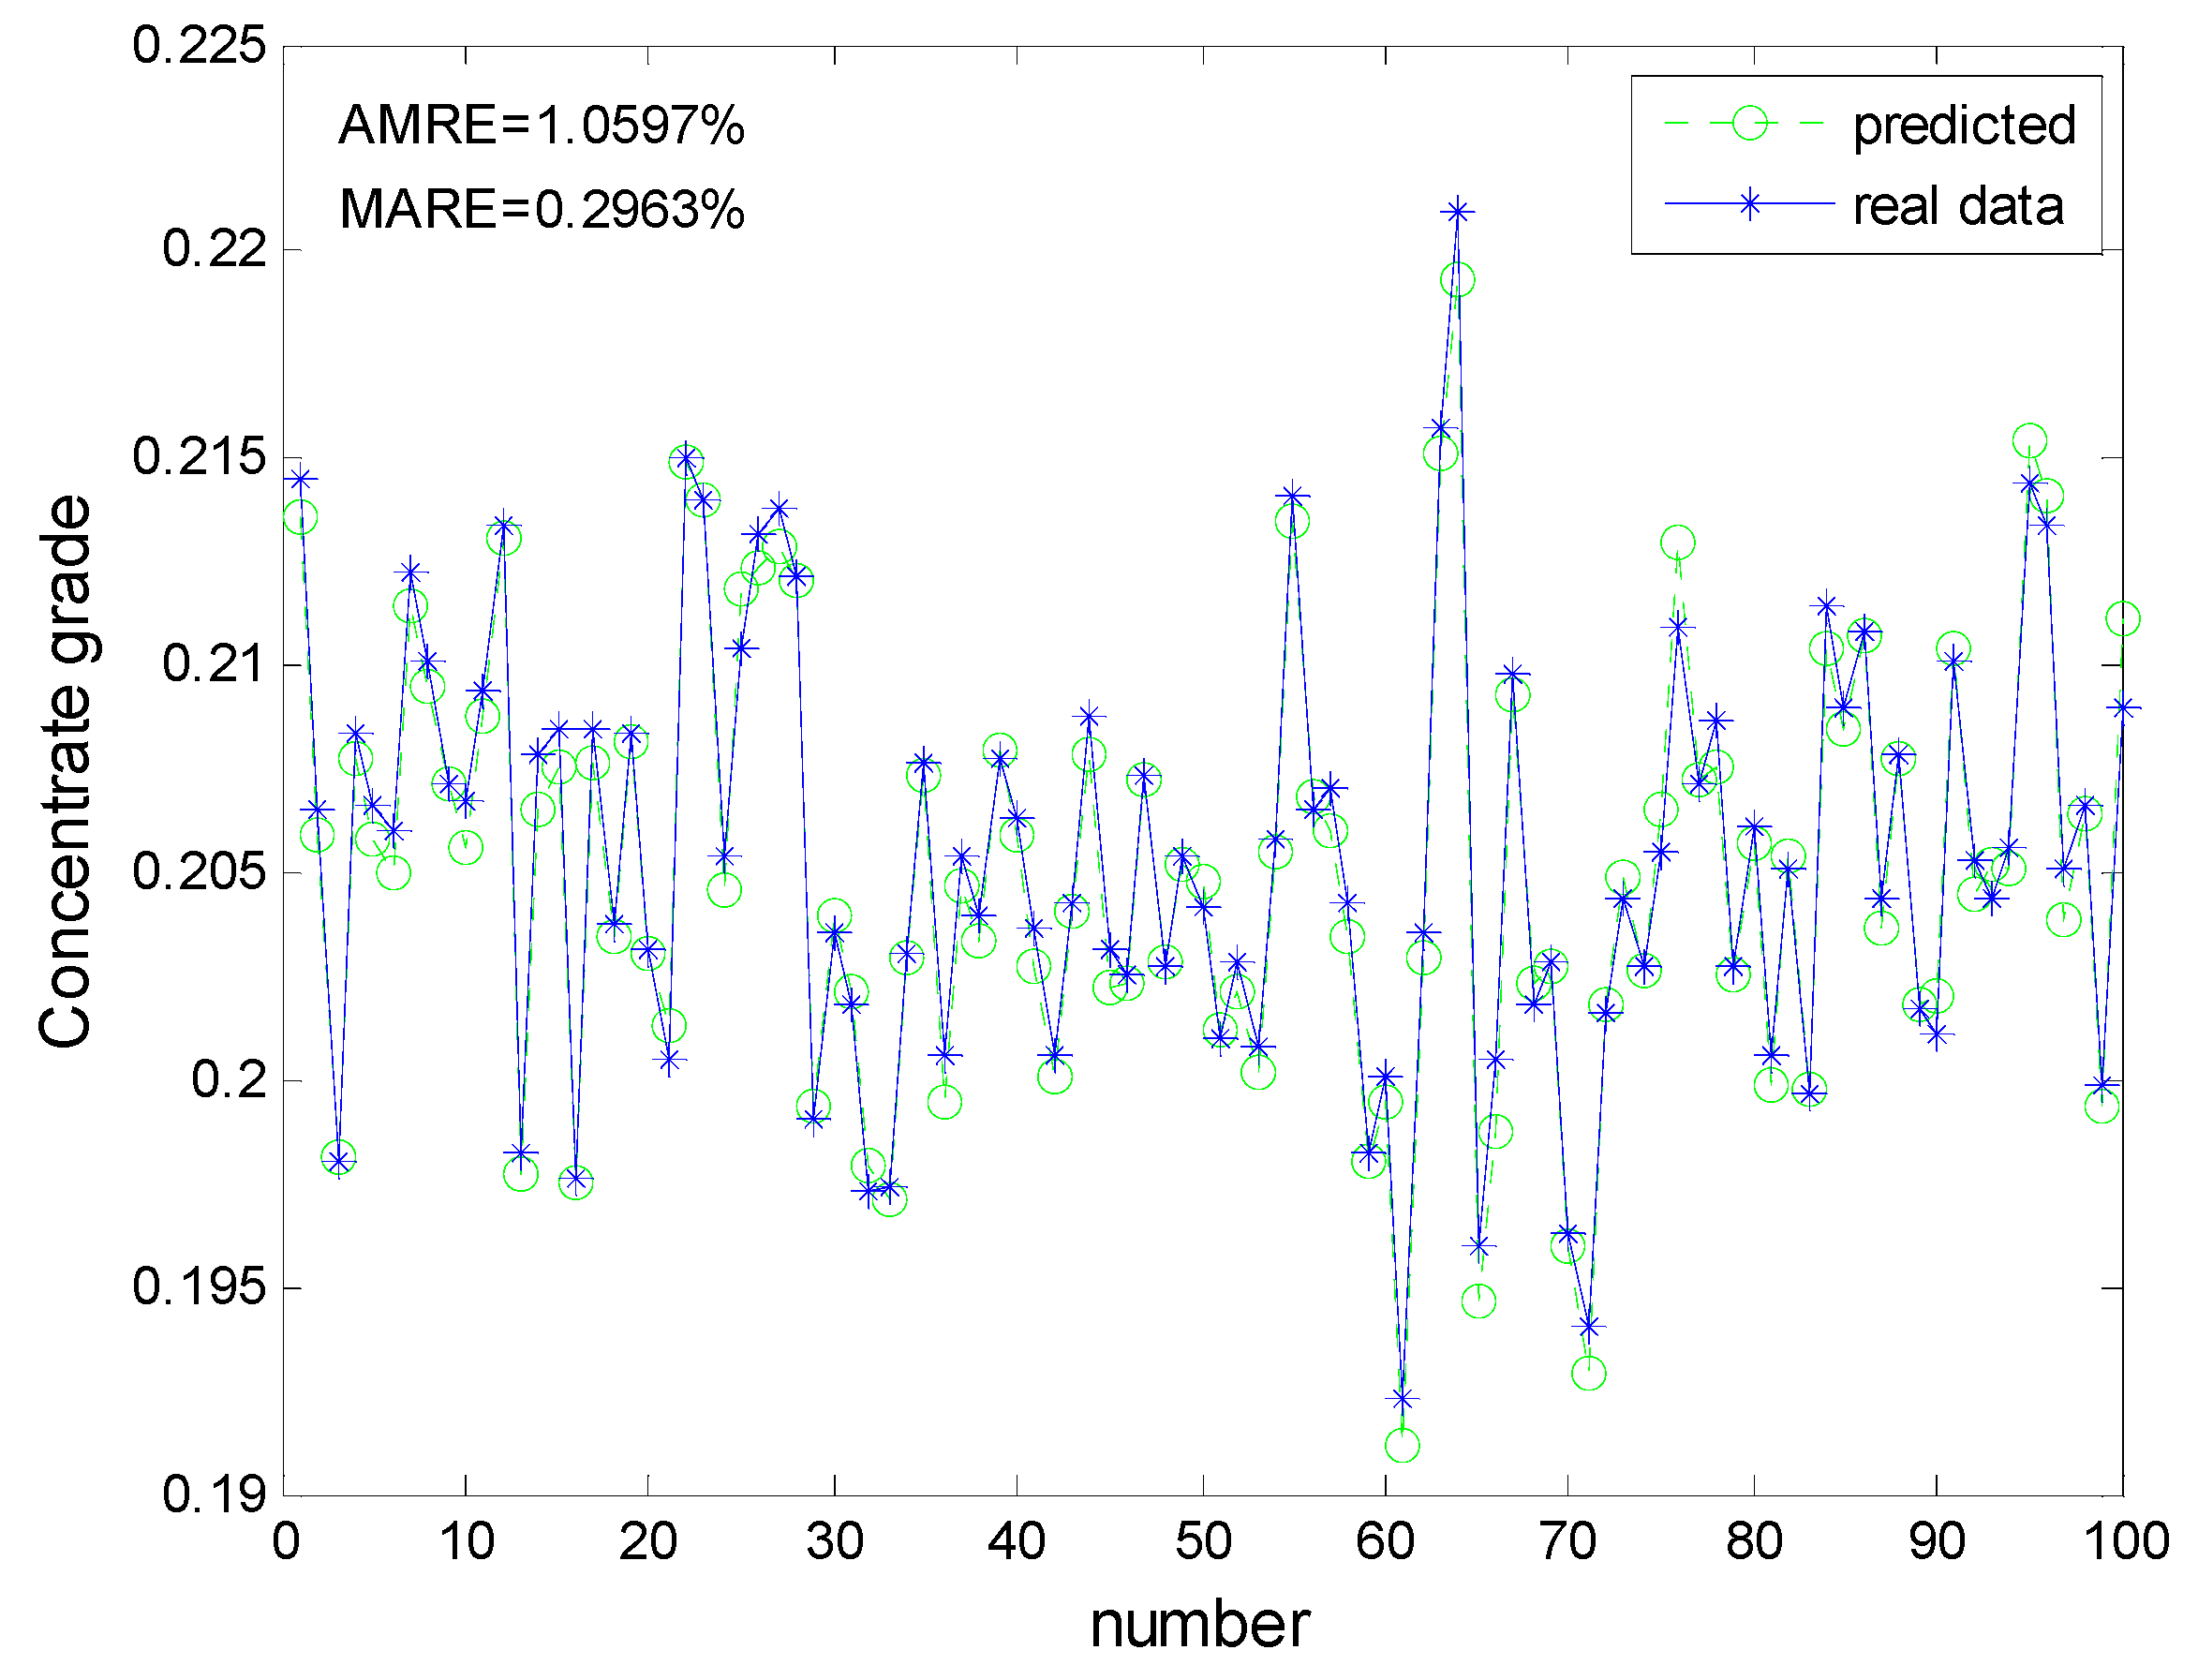
4.2.5. Concentrate Grade, Concentration Ratio and Raw Ore Grade

We built a back-propagation neural network using the concentration ratio and raw ore grade of Cu data as the input and the concentrate grade of Cu data as the output. We have collected 711 groups of daily mineral production data of the Huogeqi Copper Mine. The data from the 1st to 611th days were used as training samples and the data from the 612th to 711th days were treated as test samples.
The built feed-forward back-propagation neural network contains two input nodes, one hidden layer, and one output node. The ‘tansig’ and ‘purelin’ functions were selected as the transfer functions of the hidden layer and the output layer, respectively; ‘traingdm’ was selected as the learning algorithm, and the precision was set as 0.0000001 and the maximum number of iterations was set as 2500. To choose the best-hidden nodes, two statistical parameters called the Mean Absolute Relative Error (MARE) and the Absolute Maximum Relative Error (AMRE) were used. The statistical parameters are calculated in terms of their concentrate grade with different hidden nodes and are presented in Table 1. The MARE and the AMRE reveal that the results obtained using a hidden node of three are superior to the others; thus, the hidden node was chosen to be three. The modelling accuracy of the back-propagation neural network model in predicting the concentrate grade of Cu is demonstrated in Figure 11. As shown in Figure 11, the artificial neural networks models can predict the concentrate grade of Cu at a good accuracy.

4.2.6. Copper Concentrate Transaction Price

The market transaction prices of Chinese copper concentrates are mainly based on #1 copper. The transaction prices of concentrate ores are determined by their concentrate grade. The price of the concentrate grade of 20% of Cu is taken as the reference to determine the price of the concentrates in the copper mines. There is a compensation price if the concentrate grade is not 20% of Cu. In addition, if the concentrate grade is different from the #1 copper of Shanghai Transaction Institute, there will be a price coefficient to adjust the difference in copper concentrate.
The compensation price and price coefficient are shown in Table 2, which corresponds to the grade of copper concentrate obtained from the Huogeqi Copper Mine. The transaction price is calculated as
q = f 6 ( p 5 ) = q 1 × p 5 × λ + q 2
where q 1 is the price of the #1 Shanghai Stock Exchange copper settlement; λ is the pricing coefficient and q 2 is the compensation price.

4.3. Production Process of the Huogeqi Copper Mine Using the NSGA-II

4.3.1. Parameters of the Huogeqi Copper Mine and NSGA-II Model

Here, we used the proposed NSGA-II model to optimize the Huogeqi Copper Mine production process over the next five years. According to the production requirements of the Huogeqi Copper Mine, the geological cut-off grade ranges from 0.1% to 0.9% of Cu, the minimum industrial grade ranges from 0.1% to 0.9% of Cu and the dilution ratio ranges from 6% to 12% of Cu. The parameters used for the proposed model of the Huogeqi Copper Mine and the NSGA-II are presented in Table 3.

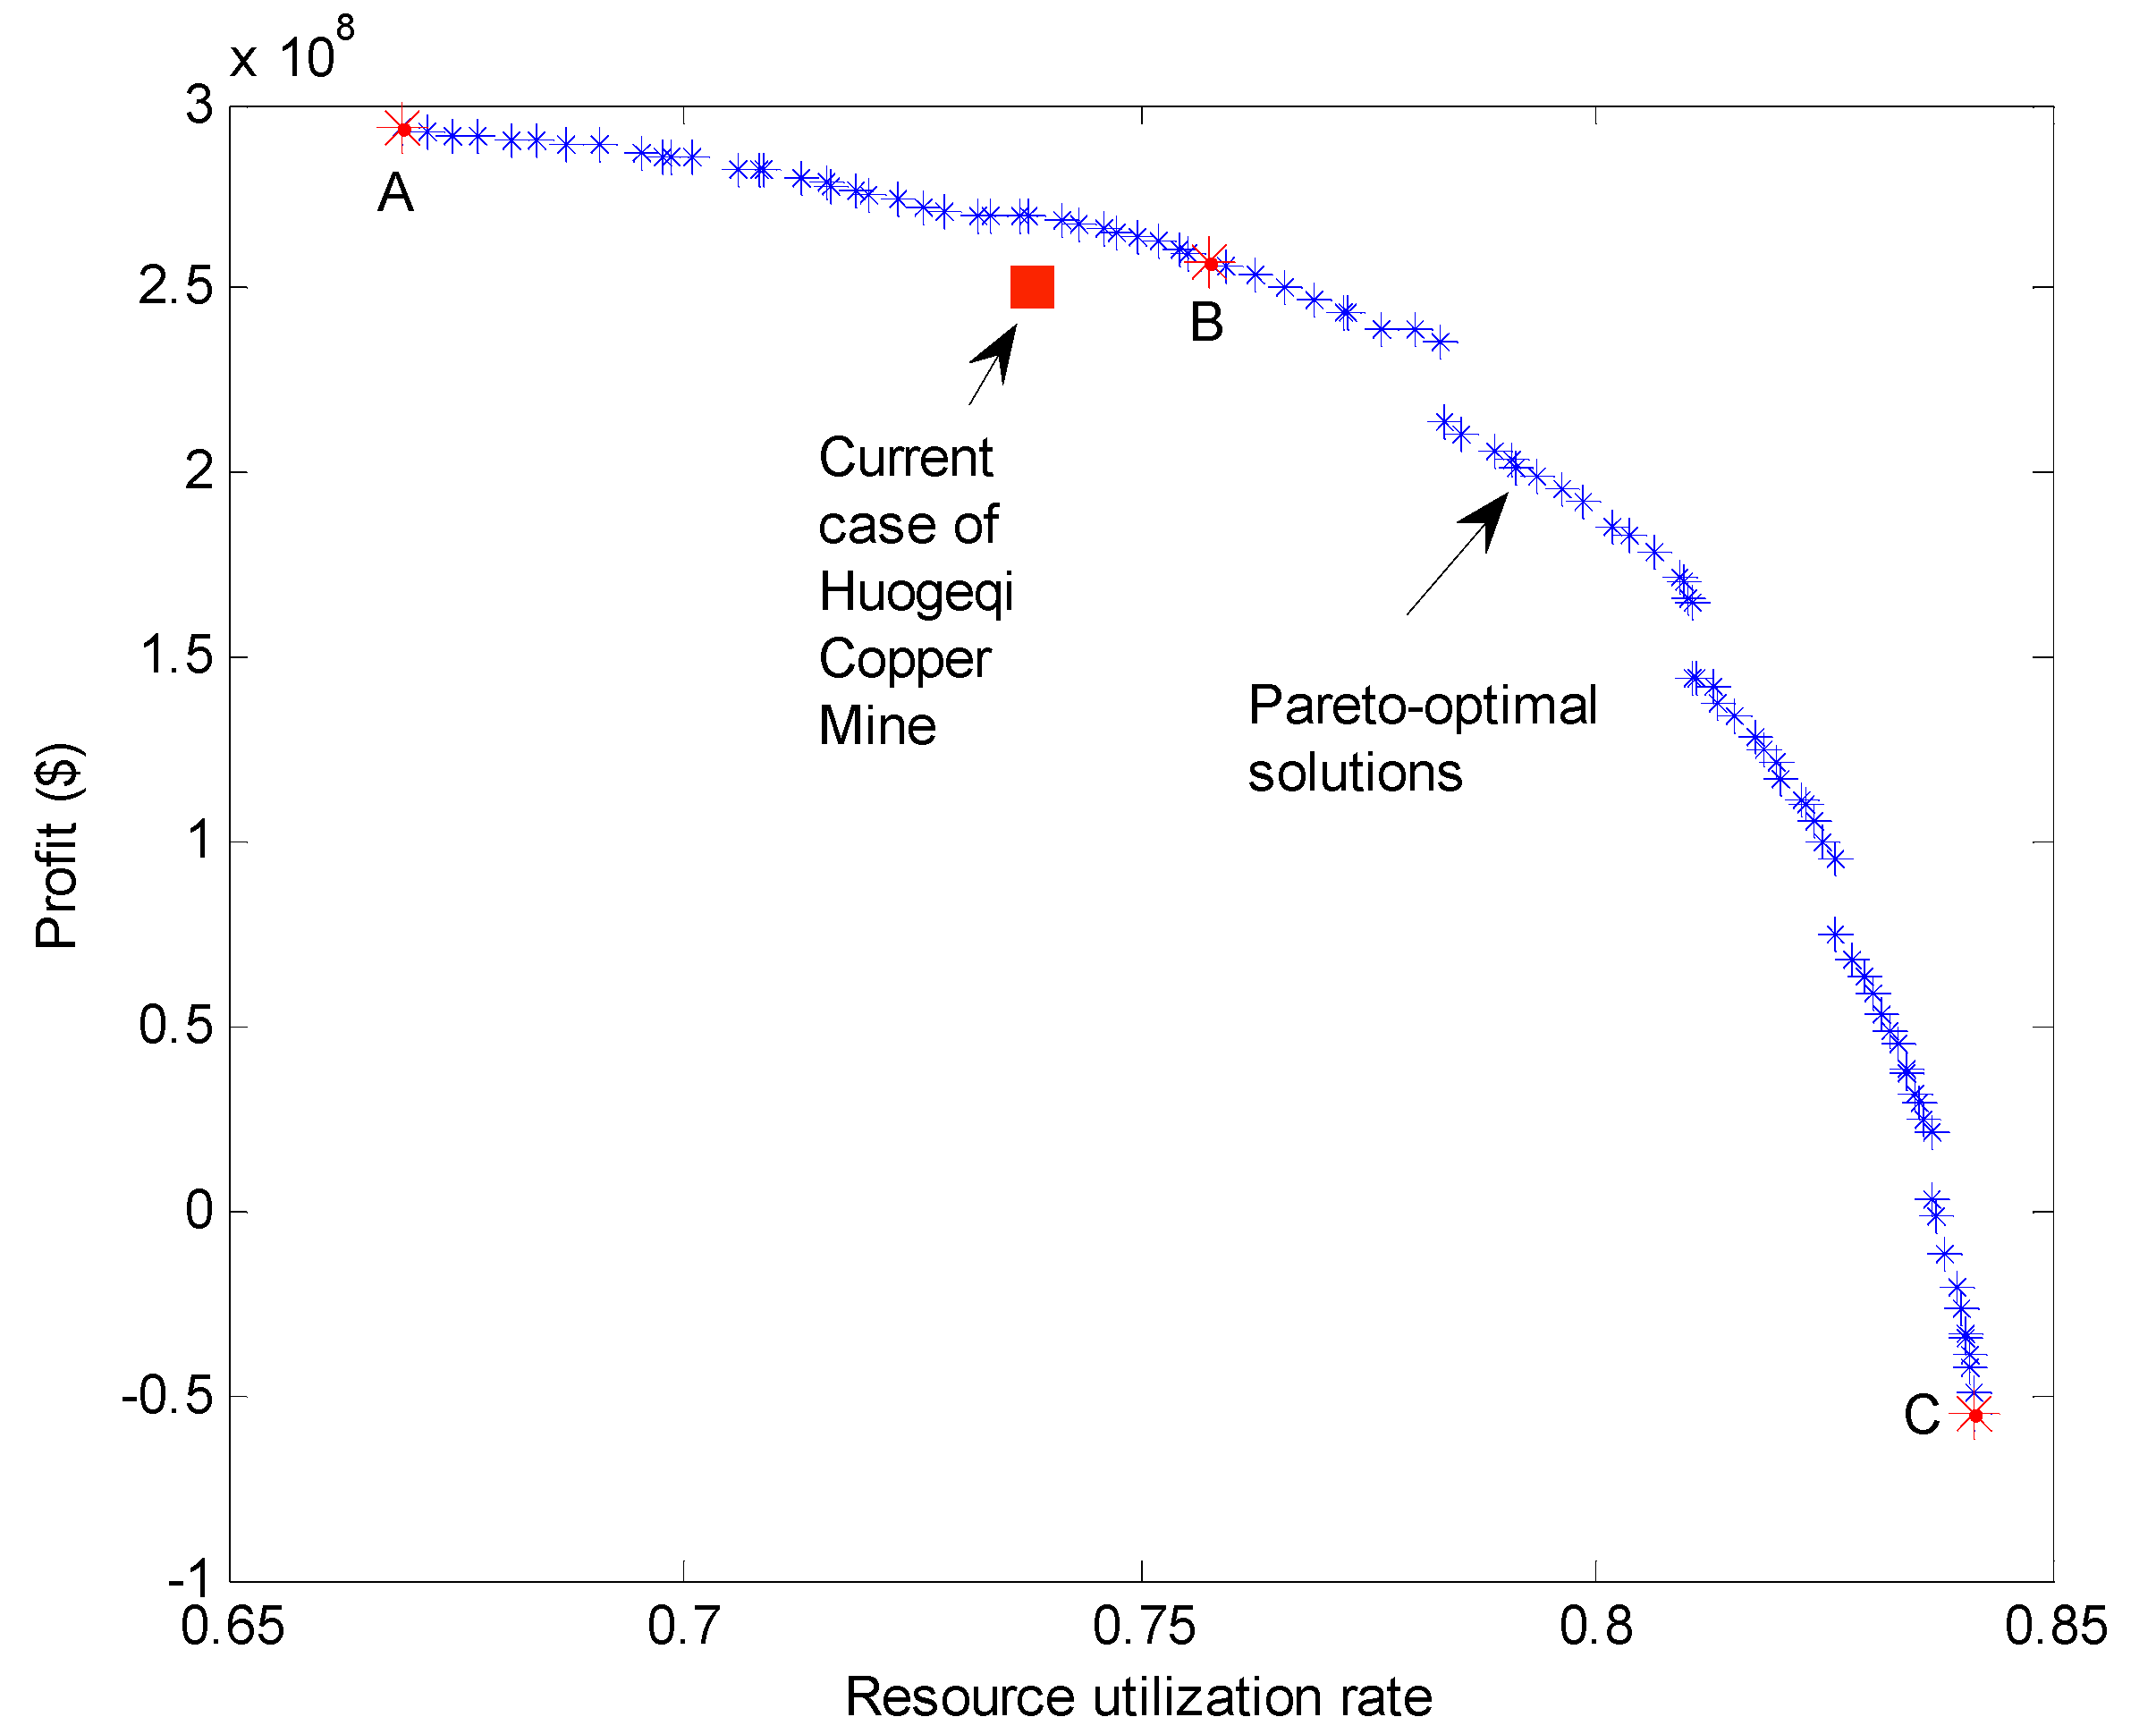
4.3.2. Optimization Results Using NSGA-II

In this study, the optimization process was implemented in MATLAB2010b. Figure 12 shows the Pareto-optimal solutions of the Huogeqi Copper Mine production process obtained by the multi-objective optimization. The blue stars in Figure 12 are the optimized solutions in the two objective spaces with the data collected in the Huogeqi Copper Mines optimized by the NSGA-II algorithm.
The Pareto-optimal solutions clearly reveal the compromises between the two objectives, i.e., the profits and the resource utilization rate. An increase in profits will lead to a decrease in the resource utilization rate and vice versa. This result shows that multi-objective optimization techniques are required for the optimization of metal mines production. Since the Pareto-optimal solutions are the optimized ones, any of them is an acceptable solution. The choice of the final solution depends on the demands of the decision makers.
As shown in Figure 12, the maximum profit occurs at point A, where the resource utilization rate is the smallest. Point A represents the best value for the single objective function of economic benefit. However, it should be noted that laws forbid maximum profit under minimal resource use. On the other hand, the maximum resource utilization rate occurs at point C, where profit is the lowest. Point C is the optimal value for the single objective function of resource efficiency.
In fact, the points A and C are the optimization results of a single objective model. It is clearly shown in Figure 12 that the optimized results can describe the relationship between the two objectives. The decision makers can choose to apply the results with their specific objectives.
Table 4 shows three typical points in the optimization results (Pareto-optimal solutions), i.e., A B and C, as well as the current case of the Huogeqi Copper Mine. The result of the optimization at Point B includes an increase of 2.99% in profits and of 2.64% of Cu in resource utilization rate than the current case of the Huogeqi Copper Mine. As shown in Figure 12, the current state of the Huogeqi Copper Mine is not on the curve of the optimized solutions. Thus, further optimization is applicable to the mine to achieve better profit as well as a good resource utilization rate.

5. Discussion

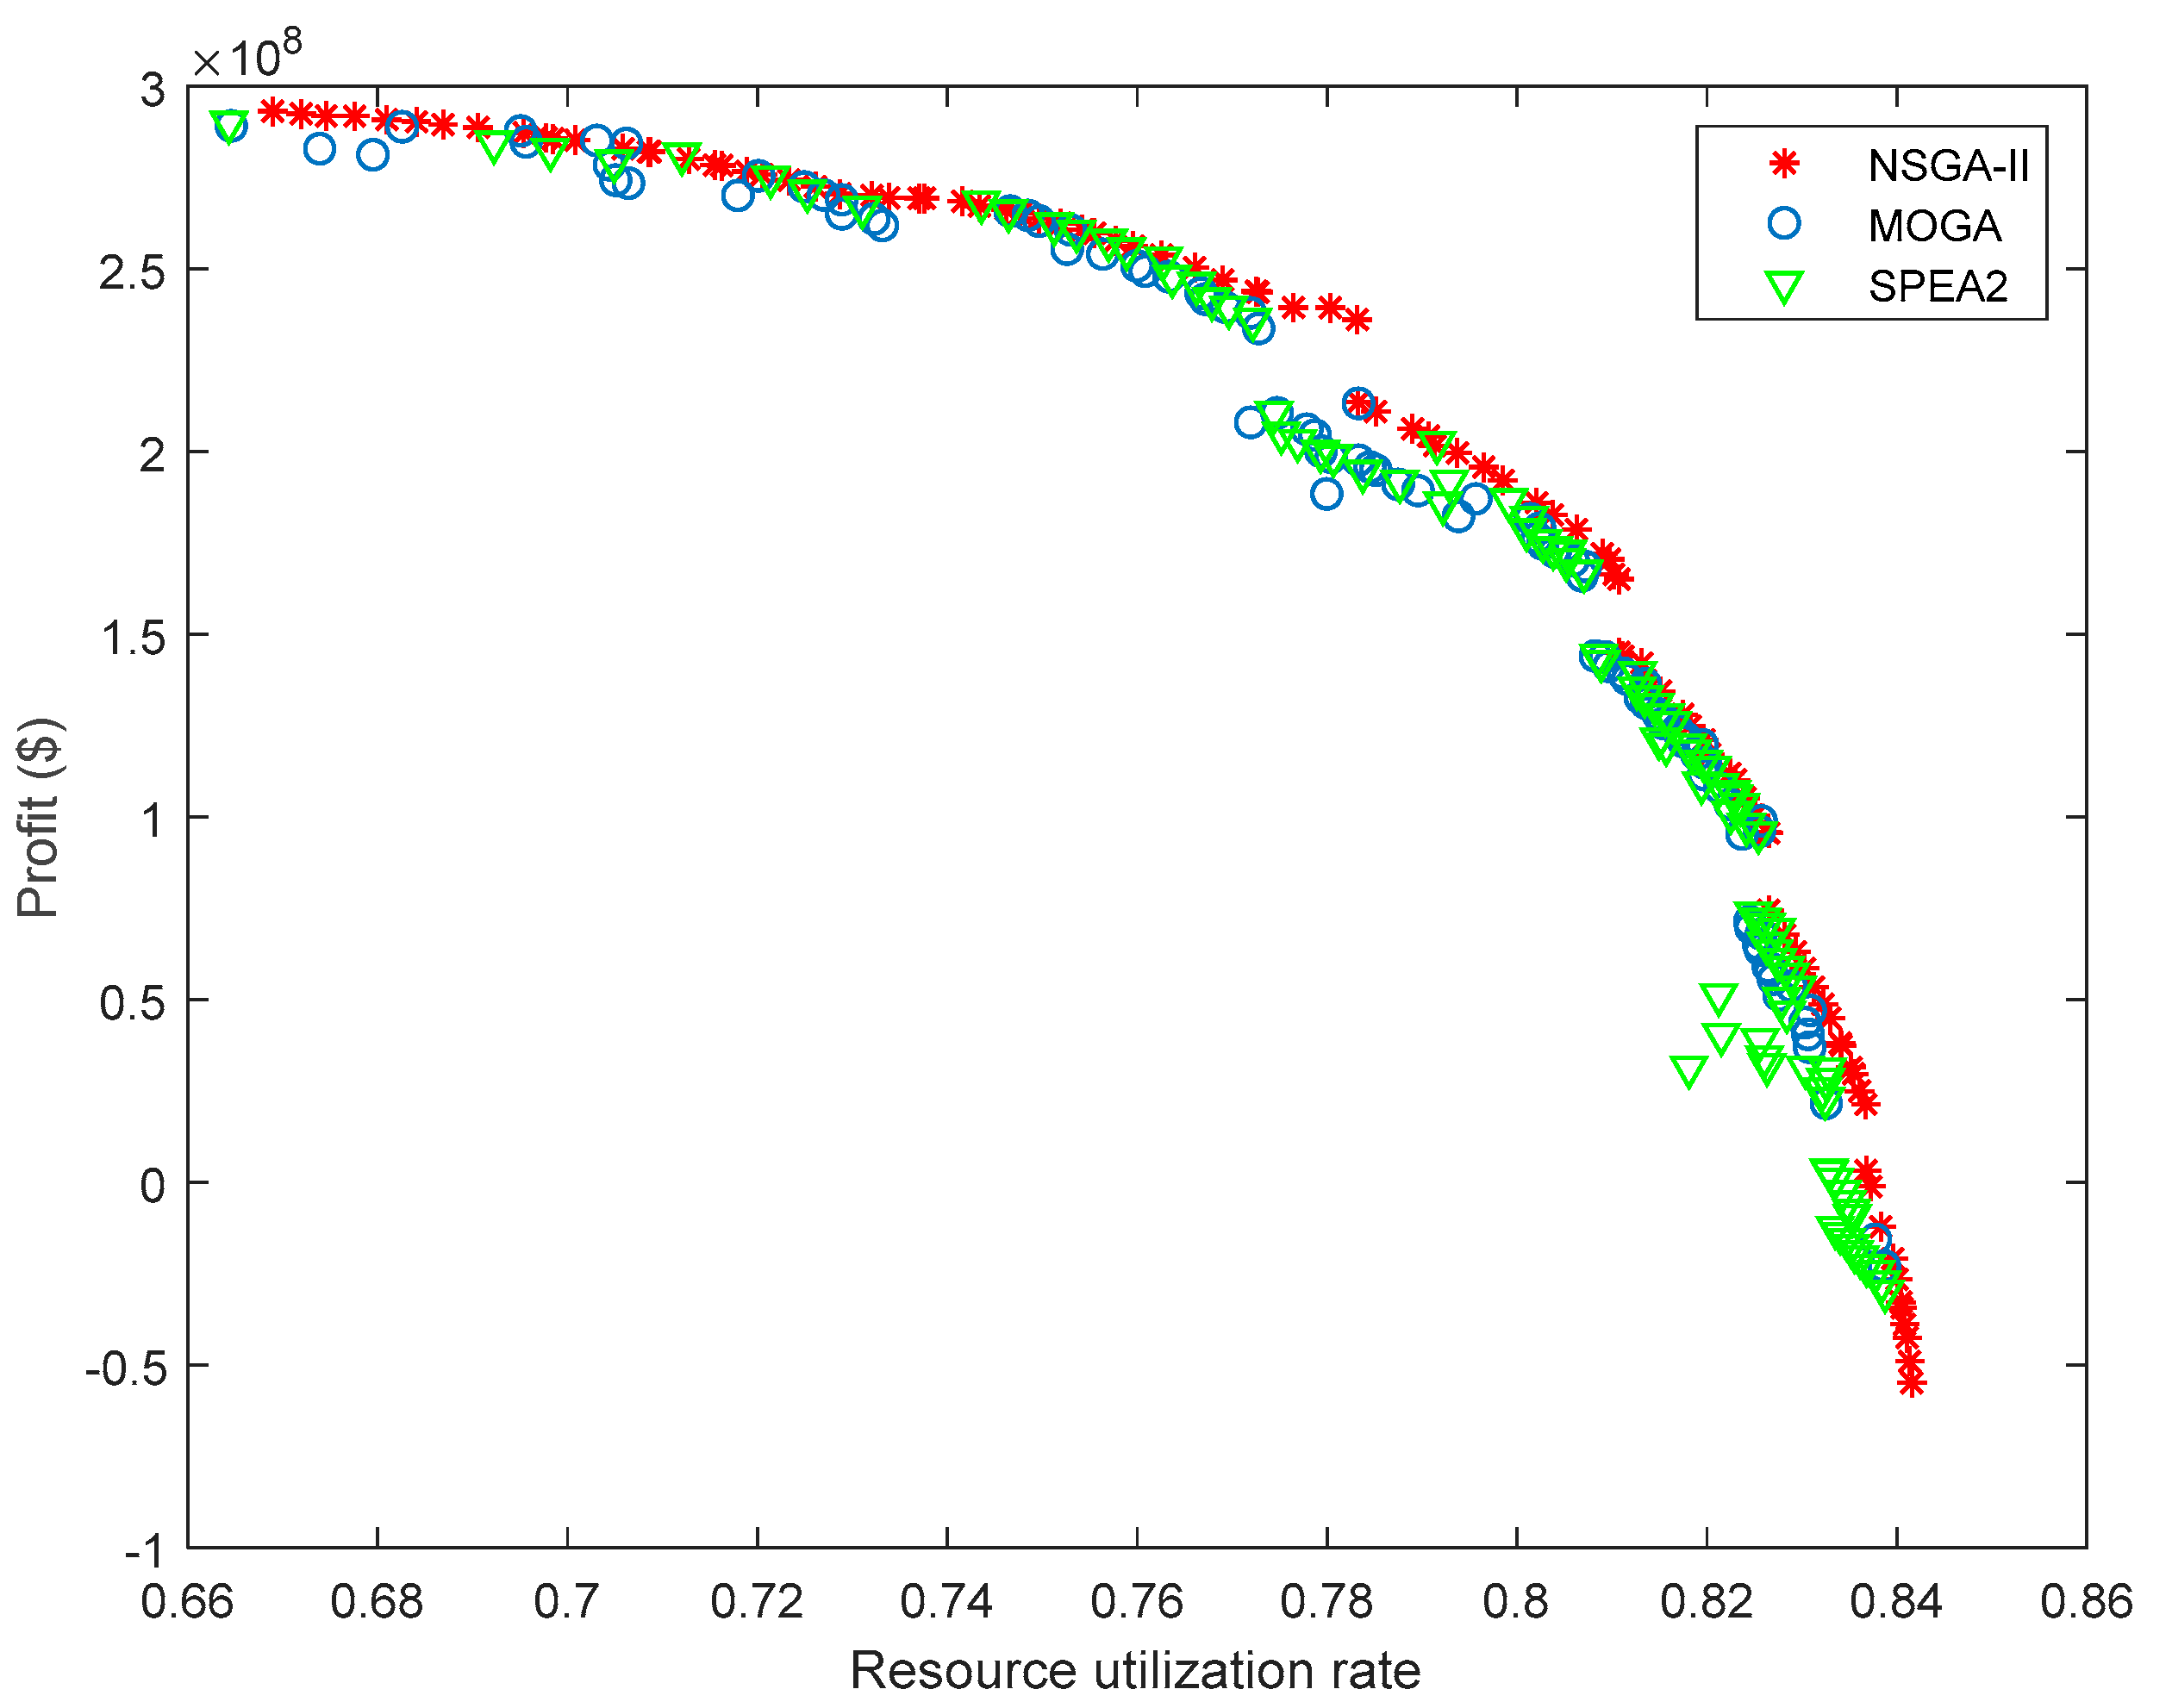
5.1. Comparison of Different Optimization Algorithms

Two algorithms, i.e., the Multi-Objective Genetic Algorithms (MOGA) [49] and Improved Strength Pareto Evolutionary Algorithm (SPEA2) [50] are also presented comparatively, beside the NSGA-II, to optimize the production process of the Huogeqi copper mines. The diversity indicator [51] was used to evaluate the performance of different algorithms.
The diversity defines the spread extent among the obtained non-dominated solutions and can be expressed as [43]
d = d f + d l + i = 1 N p 1 | d i d ¯ | d f + d l + ( N p 1 ) d ¯
where d is the diversity; d f and d l are respectively the Euclidean distances between the extreme target vectors in the real Pareto-optimal front and the boundary target vectors in the obtained objective domain; d i is the Euclidean distances between two adjacent target vectors in the obtained objective domain; d ¯ is the average of all distances. The small value of diversity corresponds to indicate the good non-dominated solution.
The parameters of the NSGA-II, MOGA and SPEA2 were set as follows: The population size N p = 100 , the maximum number of iterations N max = 100 , the crossover index was 20, the mutation index was 20, the crossover probability was 0.5, and the mutation probability was 1/3. The Pareto-optimal solutions obtained by the NSGA-II, MOGA and SPEA2 are shown in Figure 13. Their diversity values are respectively 0.8661, 0.8909 and 0.9697. As indicated in Figure 14, the NSGA-II outperforms the MOGA and SPEA2 in optimization of the production process of the Huogeqi copper mines. In addition, the diversity obtained by the NSGA-II is smaller than that by the MOGA and the SPEA2, which also indicates that the NSGA-II has better uniformity for solution distribution.
Therefore, the NSGA-II outperforms the MOGA and SPEA2 in optimization of the production process of the copper mines. It can provide better solution uniformity than the other methods.

5.2. Effect of Decision Variables on the Objective Function

Variance analysis is able to estimate the effect of various process parameters on the response. This effect is expressed in terms of the F ratio or percentage contribution. The higher the F ratio is, the more important the corresponding factor is [52,53,54]. Here, variance analysis was employed to analyze the effect of the decision variables of the geological cut-off grade, minimum industrial grade and loss ratio on the objective functions of profit and the resource utilization rate.
Table 5 shows the variance analysis results obtained for profit. The tabulated F-values for the geological cut-off grade, minimum industrial grade and loss ratio of Cu are F0.05(7,99) = 0.3053, F0.05(7,99) = 0.3053 and F0.05(10,99) = 0.3862, respectively, at the 95% confidence interval. The variance analysis F-values for the geological cut-off grade, minimum industrial grade and loss ratio of Cu are 76.38, 51.2 and 2.22, respectively, which are higher than their corresponding tabulated F-values, i.e., 0.3053, 0.3053 and 0.3862. As the P-values of all decision parameters are less than 0.05, the null hypothesis does not stand. Therefore, all decision variables have significant effects on the function of profit. Moreover, the variance analysis results indicate that the profit is mainly affected by the geological cut-off grade of Cu, which has a contribution of 58.84%, and the minimum industrial grade of Cu, which has a contribution of 39.45%; in contrast, the contribution of the loss ratio of Cu (1.71%) is very low.
Table 5 shows the variance analysis obtained for the resource utilization rate. The variance analysis F-values for the geological cut-off grade, minimum industrial grade and loss ratio of Cu are 2543.23, 1275.61 and 874.42, respectively, which are much higher than their corresponding tabulated F-values, i.e., F0.05(7,99) = 0.3053, F0.05(7,99) = 0.3053 and F0.05(10,99) = 0.3862. As the p-values of all decision parameters are less than 0.05, the null hypothesis is rejected. Therefore, for the resource utilization rate, all decision variables are considered significant. Moreover, the variance analysis results indicate that the geological cut-off grade of Cu is the most important decision variable, with a contribution of 54.19%; in contrast, the contributions of the minimum industrial grade and loss ratio of Cu are 27.18% and 18.63%, respectively.

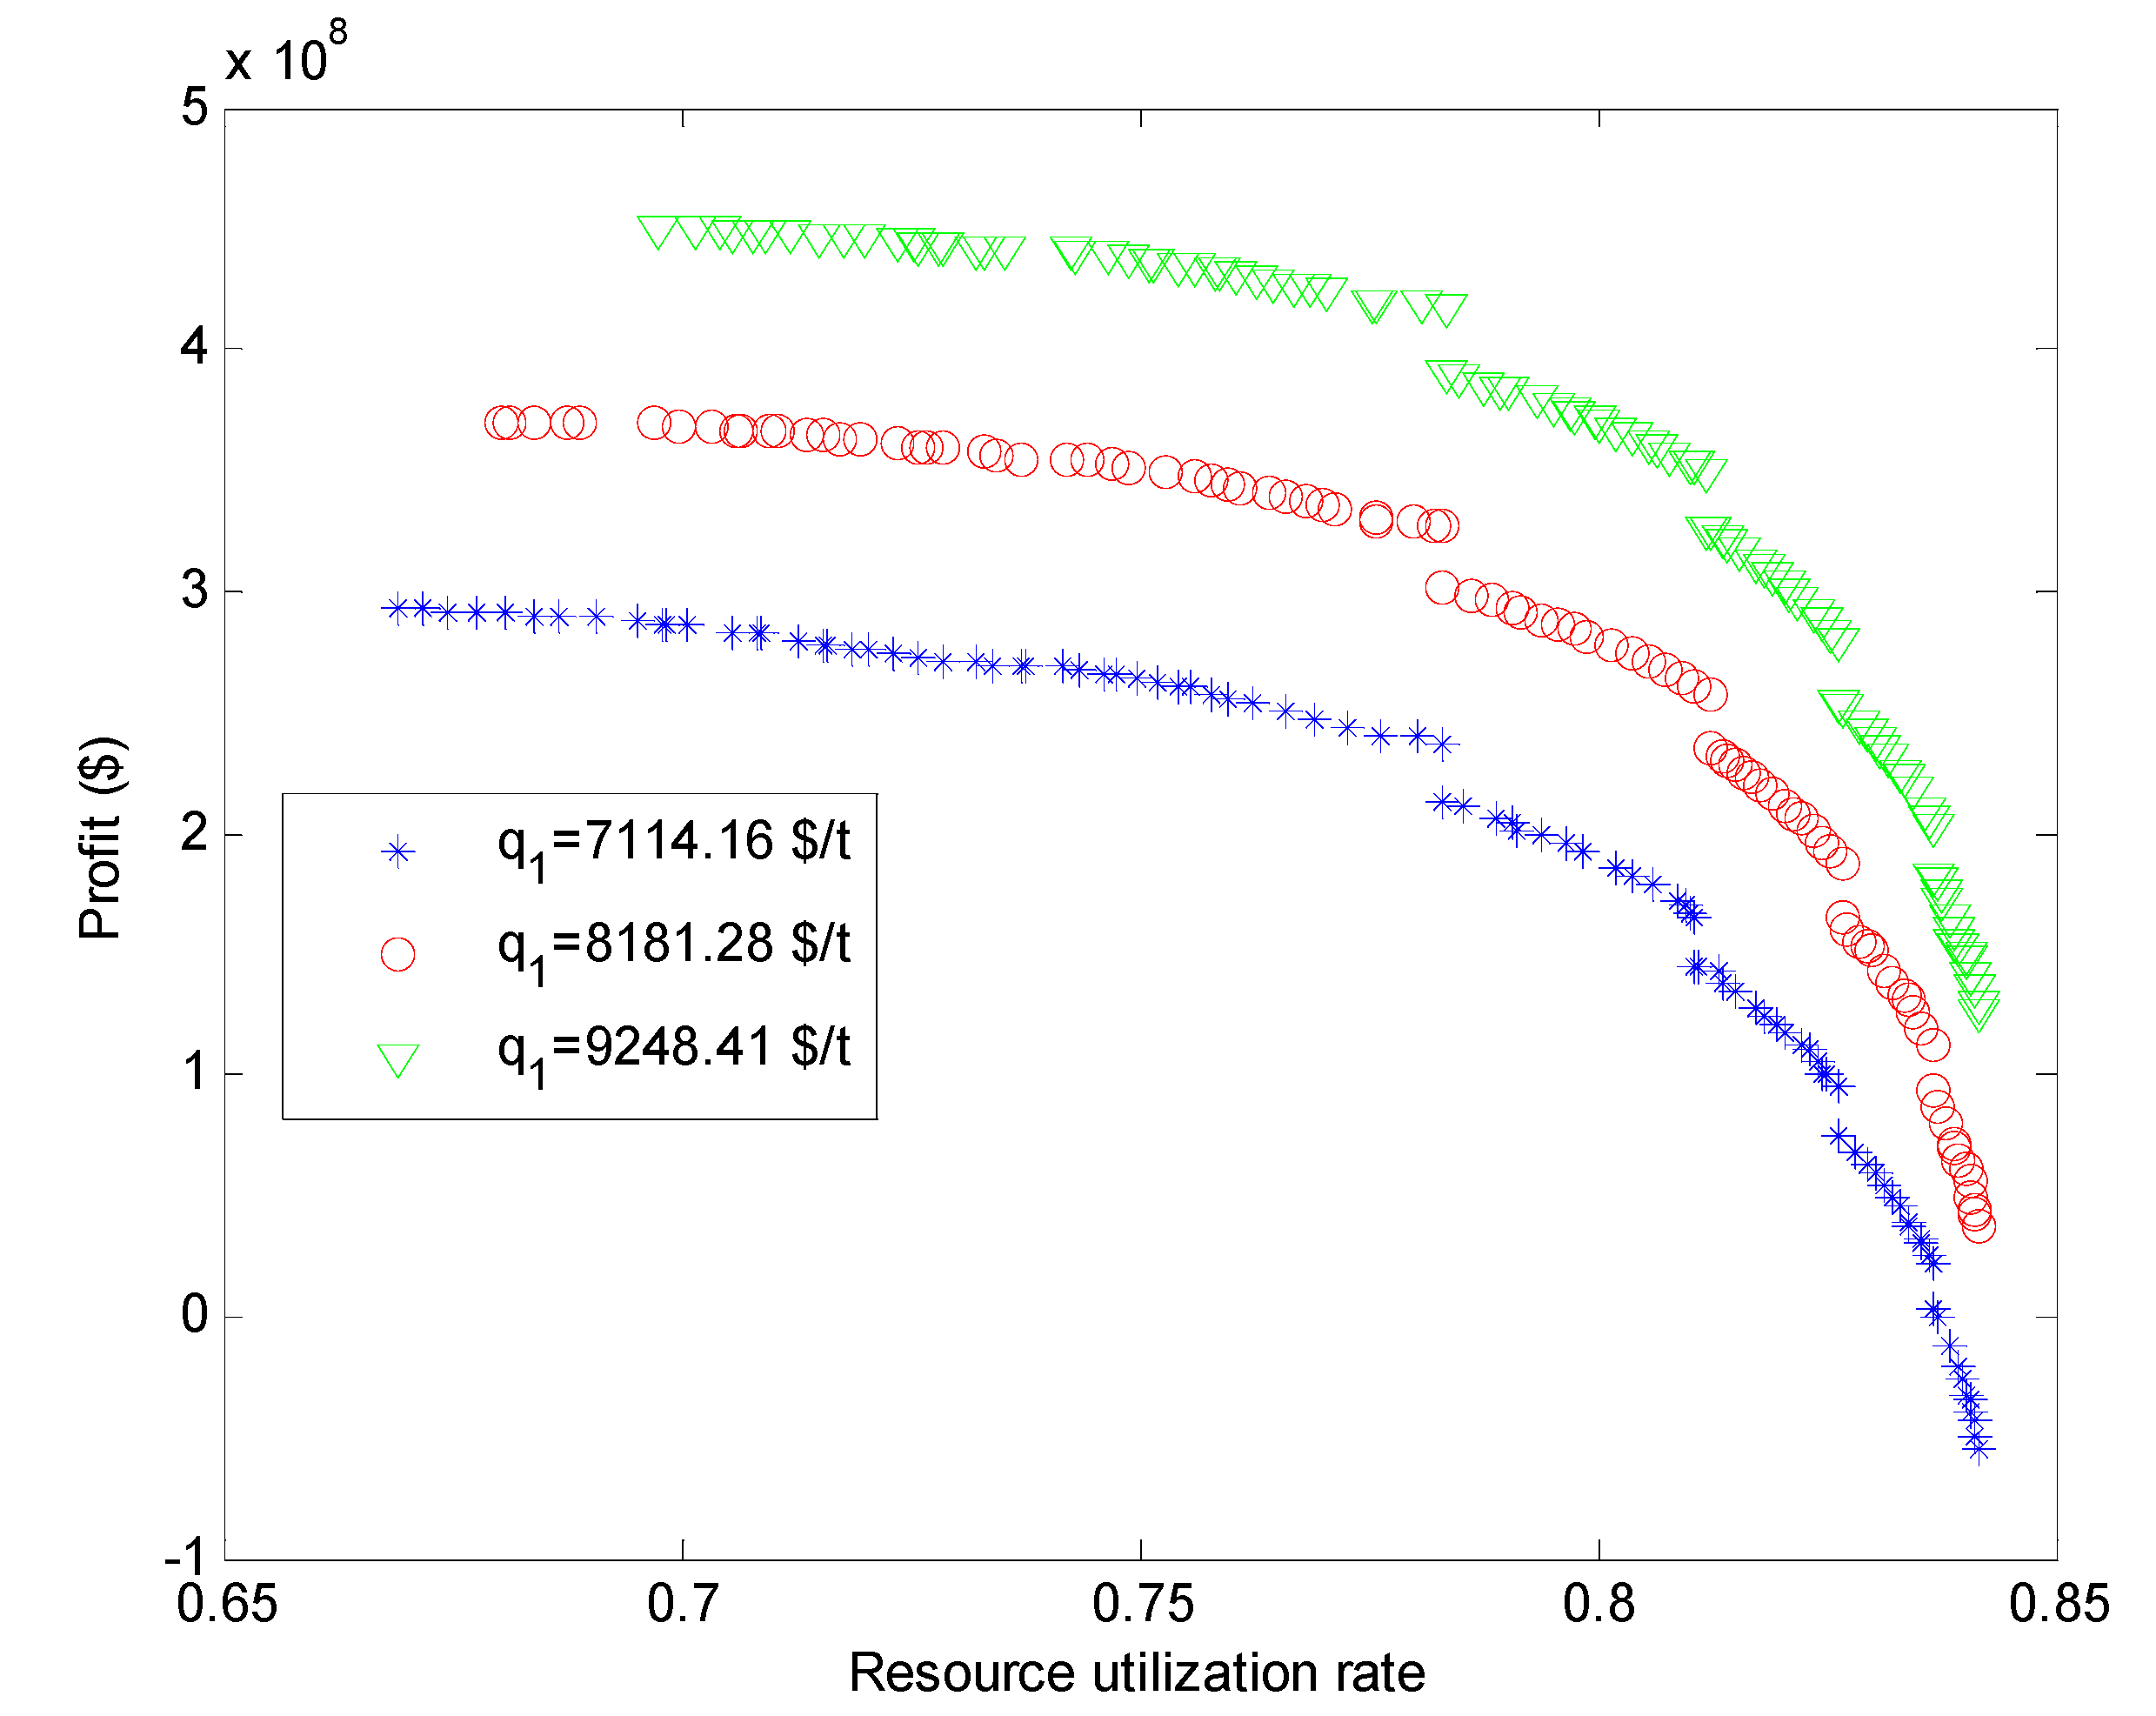
5.3. Sensitivity Analysis of Pareto-Optimal Solutions to Unit Copper Concentrate Price

Due to the large fluctuations in unit copper concentrate prices on the market, the sensitivity analysis of the Pareto-optimal solutions to the unit copper concentrate price was conducted to better understand the optimization problem of this study. Figure 14 shows the sensitivities of the Pareto-optimal solutions to the unit copper concentrate price (which increase by 15% and 30%).
As can be observed from the optimization results, the Pareto-optimal solutions shift upward towards higher profits with increasing unit copper concentrate prices. The upward movement of the Pareto-optimal solutions is caused by the increase in unit copper concentrate prices resulting in higher profits. Moreover, it is noticeable that with increasing unit copper concentrate prices, the maximum resource utilization rate only changes slightly, and the minimum utilization rate becomes larger. Therefore, in regions with higher profits (i.e., lower resource utilization rates), the variations in Pareto-optimal solutions are more sensitive to the unit copper concentrate prices than they are in regions with lower profits.

6. Conclusions

Conclusions can be drawn as follows:
(1)
The established NSGA-II method is an effective method to approach the multi-objective optimization of the production process of the Huogeqi Copper Mines. It outperforms the MOGA and SPEA2 with lower diversity in solution optimization of the whole production process of metal mines. The Pareto-optimal solutions produced by the NSGA-II method reflect the compromising relationship between the economic benefits and the resource efficiency. The optimization results suggest that the Huogeqi Copper Mine in its current state can be further optimized to obtain a better economic benefit and resource efficiency for sustainable development.
(2)
The contributions of decision variables on objective functions show that profit is mainly affected by the geological cut-off grade of Cu (with a contribution of 58.84%) and the minimum industrial grade of Cu (with a contribution of 39.45%), but barely affected by the loss ratio of Cu (with a contribution of 1.71%). With regard to the resource utilization rate, the geological cut-off grade of Cu is the most important decision variable (with a contribution of 54.19%).
(3)
The sensitivities of the Pareto-optimal solutions to the unit copper concentrate price show that the Pareto-optimal solutions shift upward towards higher profits with increasing unit copper concentrate prices. The variations of the Pareto-optimal solutions are more sensitive to the unit copper concentrate price at higher profits than those at lower profits.
The present work provides a multi-object decision procedure and method for the decision makers of the metal mines to take into account both economic profit and resource efficiency in optimization of the whole production process of metal mines. Nevertheless, the environmental impact is another important aspect for metal mines. Due to the complexity in measuring the environmental impact of groundwater pollution, the gob area and tailings, the environmental impact was not included in this study and will be a potential subject in future work.

Author Contributions

X.W. established the model, collected and analyzed the data, and wrote the first draft of the manuscript; Z.L. helped analyzing the data and revised the manuscript; X.G., Q.W., X.X. and M.Z. reviewed the manuscript. The authors are grateful to the two anonymous reviewers for providing constructive suggestions that helped a lot in improvements of the present paper.

Funding

This research is financially supported by National Natural Science Foundation of China (No. 51674062, 51474049), National Science Foundation for Young Scientists of China (No. 51604061) and Basic Scientific Research Operating Expenses of Central University (N160104009).

Acknowledgments

The authors are grateful to the anonymous reviewers for providing their constructive comments and suggestions that help the substantial improvements of the manuscript.

Conflicts of Interest

The authors declare no conflicts of interest.

References

  1. Lusty, P.A.J.; Gunn, A.G. Challenges to global mineral resource security and options for future supply. Geol. Soc. Lond. Spec. Publ. 2015, 393, 265–276. [Google Scholar] [CrossRef]
  2. Shishvan, M.; Benndorf, J. Operational Decision Support for Material Management in Continuous Mining Systems: From Simulation Concept to Practical Full-Scale Implementations. Minerals 2017, 7, 116. [Google Scholar] [CrossRef]
  3. Ding, J.; Chai, T.; Wang, H. Offline modeling for product quality prediction of mineral processing using modeling error PDF shaping and entropy minimization. IEEE Trans. Neural Netw. 2011, 22, 408–419. [Google Scholar] [CrossRef] [PubMed]
  4. He, Y.; Gao, S.; Liao, N.; Liu, H. A nonlinear goal-programming-based DE and ANN approach to grade optimization in iron mining. Neural Comput. Appl. 2016, 27, 2065–2081. [Google Scholar] [CrossRef]
  5. Ramazan, S. The new Fundamental Tree Algorithm for production scheduling of open pit mines. Eur. J. Oper. Res. 2007, 177, 1153–1166. [Google Scholar] [CrossRef]
  6. Xu, X.C.; Gu, X.W.; Wang, Q.; Gao, X.W.; Liu, J.P.; Wang, Z.K.; Wang, X.H. Production scheduling optimization considering ecological costs for open pit metal mines. J. Clean. Prod. 2018, 180, 210–221. [Google Scholar] [CrossRef]
  7. Yang, C.; Ding, J. Constrained dynamic multi-objective evolutionary optimization for operational indices of beneficiation process. J. Intell. Manuf. 2017. [Google Scholar] [CrossRef]
  8. Yu, G.; Chai, T.; Luo, X. Multiobjective Production Planning Optimization Using Hybrid Evolutionary Algorithms for Mineral Processing. IEEE Trans. Evolut. Comput. 2011, 15, 487–514. [Google Scholar] [CrossRef]
  9. Chai, T.; Ding, J.; Yu, G.; Wang, H. Integrated Optimization for the Automation Systems of Mineral Processing. IEEE Trans. Autom. Sci. Eng. 2014, 11, 965–982. [Google Scholar] [CrossRef]
  10. Yu, G.; Chai, T.; Luo, X. Two-Level Production Plan Decomposition Based on a Hybrid MOEA for Mineral Processing. IEEE Trans. Autom. Sci. Eng. 2013, 10, 1050–1071. [Google Scholar] [CrossRef]
  11. Wang, C.; Ding, J.; Cheng, R.; Liu, C.; Chai, T. Data-Driven Surrogate-Assisted Multi-Objective Optimization of Complex Beneficiation Operational Process. IFAC-PapersOnLine 2017, 50, 14982–14987. [Google Scholar] [CrossRef]
  12. Engell, S. Feedback control for optimal process operation. J. Process Control 2007, 17, 203–219. [Google Scholar] [CrossRef]
  13. Mercangöz, M.; Doyle, F.J., III. Real-time optimization of the pulp mill benchmark problem. Comput. Chem. Eng. 2008, 32, 789–804. [Google Scholar] [CrossRef]
  14. Bartusiak, R.D. NLMPC: A Platform for Optimal Control of Feed- or Product-Flexible Manufacturing. Lecture Notes Control Inf. Sci. 2007, 358, 367–381. [Google Scholar]
  15. Azimi, Y.; Osanloo, M. Determination of open pit mining cut-off grade strategy using combination of nonlinear programming and genetic algorithm. Arch. Min. Sci. 2011, 56, 189–212. [Google Scholar]
  16. Asad, M.W.A. Optimum cut-off grade policy for open pit mining operations through net present value algorithm considering metal price and cost escalation. Eng. Comput. 2007, 24, 723–736. [Google Scholar] [CrossRef]
  17. Zarshenas, Y.; Saeedi, G. Determination of optimum cutoff grade with considering dilution. Arab. J. Geosci. 2017, 10, 165. [Google Scholar] [CrossRef]
  18. Ahmadi, M.R. Cutoff grade optimization based on maximizing net present value using a computer model. J. Sustain. Min. 2018, 17, 68–75. [Google Scholar] [CrossRef]
  19. He, Y.; Zhu, K.; Gao, S.; Liu, T.; Li, Y. Theory and method of genetic-neural optimizing cut-off grade and grade of crude ore. Expert Syst. Appl. 2009, 36, 7617–7623. [Google Scholar] [CrossRef]
  20. Yu, S.; Zhu, K.; He, Y. A Hybrid Intelligent Optimization Method for Multiple Metal Grades Optimization; Springer: Berlin, Germany, 2012; pp. 1391–1402. [Google Scholar]
  21. He, Y.; Liao, N.; Bi, J. Intelligent integrated optimization of mining and ore-dressing grades in metal mines. Soft Comput. 2016, 22, 1–17. [Google Scholar] [CrossRef]
  22. Li, K.; Niu, J.; Yuan, H.; Liu, B. Optimization of the grade index of magnetite ore in Baiyunebo Iron Mine in China. J. Univ. Sci. Technol. Beijing 2007, 29, 334–337. [Google Scholar]
  23. He, Y. Multi-Objective Optimization of Grades Based on Soft Computing; Springer: Berlin/Heidelberg, Germany, 2010; pp. 144–151. [Google Scholar]
  24. Alkayem, N.F.; Parida, B.; Pal, S. Optimization of friction stir welding process using NSGA-II and DEMO. Neural Comput. Appl. 2017. [Google Scholar] [CrossRef]
  25. Alkayem, N.F.; Parida, B.; Pal, S. Optimization of friction stir welding process parameters using soft computing techniques. Soft Comput. 2016. [Google Scholar] [CrossRef]
  26. Liu, Z.; Shao, J.; Xu, W.; Wu, Q. Indirect estimation of unconfined compressive strength of carbonate rocks using extreme learning machine. Acta Geotech. 2015, 10, 651–663. [Google Scholar] [CrossRef]
  27. Liu, Z.B.; Shao, J.F.; Xu, W.Y.; Xu, F. Comprehensive Stability Evaluation of Rock Slope Using the Cloud Model-Based Approach. Rock Mech. Rock Eng. 2014, 47, 2239–2252. [Google Scholar] [CrossRef]
  28. Liu, Z.; Shao, J.; Xu, W.; Zhang, Y.; Chen, H. Prediction of elastic compressibility of rock material with soft computing techniques. Appl. Soft Comput. 2014, 22, 118–125. [Google Scholar] [CrossRef]
  29. Liu, Z.; Shao, J.; Xu, W.; Chen, H.; Zhang, Y. An extreme learning machine approach for slope stability evaluation and prediction. Nat. Hazards 2014, 73, 787–804. [Google Scholar] [CrossRef]
  30. Liu, Z.; Shao, J.; Xu, W.; Chen, H.; Shi, C. Comparison on landslide nonlinear displacement analysis and prediction with computational intelligence approaches. Landslides 2014, 11, 889–896. [Google Scholar] [CrossRef]
  31. Deb, K.; Pratap, A.; Agarwal, S.; Meyarivan, T. A fast and elitist multiobjective genetic algorithm: NSGA-II. IEEE Trans. Evol. Comput. 2002, 6, 182–197. [Google Scholar] [CrossRef] [Green Version]
  32. Coello, C.A.C.; Pulido, G.T.; Lechuga, M.S. Handling multiple objectives with particle swarm optimization. IEEE Trans. Evol. Comput. 2004, 8, 256–279. [Google Scholar] [CrossRef]
  33. Xue, F.; Sanderson, A.C.; Graves, R.J. Pareto-based multi-objective differential evolution. In Proceedings of the 2003 Congress on Evolutionary Computation, Canberra, ACT, Australia, 8–12 December 2003; Volume 862, pp. 862–869. [Google Scholar]
  34. Sharifi, M.; Guilani, P.P.; Shahriari, M. Using NSGA II Algorithm for a Three-Objective Redundancy Allocation Problem with k-out-of-n Sub-Systems. J. Electrochem. Soc. 2015, 144, L23–L26. [Google Scholar]
  35. Aghbashlo, M.; Hosseinpour, S.; Tabatabaei, M.; Younesi, H.; Najafpour, G. On the exergetic optimization of continuous photobiological hydrogen production using hybrid ANFIS-NSGA-II. Energy 2016, 96, 507–520. [Google Scholar] [CrossRef]
  36. Huang, J.; Jin, L.; Zhang, C.; Huang, J.; Jin, L.; Zhang, C. Mathematical Modeling and a Hybrid NSGA-II Algorithm for Process Planning Problem Considering Machining Cost and Carbon Emission. Sustainability 2017, 9, 1769. [Google Scholar] [CrossRef]
  37. Shao, A. Innovation and practice of the“five grades ganged” engineering management mode. Eng. Sci. 2013, 15, 44–48. [Google Scholar]
  38. Wang, Q.; Ren, F. Mining Science; Metallurgical Industry Press: Beijing, China, 2011. [Google Scholar]
  39. Gu, X.-W.; Wang, Q.; Chu, D.-Z.; Zhang, B. Dynamic optimization of cutoff grade in underground metal mining. J. Cent. South Univ. Technol. 2010, 17, 492–497. [Google Scholar] [CrossRef]
  40. Liu, B.S.; Wang, X.Q. Integrated and dynamic optimization method on technological indexes for united enterprises of mining-dressing-smelting. China Min. Mag. 2013, 22, 104–107. [Google Scholar]
  41. Al-Momani, E.S.; Mayyas, A.T.; Alqudah, R. Modeling Blanking Process Using Multiple Regression Analysis and Artificial Neural Networks. J. Mater. Eng. Perform. 2012, 21, 1611–1619. [Google Scholar] [CrossRef]
  42. Srinivas, N.; Deb, K. Muiltiobjective optimization using nondominated sorting in genetic algorithms. Evol. Comput. 1994, 2, 221–248. [Google Scholar] [CrossRef]
  43. Liu, T.; Gao, X.; Wang, L. Multi-objective optimization method using an improved NSGA-II algorithm for oil–gas production process. J. Taiwan Inst. Chem. Eng. 2015, 57, 42–53. [Google Scholar] [CrossRef]
  44. Mandal, D.; Pal, S.K.; Saha, P. Modeling of electrical discharge machining process using back propagation neural network and multi-objective optimization using non-dominating sorting genetic algorithm-II. J. Mater. Process. Technol. 2007, 186, 154–162. [Google Scholar] [CrossRef]
  45. Yang, Y.; Cao, L.; Zhou, Q.; Wang, C.; Wu, Q.; Jiang, P. Multi-objective process parameters optimization of Laser-magnetic hybrid welding combining Kriging and NSGA-II. Robot. Comput.-Integr. Manuf. 2018, 49, 253–262. [Google Scholar] [CrossRef]
  46. Peng, F.; Dai, J.; Zhang, S. Characteristics and occurrence regularity of copper orebody in Huogeqi Copper Mine. Nonferrous Met. 2011, 2, 28–30. [Google Scholar]
  47. Wang, X.; Zhu, T. Application of backfilling method in Huogeqi Copper Mine. Nonferrous Met. 2012, 1, 4. [Google Scholar]
  48. Botev, Z.I.; Grotowski, J.F.; Kroese, D.P. Kernel density estimation via diffusion. Ann. Stat. 2010, 38, 2916–2957. [Google Scholar] [CrossRef] [Green Version]
  49. Murata, T.; Ishibuchi, H. MOGA: Multi-objective genetic algorithms. In Proceedings of the IEEE International Conference on Evolutionary Computation, Perth, WA, Australia, 29 November–1 December 1995; pp. 289–294. [Google Scholar]
  50. Adham, A.M.; Mohd-Ghazali, N.; Ahmad, R. Performance optimization of a microchannel heat sink using the Improved Strength Pareto Evolutionary Algorithm (SPEA2). J. Eng. Thermophys. 2015, 24, 86–100. [Google Scholar] [CrossRef]
  51. Tian, Y.; Cheng, R.; Zhang, X.; Jin, Y. PlatEMO: A MATLAB Platform for Evolutionary Multi-Objective Optimization [Educational Forum]. IEEE Comput. Intell. Mag. 2017, 12, 73–87. [Google Scholar] [CrossRef]
  52. Chaki, S.; Bathe, R.N.; Ghosal, S.; Padmanabham, G. Multi-objective optimisation of pulsed Nd:YAG laser cutting process using integrated ANN–NSGAII model. J. Intell. Manuf. 2015, 29, 175–190. [Google Scholar] [CrossRef]
  53. Chandra, S. Design and Analysis of Experiments. Springer Texts Stat. 2017, 404, 235–259. [Google Scholar]
  54. Leonzio, G. Methanol Synthesis: Optimal Solution for a Better Efficiency of the Process. Processes 2018, 6, 20. [Google Scholar] [CrossRef]
Figure 1. Production process of metal mines.
Processes 06 00228 g001
Figure 2. Flowchart of production process optimization of metal mines using the Non-Dominated Sorting Genetic Algorithm (NSGA-II).
Processes 06 00228 g002
Figure 3. Location and overview of Huogeqi Copper Mine.
Processes 06 00228 g003
Figure 4. Geological map of the Huogeqi Copper Mine.
Processes 06 00228 g004
Figure 5. Geological ore body distribution in the 1450–1570 stage of Huogeqi Copper Mine under the Xian-80 coordinate system.
Processes 06 00228 g005
Figure 6. Scatter plot of ore weight and grade.
Processes 06 00228 g006
Figure 7. Frequency distribution histogram of the copper ore grade.
Processes 06 00228 g007
Figure 8. Probability density of the copper ore grade distribution.
Processes 06 00228 g008
Figure 9. Linear fit of dilution ratio and loss ratio of Cu.
Processes 06 00228 g009
Figure 10. Linear fit of concentration ratio and raw ore grade of Cu.
Processes 06 00228 g010
Figure 11. Concentrate grade of Cu predicted by artificial neural networks.
Processes 06 00228 g011
Figure 12. Pareto-optimal solutions for the mine production process optimization using NSGA-II.
Processes 06 00228 g012
Figure 13. The Pareto-optimal solutions obtained by NSGA-II, Multi-Objective Genetic Algorithms (MOGA), Improved Strength Pareto Evolutionary Algorithm SPEA2.
Processes 06 00228 g013
Figure 14. Sensitivity of the Pareto-optimal solutions to the unit copper concentrate price.
Processes 06 00228 g014
Table 1. Comparison of back-propagation network results obtained with different nodes.
Hidden NodesConcentrate Grade of Cu
Train MARE (%)Test MARE (%)Train AMRE (%)Test AMRE (%)
10.84170.74917.35754.7698
20.30570.29791.47011.0916
30.30490.29631.45431.0597
40.31240.30191.61021.0677
50.32150.30251.81511.4596
Table 2. Compensation prices and price coefficients of different copper concentrate grades.
Grade of Cu (%)Compensation Price ($·t−1)Price Coefficient
≥2347.40.86
22.00~22.9931.60.85
21.00~21.9915.80.84
20.00~20.9900.83
19.00~19.99−15.80.81
18.00~18.99−31.60.795
17.00~17.99−47.40.78
16.00~16.99−63.20.77
Table 3. Parameters of the Huogeqi Copper Mine and NSGA-II model.
Parameter of Huogeqi Copper MineValueNSGA-II ParameterValue
Initial value of the geological cut-off grade of Cu p a (%)0.30Number of decision variables3
Initial value of the minimum industrial grade of Cu p b (%)0.50Number of objective functions2
Recoverable reserve of the 1450–1570 stage of Cu Q 0 (t) corresponding to p a and p b 9 × 10⁶Population size100
Constant m 0.66Maximum number of iterations N max 100
Unit mining cost h 1 ($/t)15.8Crossover index η c (SBX)20
Unit beneficiation cost h 2 ($/t)18.96Mutation index η w (polynomial mutation)20
Unit #1 copper price q 1 ($/t)7114.16Crossover probabilities0.5
Lower bound of geological cut-off grade of Cu p 1 min (%)0.10Mutation probabilities1/3
Upper bound of geological cut-off grade of Cu p 1 max (%)0.90
Lower bound of minimum industrial grade of Cu p 2 min (%)0.10
Upper bound of minimum industrial grade of Cu p 2 max (%)0.90
Lower bound of loss ratio of Cu c 1 min (%)6
Upper bound of loss ratio of Cu c 1 min (%)12
Lower bound of melted grade of Cu p melter (%)16
Table 4. Optimization results of four typical cases of production indicators.
ParametersCase ACase BCase CCurrent Case
Profits ($)2.9317 × 1082.5776 × 108−5.49 × 1072.503 × 108
Resource utilization rate0.66890.75780.84160.7383
Geological cut-off grade of Cu (%)0.5820.3660.1170.3
Minimum industrial grade of Cu (%)0.6470.4100.1350.5
Loss ratio of Cu (%)6.0186.00668
Table 5. Variance analysis for profit and resource utilization rate.
FactorsDegrees of FreedomSum of SquaresMean SquaresFPContribution (%)
Profit
Geological cut-off grade of Cu78.04912 × 10161.14987 × 101676.38058.84
Minimum industrial grade of Cu75.39543 × 10167.70776 × 101551.2039.45
Loss ratio of Cu103.33574 × 10153.33574 × 10142.220.02561.71
Error751.12915 × 10161.50554 × 1014
Total992.55872 × 1017
Resource utilization rate
Geological cut-off grade of Cu71.32481 × 109189,258,746.72543.23054.19
Minimum industrial grade of Cu76.64489 × 10894,926,983.41275.61027.18
Loss ratio of Cu106.50715 × 10865,071,498.6874.42018.63
Error755.58125 × 10674,416.7
Total995.35262 × 109

