Article

Analysis of Gene Expression Signatures for Osteogenic 3D Perfusion-Bioreactor Cell Cultures Based on a Multifactorial DoE Approach

1
Prometheus, Division of Skeletal Tissue Engineering, KU Leuven, Onderwijs en Navorsing 1 (+8), Herestraat 49-PB813, B-3000 Leuven, Belgium
2
Skeletal Biology and Engineering Research Center, KU Leuven, Onderwijs en Navorsing 1 (+8), Herestraat 49-PB813, B-3000 Leuven, Belgium
3
Department of Materials Engineering, KU Leuven, Kasteelpark Arenberg 44-PB 2450, B-3001 Heverlee, Belgium
4
Division Measure, Model & Manage Bioresponses (M3-BIORES), KU Leuven, Kasteelpark Arenberg 30, B-3001 Leuven, Belgium
5
Biomechanics Research Unit, Universite de Liege, Chemin des Chevreuils 1-BAT 52/3, B-4000 Liege, Belgium
*
Author to whom correspondence should be addressed.
Processes 2014, 2(3), 639-657; https://doi.org/10.3390/pr2030639
Submission received: 14 February 2014 / Revised: 9 May 2014 / Accepted: 9 July 2014 / Published: 8 August 2014
(This article belongs to the Special Issue Design of Bioreactor Systems for Tissue Engineering)

Abstract

:
The use of multifactorial design of experiments (DoE) in tissue engineering bioprocess development will contribute to the robust manufacturing of tissue engineered constructs by linking their quality characteristics to bioprocess operating parameters. In this work, perfusion bioreactors were used for the in vitro culture and osteogenic differentiation of human periosteum-derived cells (hPDCs) seeded on three-dimensional titanium (Ti) alloy scaffolds. A CaP-supplemented medium was used to induce differentiation of the cultured hPDCs. A two-level, three-factor fractional factorial design was employed to evaluate a range of bioreactor operating conditions by changing the levels of the following parameters: flow rate (0.5–2 mL/min), cell culture duration (7–21 days) and cell seeding density (1.5 × 10³–3 × 10³ cells/cm2). This approach allowed for evaluating the individual impact of the aforementioned process parameters upon a range of genes that are related to the osteogenic lineage, such as collagen type I, alkaline phosphatase, osterix, osteopontin and osteocalcin. Furthermore, by overlaying gene-specific response surfaces, an integrated operating process space was highlighted within which predetermined values of the six genes of interest (i.e., gene signature) could be minimally met over the course of the bioreactor culture time.

1. Introduction

Bone tissue-engineering (TE) strategies aim at the ex vivo dynamic cultivation of human mesenchymal stem cells, seeded on appropriate three-dimensional (3D) biomaterials (scaffolds), and the use of bioactive factors within a bioreactor setup in order to create TE constructs with regenerative potential upon in vivo implantation [1]. Scaffolds allow cell attachment and proliferation within their pores, while at the same time providing the surface properties and porous structure that are required to permit cell growth in a setup that resembles more the native tissue than 2D culture conditions [2,3]. In order to support improved nutrient and oxygen mass transport to cells residing at the center and not only at the peripheral layers of the scaffold, while at the same time more actively controlling the cellular microenvironment, TE constructs are often cultured in (perfusion) bioreactors [4,5,6]. Furthermore, with the use of bioreactors for TE construct culture, critical culture parameters, such as dissolved oxygen concentration, pH and perfusion velocity, as well as the magnitude of the applied shear stress to the cells can be controlled [7].
However, currently, no quantitative relationships exist that link cell phenotype during bioreactor culture to operating bioprocess parameters [8]. The clinical translation of in vitro produced TE constructs as graft material requires that process parameters are determined and controlled in such a way that they enable cellular constructs to be robustly manufactured [9]. The selected process parameters will ultimately determine the type, quality and quantity of the produced tissue, which is typically assessed as a function of numerous output variables or performance endpoints (e.g., cell content and/or gene expression levels). In a subsequent phase, these process parameters could be used to actively steer the properties of the in vitro-developed TE construct to mimic those of the target tissue, which, in this study, is “bone” [10]. To this end, the design of experiment (DoE) approaches, with a track record in bioprocess optimization, have been introduced for stem cell [11,12,13] and tissue engineering [14,15] research. In these DoE studies, multiple-factor screening of stem cell/TE process parameters and their ranking in terms of significance were obtained. Furthermore, a better understanding was gained of the possible interactions of these process parameters, which, in turn, will help in deciphering the complex relationships that are entailed when stem cell populations interact with their culture environment [16].
A number of studies have shown that during bioreactor culture of osteoprogenitor cells, shear stress resulting from the perfusion of culture medium not only improves the spatial distribution of the cells in the scaffolds, but that it also promotes the mineralization of the secreted extracellular matrix [17,18]. Furthermore, shear stress induces cell differentiation towards the osteogenic lineage indicated by the increased expression of early osteogenic markers, such as, collagen type I (Col1), alkaline phosphatase (ALP), transcription factors like osterix (OSX) and late differentiation markers, such as osteopontin (OPN) and osteocalcin (OCN) [19,20,21]. However, it is expected that gene expression signatures under perfusion conditions might be application specific, as they are dependent on the presence of various bio-instructive factors in the culture medium, like, for example, Ca2+ and Pi ions [22]. In addition, certain culture parameters might be interdependent [16]; the cell seeding density influences the spatial distribution of cells [15], their subsequent 3D growth [23] and also their differentiation [24,25], but it also correlates to the amount of secreted growth factors in the medium and might therefore mediate the expression of osteogenic markers. This makes the interpretation of these gene expression signatures difficult and results in a limited understanding of the osteogenic differentiation process of cell-based constructs in perfusion culture. One of the key objectives in the field of bone TE will be to efficiently guide the osteogenic differentiation process of cultured mesenchymal stem cells towards a predefined gene expression signature that would ensure the clinical applicability of the produced TE constructs [26]. However, to date, there is minimal knowledge regarding the determination of those minimal requirements for in vitro produced TE constructs, in order to ensure a successful in vivo outcome. Hence, the systematic production of TE constructs in well-characterized bioprocesses is a prerequisite for compliance with regulatory guidelines and subsequently successful translation to the market.
In this work, the TE constructs of interest were human periosteum-derived cells (hPDCs) seeded on regular pore Ti6Al4V (Ti) scaffolds and cultured in an osteogenic medium. The aim of this study was to gain insight into the effect of standard culture process parameters, such as seeding density and perfusion flow rate, on the in vitro osteogenic cell differentiation as a function of culture time. Gene expression analysis of the hPDCs in TE constructs after osteogenic 3D perfusion culture was performed using a multifactorial DoE approach. This approach allowed the evaluation of multiple process parameters simultaneously in a cost and time efficient way, as opposed to the one-factor-a-time approach [27]. Based on the obtained data, a proof-of-concept was given that, for a dedicated TE construct process set-up, an integrated “window of operation” could be determined that resulted in a cell population with a given gene signature along the osteogenic differentiation pathway.

2. Experimental Section

2.1. Ti6Al4V Scaffolds

Porous Ti6Al4V scaffolds (Ø = 6 mm; h = 6 mm) with a highly regular design were produced by selective laser melting [28]. Based on micro-CT image analysis, the following scaffold characteristics were determined: 73% ± 1% porosity, 6.5 ± 0.2 cm2 surface area, 245 ± 2 µm strut diameter and 755 ± 3 µm pore size. Scaffolds were cleaned in an ultrasonic bath consecutively in pure acetone, 70% ethanol and distilled water for 30 min in total. Subsequently, scaffolds were oxidized for 12 h in a 5 M sodium hydroxide solution at 60 °C, rinsed with distilled water and autoclaved. One day before cell seeding, scaffolds were pre-wetted with culture medium by vacuum impregnation, incubated for 2 h in an incubator at 95% humidity and dried overnight in a non-humidified incubator.

2.2. hPDC Culture

hPDCs were isolated from periost biopsies of different donors and pooled as described by Eyckmans et al. [29]. The ethics committee for Human Medical Research (KU Leuven) approved the procedure, and biopsies were taken from the patient after informed consent. The cells were cultured in a monolayer in growth medium consisting of high glucose Dulbecco’s modified Eagle’s medium (Invitrogen) supplemented with 10% fetal bovine serum (FBS; Lonza BioWhittaker, Basel, Switzerland), 1% sodium pyruvate and 1% antibiotic–antimycotic (100 units/mL penicillin, 100 mg/mL streptomycin and 0.25 mg/mL amphotericin B; Invitrogen). At 80%–90% confluence, the cells were trypsinized with Tryple Express (Invitrogen) and replated for up to 5 passages. At passage 6, the cells were trypsinized and seeded in the pre-wetted Ti scaffolds using static drop-seeding at a density of 105 or 2 × 10⁵ cells per scaffold. The scaffolds were cultured simultaneously in an in-house-developed perfusion bioreactor, in which culture medium was pumped by a peristaltic pump (PC-24; Ismatec SA, Vancouver, BC, Canada) from a disposable medium reservoir (50-mL Falcon tubes; Franklin Lakes, NJ, USA) containing 10 mL of culture medium, through a scaffold that was fixed in the bioreactor chamber. TE constructs were cultured for up to 21 days in a bio-instructive medium, consisting of growth medium supplemented with 6 mM Ca2+, 4 mM phosphate ions (Pi) and 0.05 ng/mL ascorbic acid [22].

2.3. qPCR

After 7, 14 and 21 days of culture in differentiation medium, the total RNA of each sample was isolated using an RNeasy mini kit (Qiagen, Venlo, The Netherlands) and quantified using a Nanodrop ND-1000 spectrophotometer (Thermo Scientific, Waltham, MA, USA). Complementary DNA was synthesized using the RevertAid H Minus First Strand complementary DNA synthesis kit (Fermentas, Burlington, ON, Canada). SYBR green quantitative polymerase chain reaction was performed for ALP, Sox9, Col1, OCN, OPN, OSX (OSX-F 5'-AGTGACCTTTCAGCCTCCAA-3', OSX-R 3'-GGGAAAAGGGAGGGTAATCA-5'; ALP-F 5'-GGACATGCAGTACGAGCTGA-3', ALP-R 3'-GTCAATTCTGCCTCCTTCCA-5'; Col1-F 5'-GACGAAGACATCCCACCAAT-3', Col1-R 3'-AGATCACGTCATCGCACAAC-5'; OCN-F 5'-GTGCAGCCTTTGTGTCCAA-3', OCN-R 3'-GCTCACACACCTCCCTCCT-5'; OPN-F 5'-ACTGATTTTCCCACGGACCT-3', OPN-R, 5'-TCAGGGTACTGGATGTCAGG-3'; OCN-F 5'-GTGCAGCCTTTGTGTCCAA-3') and compared to HPRT (HPRT-F, 5'-TGAGGATTTGGAAAGGGTGT-3', HPRT-R, 5'-GAGCACACAGAGGGCTACAA-3'). The PCR reaction was cycled in a Rotor-Gene sequence detector (Qiagen) as follows: 95 °C for 3 min, 40 cycles of 95 °C for 3 s and 60 °C for 60 s.

2.4. Multi-Factorial Analysis

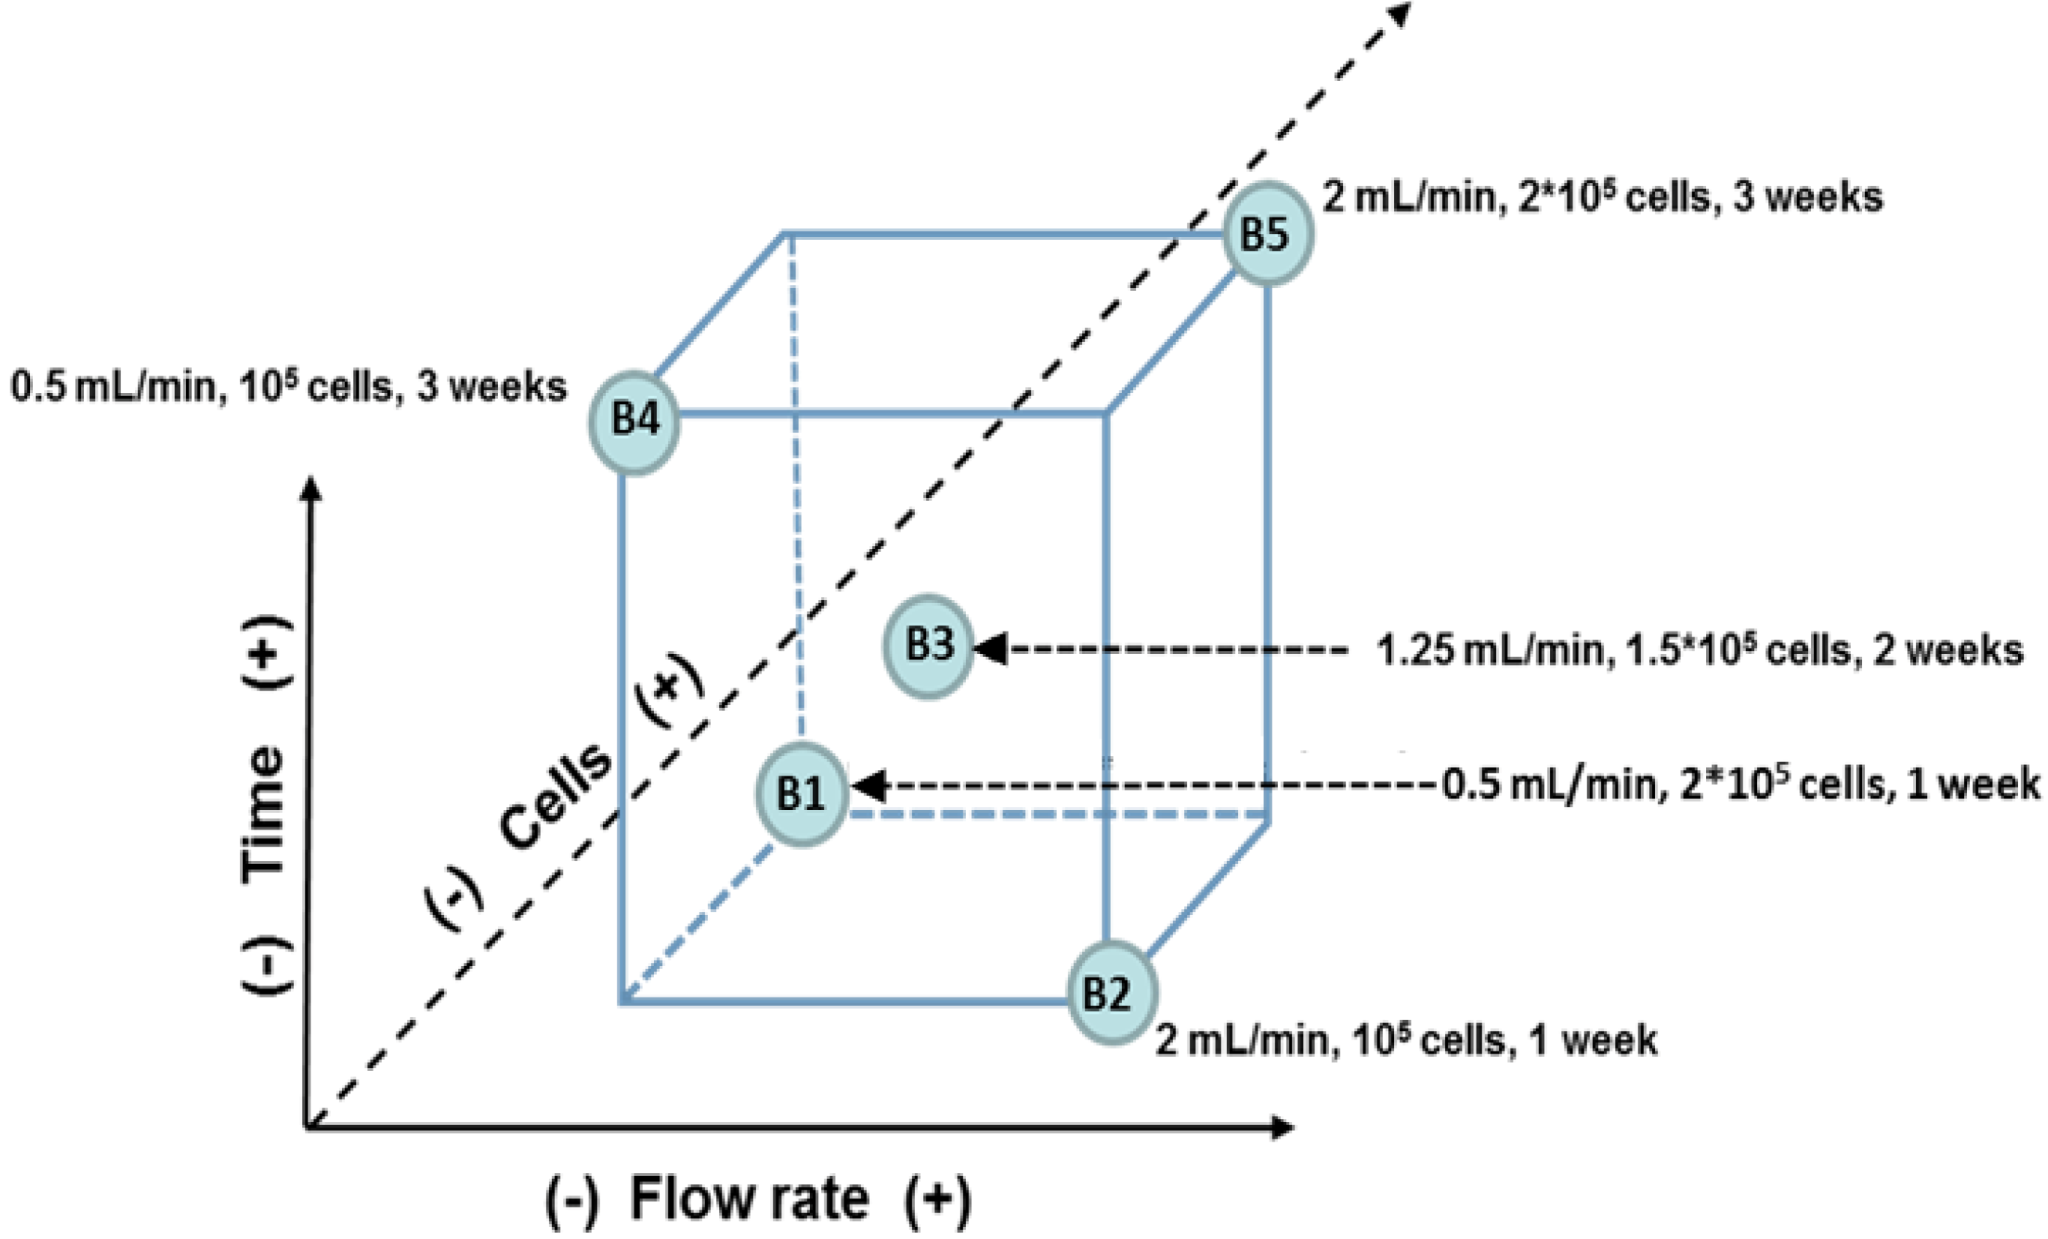
A fractional factorial design with three factors (flow rate, culture time and cell-seeding density) and two levels was used. The factor levels were derived from the literature and previous experimental findings (Figure 1). The 0.5 mL/min to 2 mL/min flow rate range is deemed to be within the beneficial flow rate range for osteogenic differentiation [20]. hPDCs at 7 days of culture are considered to be in an early differentiation stage, while they will be expected to be fully differentiated after 21 days [30].
The low cell-seeding density of 105 cells per scaffold is the minimal amount of cells that [31] supports growth in the bioreactor. The high cell-seeding density of 2 × 10⁵ cells per scaffold was chosen, since this is the maximum cell amount for this specific scaffold type that results in a similar cell-seeding efficiency compared to the low seeding level [15]. The gene expression response on these different factor levels was determined as an average value of triplicate measurements on constructs produced in three parallel bioreactor runs per condition. As a fractional factorial design (Resolution III, main factor effect aliased with second order interactions) is used in this study, linear behavior between process parameters and gene expression response is assumed for the process space under investigation. Gene expression results were analyzed by ANOVA, and the data was fitted to a general linear model with a statistical software package (JMP Software, version 9; SAS Institute: Cary, NC, USA). The statistical significance level was set at p < 0.05. Statistical models were accepted when there was no lack of fit and no correlation in the residual plots, and the residuals were normally distributed. General linear-model parameter estimation was performed by least-squares estimation. The main effects are included in the statistical model following,
Y = b o + i = 1 n b i   X i   + e
where: Y is the predicted response; b is the parameter estimate; X is the coded value of the factor levels; and e is the residual error.
Figure 1. The three-factor, two-level fractional factorial design showing the process space investigated and the experimental conditions chosen for this work.
Processes 02 00639 g001

2.5. DNA Content Analysis

The DNA content of hPDCs on scaffolds was determined using a quantitative fluorometric DNA assay (Quant-iT™ dsDNA HS kit, Invitrogen, Carlsbad, CA, USA). Scaffold samples were rinsed with phosphate-buffered saline (PBS) and lysed in 350 µL RLT lysis buffer (Qiagen, Venlo, The Netherlands) supplemented with 3.5 µL β-mercaptoethanol (Sigma, St. Louis, MO, USA). Prior to analysis, the samples underwent a freeze-thaw cycle at −80 °C. After thawing, samples were vortexed vigorously for 1 min and spun down for 1 min at 13,000 rpm. For each sample, 10 µL of supernatant was diluted in 90 µL of Milli-Q water, after which, the DNA content was quantified with a Qubit® Fluorometer (Invitrogen), as described by Chen et al., 2012 [32].

2.6. Live/Dead Assay

A Live/Dead viability/cytotoxicity kit (Invitrogen, Carlsbad, CA, USA) was used according to the manufacturer’s instructions to qualitatively evaluate cell viability and distribution on the scaffolds. Prior to capturing images by fluorescence microscopy (Zeiss Fluorescence Stereo-Microscope, Oberkochen, Germany), the samples were rinsed with PBS and incubated at 37 °C in the fluorescent dye solution (0.5 µL calcein and 2 µL ethidium homodimer in 1 mL PBS) for 20 min.

2.7. Scanning Electron Microscopy Analysis

Cell morphology on scaffolds was assessed by scanning electron microscopy (SEM) imaging coupled with an energy dispersive X-ray (EDAX) analysis (FEI XL30 FEG, Hilsboro, OR, USA) at 10 kV. The following sample preparation was used: rinsing with PSB, fixing with 2.5% glutaraldehyde (in PBS) for 1 h and postfixing in 1% osmium tetroxide for 2 h before dehydration in 50%, 75%, 95% and 100% ethanol solutions. Finally, the samples were chemically dried with hexamethyldisilazane for 3 min and gold-sputtered before SEM analysis.

2.8. Picrosirius Red Collagen Assay

3D collagen matrix production on porous scaffolds was characterized by Picrosirius Red staining (1 mg/mL Sirius Red in saturated picric acid, n = 3). The stained samples were thoroughly washed with distilled water to remove unbound dye and dried at 37 °C before qualitative analysis by stereomicroscopy.

2.9. Alizarin Red Mineralization Assay

For each bioreactor condition, mineralization of the cell cultures was assessed by Alizarin Red staining (pH 4.2) after 7, 14 and 21 days of culture. Briefly, cell cultures were rinsed with PBS, followed by fixation in 4% formalin (in PBS) for 10 min and washed with distilled water before staining with the Alizarin Red solution for 1 min. Nonspecific staining was removed by thoroughly washing in distilled water over 24 h.

3. Results and Discussion

3.1. Cell Proliferation
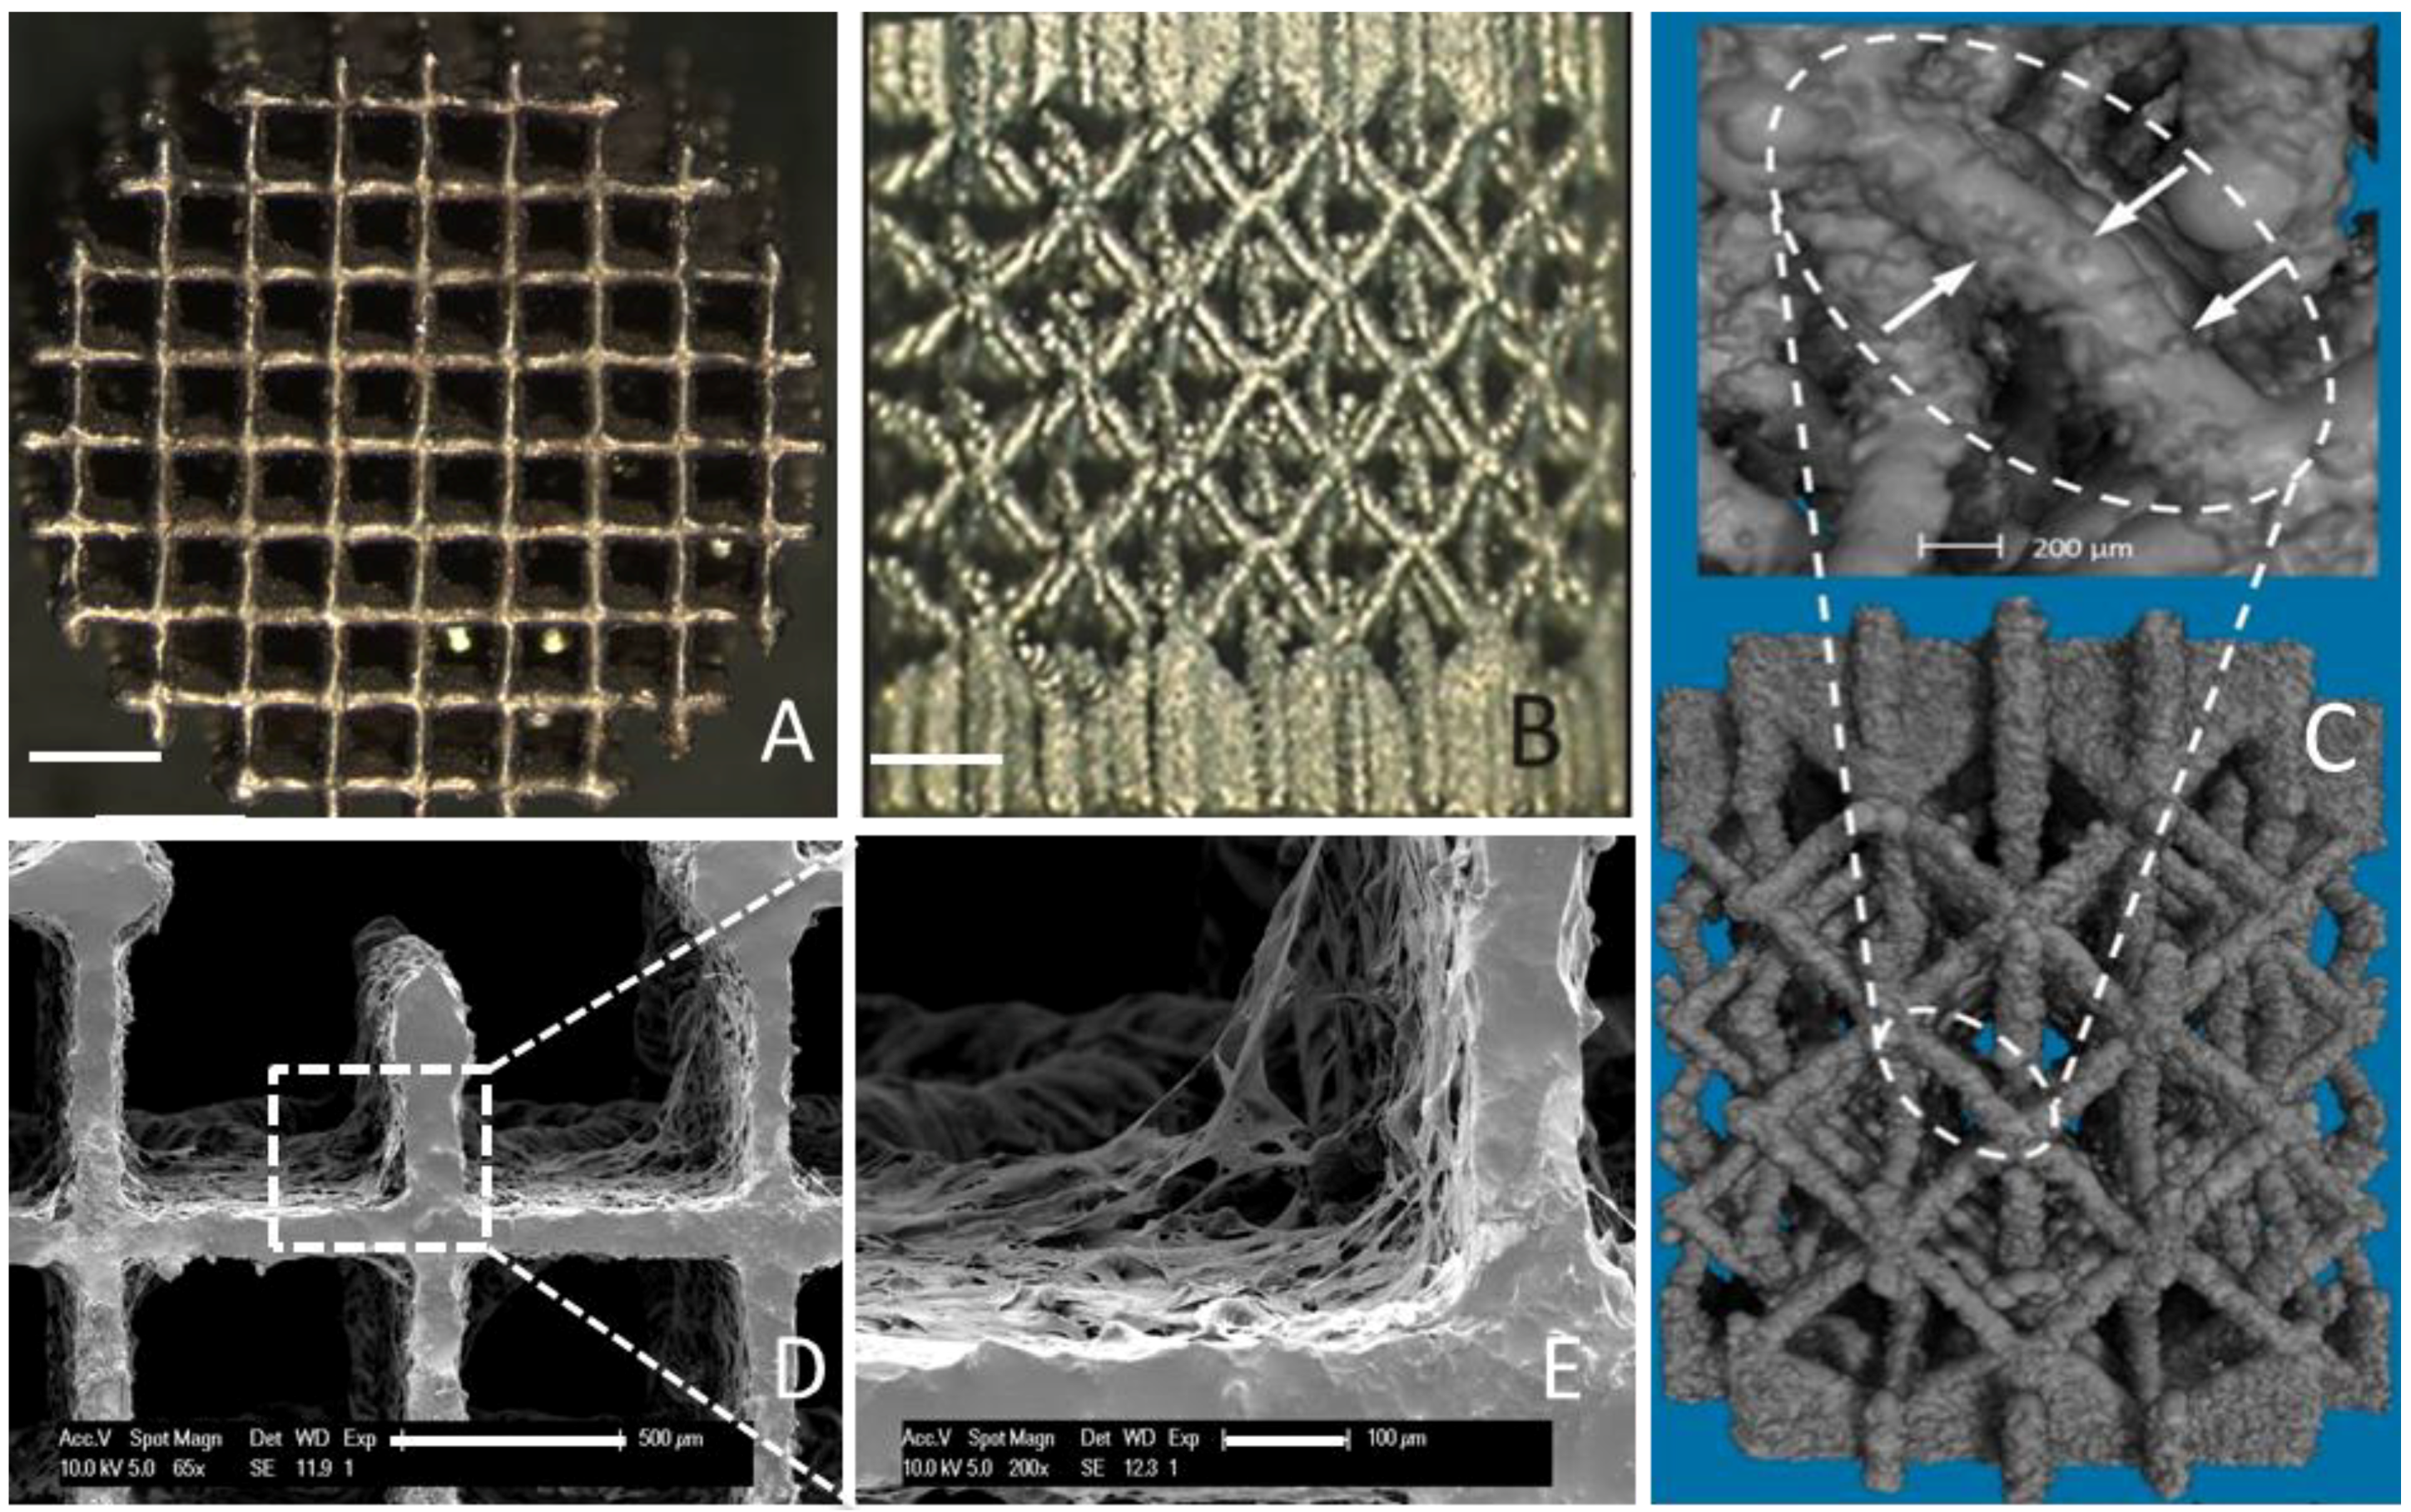
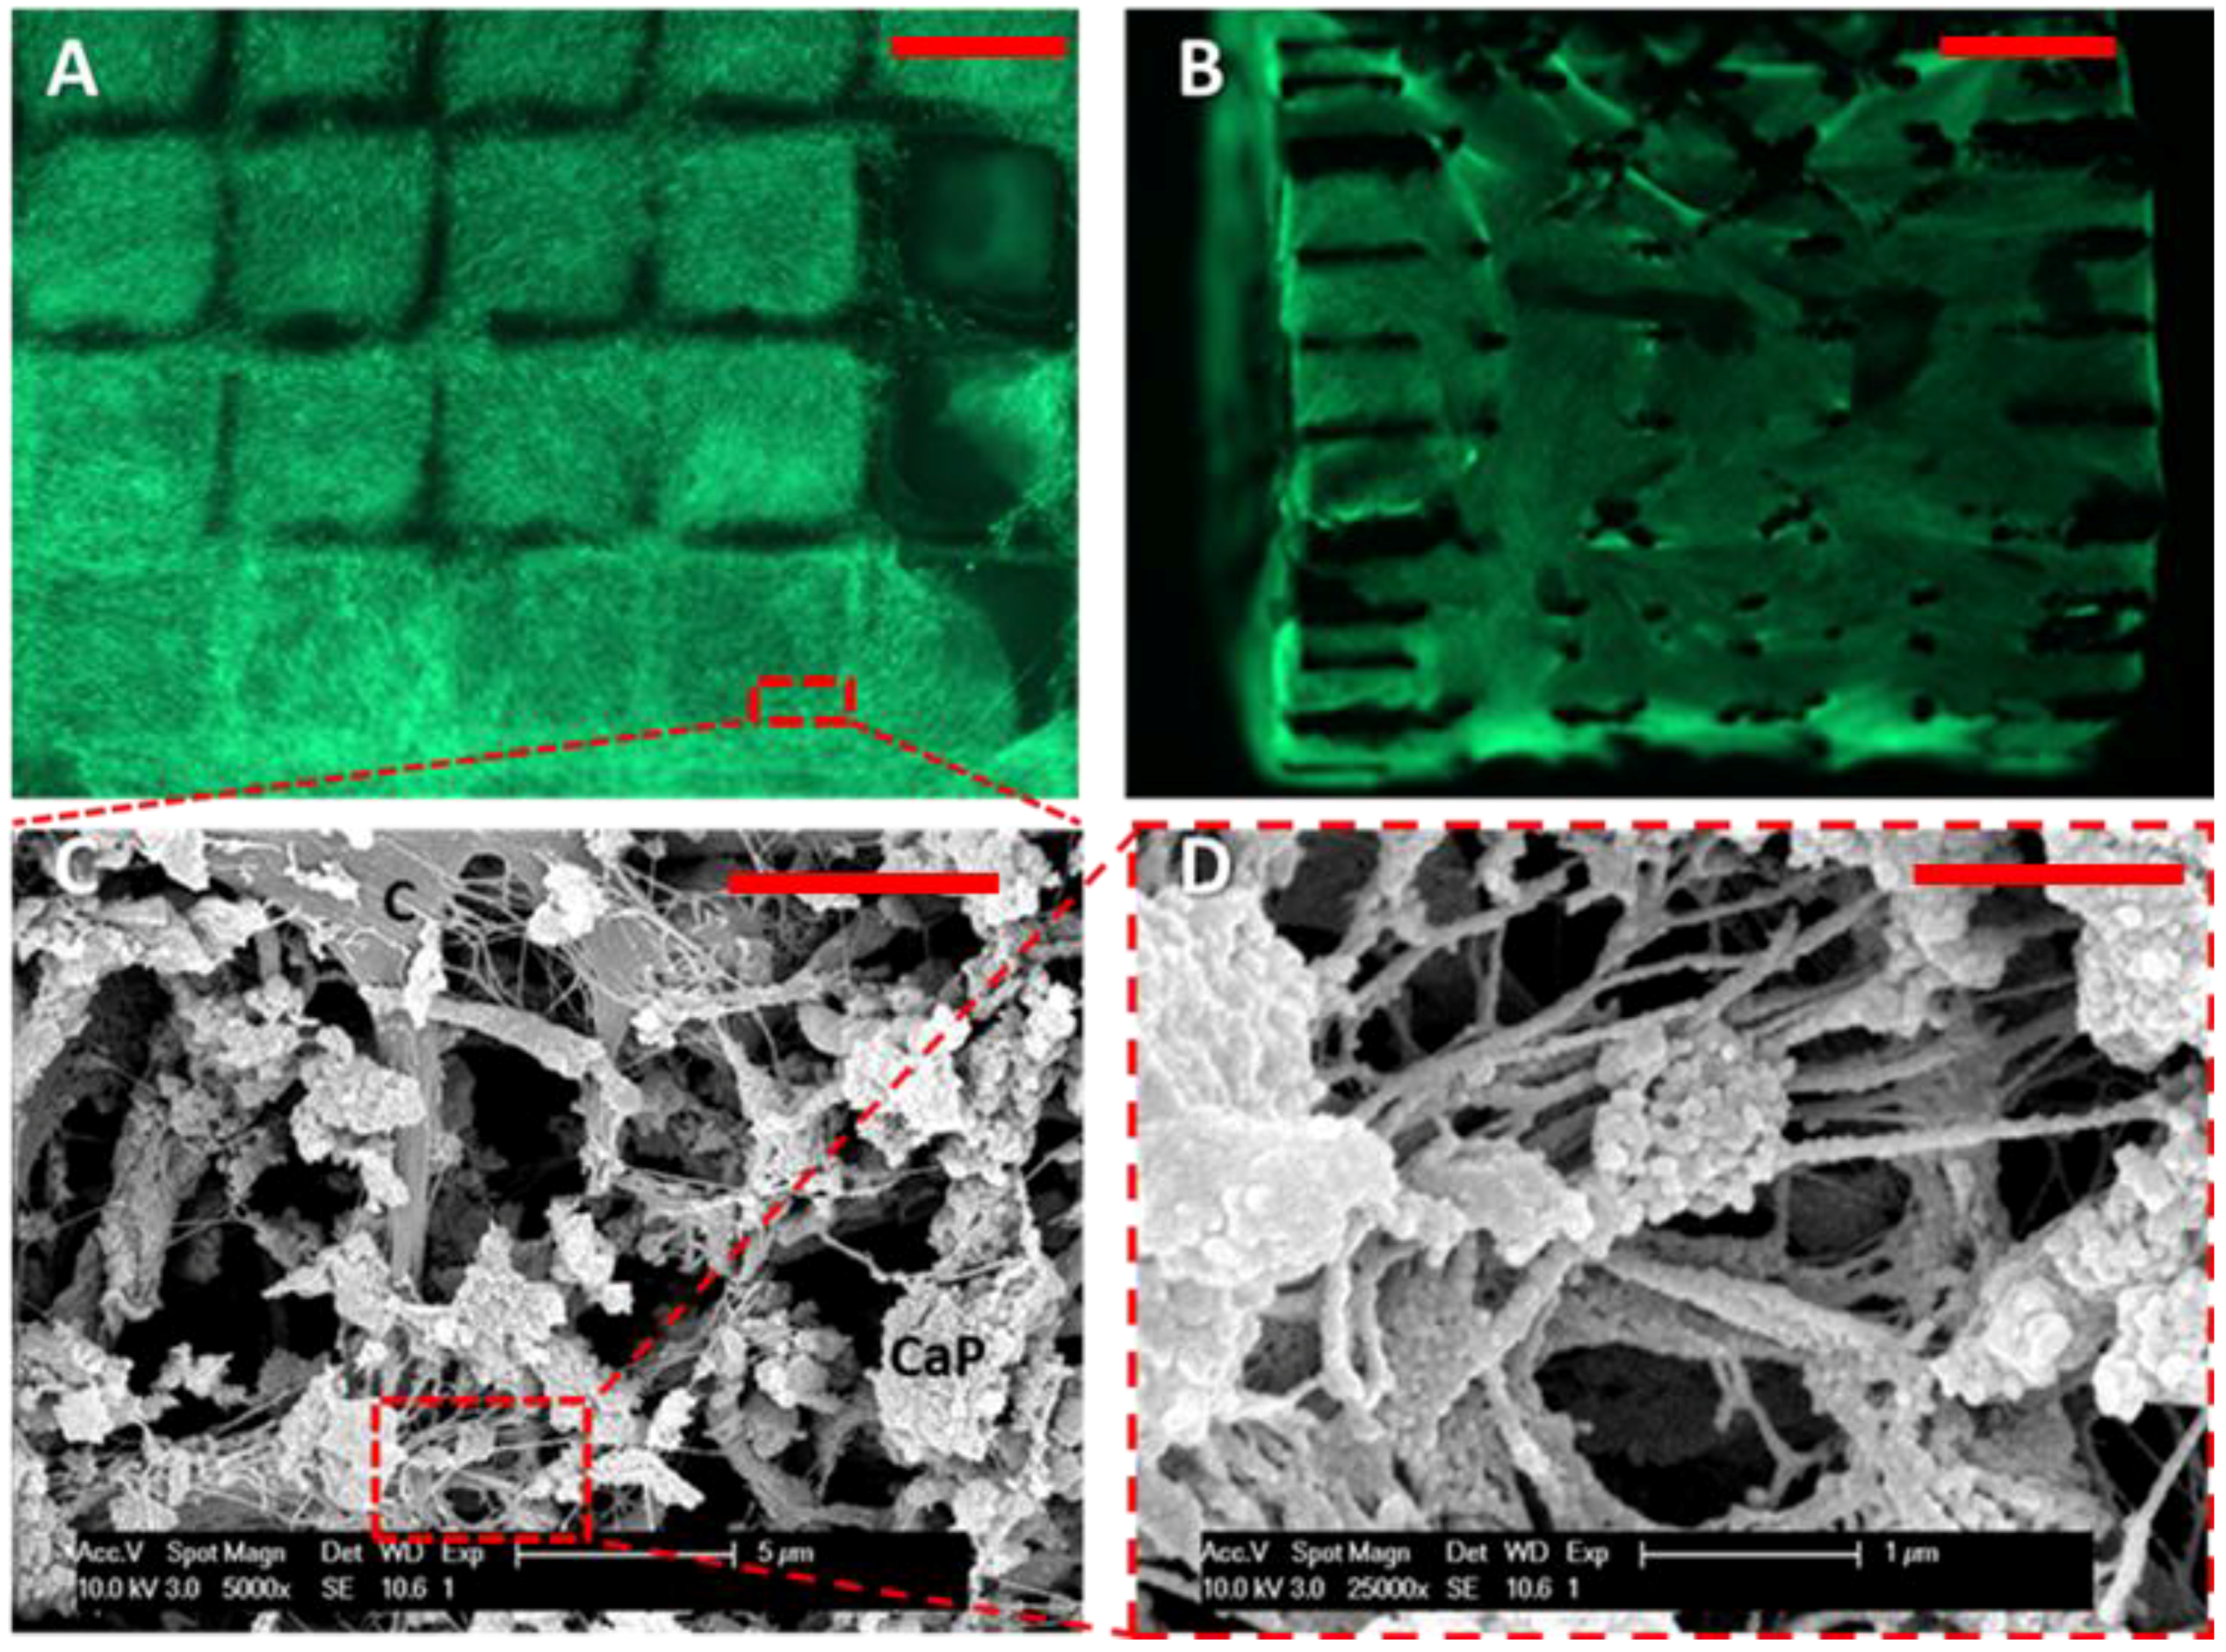
Figure 2 shows Ti6Al4V scaffolds used for cell seeding and subsequent cell culture. Cells started bridging strut junctions early on (Day 2) in the cell culture, thus initiating a 3D cell growth. Figure 3A,B shows live cells on a representative TE construct obtained after 21 days of perfusion bioreactor culture (B4 experimental condition; see Figure 3), indicating a homogeneous distribution of living cells and ECM throughout the whole scaffold. Cells seem to have filled the scaffold voids and branched out, creating a cell-ECM network in three dimensions. SEM images (Figure 2C,D) show the presence of cells in addition to CaP grains and ECM fibers in the TE construct. In static setups, 3D cell growth has been studied recently for hPDC cultures [33] and hBMSCs [34], and a two stage in vitro cell growth was described for MC3T3-E1 pre-osteoblast cells [35]. In both cases, the pore geometry was seen to play an important role on cell growth kinetics. This highlights the possibility to create 3D in vitro tissue-like structures where cells may grow independently of the initial scaffold geometry and where the interaction between the cells and their own ECM and culture environment may be studied independently.
Figure 2. Ti6Al4V scaffolds used for cell seeding and subsequent cell culture: (A) scaffold top view (B) scaffold side view (scale bar (A) and (B): 1 mm); (C) micro-CT 3D visualization of scaffold and strut close-up from [36]; and (D,E) SEM images (scale bar: (D) 500 µm; (E) 100 µm).
Processes 02 00639 g002
Figure 3. In vitro-engineered three-dimensional (3D) osteogenic tissue-engineering (TE) constructs using porous Ti6Al4V scaffolds in a perfusion bioreactor culture (Experimental Condition B4). (A) Close-up live/dead image (pore size: 800 µm); (B) live/dead image showing the distribution of cells throughout the construct (scale bar: 1 mm); (C) SEM micrograph, showing cell and extracellular matrix micromorphology at the void for a representative bioreactor condition (B4) (a magnification of 5000× was used; scale bar: 5 µm); (D) SEM micrograph showing mineralization of extracellular fibers. (SEM, scanning electron microscopy; C, cell; CaP, mineral grains; extracellular matrix fibers are also visible; scale bar: 5 µm, 14,000× (scale bar: 1 µm) magnification, respectively).
Processes 02 00639 g003
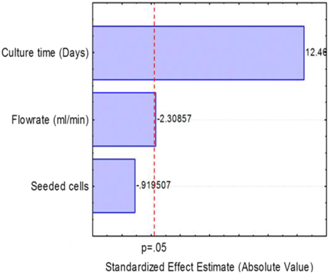
Post-culture DNA content for the selected experimental conditions (as measured via DNA content analysis) is shown in Table 1. The Pareto chart of standardized effects shows that culture time and flow rate both significantly influenced hPDC proliferation (DNA content) during bioreactor culture, whereas the initial seeding density was not seen to have a significant effect on the final DNA content. For increasing culture times, a significant cell proliferation was observed, as expected for cell culture systems. Increasing flow rates, however, resulted in a slight decrease in final DNA content. In the setup used for this work, the number of cells seeded on the scaffold did not have a significant effect on the final cell number in the TE construct, as also observed elsewhere for hMSCs [37]. Similar observations showing a weak negative effect of flow rate on the DNA content have been recently reported for a 15-fold increase in flow rate [38], while significant negative effects have also been observed for increasing flow rates in other bioreactor systems [17]. McCoy et al. [39] have recently investigated the detachment of cells from scaffolds during perfusion culture, which was attributed to shear stress levels and to a bridged cell-scaffold attachment morphology. This phenomenon could also explain the negative effect of high flow rates observed in this work.
Table 1. (A) DNA content after perfusion bioreactor culture for all experimental conditions; (B) Pareto chart showing levels of significance of process parameters (inputs) on final DNA content (output) of in vitro cultured TE constructs.
(A)
NameExperimental conditionsDNA content (ng/mL) (average, n = 3)
B10.5 mL/min, 2 × 10⁵ cells, 7 days10,000
B22 mL/min, 105 cells, 7 days7,600
B31.25 mL/min, 1.5 × 10⁵ cells, 14 days14,000
B40.5 mL/min, 105 cells, 21 days34,000
B52 mL/min, 2 × 10⁵ cells, 21 days28,200
(B)
Processes 02 00639 i001

3.2. Osteogenic Cell Differentiation: An Overview
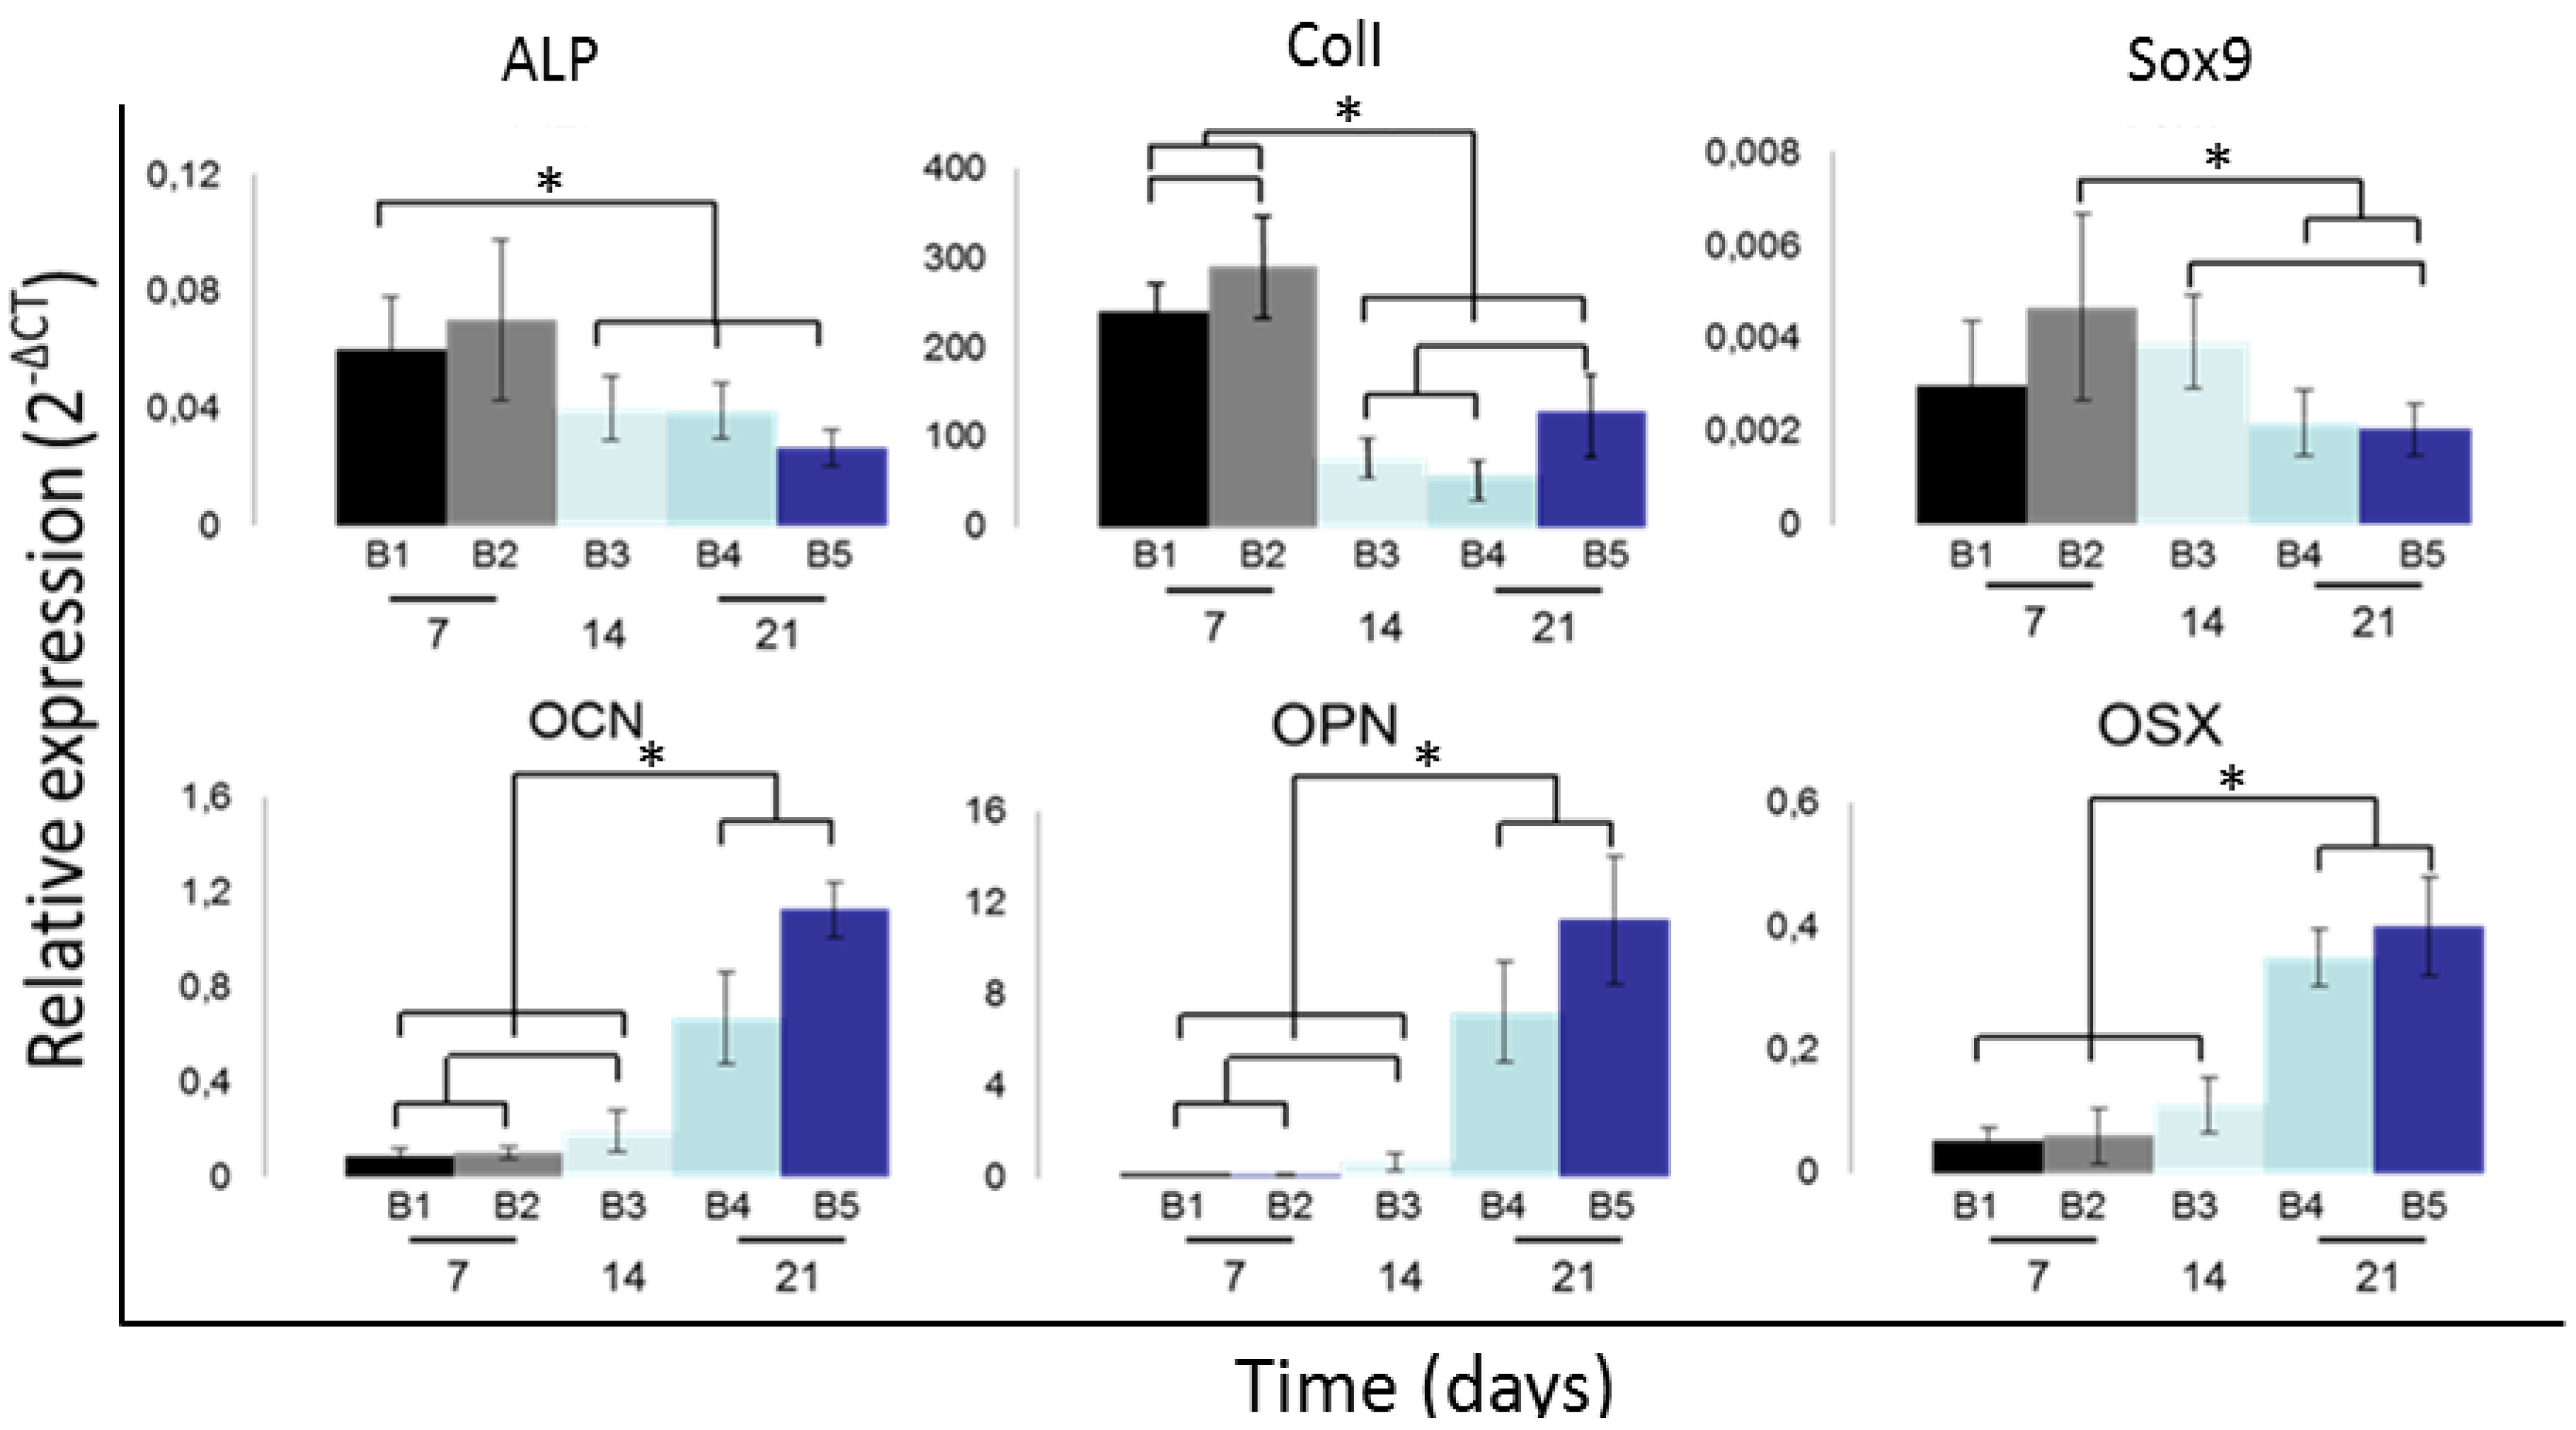
Genes, such as Col1, ALP, OSX, OCN and OPN, have been used as markers for evaluating the specification of stem cell and osteochondro-progenitor cell types towards the osteogenic lineage [40,41]. As shown in Figure 4, the use of different culture process conditions (based on the multifactorial DoE approach) resulted in significant changes in gene expression of the aforementioned genes. Overall, it may be stated that early osteogenic markers of osteoprogenitor cells, like ALP and Col1, show a significant time-dependent decrease in expression from Day 7 to Day 21, as expected [40]. From Day 14 onwards, no changes were observed anymore between the different conditions for ALP. The downregulation of Col1 observed for later time points could be explained by the fact that cells become confluent within their 3D growth configuration, hence modulating the gene expression level due to less need for matrix synthesis in such a configuration. For the late osteogenic markers, such as OCN, OPN and the transcription factor, OSX, a clear time-dependent increase in gene expression was observed, as reported elsewhere for Ca2+ and Pi containing media for 2D cultures of hBMSCs [42] and during static 3D culture of hPDCs [22,30]. Osteogenic differentiation was also evidenced by collagen type I secretion and mineralization (Figure 5). However, due to the DoE approach used in this work, all process parameters were systematically changed simultaneously (as shown in Figure 1), making direct comparison of the experimental conditions meaningless; thus, an integrated analysis is further required, as described in the subsequent section.
Figure 4. Gene expression data for hPDCs cultured in CaP-supplemented medium for all experimental conditions. Data shown are the relative expression of the gene of interest normalized to the HPRT1 housekeeping gene. This data set corresponds to the experimental design employed in this study, as shown in Table 1. Mean ± S.D. error of the mean (n = 3). Unpaired t-test (two-tailed): * p < 0.05. ALP, alkaline phosphatase; Col1, collagen type I; OCN, osteocalcin; OPN, osteopontin; OSX, osterix.
Processes 02 00639 g004
Figure 5. Representative images for the midpoint experimental time point (B3) showing collagen matrix content by positive Picrosirius Red staining (A,B) and mineral content by positive Alizarin Red staining (C,D), but also as evidenced by bright field images (E,F). Scale bar: 1 mm.
Processes 02 00639 g005

3.3. DoE Gene Expression Analysis: Flow Rate and Seeding Density Effect

In order to further interpret the influence of the selected process parameters on the gene expression levels, response surface models were created based on least-squares linear fits. The goodness-of-fit of the statistical models with the experimental data is shown in Figure 6. The strong upregulation of OSX, OPN and OCN was captured accurately, resulting in R2 values above 0.8. The same was seen in the case of the downregulation of Col1 (R2 = 0.79). However for the culture times evaluated in this study, both ALP and Sox9 were not clearly affected by the process conditions, resulting in R2 values that were substantially lower (0.53 and 0.58, respectively). This demonstrates the limitation of a fractional factorial design (and least-squares linear fitting) in accurately capturing gene expression patterns that might fluctuate over the culture period of interest. However, in those cases where the u-regulation of genes was strong, the obtained fits were satisfactory.
Figure 6. Goodness-of-fit between predicted values obtained via partial least-squares fitting and experimentally measured gene expression values, for the selected genes studied in this study. R2 values are also given for all plots.
Processes 02 00639 g006
Figure 6 shows the positive effect of an increased seeding density and flow rate, which both resulted in a significant increase in the expression of the osteogenic markers, OSX (p = 0.02), OCN (p = 0.03) and OPN (p = 0.0008). Increased seeding densities may result in confluency at earlier time points, inducing osteogenic differentiation at earlier time points and, thus, enhancing the upregulation of these genes from early on in culture; hence, the positive correlation of seeding density with upregulation of these genes [25,43]. However, this positive correlation has been seen to level off after a critical value has been exceeded [44]. Shear stress has been linked with the upregulation of OSX, OCN and OPN during perfusion bioreactor culture [37,45,46,47], but only a limited number of studies used human mesenchymal cells in 3D setups [19,38,41,48]. Prior studies have shown that the expression of these markers increased in the presence of medium flow relative to static cultures [49], and other studies have correlated flow and/or shear stresses with an increased induction of osteogenic differentiation and tissue formation [18,50].
These findings agree with our results on the significant effect of flow on the aforementioned genes. However, we should note that, due to differences in scaffold material and design and the composition of osteogenic media, the extent and timing of osteogenic differentiation would be expected to vary across systems. Regarding ALP gene expression, our data show a negative correlation to flow rate magnitude (between seven and 21 days of culture), which has also been observed by other groups. Higher shear stress in a perfusion bioreactor decreased ALP expression after 14 days of culture [21], while a decrease in ALP specific activity from Day 7 to Day 21 was also observed during 3D culture of hMSCs [41]. Furthermore, a positive correlation between seeding density and ALP gene expression has been reported for human umbilical cord MSCs [44], in agreement with the effect observed in this work. Interestingly, hMSCs cultured in osteogenic differentiation medium under shear stress exposure in a 2D system became less responsive in the gene expression of alkaline phosphatase, possibly explaining the dose dependency observed in this study [51].
Col1 was seen not to be affected by the magnitude of flow, while it correlated positively with seeding density. Although collagen matrix synthesis has been reported in numerous studies to be positively affected by flow rate [6,50,52], a possible explanation for the lack of correlation between Col1 and fluid flow magnitude could be the fact that by Day 7, which is the initial time point studied in our work, Col1 expression was already downregulated. Similar Col1 temporal trends parallel to elevated alkaline phosphatase levels have, however, been observed in dynamic culture systems [53].

3.4. Highlighting Gene Expression Signature Windows via Response Surface Methodology
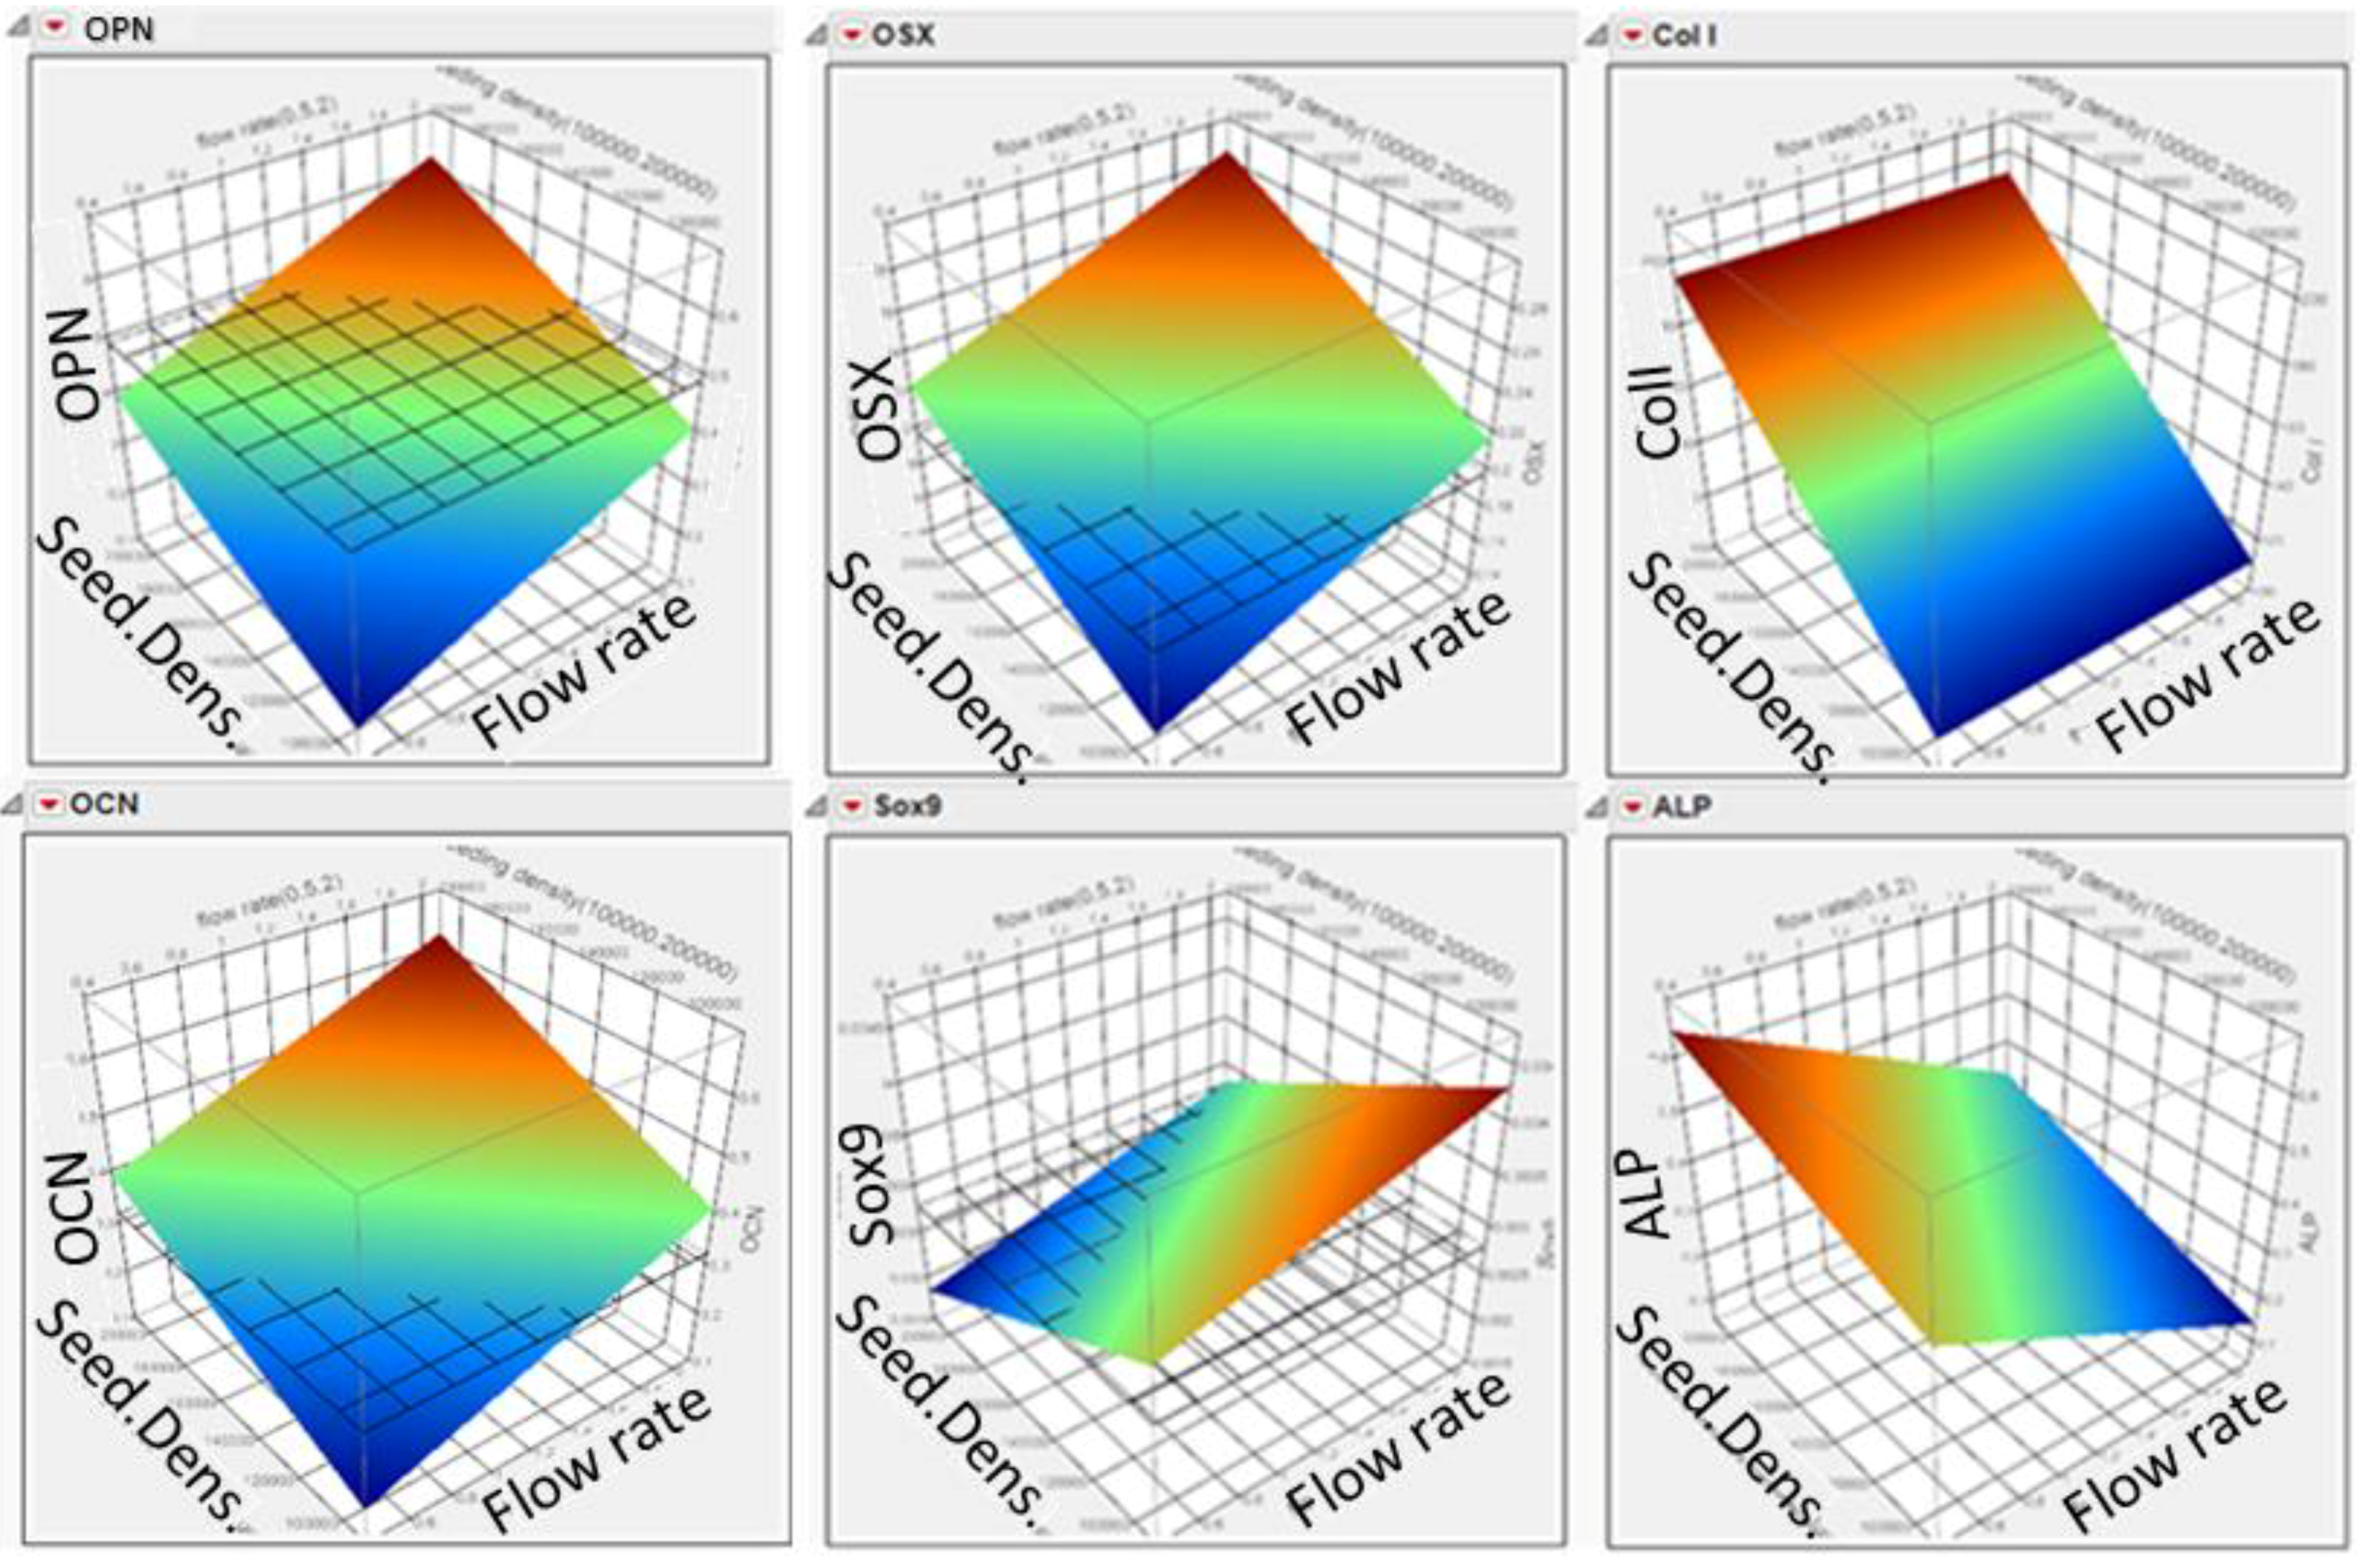
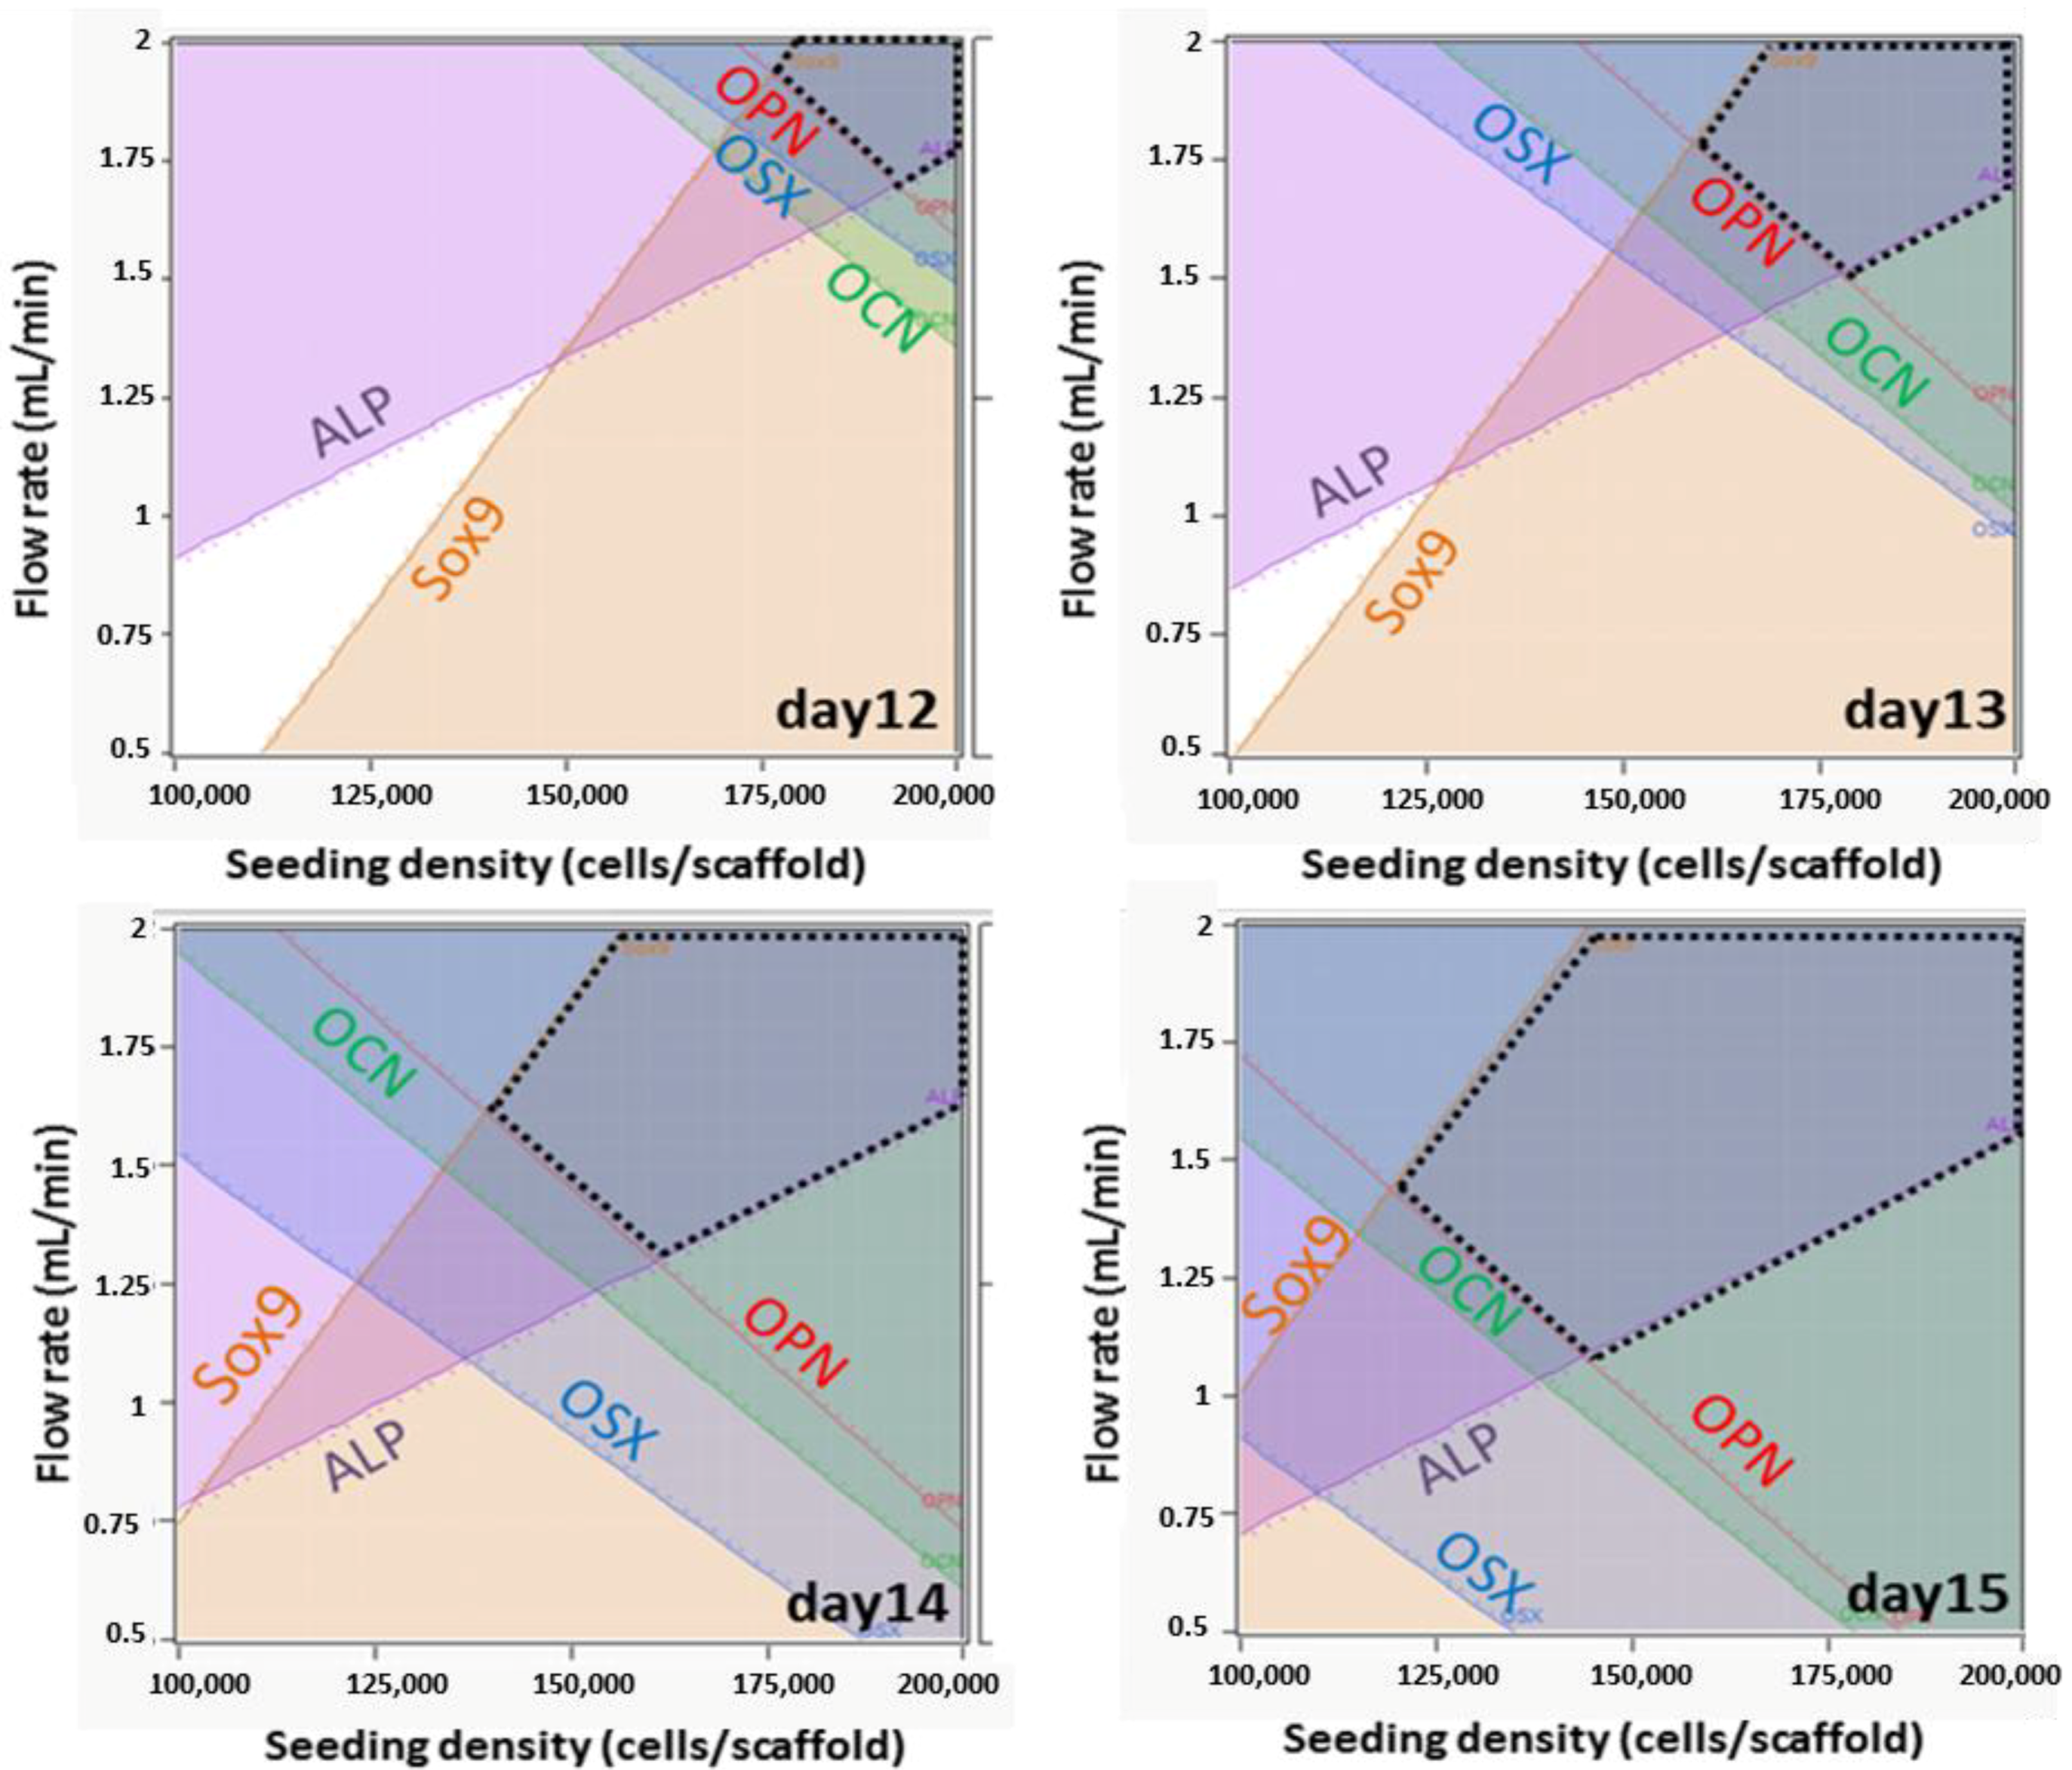
The overall aim of this study was to introduce a “windows of operation” methodology as a tool to allow instantaneous visualization of multiple gene expression data related to osteogenic differentiation, thereby aiding decision-making regarding the end-point properties of 3D TE constructs obtained in dynamic culture conditions. By mapping out operating spaces using a DoE approach, user-defined levels of process performance may be finally obtained by linking the effects of process parameters (factors) on pre-selected response variables, in this case, gene expression levels. By using gene specific response surfaces presented in Figure 7 and overlaying them as shown in Figure 8, a case study on the development of a gene expression signature over culture time (days) as a function of flow rate and cell seeding density. By gene expression signature, we refer to a combination of genes that will be expressed by cultured cells to predefined values, where minimum criteria or intermediate ones (between a set minimum and maximum value) may be met. Dashed lines (Figure 8) highlight the values of the two selected process parameters that are required in order to produce TE constructs containing cells that express the selected genes above a desired threshold value. As the culture progresses and the osteogenic differentiation process “matures” from Day 12 to Day 15, it may be seen that the gene expression signature target-values are obtained with a wider combination of culture process parameters, since this is a time-dependent biologic process. This ultimately means that based on the selection of the operating process parameters, TE cultures may be steered towards desired directions where the cell population may possess desirable phenotypic characteristics. Confidence intervals (95%), as seen in Figure 5 could be also incorporated in the outlining of a more restricted, but more reliable window of operation. Recently, a similar approach was used for highlighting “windows of operation” of perfusion bioreactors during early culture time points (up to three days of cell culture), by operating in minimal cell detachment and increased gene expression levels of COX2 and OPN [54].
We do realize, however, that the use of a fractional factorial, rather than full-factorial design, aliases (i.e., does not decouple) the interactive effects of remaining factors to the main effect of a factor not making use of the full extent of the possibilities of such a strategy. However, the systematic investigation of the interplay between culture process parameters and neo-tissue quality attributes, such as cell phenotype, will give insights regarding TE bioprocess development and optimization. Overall, it should be stated that the use of multifactorial DoE approaches and response surface models for process optimization in TE applications has recently gained momentum [12,14,16,40,55]. These studies highlight the rising need for improved process understanding, in particular when dealing with inherently highly complex TE systems, meeting, at the same time, regulatory requirements.
Figure 7. Response surface representations showing the effect of seeding density (Seed. Dens.) and flow rate on gene expression levels for all genes studied. Relative expression levels were used to plot the response surfaces shown. The data shown are indicative of Day 14.
Processes 02 00639 g007
Figure 8. Development of a selected gene expression signature over culture time (as indicated by the dashed lines) in a perfusion bioreactor setup, as a function of flow rate and cell seeding efficiency.
Processes 02 00639 g008

4. Conclusions

In this work, we showed that the use of multifactorial DoE can be employed as a tool to link perfusion bioreactor operating conditions (process parameters, such as seeding density and flow rate) to osteogenic differentiation. Furthermore, by overlaying gene-specific response surfaces, an integrated operating process space was highlighted within which predetermined values of six genes of interest (i.e., gene signature) could be minimally met over the course of a bioreactor culture period. Such an approach will enhance our understanding of the highly complex TE bioprocesses and allow the development of predictive models for in vitro cell behavior and, hopefully, in vivo outcomes. This strategy would thus facilitate the transition from bench to clinic and, ultimately, to the market.

Acknowledgments

Ioannis Papantoniou is funded by the ENDEAVOUR Project G.0982.11N of the Research Foundation Flanders (Fonds Wetenschappelijk Onderzoek (FWO) Vlaanderen). Maarten Sonnaert is supported by a Ph.D. grant of the Agency for Innovation by Science and Technology (Innovatie door Wetenschap en Technologie (IWT)/111457). Toon Lambrechts is supported by the KU Leuven Concerted Research Actions (Geconcerteerde Onderzoeksacties (GOA)/13/016). Lies Geris acknowledges support by the European Research Council under the European Union’s Seventh Framework Program (FP7/2007-2013)/European Research Council (ERC) Grant Agreement No. 279100. This work is part of Prometheus, the Leuven Research and Development Division of Skeletal Tissue Engineering of the KU Leuven: www.kuleuven.be/prometheus.

Author Contributions

Ioannis Papantoniou designed and performed all cell culturing and bioreactor experiments, performed data analyses and modeling and wrote the manuscript. Maarten Sonnaert and Toon Lambrechts supported the writing of the manuscript and figure editing. Jean-Marie Aerts and Lies Geris edited and corrected the text. Frank Luyten supported this work from a translational and clinical point of view. Jan Schrooten was the overall supervisor. All authors read and approved the final manuscript.

Conflicts of Interest

The authors declare no conflict of interest.

References

  1. Laurencin, C.T.; Ambrosio, A.M.A.; Borden, M.D.; Cooper, J.A. Tissue engineering: Orthopedic applications. Annu. Rev. Biomed. Eng. 1999, 1, 19–46. [Google Scholar] [CrossRef] [PubMed]
  2. Stevens, M.M. Biomaterials for bone tissue engineering. Mater. Today 2008, 11, 18–25. [Google Scholar] [CrossRef]
  3. Pampaloni, F.; Reynaud, E.G.; Stelzer, E.H.K. The third dimension bridges the gap between cell culture and live tissue. Nat. Rev. Mol. Cell Biol. 2007, 8, 839–845. [Google Scholar] [CrossRef] [PubMed]
  4. Bancroft, G.N.; Sikavitsas, V.I.; Mikos, A.G. Design of a flow perfusion bioreactor system for bone tissue-engineering applications. Tissue Eng. 2003, 9, 549–554. [Google Scholar] [CrossRef] [PubMed]
  5. Grayson, W.L.; Bhumiratana, S.; Cannizzaro, C.; Vunjak-Novakovic, G. Bioreactor cultivation of functional bone grafts. Methods Mol. Biol. 2011, 698, 231–241. [Google Scholar] [PubMed]
  6. Datta, N.; Pham, Q.P.; Sharma, U.; Sikavitsas, V.I.; Jansen, J.A.; Mikos, A.G. In vitro generated extracellular matrix and fluid shear stress synergistically enhance 3D osteoblastic differentiation. Proc. Natl. Acad. Sci. USA 2006, 103, 2488–2493. [Google Scholar] [CrossRef] [PubMed]
  7. Yeatts, A.B.; Fisher, J.P. Bone tissue engineering bioreactors: Dynamic culture and the influence of shear stress. Bone 2011, 48, 171–181. [Google Scholar] [CrossRef] [PubMed]
  8. Placzek, M.R.; Chung, I.M.; Macedo, H.M.; Ismail, S.; Blanco, T.M.; Lim, M.; Cha, J.M.; Fauzi, I.; Kang, Y.; Yeo, D.C.L.; Ma, C.Y.J.; et al. Stem cell bioprocessing: Fundamentals and principles. J. R. Soc. Interface 2009, 6, 209–232. [Google Scholar] [CrossRef] [PubMed]
  9. Ratcliffe, E.; Thomas, R.J.; Williams, D.J. Current understanding and challenges in bioprocessing of stem cell-based therapies for regenerative medicine. Br. Med. Bull. 2011, 100, 137–155. [Google Scholar] [CrossRef] [PubMed]
  10. Lenas, P.; Moos, M.; Luyten, F.P. Developmental engineering: A new paradigm for the design and manufacturing of cell-based products. Part I: From three-dimensional cell growth to biomimetics of in vivo development. Tissue Eng. Part B 2009, 15, 381–394. [Google Scholar]
  11. Thomas, R.J.; Hourd, P.C.; Williams, D.J. Application of process quality engineering techniques to improve the understanding of the in vitro processing of stem cells for therapeutic use. J. Biotechnol. 2008, 136, 148–155. [Google Scholar] [CrossRef]
  12. Ratcliffe, E.; Hourd, P.; Guijarro-Leach, J.; Rayment, E.; Williams, D.J.; Thomas, R.J. Application of response surface methodology to maximize the productivity of scalable automated human embryonic stem cell manufacture. Regen. Med. 2013, 8, 39–48. [Google Scholar] [CrossRef] [PubMed]
  13. Lim, M.; Panoskaltsis, N.; Ye, H.; Mantalaris, A. Optimization of in vitro erythropoiesis from CD34+ cord blood cells using design of experiments (DOE). Biochem. Eng. J. 2011, 55, 154–161. [Google Scholar] [CrossRef]
  14. Papantoniou, I.I.; Chai, Y.C.; Luyten, F.P.; Schrooten, J.I. Process quality engineering for bioreactor-driven manufacturing of tissue-engineered constructs for bone regeneration. Tissue Eng. Part C 2013. [Google Scholar] [CrossRef]
  15. Chen, Y.; Bloemen, V.; Impens, S.; Moesen, M.; Luyten, F.P.; Schrooten, J. Characterization and optimization of cell seeding in scaffolds by factorial design: Quality by design approach for skeletal tissue engineering. Tissue Eng. Part C 2011, 17, 1211–1221. [Google Scholar] [CrossRef]
  16. Hunt, M.M.; Meng, G.L.; Rancourt, D.E.; Gates, I.D.; Kallos, M.S. Factorial experimental design for the culture of human embryonic stem cells as aggregates in stirred suspension bioreactors reveals the potential for interaction effects between bioprocess parameters. Tissue Eng. Part C 2014, 20, 76–89. [Google Scholar] [CrossRef]
  17. Cartmell, S.H.; Porter, B.D.; Garcia, A.J.; Guldberg, R.E. Effects of medium perfusion rate on cell-seeded three-dimensional bone constructs in vitro. Tissue Eng. 2003, 9, 1197–1203. [Google Scholar] [CrossRef] [PubMed]
  18. Sikavitsas, V.I.; Bancroft, G.N.; Lemoine, J.J.; Liebschner, M.A.K.; Dauner, M.; Mikos, A.G. Flow perfusion enhances the calcified matrix deposition of marrow stromal cells in biodegradable nonwoven fiber mesh scaffolds. Ann. Biomed. Eng. 2005, 33, 63–70. [Google Scholar] [CrossRef] [PubMed]
  19. Bjerre, L.; Bunger, C.E.; Kassem, M.; Mygind, T. Flow perfusion culture of human mesenchymal stem cells on silicate-substituted tricalcium phosphate scaffolds. Biomaterials 2008, 29, 2616–2627. [Google Scholar] [CrossRef] [PubMed]
  20. McCoy, R.J.; O’Brien, F.J. Influence of shear stress in perfusion bioreactor cultures for the development of three-dimensional bone tissue constructs: A review. Tissue Eng. Part B 2010, 16, 587–601. [Google Scholar] [CrossRef]
  21. Kim, J.; Ma, T. Perfusion regulation of hMSC microenvironment and osteogenic differentiation in 3D scaffold. Biotechnol. Bioeng. 2012, 109, 252–261. [Google Scholar] [CrossRef] [PubMed]
  22. Chai, Y.C.; Roberts, S.J.; van Bael, S.; Chen, Y.; Luyten, F.P.; Schrooten, J. Multi-level factorial analysis of Ca2+/Pi supplementation as bio-instructive media for in vitro biomimetic engineering of three-dimensional osteogenic hybrids. Tissue Eng. Part C 2012, 18, 90–103. [Google Scholar] [CrossRef]
  23. Bitar, M.; Brown, R.A.; Salih, V.; Kidane, A.G.; Knowles, J.C.; Nazhat, S.N. Effect of cell density on osteoblastic differentiation and matrix degradation of biomimetic dense collagen scaffolds. Biomacromolecules 2008, 9, 129–135. [Google Scholar] [CrossRef] [PubMed]
  24. Eyckmans, J.; Lin, G.L.; Chen, C.S. Adhesive and mechanical regulation of mesenchymal stem cell differentiation in human bone marrow and periosteum-derived progenitor cells. Biol. Open 2012, 1, 1058–1068. [Google Scholar] [CrossRef] [PubMed]
  25. Kim, K.; Dean, D.; Mikos, A.G.; Fisher, J.P. Effect of initial cell seeding density on early osteogenic signal expression of rat bone marrow stromal cells cultured on cross-linked poly(propylene fumarate) disks. Biomacromolecules 2009, 10, 1810–1817. [Google Scholar] [CrossRef] [PubMed]
  26. Salter, E.; Goh, B.; Hung, B.; Hutton, D.; Ghone, N.; Grayson, W.L. Bone tissue engineering bioreactors: A role in the clinic? Tissue Eng. Part B 2012, 18, 62–75. [Google Scholar]
  27. Lim, M.; Shunjie, C.; Panoskaltsis, N.; Mantalaris, A. Systematic experimental design for bioprocess characterization: Elucidating transient effects of multi-cytokine contributions on erythroid differentiation. Biotechnol. Bioproc. E 2012, 17, 218–226. [Google Scholar] [CrossRef]
  28. Pyka, G.; Burakowski, A.; Kerckhofs, G.; Moesen, M.; van Bael, S.; Schrooten, J.; Wevers, M. Surface modification of Ti6Al4V open porous structures produced by additive manufacturing. Adv. Eng. Mater. 2012, 14, 363–370. [Google Scholar] [CrossRef]
  29. Eyckmans, J.; Luyten, F.P. Species specificity of ectopic bone formation using periosteum-derived mesenchymal progenitor cells. Tissue Eng. 2006, 12, 2203–2213. [Google Scholar] [CrossRef] [PubMed]
  30. Chai, Y.C.; Roberts, S.J.; Schrooten, J.; Luyten, F.P. Probing the osteoinductive effect of calcium phosphate by using an in vitro biomimetic model. Tissue Eng. Part A 2011, 17, 1083–1097. [Google Scholar] [CrossRef] [PubMed]
  31. Chai, Y.C.; Truscello, S.; Bael, S.V.; Luyten, F.P.; Vleugels, J.; Schrooten, J. Perfusion electrodeposition of calcium phosphate on additive manufactured titanium scaffolds for bone engineering. Acta Biomater. 2011, 7, 2310–2319. [Google Scholar] [CrossRef] [PubMed]
  32. Chen, Y.; Sonnaert, M.; Roberts, S.J.; Luyten, F.P.; Schrooten, J. Validation of a PicoGreen-based DNA quantification integrated in an RNA extraction method for two-dimensional and three-dimensional cell cultures. Tissue Eng. Part C 2012, 18, 444–452. [Google Scholar] [CrossRef]
  33. Van Bael, S.; Chai, Y.C.; Truscello, S.; Moesen, M.; Kerckhofs, G.; van Oosterwyck, H.; Kruth, J.P.; Schrooten, J. The effect of pore geometry on the in vitro biological behavior of human periosteum-derived cells seeded on selective laser-melted Ti6Al4V bone scaffolds. Acta Biomater. 2012, 8, 2824–2834. [Google Scholar] [CrossRef] [PubMed]
  34. Zhao, F.; Pathi, P.; Grayson, W.; Xing, Q.; Locke, B.R.; Ma, T. Effects of oxygen transport on 3-d human mesenchymal stem cell metabolic activity in perfusion and static cultures: Experiments and mathematical model. Biotechnol. Prog. 2005, 21, 1269–1280. [Google Scholar] [CrossRef] [PubMed]
  35. Kommareddy, K.P.; Lange, C.; Rumpler, M.; Dunlop, J.W.C.; Manjubala, I.; Cui, J.; Kratz, K.; Lendlein, A.; Fratzl, P. Two stages in three-dimensional in vitro growth of tissue generated by osteoblastlike cells. Biointerphases 2010, 5, 45–52. [Google Scholar] [CrossRef]
  36. Pyka, G.; Kerckhofs, G.; Papantoniou, I.; Speirs, M.; Schrooten, J.; Wevers, M. Surface roughness and morphology customization of additive manufactured open porous Ti6Al4V structures. Materials 2013, 6, 4737–4757. [Google Scholar] [CrossRef]
  37. Kreke, M.R.; Goldstein, A.S. Hydrodynamic shear stimulates osteocalcin expression but not proliferation of bone marrow stromal cells. Tissue Eng. 2004, 10, 780–788. [Google Scholar] [CrossRef] [PubMed]
  38. Grayson, W.L.; Marolt, D.; Bhumiratana, S.; Frohlich, M.; Guo, X.E.; Vunjak-Novakovic, G. Optimizing the medium perfusion rate in bone tissue engineering bioreactors. Biotechnol. Bioeng. 2011, 108, 1159–1170. [Google Scholar] [CrossRef] [PubMed]
  39. McCoy, R.J.; Jungreuthmayer, C.; O’Brien, F.J. Influence of flow rate and scaffold pore size on cell behavior during mechanical stimulation in a flow perfusion bioreactor. Biotechnol. Bioeng. 2012, 109, 1583–1594. [Google Scholar] [CrossRef] [PubMed]
  40. Roberts, S.J.; Chen, Y.; Moesen, M.; Schrooten, J.; Luyten, F.P. Enhancement of osteogenic gene expression for the differentiation of human periosteal derived cells. Stem. Cell Res. 2011, 7, 137–144. [Google Scholar] [CrossRef] [PubMed]
  41. Stiehler, M.; Bunger, C.; Baatrup, A.; Lind, M.; Kassem, M.; Mygind, T. Effect of dynamic 3-D culture on proliferation, distribution, and osteogenic differentiation of human mesenchymal stem cells. J. Biomed. Mater. Res. Part A 2009, 89A, 96–107. [Google Scholar]
  42. Barradas, A.M.; Fernandes, H.A.; Groen, N.; Chai, Y.C.; Schrooten, J.; van de Peppel, J.; van Leeuwen, J.P.; van Blitterswijk, C.A.; de Boer, J. A calcium-induced signaling cascade leading to osteogenic differentiation of human bone marrow-derived mesenchymal stromal cells. Biomaterials 2012, 33, 3205–3215. [Google Scholar] [CrossRef] [PubMed]
  43. Vehof, J.W.M.; de Ruijter, A.E.; Spauwen, P.H.M.; Jansen, J.A. Influence of rhBMP-2 on rat bone marrow stromal cells cultured on titanium fiber mesh. Tissue Eng. 2001, 7, 373–383. [Google Scholar] [CrossRef] [PubMed]
  44. Zhou, H.Z.; Weir, M.D.; Xu, H.H.K. Effect of cell seeding density on proliferation and osteodifferentiation of umbilical cord stem cells on calcium phosphate cement-fiber scaffold. Tissue Eng. Part A 2011, 17, 2603–2613. [Google Scholar] [CrossRef] [PubMed]
  45. You, J.; Reilly, G.C.; Zhen, X.C.; Yellowley, C.E.; Chen, Q.; Donahue, H.J.; Jacobs, C.R. Osteopontin gene regulation by oscillatory fluid flow via intracellular calcium mobilization and activation of mitogen-activated protein kinase in MC3T3-E1 osteoblasts. J. Biol. Chem. 2001, 276, 13365–13371. [Google Scholar] [CrossRef] [PubMed]
  46. Kreke, M.R.; Huckle, W.R.; Goldstein, A.S. Fluid flow stimulates expression of osteopontin and bone sialoprotein by bone marrow stromal cells in a temporally dependent manner. Bone 2005, 36, 1047–1055. [Google Scholar] [CrossRef] [PubMed]
  47. Scaglione, S.; Wendt, D.; Miggino, S.; Papadimitropoulos, A.; Fato, M.; Quarto, R.; Martin, I. Effects of fluid flow and calcium phosphate coating on human bone marrow stromal cells cultured in a defined 2D model system. J. Biomed. Mater. Res. Part A 2008, 86A, 411–419. [Google Scholar] [CrossRef]
  48. Meinel, L.; Karageorgiou, V.; Hofmann, S.; Fajardo, R.; Snyder, B.; Li, C.; Zichner, L.; Langer, R.; Vunjak-Novakovic, G.; Kaplan, D.L. Engineering bone-like tissue in vitro using human bone marrow stem cells and silk scaffolds. J. Biomed. Mater. Res. Part A 2004, 71, 25–34. [Google Scholar] [CrossRef]
  49. Yu, X.J.; Botchwey, E.A.; Levine, E.M.; Pollack, S.R.; Laurencin, C.T. Bioreactor-based bone tissue engineering: The influence of dynamic flow on osteoblast phenotypic expression and matrix mineralization. Proc. Natl. Acad. Sci. USA 2004, 101, 11203–11208. [Google Scholar] [CrossRef]
  50. Bancroft, G.N.; Sikavitsast, V.I.; van den Dolder, J.; Sheffield, T.L.; Ambrose, C.G.; Jansen, J.A.; Mikos, A.G. Fluid flow increases mineralized matrix deposition in 3D perfusion culture of marrow stromal osteloblasts in a dose-dependent manner. Proc. Natl. Acad. Sci. USA 2002, 99, 12600–12605. [Google Scholar] [CrossRef] [PubMed]
  51. Yourek, G.; McCormick, S.M.; Mao, J.J.; Reilly, G.C. Shear stress induces osteogenic differentiation of human mesenchymal stem cells. Regen. Med. 2010, 5, 713–724. [Google Scholar] [CrossRef] [PubMed]
  52. Sikavitsas, V.I.; Bancroft, G.N.; Holtorf, H.L.; Jansen, J.A.; Mikos, A.G. Mineralized matrix deposition by marrow stromal osteoblasts in 3D perfusion culture increases with increasing fluid shear forces. Proc. Natl. Acad. Sci. USA 2003, 100, 14683–14688. [Google Scholar] [CrossRef] [PubMed]
  53. Grellier, M.; Bareille, R.; Bourget, C.; Amedee, J. Responsiveness of human bone marrow stromal cells to shear stress. J. Tissue Eng. Regen. Med. 2009, 3, 302–309. [Google Scholar] [CrossRef] [PubMed]
  54. McCoy, R.J.; O'Brien, F.J. Visualizing feasible operating ranges within tissue engineering systems using a “windows of operation” approach: A perfusion-scaffold bioreactor case study. Biotechnol. Bioeng. 2012, 109, 3161–3171. [Google Scholar] [CrossRef]
  55. Barbosa, H.S.C.; Fernandes, T.G.; Dias, T.P.; Diogo, M.M.; Cabral, J.M.S. New insights into the mechanisms of embryonic stem cell self-renewal under hypoxia: A multifactorial analysis approach. PLoS One 2012, 7. [Google Scholar] [CrossRef]