Article

Inferential Online Measurement of 3D Fractal Dimension of Spray Fluidized Bed Agglomerates

1
Interfaces and Particle Technology, Friedrich-Alexander-Universität Erlangen-Nürnberg, Cauerstr. 4, D-91058 Erlangen, Germany
2
Thermal Process Engineering, Otto von Guericke University Magdeburg, Universitätsplatz 2, D-39106 Magdeburg, Germany
*
Author to whom correspondence should be addressed.
Processes 2025, 13(7), 2316; https://doi.org/10.3390/pr13072316
Submission received: 19 June 2025 / Revised: 15 July 2025 / Accepted: 17 July 2025 / Published: 21 July 2025
(This article belongs to the Section Particle Processes)

Abstract

In this work, a model-based approach to inferentially obtaining information about the 3D fractal dimension of agglomerates produced in spray fluidized beds is presented. The method utilizes high-detail but scarce offline information from X-ray microcomputed tomography for establishing and training an inferential relationship with online information that is easy and fast to obtain. The online measurement information is the geometric roundness of the single agglomerate. To investigate the interpolation capability of the inferential approach, three different strategies are evaluated: correlation with individual process conditions; correlation with parameters adjusted to process parameters; and correlation with respect to a range of process conditions. It is shown that the approach incorporating process conditions provides sufficient accuracy over a wide range of conditions. The inferential evaluation of single agglomerate 3D fractal dimension is achieved in 5 ms on average. This enables the measurement of the distribution of 3D fractal dimension in an online setting for product quality monitoring and control. Several examples illustrate the capabilities of the approach, as well as current limitations.

1. Introduction

Spray agglomeration in fluidized beds is a common technology used to formulate bulk powders from individual particles. Applications can be found, for example, in the formulation of multi-component fertilizers, in complex solids-based pharmaceutical formulations, and in the food industry, especially in the formulation of food powders with instant properties [1].
In spray agglomeration (see Figure 1), an initial bulk material is sprayed with a liquid-based binding agent, e.g., a polymer solution. Binder droplets deposit on the surface of the particles, wetting a fraction of it. If particles contact wetted surface areas (either dry–wet or wet–wet contacts), a liquid bridge is formed, the geometry of which depends on the available liquid volume, its surface tension, and the contact angle between the binder solution and the particle surface. The liquid bridge can transfer momentum between the contacting particles, establishing a joint movement as a single structure (an agglomerate). If the liquid bridge solidifies, a solid bridge forms, establishing a stronger bond between the contacting particles. The fluidization of the bulk material enables the mixing of the particles, i.e., allowing for droplet deposition on the surface of all particles, and provides the necessary heat for the solidification of the liquid bridges, e.g., by removing excess liquid, initiating the crystallization of a dissolved solid component within the binder.
Product properties, e.g., the rehydration behavior of food powders or active area of catalyst pellets, strongly correlate with agglomerate morphology, for example, the number of primary particles combined into an agglomerate, the number and strength of individual solid bridges between primary particles within the agglomerate, or the porosity of the agglomerate formed. In terms of rehydration behavior, agglomerates too small and too dense will not dissolve quickly, as the liquid cannot penetrate the pore space. If the agglomerate is too large, the penetration of liquid into the interior of the agglomerate will be hindered by the tortuosity and total length of the formed pores.
One key morphological indicator describing the internal structure is the 3D fractal dimension of an agglomerate [2]. It influences many usage properties, e.g., mechanical strength (concrete [3], plastics [4]) or rehydration behavior, due to the generation of specific intra-agglomerate pore space.
To enable the formulation of preferential agglomerate structures (e.g., fractal dimension), especially by model-based process control, information on agglomerate structure formation must be accessible on a process-relevant time scale; i.e., information must be obtained fast enough for the appropriate reaction (controller or operator action) to be realized. In spray fluidized beds, agglomerate formation is typically achieved within minutes, for instance, in multi-component detergent powder formulation.
This requirement rules out most of the techniques commonly used for the characterization of agglomerates, for instance, scanning electron microscopy (SEM [5,6,7]), transmission electron microscopy (TEM [8,9]), X-ray computed tomography (XCT [2,10,11]), or optical coherence tomography (OCT; [12,13,14]), due to time-consuming sample preparation and the typical off-site location of the devices.
TEM, XCT, and OCT are further limited in the number of objects that can be studied in parallel, making it difficult to transfer information from small samples (a low number of objects) to the properties of the bulk material. The main advantage of these methods is the high level of detail of structural information that can be extracted from individual objects (agglomerates), often directly in all three spatial dimensions.
An alternative approach is the use of image-based techniques with inline and online capabilities, i.e., using a high-speed optical camera setup to obtain image sequences of particles during formulation processes [15]. These setups are used routinely for the sizing of individual particles by means of commercial equipment that is either installed directly into the apparatus or utilizes a particle side-stream (e.g., Camsizer by MicrotracRetsch or Quickpic by Sympatec).
Especially in case of dense particulate systems like fluidized beds, at-line operation is advantageous. Bulk information on particle size is obtained in minutes, but this may still be too slow to track the dynamics of agglomerate formation. The speed in measurement is countered by a lower level of detail with respect to structural information (two-dimensional information, cf. [16,17]).
So far, no concept that addresses the online determination of the 3D fractal dimension of agglomerates in spray fluidized beds has been developed. This limits the potential for process and product quality monitoring and the process control of spray agglomeration processes toward specific structures and bulk material properties, leading to unnecessary off-spec products, e.g., due to unstable process operation [18].
The current research work presents and evaluates a model-based concept for the online characterization of the 3D fractal dimension of agglomerates produced in spray fluidized beds, closing this methodological gap.
The manuscript is structured as follows: Section 2 introduces the process setup and experimental conditions for spray agglomeration in a continuously operated fluidized bed. Furthermore, it presents an offline evaluation strategy for the 3D fractal dimension of single agglomerates using X-ray microcomputed tomography. Next, the online image acquisition procedure is introduced. Section 3 presents the development of correlations between the 3D fractal dimension of single agglomerates and the geometric shape factor of the agglomerate. Different model-based approaches are presented, ranging from process-condition-specific to the heavy homogenization of influences, and evaluated with respect to the offline training data. Then, the resulting correlation that infers the 3D fractal dimension from the geometric shape factor of roundness is applied to infer the 3D fractal dimension of agglomerates measured in an online context. Insights into the dynamics of structure formation are presented and discussed, as well as the current limitations of the approach. The paper closes with the major conclusions of the work and discusses future extensions of the concept, e.g., to address current limitations.

2. Agglomerate Formulation and Characterization

First, the process producing the spray agglomerates of interest is briefly presented. Then, the processing of the XCT offline data of agglomerates is described, followed by a brief summary of the measurement equipment for online agglomerate measurement.

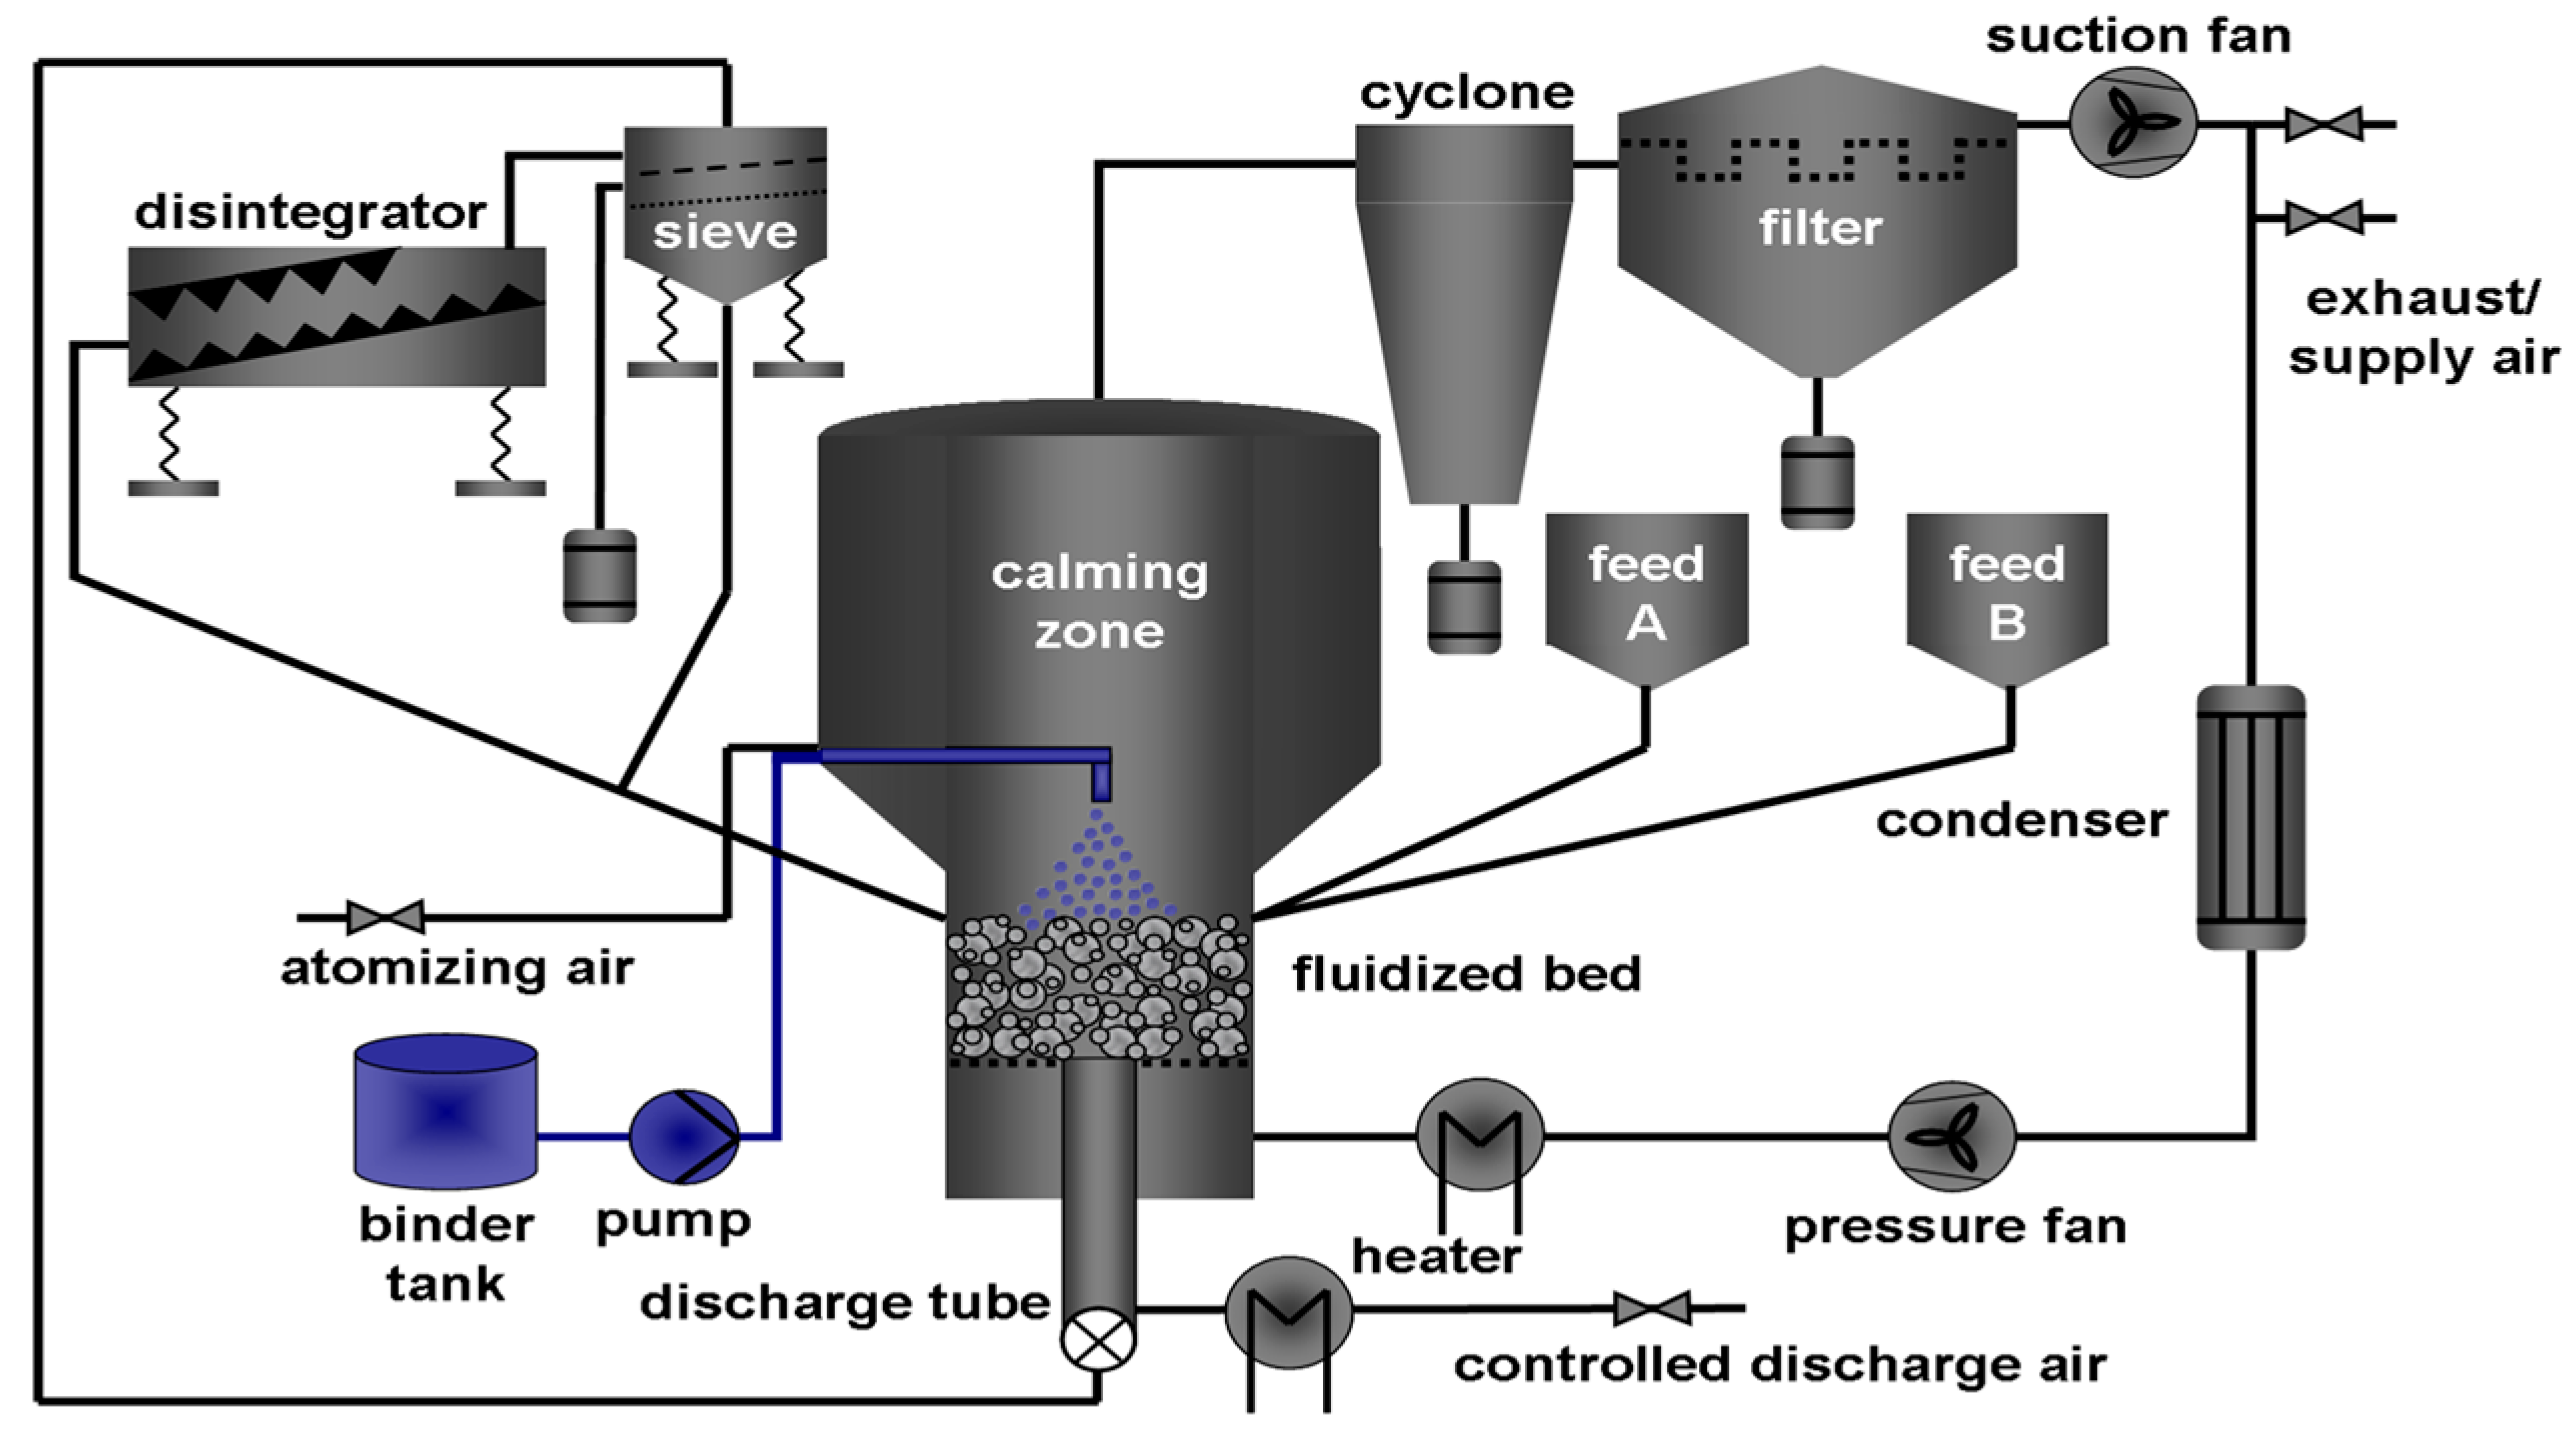
2.1. Spray Fluidized Bed Agglomeration: Process Setup

The experimental setup and conditions that generate the aggregates used in this study are as described in Ajalova et al. [19] and briefly summarized here: A pilot scale cylindrical fluidized bed (IPT Pergande GmbH, Weißandt-Gölzau, Germany) with an inner diameter of 300 mm was used with a continuous primary particle feed and a non-classifying outlet located in the center of the distributor plate (Figure 2).
A two-fluid spray nozzle (Düsen-Schlick GmbH (Untersiemau, Germany), model 940/6 with a hemispheric cap, liquid orifice diameter: 0.8 mm) sprayed the binder solution onto the fluidized particles. The binder solution consisted of water to which different mass fractions of hydroxy-propyl-methyl-cellulose (HPMC, trade name: Pharmacoat 606 from Shin-Etsu, Tokyo, Japan) were added. In all experiments, an atomization flow rate of 0.08 m3 (air) min−1 and a binder feed rate of 32 g min−1 were used. For fluidization, air was provided with a mass flow rate of approximately 280 kg h−1.
Transparent glass beads with a mass density of 2500 kg m−3 and an average diameter (volume-based) of 0.24 mm were used as primary particles.
Variations in process dynamics were studied with respect to the gas inlet temperature (influencing the drying and solidification of the liquid bridges) and the weight fraction of HPMC in the binder solution (influencing the probability of the agglomeration of particles on collision and the mechanical strength of the solid bridges formed). Table 1 shows the experimental parameters for all case studies. All experiments were run for 120 min; samples were taken from the process chamber every ten minutes.

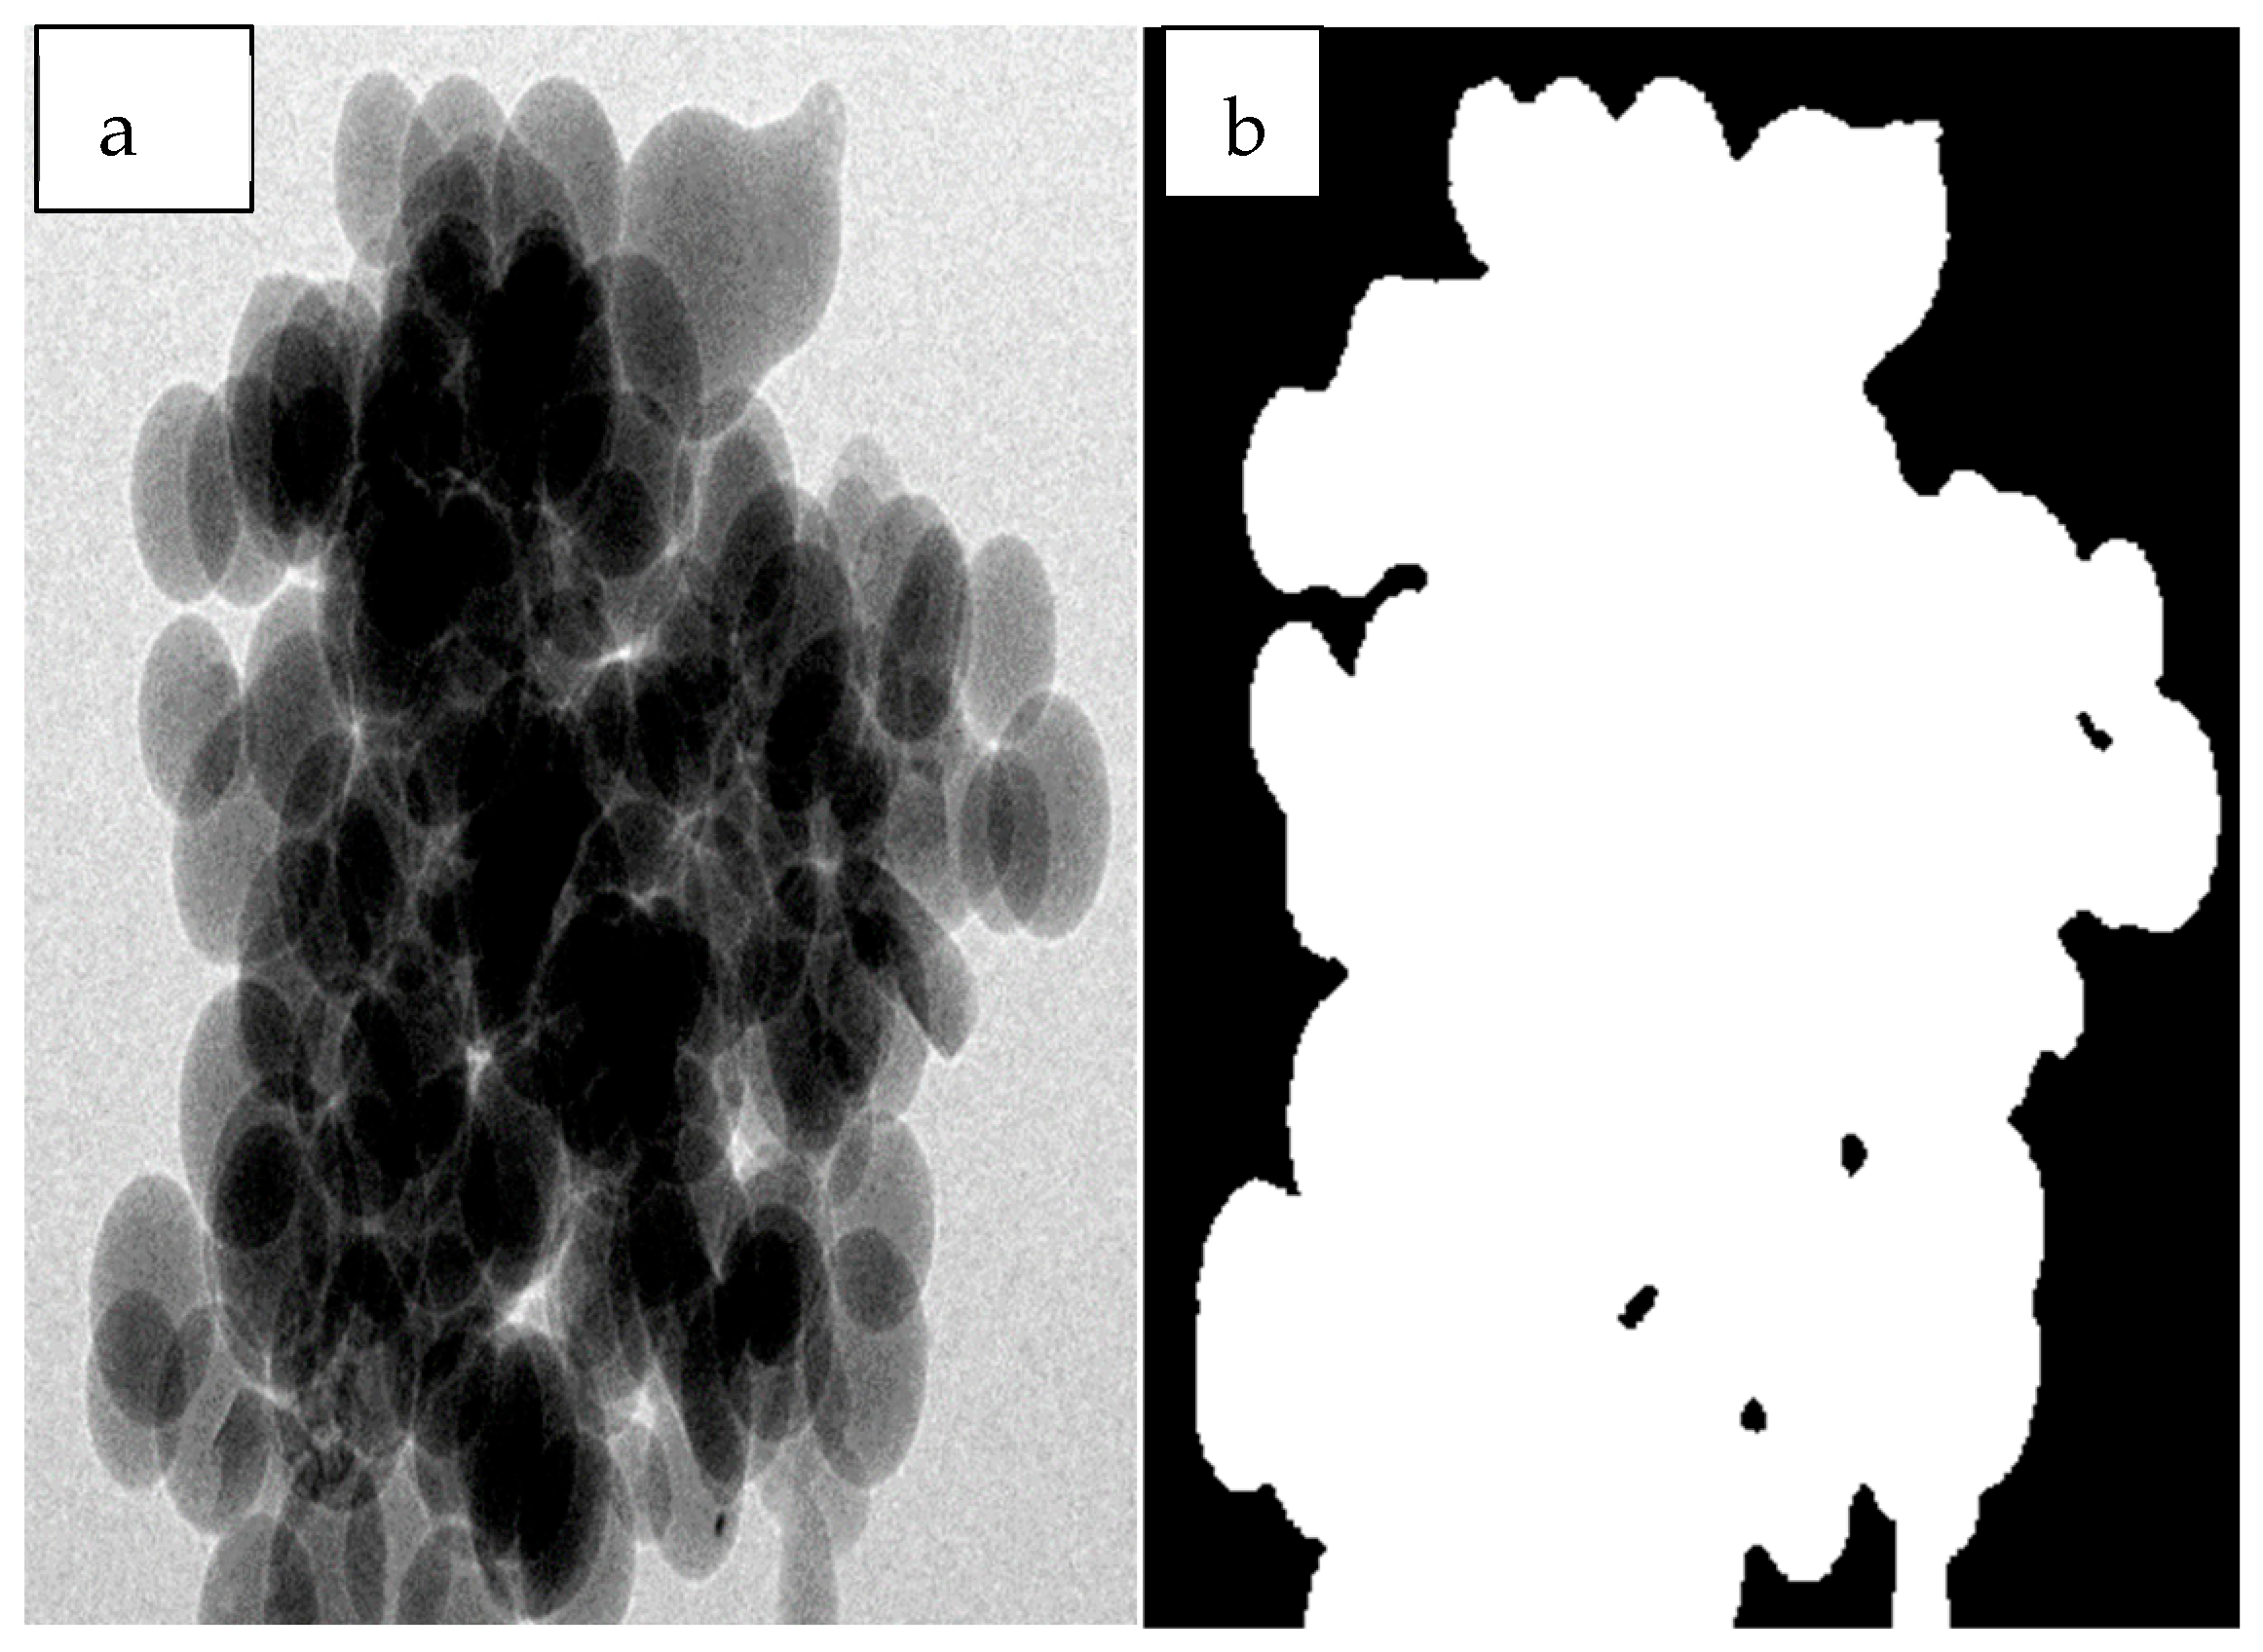
2.2. Offline Data Evaluation: 3D and Image Information from X-Ray Μ-Computed Tomography

The X-ray tomography scanner used in this study was a customized device (CT Procon alpha 2000 by ProCon X-ray GmbH, Garbsen, Germany). The X-ray source was operated at 40 kV and 80 μA. The agglomerate to be investigated was placed around 655 mm from the detector. By the rotation of the sample holder, each agglomerate was scanned in the entire range of 0–360° in 1200 rotation steps. The increment of angle change was 0.3°, with an exposure time of 1 s each. The total acquisition time per agglomerate time was about 1 h. The voxel size of the reconstructed volume was 3.5 μm in each direction. For the purposes of the study, images taken under different angles (every 30°) were treated as 2D projections of independent agglomerates; i.e., one (real) agglomerate generated thirteen different agglomerate projections.

2.3. Online Data Source: High-Speed Image Acquisition

Agglomerates were produced in the spray fluidized bed according to the operation parameters reported in Table 1. To avoid problems with illumination and for the synchronization of agglomerate feed to the image acquisition, the whole feeding and image acquisition process was performed with a Camsizer device (Microtrac Retsch GmbH, Haan, Germany). For image acquisition, a high-speed camera (frame rate of 60 fps at a resolution of 768 pixels (height) by 1012 pixels (width), grayscale color space) was used. Related to the field of view, a spatial resolution of 15 µm/pixel was achieved in both directions.

3. Inferential Assessment of Online 3D Fractal Dimension: Development, Results, and Discussion

In this section, first, the correlation of the agglomerate roundness R to the 3D fractal dimension as obtained from offline XCT measurements is presented. Then, different approaches to correlating the two variables are discussed, leading to the selection of a fast and easy-to-evaluate expression that is suitable for a large range of operation conditions and online process monitoring. Secondly, using this new correlation, new insights into the fractal formation dynamics of spray agglomerates are obtained and presented. Furthermore, data on the distribution of the 3D fractal dimension of agglomerates formed in a continuously operated spray fluidized bed are presented and discussed.

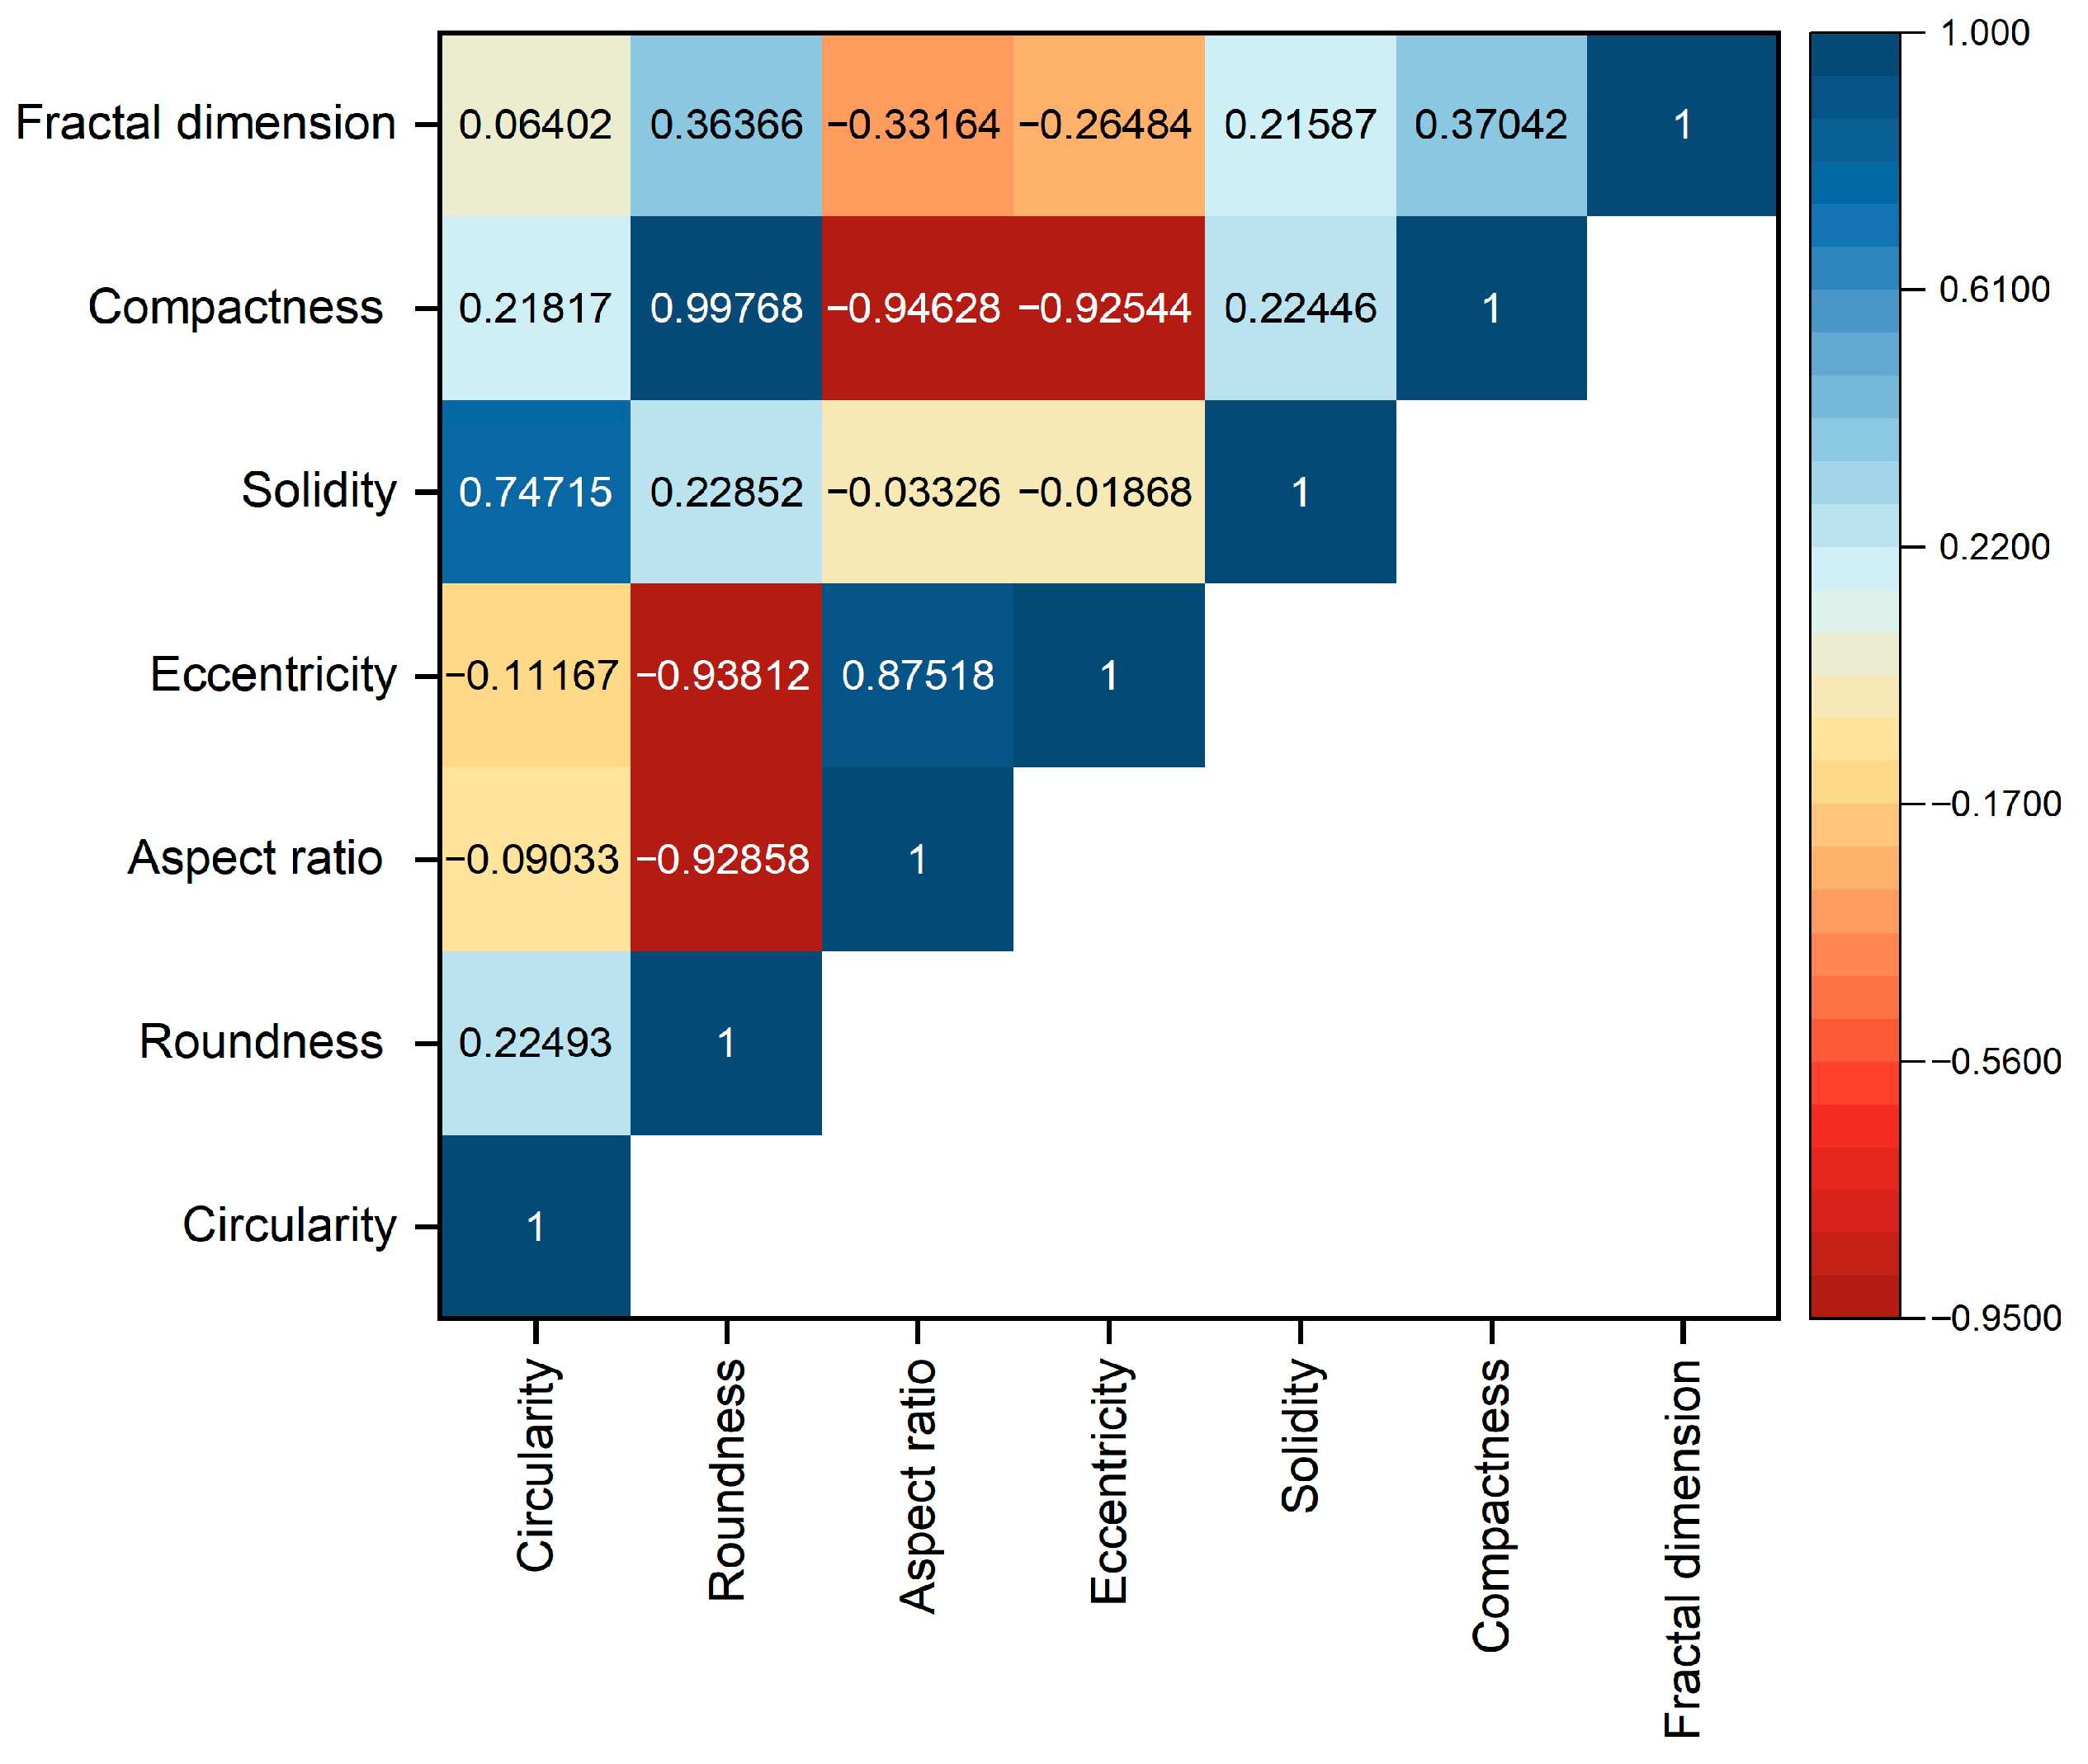
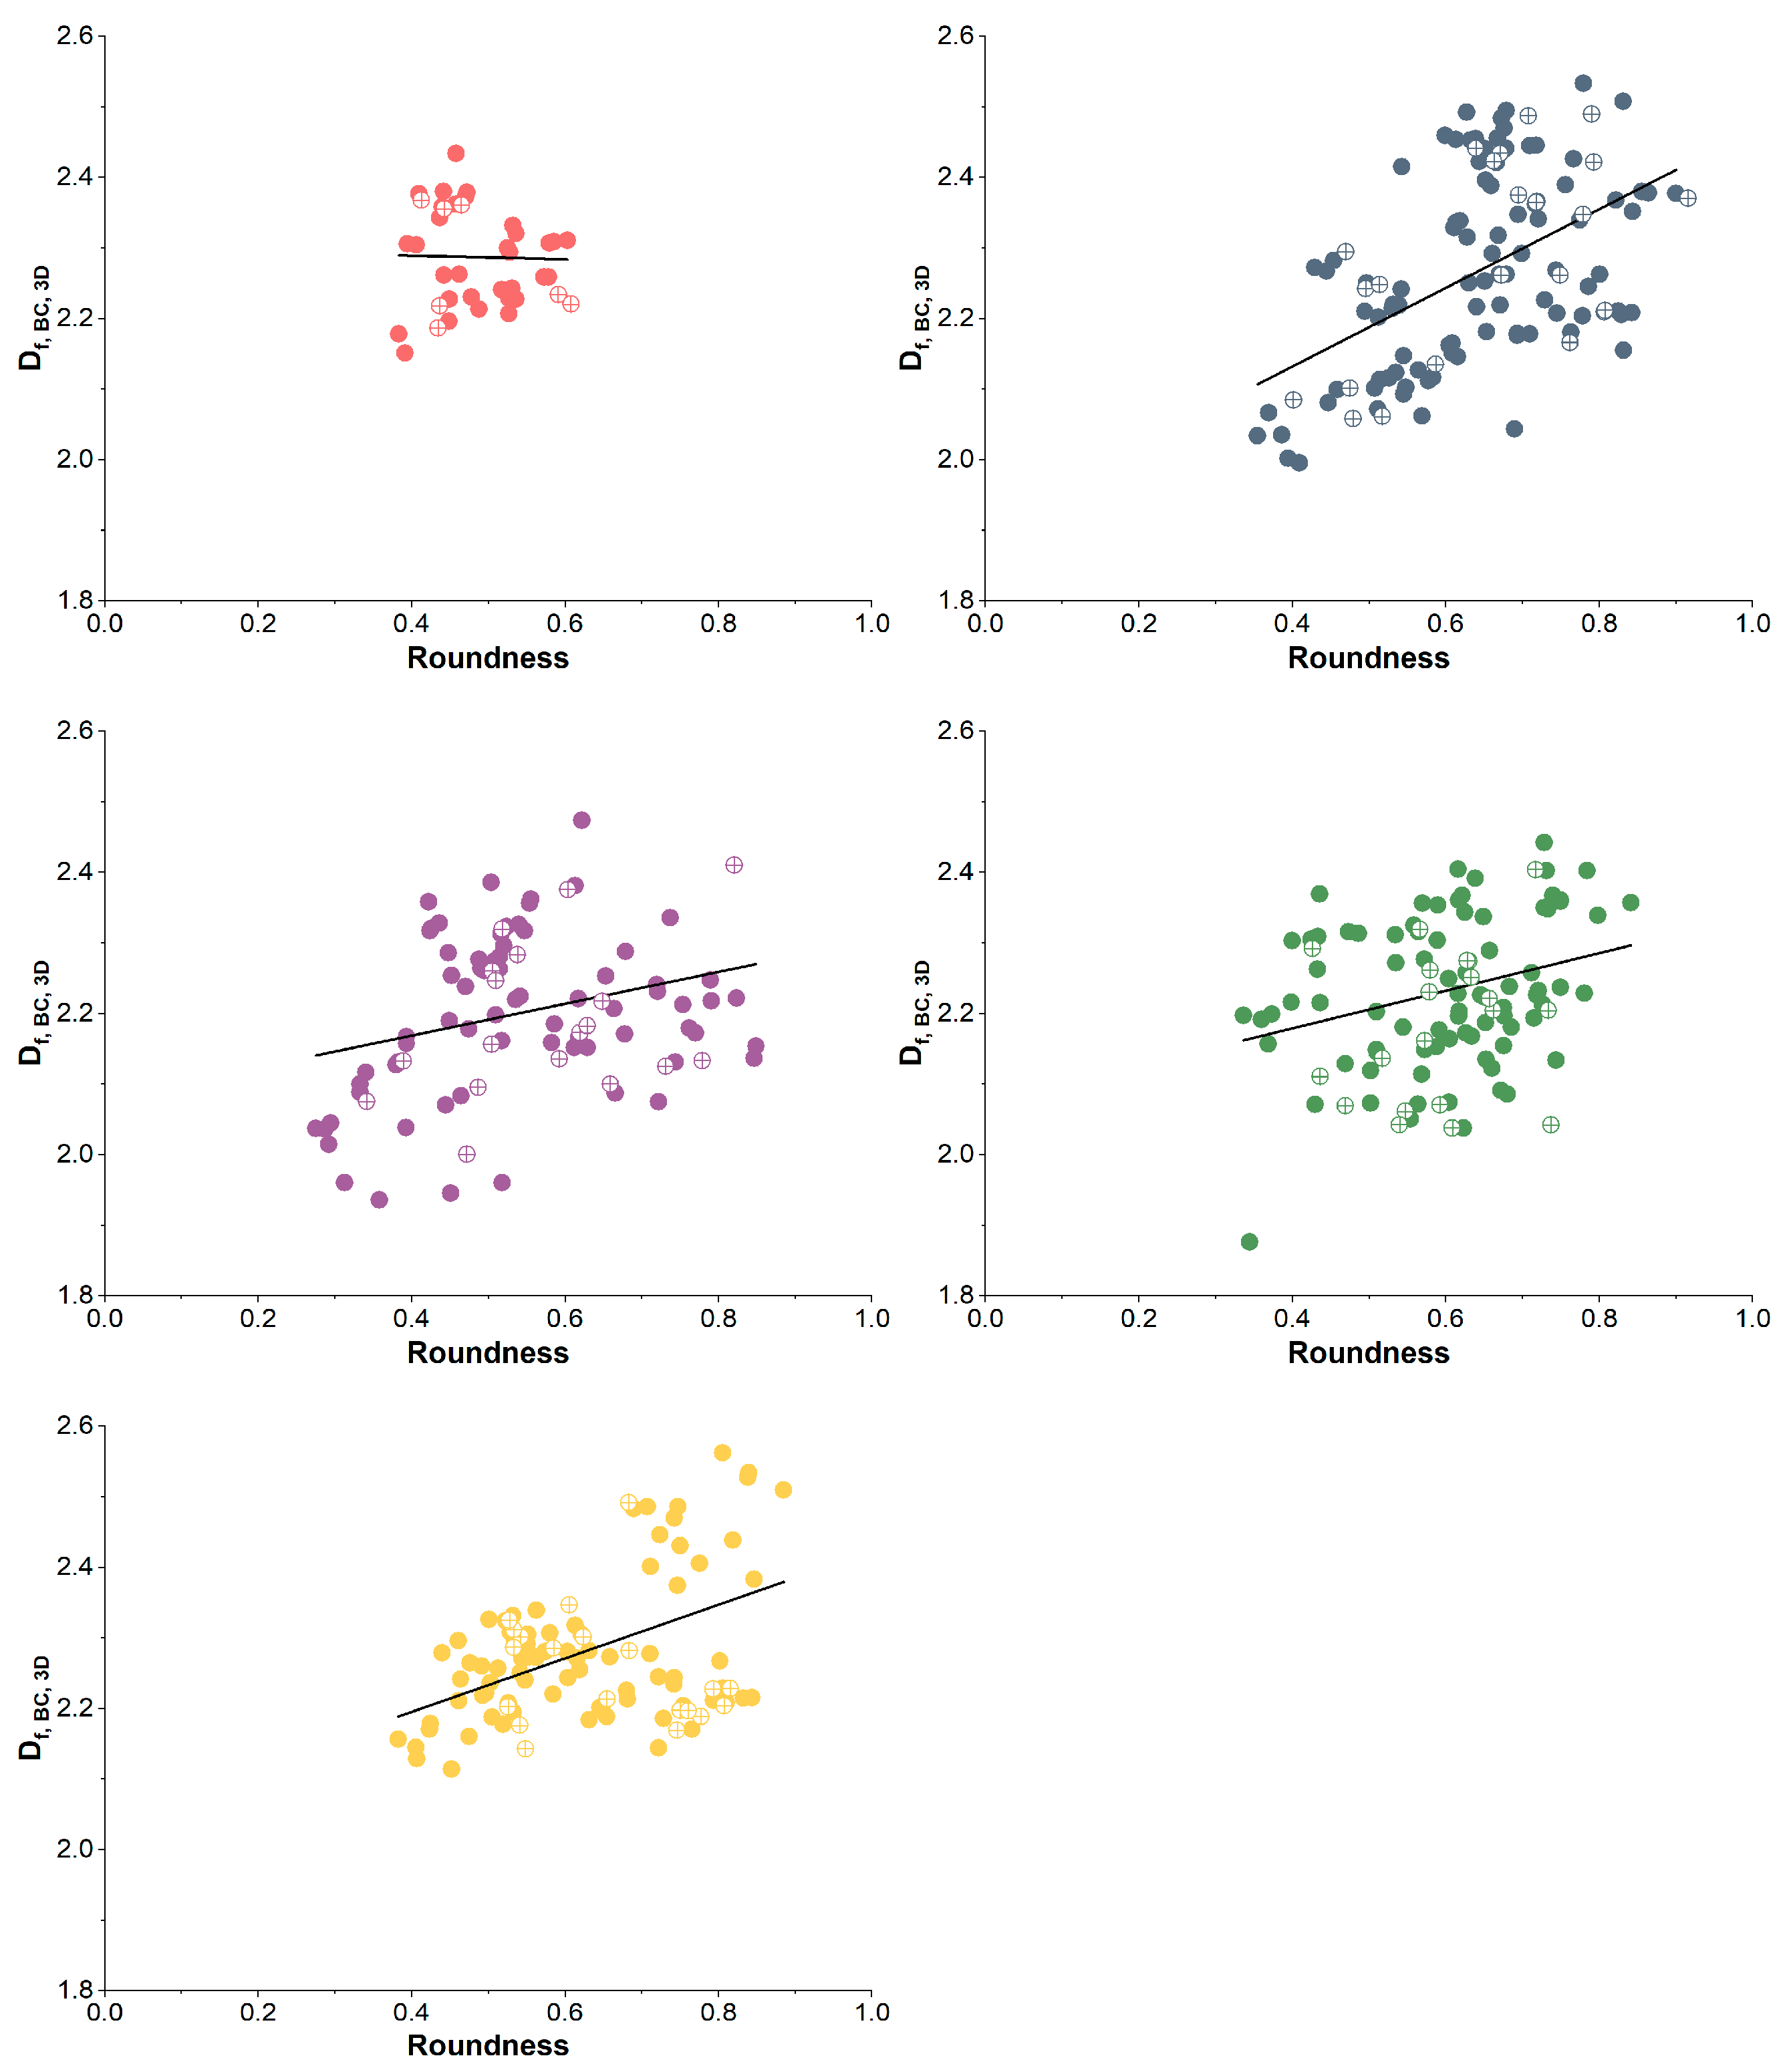
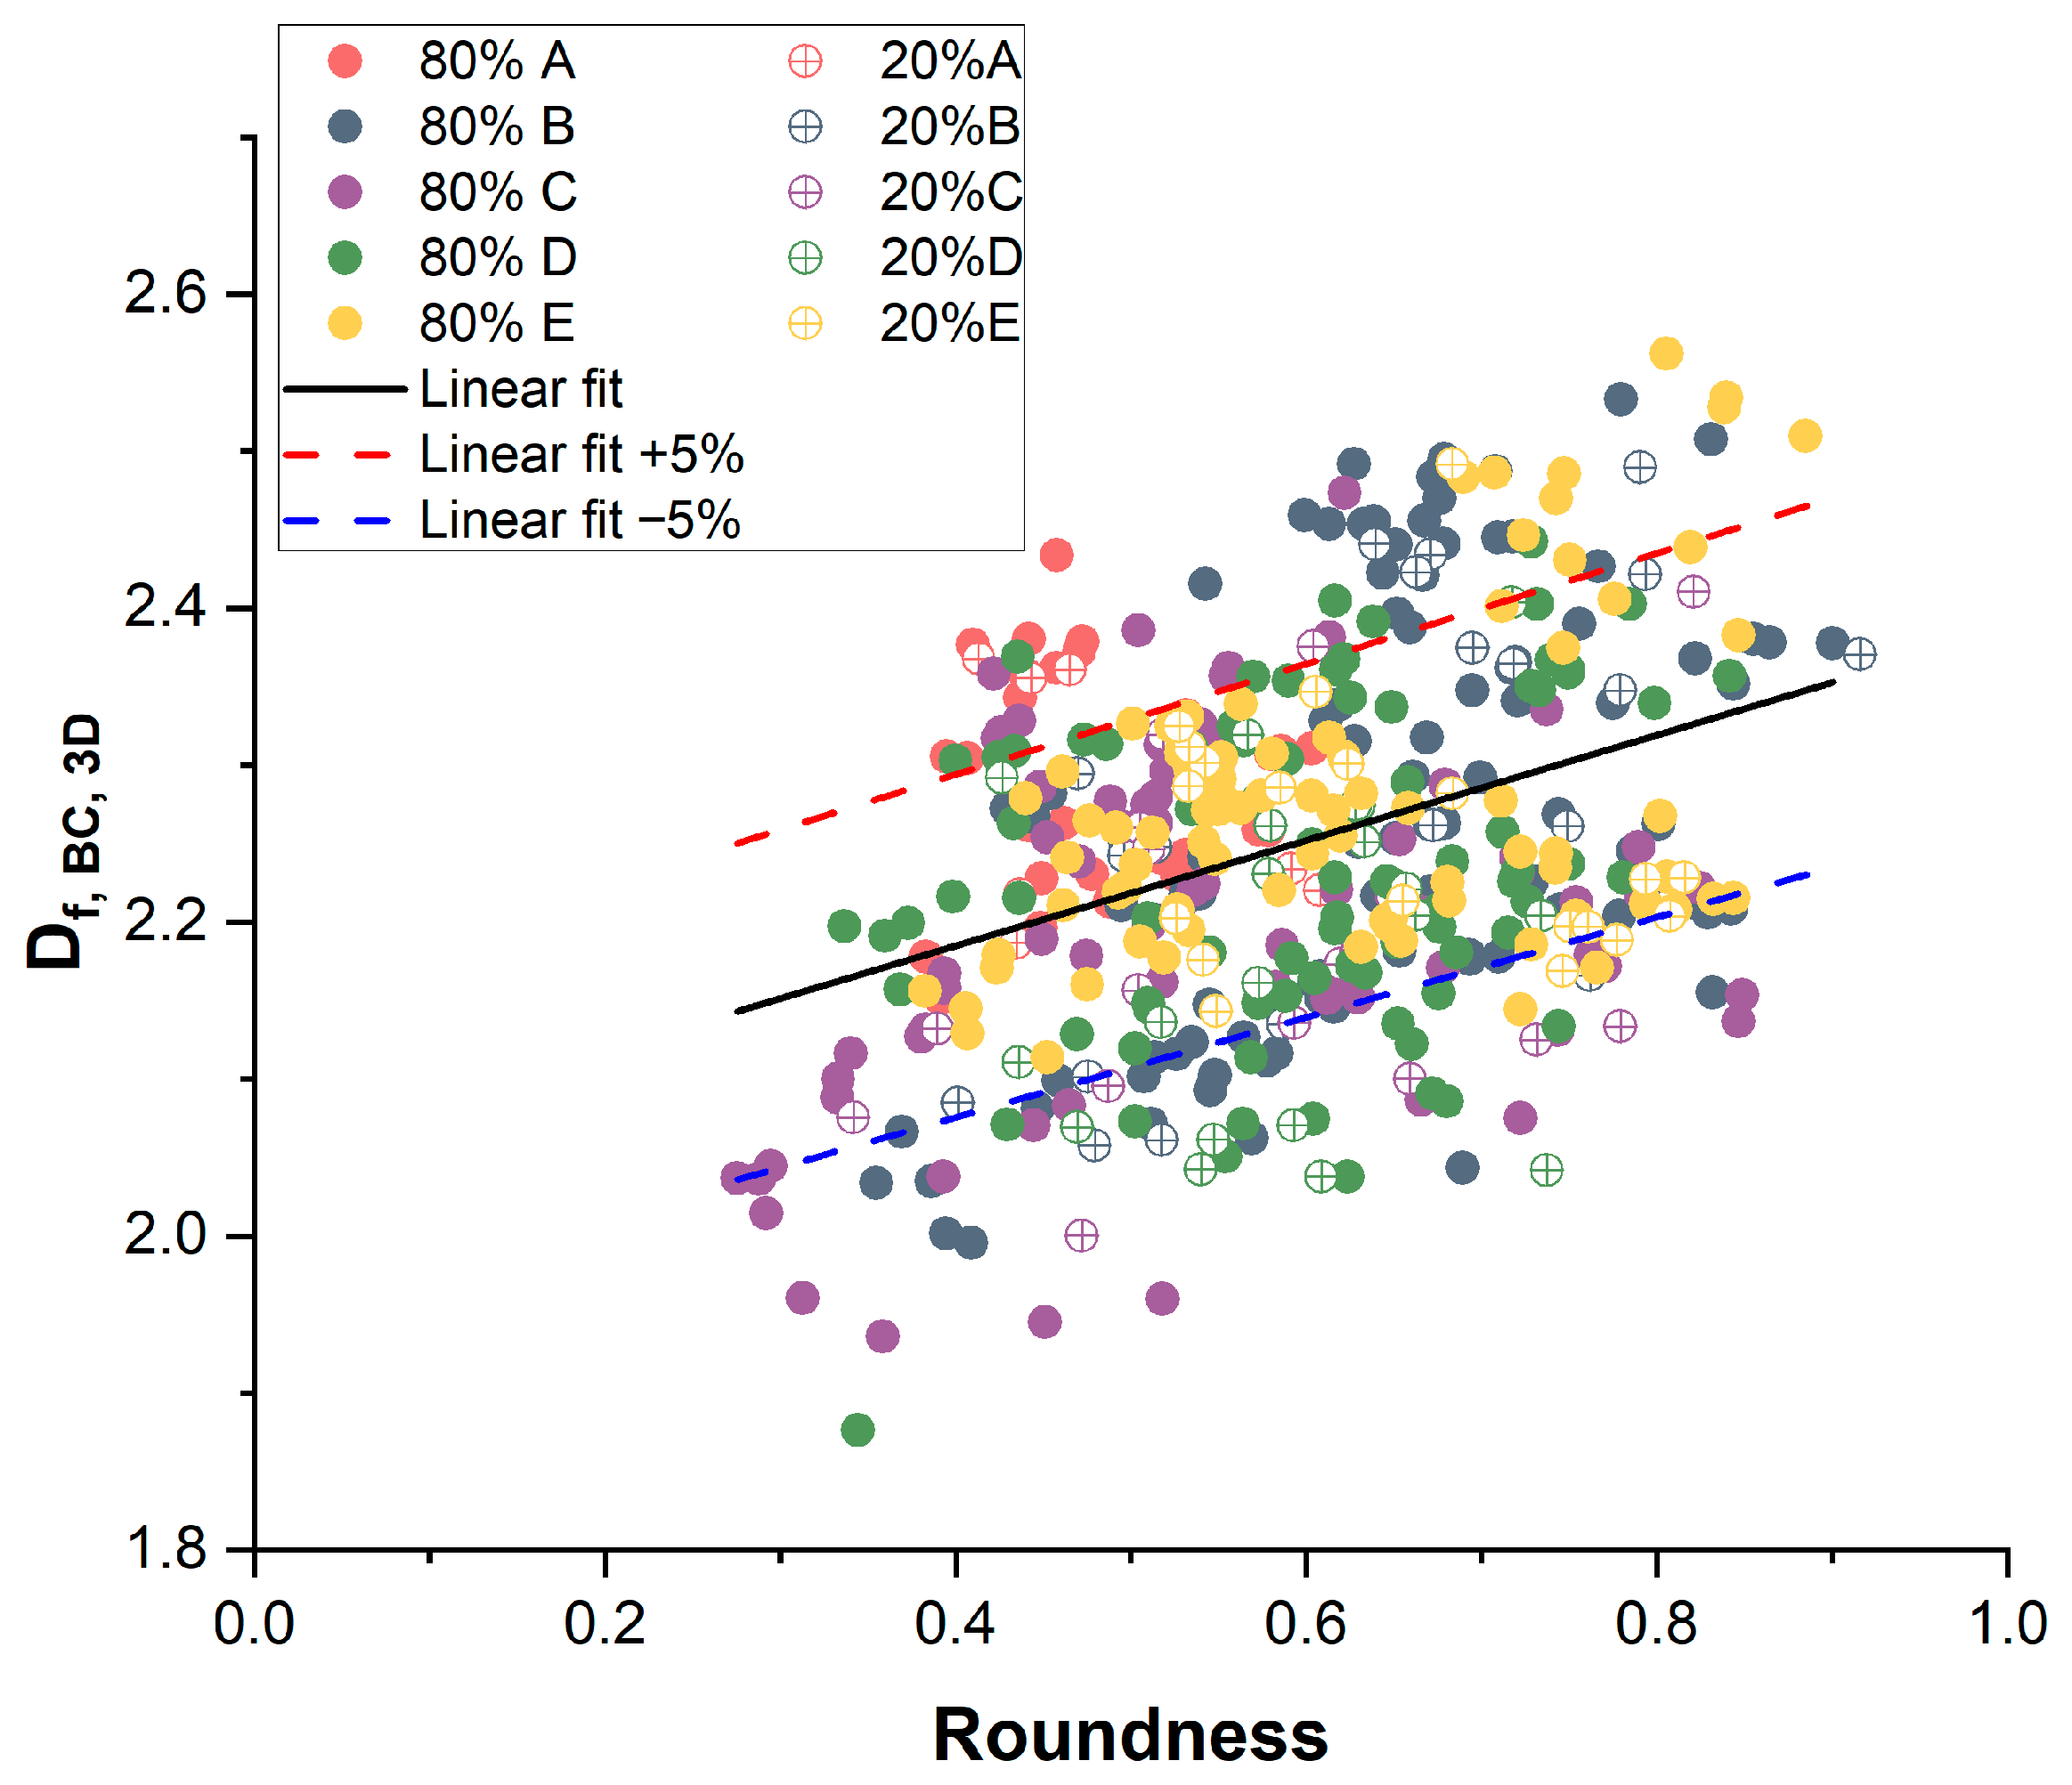
3.1. Correlating Agglomerate Roundness R to 3D Fractal Dimension Using Offline Data

To determine the correlation between the roundness R of an agglomerate and its fractal dimension using high-detail XCT measurements, after image acquisition, the image brightness was adjusted and measurement noise removed in a pre-processing step. This was followed by a binarization of the image data, using Otsu’s method for automated threshold determination [2], and the inversion of the high and low level of brightness. After this procedure, the background is represented in black and the agglomerate in white (Figure 3).
For a given image, the roundness R of an individual agglomerate is computed as
R = 4 A π x m a x 2
where A is the projected area of the agglomerate (obtained by counting the number of white pixels), and xmax corresponds to the maximum cord length within the agglomerate. The selection of R as a shape factor was motivated by earlier work by Arasan et al. [20]. Other measures, e.g., circularity, were tried as well but showed insufficient sensitivity to the observed results, as is briefly presented in Appendix A.
As an intermediate step, for each image, the two-dimensional (2D) fractal dimension Df,BC,2D was obtained via box counting, an iterative process, as described in [21]. Herein, smaller and smaller boxes are overlayed on top of the outline of the agglomerate. The number of boxes from one iteration to the next, together with the degree of coverage, converges to the 2D fractal dimension.
The typical evaluation times for roundness R and 2D fractal dimension by box counting are 5 ms and 200 ms (averages per agglomerate), respectively. The large ratio for evaluation time underlines the advantage in assessing fractal properties indirectly via a geometric shape factor.
Based on the 2D fractal dimension Df,BC,2D, the 3D fractal dimension of spray agglomerates can be determined as follows [22]:
D f , B C ,   3 D   = 0.8118   D f , B C , 2 D 1.8054
where the 3D fractal dimension of a spray agglomerate Df,BC,3D corresponds to the 3D fractal dimension as obtained by 3D box counting. Further information that can be inferred from the value of Df,BC,3D includes, e.g., the number of primary particles Np in the agglomerate and the agglomerate porosity [22].
To establish the correlation between Df,3D as obtained from 2D box counting and correlation Equation (2) and the individual data on roundness R for the same image, the whole data set was divided into a training and a validation set with 80% of the data points (R, Df,BC,3D) randomly assigned to the training data set and the remaining 20% to the validation data set.
Figure 4 shows data points (training, full symbols; validation, open symbols) for the spray agglomerates produced under different conditions (A–E). At least 30 agglomerate projections per experimental condition were used in the training data (minimum, 32 (A); maximum, 94 (B)). Using the training data, individual linear least squares fitting was performed to obtain the linear regression line, establishing correlations of the type Df,BC,3D = α R + β, where slope α and intercept β are linked to the experimental conditions. The individual expressions, together with the individual sum of squares (SSE, normalized with respect to the total number of samples), are collected in Table 2 (columns 2 and 3).
Observing the regression lines, a clear positive correlation of roundness R with 3D fractal dimension is observed, with the exception of Experiment A, where the correlation is almost constant, i.e., independent of the agglomerate roundness. The comparison of the normalized sum of squared error (training data, 80%) with the normalized sum of squared error of the validation data (20%, Table 2, column 4) shows very good agreement; i.e., no over- or underfitting of the data occurs.
By this step-wise approach, the shape factor roundness (R) is linked to the 3D fractal dimension Df,BC,3D. The streamlining of the different expressions was explored in two ways: (1) the correlation of slope and intercept to the main process parameters, the gas inlet temperature and binder weight fraction; (2) combining all data into one data set and determining one correlation for all experimental conditions at once, i.e., irrespective of the experimental conditions.
Strategy 1 lead to a correlation Df,BC,3D = α R + β, where
α T g a s , i n , w = 0.9606 + 0.0125 T g a s , i n + 0.0283 w
β T g a s , i n , w = 3.1037 0.011 T g a s , i n 0.072 w
where Tgas,in [°C] represents the gas inlet temperature, and w represents the binder weight fraction [%]. These expressions were obtained by the linear least squares fitting of all slopes and intercepts of the experiments with the gas inlet temperature and binder weight fraction. The normalized sums of squared errors (Table 2, column 5, utilizing Equations (3) and (4)) are very close to the results of the individual correlations; i.e., by fitting the slopes and intercepts to the process parameters, no serious decrease in fit quality occurs.
Strategy 2 lead to the following expression:
D f ,   B C , 3 D   = 0.3356   R + 2.051
The results for all data points are presented in Figure 5, together with validation data. The general trend observed in Figure 3 is also seen here; however, closer inspection shows that particular experimental results are not well represented, e.g., Experiments A and D, where the majority of data points are located far from the regression line (outside of the 5-tube). This is also evidenced by the respective normalized sum of squared errors (Table 2, column 6, utilizing Equation (5)) compared to the values for the individual correlations.
For this reason, we also used a more complex correlation, taking into account the process parameters explicitly, i.e., Df,BC,3D = α R + β with slope and intercept given by Equation (3) and Equation (4), respectively.
This correlation, the main result of this contribution, allows for the fast online estimation of 3D fractal dimension. In addition to the evaluation time for roundness (5 ms on average per agglomerate), as only two simple algebraic operation are performed in addition to obtain the 3D fractal dimension of the spray agglomerates, the evaluation time for both R and Df,BC,3D combined is still about 5 ms on average.

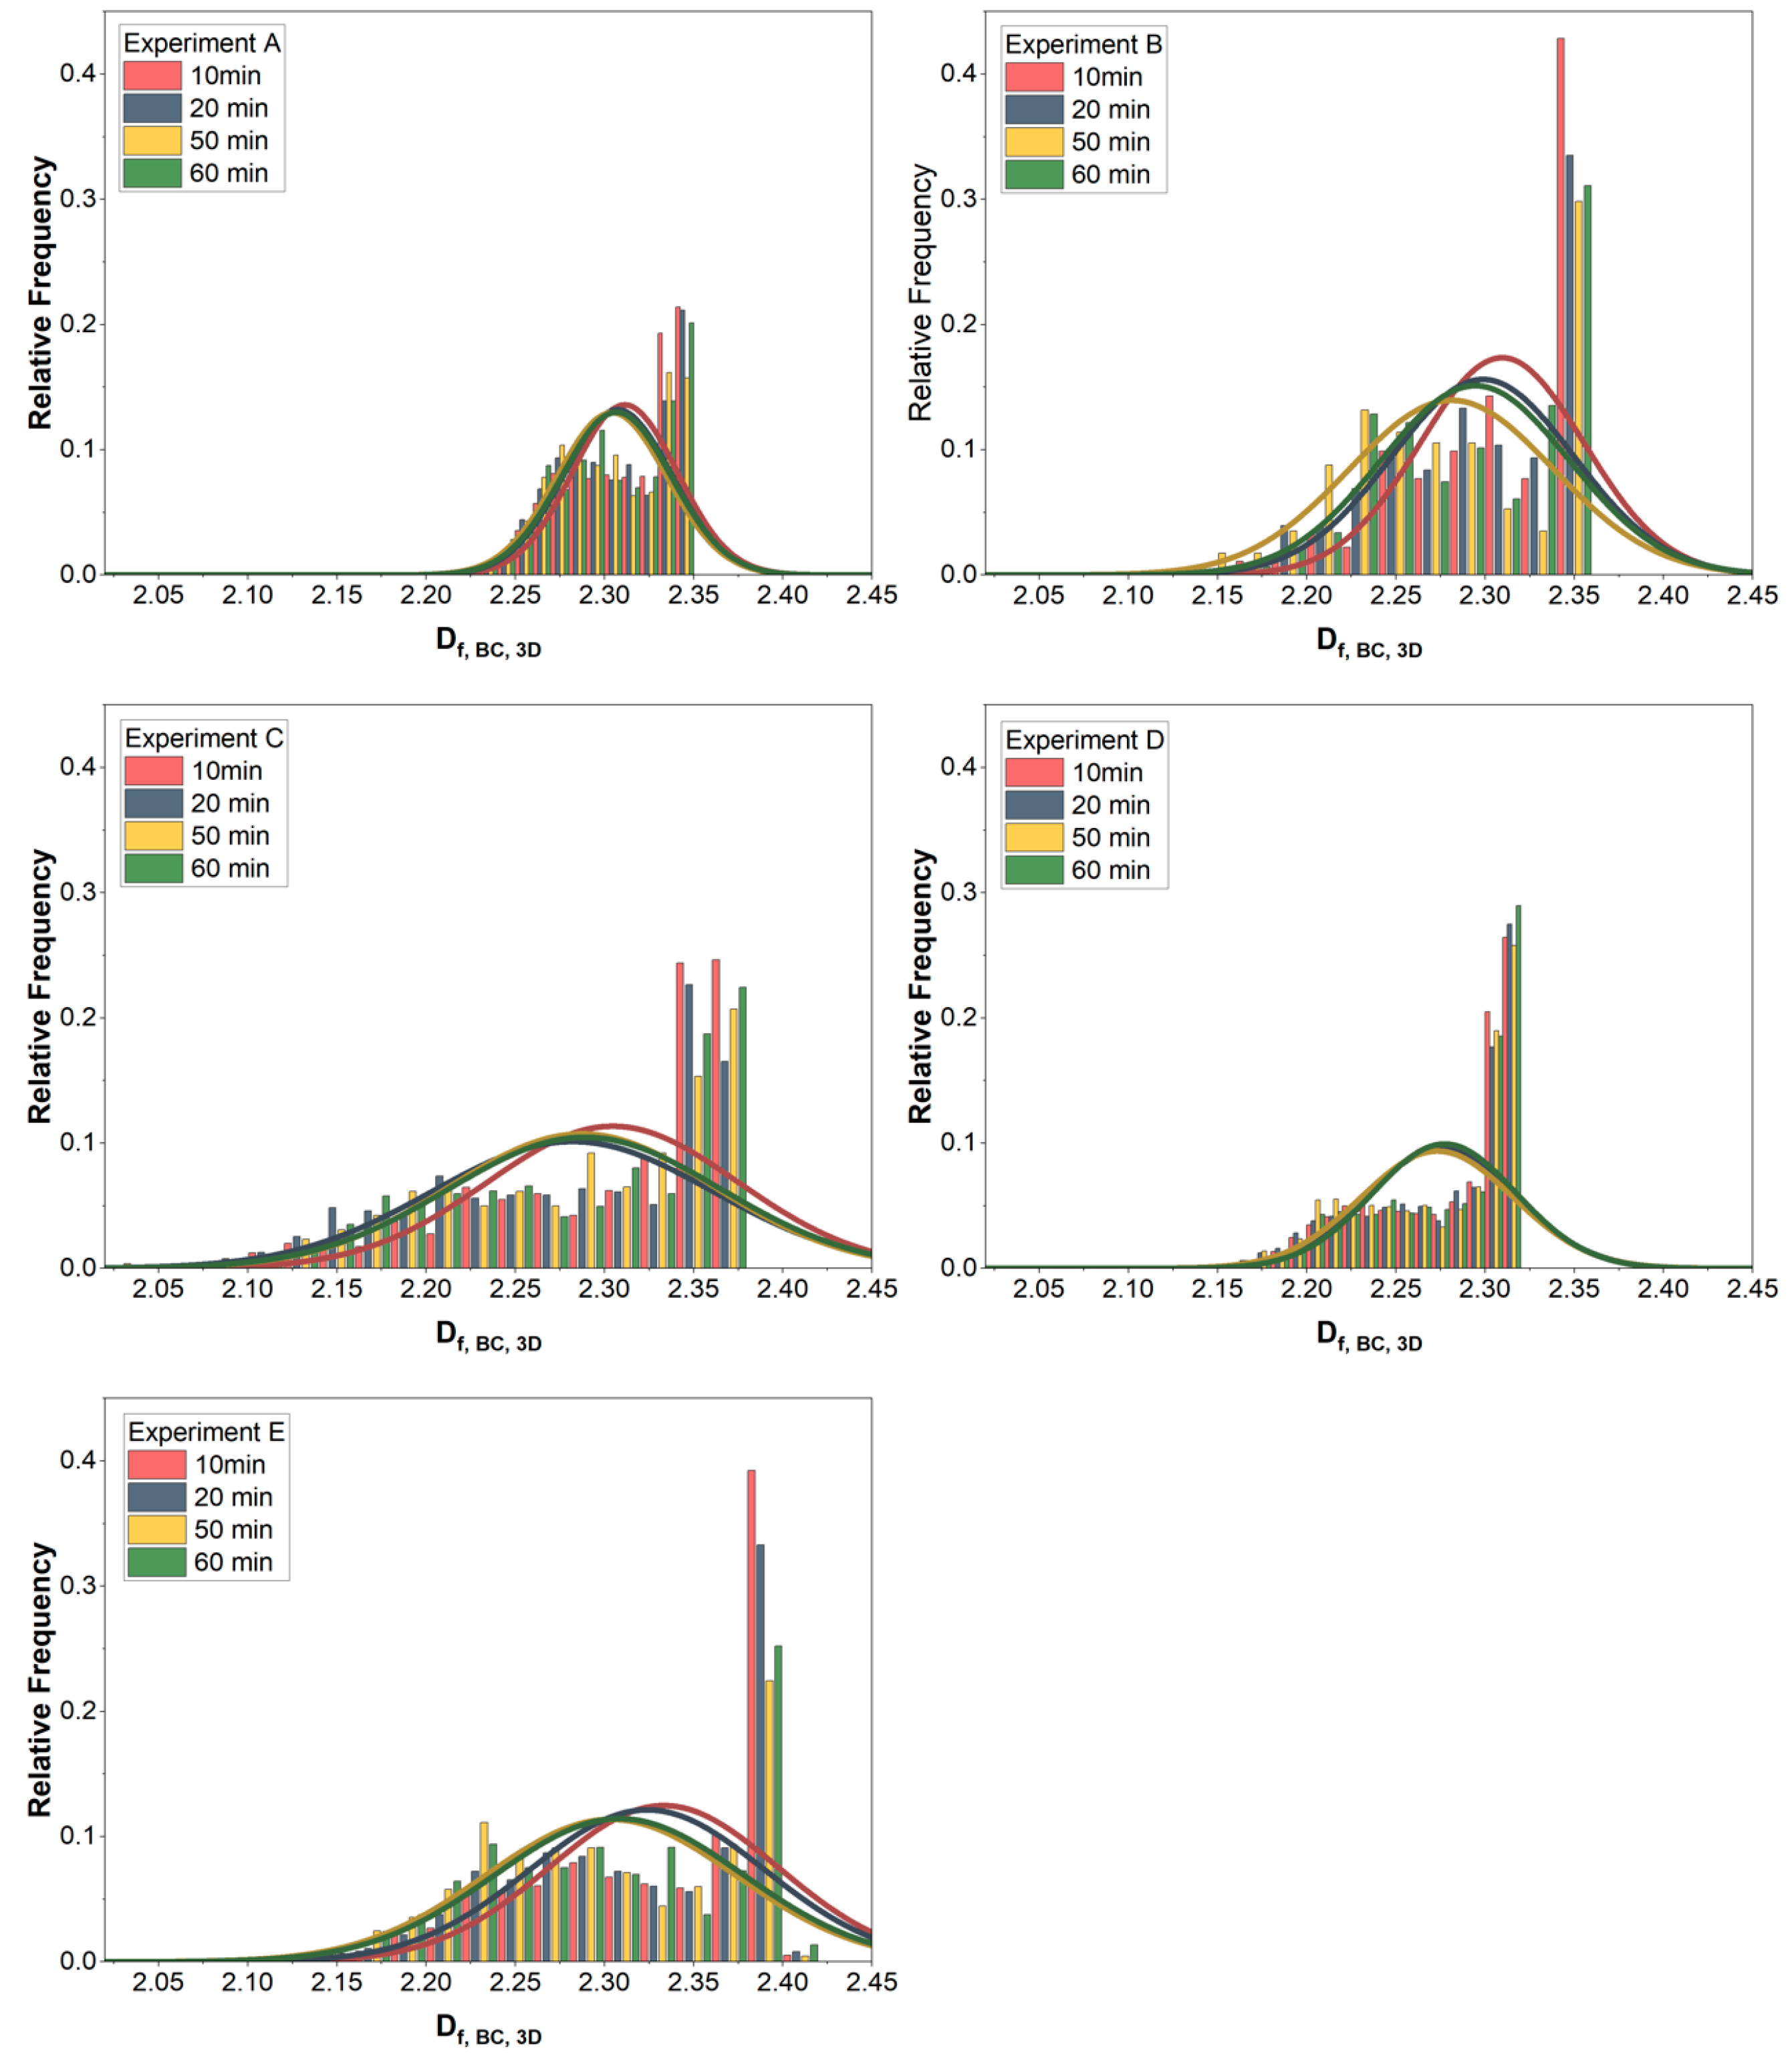
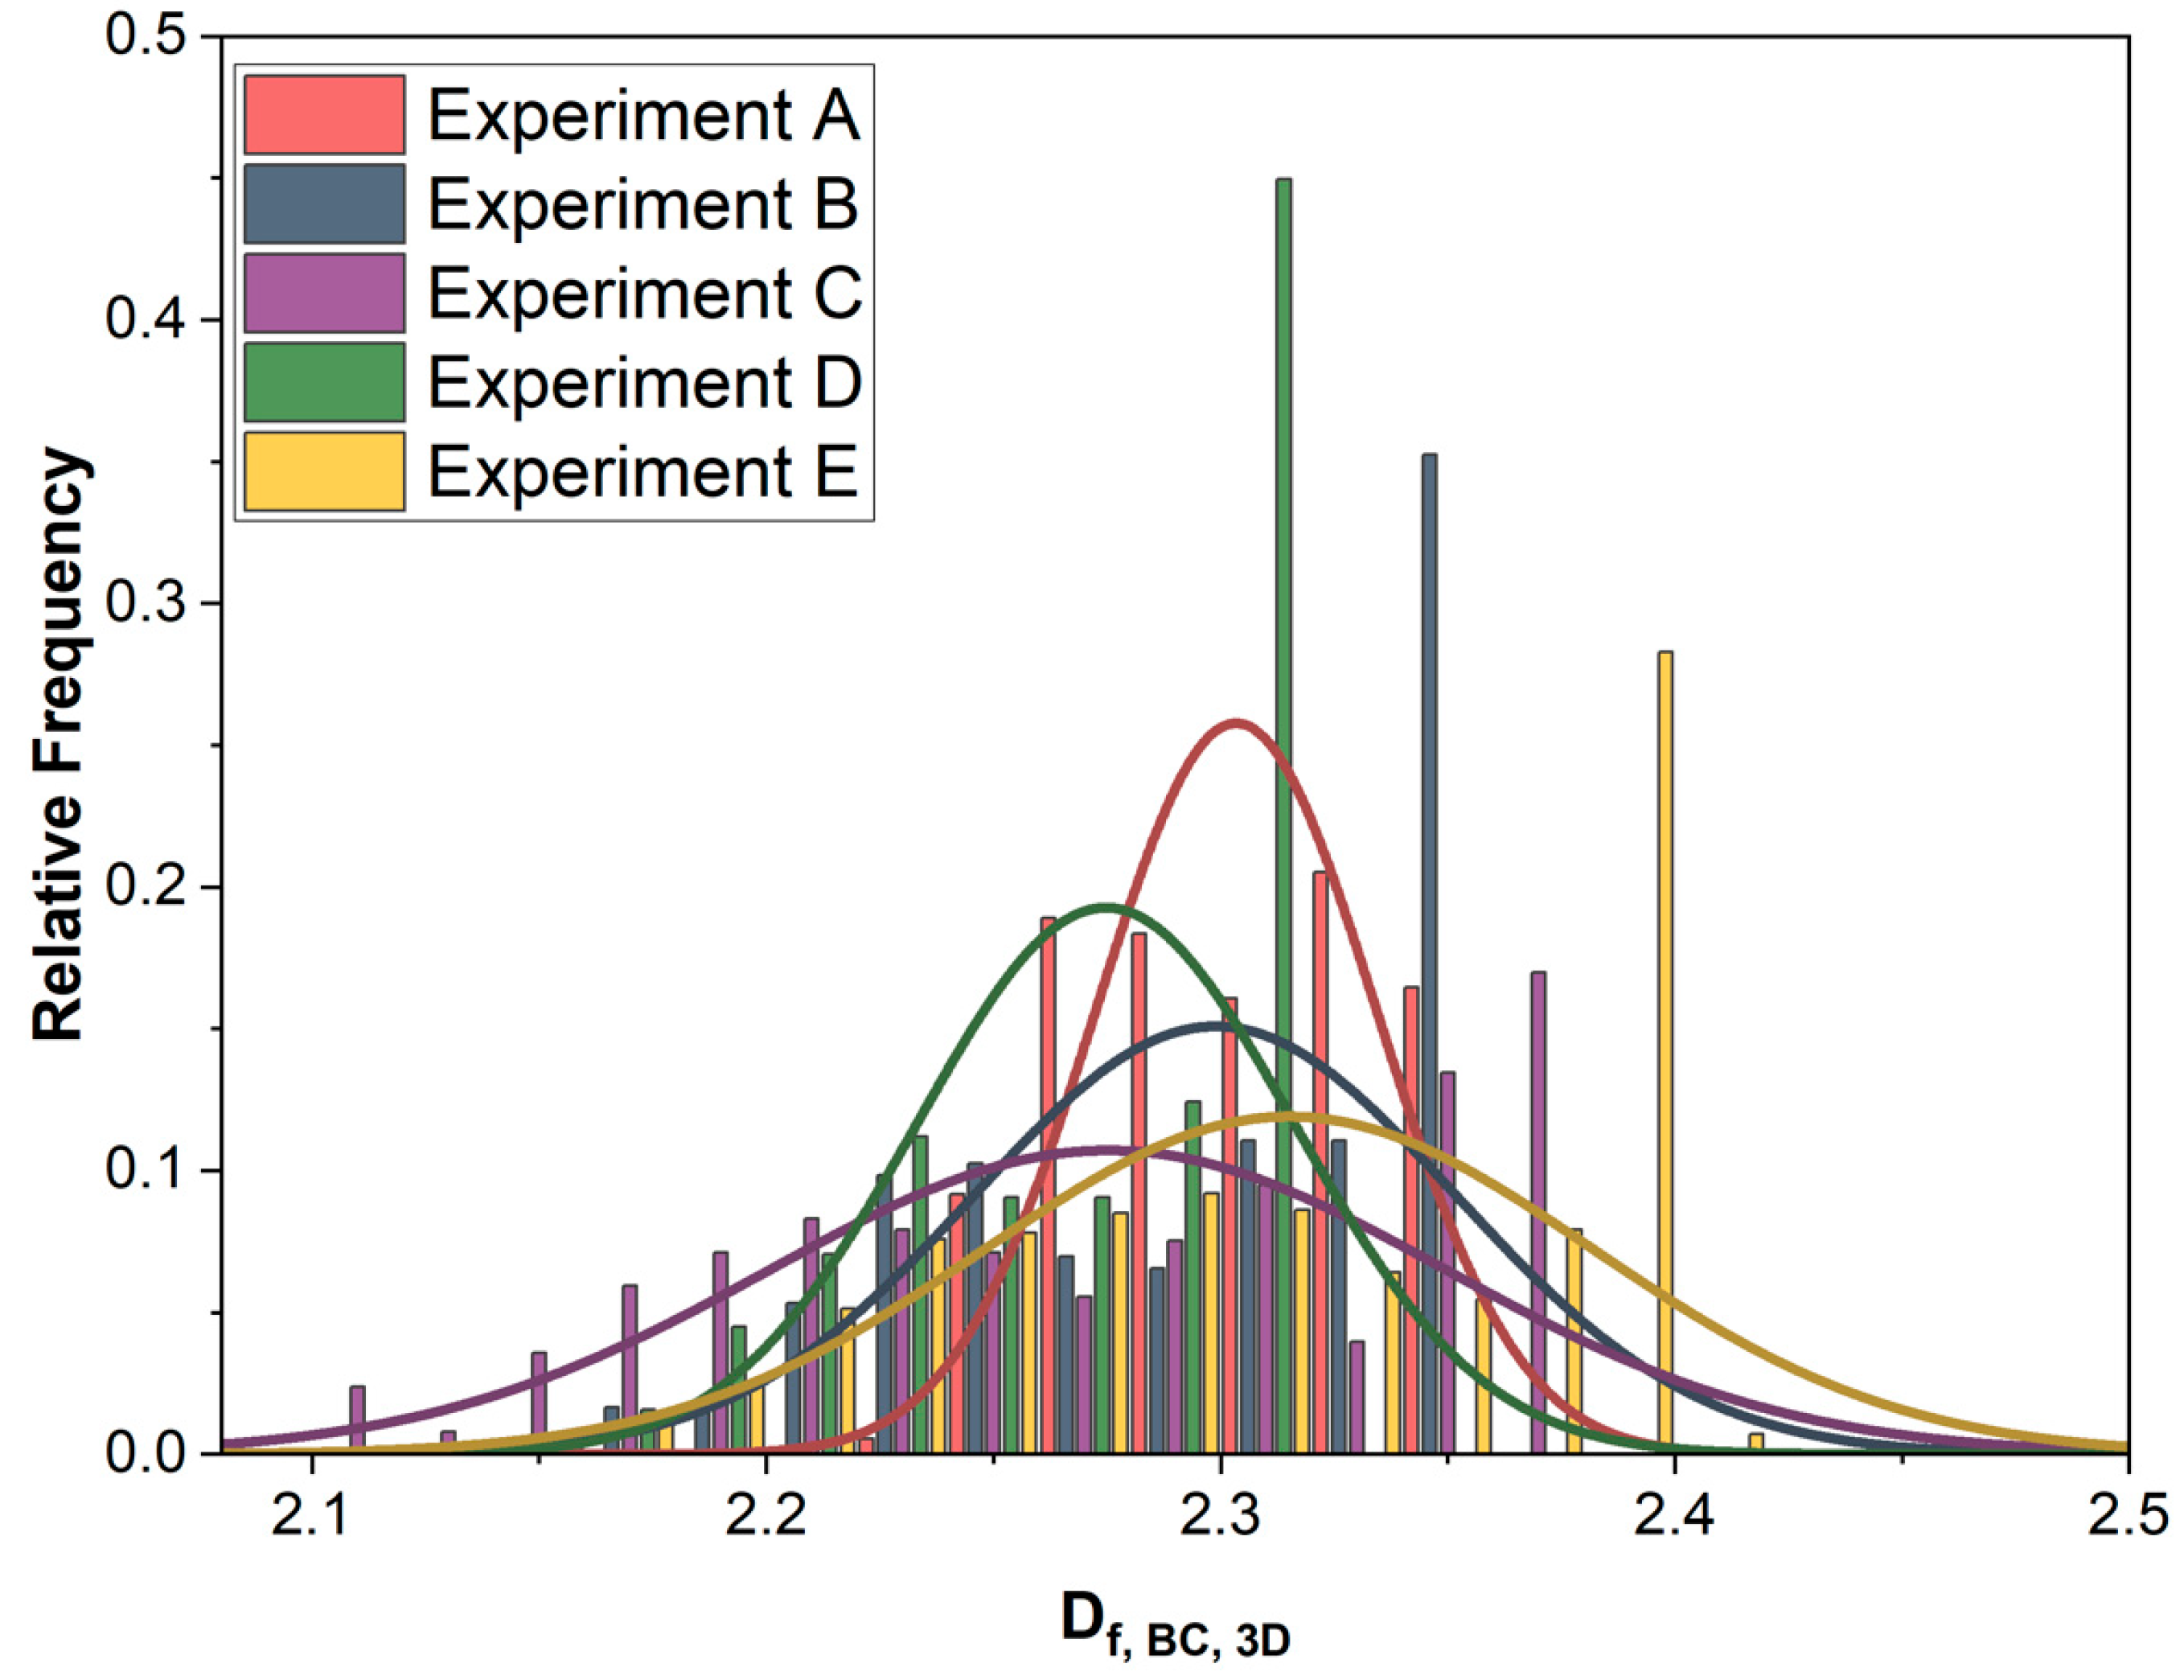
3.2. Fractal Dimension Formation Dynamics and 3D Fractal Dimension Distribution from Online Data

In the following subsection, some insights into the distribution of the 3D fractal dimension and its temporal evolution under the process conditions reported in Table 1 are presented.
Figure 6 presents the normalized number distribution of the 3D fractal dimensions of the spray agglomerates for different time points (after 10 min, 20 min, 50 min, and 60 min, sampled as described in Section 2.3). Per sampling time point, on average, in Experiment A, 766 objects were evaluated; in Experiment B, 160 objects were evaluated; in Experiment C, 359 objects were evaluated; in Experiment D, 1037 objects were evaluated; and in Experiment E, 591 objects were evaluated. These objects comprise agglomerates and primary particles; i.e., their number depends on the agglomeration kinetics. Figure 5 also shows superimposed normal distributions with the same mean and standard deviation as the sampling distributions.
In Experiment A, the values of fractal dimension ranged from about 2.2 to 2.35. The distribution of values within this interval was non-normal and multi-modal. Local modes formed close to 2.25 and 2.35. With respect to temporal evolution, a small decrease in the relative frequency of larger fractal dimensions was observed, compensated by an increase in relative frequency toward the lower-range values. This corresponds to the experience that initially, the total sample is still dominated by the primary particles that are very spherical (i.e., a high value of fractal dimension). With a decreasing number of primary particles, more complex (i.e., fractal) structures are formed. After about 20 min, the distribution of fractal dimension stabilizes within the process; i.e., a dynamic equilibrium between the attachment and detachment of additional primary particles and smaller clusters to agglomerates is achieved.
The normalized distributions of the 3D fractal dimension of spray agglomerates formulated in Experiments B and C show similar qualitative and quantitative behavior. In both cases, multi-modal, non-normal distribution arise. However, compared to Experiment A, the ranges of Df,BC,3D values widened significantly, to 2.15–2.35 and 2.05–2.37 in Experiments B and C, respectively. In Experiment B, the formation dynamics was also seen more clearly, especially in the decrease in relative frequency at the upper range of Df,BC,3D values (about 2.35). In Experiments A and C, after about 20 min, no significant change in the mean and standard deviation of the distributions was observed; i.e., a steady state (dynamic equilibrium) of agglomerate formation and breakage was achieved.
Under the conditions of Experiment D, the range of Df,BC,3D values contracted to 2.15–2.32 compared to Experiments A–C, whereas it expanded in Experiment E to a range of 2.10–2.42. Qualitatively, the distributions did not change significantly compared to Experiments A–C. In addition, in Experiment D, dynamic equilibrium was achieved on the same time scale as in Experiments A–C. In Experiment E, dynamic equilibrium was achieved only after about 50 min. All ranges are in accordance with the fractal dimensions of fluidized bed spray agglomerates reported in [2] and [11].
The different dynamic behavior is a consequence of the thermal conditions. The thermal conditions (the gas inlet temperature and binder content in the spray) influence the probability of successfully wetting a primary particle with the binder and of the successful incorporation of a primary particle into a larger structure. Furthermore, the mechanical strength of the solidified bridges between neighboring particles in an agglomerate differs due to the thermal condition during solidification, resulting in different breakage behavior in the agglomerate due to fluid shear force and collision forces (agglomerate–agglomerate or agglomerate–apparatus collisions).
In terms of the generalization of the findings of this work, the speed of agglomeration is a decisive factor. As long as the data acquisition system is capable of obtaining image information at a sufficiently high rate, the formation and structure evolution can be assessed. If the formation kinetics is too fast, i.e., information becomes only available with significant time lag, then the improvement of the measurement equipment (high-speed camera system) is necessary. In terms of the inferential model, a re-fitting procedure needs to be implemented that incorporates additional offline information to extend the applicability of the correlation when in operation.
The effect of thermal conditions on the formation of agglomerates with different distributions of Df,BC,3D are highlighted by the results in Figure 7. It presents the normalized relative frequency of the 3D fractal dimension of agglomerates taken after 120 min, i.e., after dynamic equilibrium had been established and maintained in all experiments. Although qualitatively similar, the distributions of 3D fractal dimension differ significantly in range, average, and standard deviation. The broadest distribution is achieved under the conditions of Experiment C, and the narrowest distribution is achieved under conditions of Experiment A (an increase in temperature while the binder weight fraction remains constant). With an increase in binder weight fraction at constant temperature (from Experiment D to B to E), a shift in average value toward higher values is observed; simultaneously, an increase in standard deviation occurs. A higher binder weight fraction increases the probability of the successful incorporation of primary particles and smaller clusters into larger structures, as well as increasing the strength of individual solid bridges between primary particles. These trends are also in line with previous results presented on general formation mechanisms [19,23].

4. Conclusions and Outlook

In this work, the development and implementation of a model-based inference procedure for the fast online assessment of the 3D fractal dimension of agglomerates formulated in spray fluidized beds are presented. The inference was established by combining information obtained from highly detailed offline tomographic measurements with an easy-to-obtain 2D geometric shape factor, with models correlating 2D information to the 3D fractal dimension.
The conclusions are as follows:
  • By sensitivity analysis, the geometric shape factor of the roundness of the single agglomerate was identified as the most suitable proxy variable for inferential correlation to the 3D fractal dimension of a single agglomerate.
  • Inferential evaluation can be performed at about 5 ms per agglomerate on average, about one order of magnitude faster than by box-counting (200 ms on average) due to the avoidance of an iterative process.
  • Compared to other evaluation techniques, e.g., tomography- or electron-microscopy-based techniques [24,25,26], large numbers of agglomerates can be characterized, even fulfilling hard real-time constraints, such as those required in process monitoring and control schemes.
  • Evaluating online measurement data, new insights into the dynamics of the structure formation of spray agglomerated materials were obtained, especially with respect to the evolution of the property distribution (multi-modal and non-normal). This general information can be used for the rational design of agglomerated products and optimized process operation [27,28,29].
Future work will concentrate on the iterative learning of the correlation coefficients to extend in operation the range of applicability. One approach will be to connect the sensor model to a global database combining online and offline agglomerate information and periodically update the sensor model with new information. Furthermore, the full integration of the inference scheme into a model-based control scheme should be pursued.

Author Contributions

Conceptualization, A.B. and E.T.; methodology, A.A., J.M. and A.B.; software, J.M. and A.B.; validation, A.A., J.M., E.T., and A.B.; formal analysis, E.T. and A.B.; investigation, A.A. and J.M.; resources, E.T. and A.B.; data curation, A.A. and J.M.; writing—original draft preparation, J.M.; writing—review and editing, E.T. and A.B.; visualization, J.M. and A.B.; supervision, A.B.; project administration, E.T. and A.B.; funding acquisition, E.T. and A.B. All authors have read and agreed to the published version of the manuscript.

Funding

The authors gratefully acknowledge the funding of this work by Deutsche Forschungsgemeinschaft (DFG) as part of the priority program “Autonomous Particle Processes” (PP 2364) under grant 504524147. Open Access publishing was made available by funds provided by Otto-von-Guericke University Magdeburg.

Data Availability Statement

The original data presented in the study are openly available via Zenodo repository at https://doi.org/10.5281/zenodo.15675353.

Conflicts of Interest

The authors declare no conflicts of interest. The funders had no role in the design of the study; in the collection, analyses, or interpretation of data; in the writing of the manuscript; or in the decision to publish the results.

Appendix A

The selection of object roundness R as an independent variable in the correlation of the 3D fractal dimension of spray agglomerates. The initial impetus was provided by previous work [20], but the usefulness of this geometric shape factor was investigated independently.
Given the images (either offline from XCT or online using a high-speed camera), after object detection, different geometric shape factors were evaluated. For definition and the evaluation of the individual factors, we referred to [6,30].
Evaluation was performed by principal component analysis (PCA), a standard technique to investigate the correlation between variables. Figure A1 presents the results regarding the strength of the correlation between individual geometric factors and with the fractal dimension in particular (the first row of the graph). It can be seen that roundness, aspect ratio, and compactness have a similar strength in magnitude, with aspect ratio showing a negative direction. All other shape factors show significantly lower values. Further inspection shows that compactness and roundness have an almost equal strength. As roundness is easier to determine than compactness, roundness was used as the key variable in the correlation.
Figure A1. Correlation matrix between different geometric factors of an object with a fractal dimension. Values denote the strength of correlation (as evaluated by principal component analysis); see the color bar.
Processes 13 02316 g0a1

References

  1. Palzer, S. Agglomeration of pharmaceutical, detergent, chemical and food powders—Similarities of materials and processes. Powder Technol. 2011, 206, 2–17. [Google Scholar] [CrossRef]
  2. Dadkhah, M.; Peglow, M.; Tsotsas, E. Characterization of the internal morphology of agglomerates produced in a spray fluidized bed by X-ray tomography. Powder Technol. 2012, 228, 349–358. [Google Scholar] [CrossRef]
  3. Gao, S.; Li, Q.; Luo, J. Fractal characteristic of recycled aggregate and its influence on physical property of recycled aggregate concrete. Rev. Adv. Mater. Sci. 2021, 60, 663–677. [Google Scholar] [CrossRef]
  4. Elhmali, H.T.; Serpa, C.; Radojevic, V.; Stajcic, A.; Petrovic, M.; Jankovic-Castvan, I.; Stajcic, I. Correlation between agglomerates Hausdorff dimension and mechanical properties of denture poly(methyl methacrylate)-based composites. Fractal Fract. 2024, 8, 314. [Google Scholar] [CrossRef]
  5. Bahramian, A. The mutual effects between the interparticle forces and mechanical properties on fluidization of TiO2 nanoparticle agglomerates in a conical fluidized bed: Nanoindentation and pressure fluctuation analysis. J. Nanoparticle Res. 2019, 21, 196. [Google Scholar] [CrossRef]
  6. Khadilkar, A.B.; Rozelle, P.L.; Pisupati, S.V. Investigation of fluidized bed agglomerate growth process using simulations and SEM-EDX characterization of laboratory-generated agglomerates. Chem. Eng. Sci. 2018, 184, 172–185. [Google Scholar] [CrossRef]
  7. Furuvik, N.C.I.S.; Wang, L.; Jaiswal, R.; Thapa, R.; Eikeland, M.S.; Moldestad, B.M.E. Experimental study and SEM-EDS analysis of agglomerates from gasification of biomass in fluidized beds. Energy 2022, 252, 124034. [Google Scholar] [CrossRef]
  8. De Temmerman, P.-J.; Van Doren, E.; Verleysen, E.; Van der Stede, Y.; Abi Daoud Francisco, M.; Mast, J. Quantitative characterization of agglomerates and aggregates of pyrogenic and precipitated amorphous silica nanomaterials by transmission electron microscopy. J. Nanobiotechnol. 2012, 10, 24. [Google Scholar] [CrossRef] [PubMed]
  9. LaRocca, A.; Bonatesta, F.; Fay, M.W.; Campanella, F. Characterization of soot in oil from a gasoline direct injection engine using Transmission Electron Microscopy. Tribol. Int. 2015, 86, 77–84. [Google Scholar] [CrossRef]
  10. Farber, L.; Tardos, G.; Michaels, J.N. Use of X-ray tomography to study the porosity and morphology of granules. Powder Technol. 2003, 132, 57–63. [Google Scholar] [CrossRef]
  11. Pashminehazar, R.; Kharaghani, A.; Tsotsas, E. Three dimensional characterization of morphology and internal structure of soft material agglomerates produced in spray fluidized bed by X-ray tomography. Powder Technol. 2016, 300, 46–60. [Google Scholar] [CrossRef]
  12. Campello, S.L.; dos Santos, W.P.; Machado, V.F.; Mota, V.F.; Gomes, A.S.L.; de Souza, R.E. Micro-structural information of porous materials by optical coherence tomography. Microporous Mesoporous Mat. 2014, 198, 50–54. [Google Scholar] [CrossRef]
  13. Dong, Y.; Lin, H.; Abolghasemi, V.; Gan, L.; Zeitler, J.A.; Shen, Y.-C. Investigating intra-tablet coating uniformity with spectral-domain Optical Coherence Tomography. J. Pharm. Sci. 2017, 106, 546–553. [Google Scholar] [CrossRef] [PubMed]
  14. Koukoulas, T.; Broughton, W.R.; Williams, J.; Rahatekar, S. Optical characterisation of polymeric nanocomposites using tomographic, spectroscopic and Fraunhofer wavefront assessment. Proc. Opt. Syst. Des. 2012, 8550, 855039. [Google Scholar]
  15. Windows-Yule, C.R.K.; Buist, K.A.; Taghizadeh, K.; Finotello, G.; Nicusan, A.L. A multidisciplinary perspective on the present and future of particle imaging. Particuology 2025, 101, 3–17. [Google Scholar] [CrossRef]
  16. Silva, A.F.T.; Burggraeve, A.; Denon, Q.; Van der Meeren, P.; Sandler, N.; Van Den Kerkhof, T.; Hellings, M.; Vervaet, C.; Remon, J.P.; Almeida Lopes, J.; et al. Particle sizing measurements in pharmaceutical applications: Comparison of in-process methods versus off-line methods. Eur. J. Pharm. Biopharm. 2013, 85, 1006–1018. [Google Scholar] [CrossRef] [PubMed]
  17. Naidu, V.R.; Deshpande, R.S.; Syed, M.R.; Wakte, P.S. Real-time imaging as an emerging process analytical technology tool for monitoring of fluid bed coating process. Pharm. Dev. Technol. 2017, 23, 596–601. [Google Scholar] [CrossRef] [PubMed]
  18. Otto, E.; Dürr, R.; Kienle, A. Stability of combined continuous granulation and agglomeration processes in a fluidized bed with sieve-mill-recycle. Processes 2023, 11, 473. [Google Scholar] [CrossRef]
  19. Ajalova, A.; Ma, W.; Hoffmann, T.; Tsotsas, E. Continuous spray fluidized bed agglomeration: Influence of gas inlet temperature and binder content on growth and morphology. Powder Technol. 2025, 464, 121260. [Google Scholar] [CrossRef]
  20. Arasan, S.; Akbulut, S.; Hasiloglu, A.S. The relationship between the fractal dimension and shape properties of particles. KSCE J. Civil Eng. 2011, 15, 1219–1225. [Google Scholar] [CrossRef]
  21. Walsh, J.J.; Watterson, J. Fractal analysis of fracture patterns using the standard box-counting technique: Valid and invalid methodologies. J. Struct. Geol. 1993, 15, 1509–1512. [Google Scholar] [CrossRef]
  22. Wang, R.; Singh, A.K.; Kolan, S.R.; Tsotsas, E. Fractal analysis of aggregates: Correlation between the 2D and 3D box-counting fractal dimension and power law fractal dimension. Chaos Solitons Fractals 2022, 160, 112246. [Google Scholar] [CrossRef]
  23. Turchiuli, C.; Castillo-Castaneda, E. Agglomerates structure characterization using 3D-image reconstruction. Part. Part. Syst. Charact. 2009, 26, 25–33. [Google Scholar] [CrossRef]
  24. Groppe, P.; Reichstein, J.; Carl, S.; Cuadrado Collados, C.; Niebuur, B.-J.; Zhang, K.; Apeleo Zubiri, B.; Libuda, J.; Kraus, T.; Retzer, T.; et al. Catalyst supraparticles: Tuning the structure of spray-dried Pt/SiO2 supraparticles via salt-based colloidal manipulation to control their catalytic performance. Small 2024, 20, 2310813. [Google Scholar] [CrossRef] [PubMed]
  25. Mahr, C.; Stahl, J.; Gerken, B.; Krause, F.F.; Schowalter, M.; Grieb, T.; Mädler, L.; Rosenauer, A. Characterization of structure and mixing in nanoparticle hetero-aggregates using convolutional neural networks: 3D-reconstruction versus 2D-projection. Ultramicroscopy 2024, 265, 114020. [Google Scholar] [CrossRef] [PubMed]
  26. Markl, D.; Hannesschläger, G.; Sacher, S.; Leitner, M.; Khinast, J.G. Optical coherence tomography as a novel tool for in-line monitoring of a pharmaceutical film-coating process. Eur J Pharm Sci. 2014, 55, 58–67. [Google Scholar] [CrossRef] [PubMed]
  27. Koerfer, R.; Simutis, R. Advanced process control for fluidized bed agglomeration. Inform. Technol. Contr. 2008, 37, 285–293. [Google Scholar]
  28. Hogg, R. Agglomeration models for process design and control. Powder Technol. 1992, 69, 69–76. [Google Scholar] [CrossRef]
  29. Vesjolaja, L.; Glemmestad, B.; Lie, B. Double-Loop Control Structure for Rotary Drum Granulation Loop. Processes 2020, 8, 1423. [Google Scholar] [CrossRef]
  30. Barreirós, F.M.; Ferreira, J.M.; Figueiredo, M.M. Calculating shape factors from particle sizing data. Part. Part. Syst. Charact. 1996, 13, 368–373. [Google Scholar] [CrossRef]
Figure 1. General scheme of structure formation in spray agglomeration.
Processes 13 02316 g001
Figure 2. Flow chart showing the continuously operated fluidized bed agglomerator of Ajalova et al. [19]. (In the configuration under investigation here, the disintegrator loop was not operated. Also, feed material was only provided via “feed A”. The material for characterization was sampled from the fluidized bed chamber.).
Processes 13 02316 g002
Figure 3. Image processing procedure: (a) agglomerates after scanning in the µ-CT, (b) binarization.
Processes 13 02316 g003
Figure 4. Data points (R, Df,BC,3D) obtained in offline XCT measurement of spray fluidized bed agglomerated under different operating conditions (training data, full symbols; validation data, open symbols).
Processes 13 02316 g004
Figure 5. All data points (R, Df,BC,3D) obtained through the offline XCT measurement of spray fluidized bed agglomerated under different operating conditions (training data, full symbols; validation data, open symbols) together with one fitted correlation (solid line, Equation (5)) (Strategy 2). Due to a strong bias against certain experimental conditions, this strategy was not pursued further.
Processes 13 02316 g005
Figure 6. Evolution of the 3D fractal dimension of spray agglomerates inferred from online image data via the object roundness R and the correlation Df,BC,3D = α R + β with the slope and intercept given by Equation (3) and Equation (4), respectively. (For discussion, see the text.).
Processes 13 02316 g006
Figure 7. Normalized relative frequency of the 3D fractal dimension of spray agglomerates measured after 120 min. Under different thermal process conditions, different distributions in fractal dimension can be obtained, enabling product design in terms of agglomerate structure and morphology.
Processes 13 02316 g007
Table 1. Experimental parameters of spray fluidized bed agglomeration trials performed in [19]. For parameters kept constant across all experiments, see the text.
ParameterABCDE
Inlet gas temperature/°C80901009090
Binder weight fraction/w-%44426
Particle feed rate/g min−1145158182166155
Table 2. Individual correlations of 3D fractal dimension with object roundness and normalized residual errors of training and validation data with respect to individual correlations and derived correlations in Equations (3) and (4) and correlation in Equation (5).
Exp.Individual
Correlation
Normalized
Residual Sum of Squares
(80%)
Individual Correlations
Normalized
Residual Sum of Squares
(20%)
Individual Correlations
Normalized
Residual Sum of Squares
(20%)
Equations (3) and (4)
Normalized
Residual Sum of Squares
(20%)
Equation (5)
ADf, BC, 3D = −0.0251 R + 2.2990.00450.00540.00630.0116
BDf, BC, 3D = 0.557 R + 1.9090.01370.01270.01430.0136
CDf, BC, 3D = 0.2256 R + 2.0780.01160.01010.01020.0127
DDf, BC, 3D = 0.2664 R + 2.0720.010.01260.01230.0149
EDf, BC, 3D = 0.3796 R + 2.0430.00780.01080.01010.0091
Disclaimer/Publisher’s Note: The statements, opinions and data contained in all publications are solely those of the individual author(s) and contributor(s) and not of MDPI and/or the editor(s). MDPI and/or the editor(s) disclaim responsibility for any injury to people or property resulting from any ideas, methods, instructions or products referred to in the content.

