3.1. SB Characterization
After drying, milling, homogenizing, and quartering the SB, a representative sample was collected for characterization and analysis using TGA analysis for proximate analysis (
Table 3), Higher Calorific Value (HCV) and Lower Calorific Value (LCV) (
Table 4), granulometric analysis (MS—
Table 5 and
Figure 3), and ultimate analysis (CHNS/O) (
Table 6). For TGA analysis, 1.0199 g ± 0.0341 of SB was used in triplicate (
Table 3).
The moisture content of SB was 4.044%, which is well within the optimal range for its use, as it should be less than or equal to 10% to ensure proper process efficiency. Excessive moisture can hinder feed flow by causing material buildup in equipment, potentially leading to system overheating and increased energy consumption during processing.
Najafi et al. [
35] compared their findings with those of several studies available in the literature regarding the fixed carbon, volatile, and ash content of SB, encompassing a broad spectrum of published results. Based on this comparison, the study established the following ranges for these variables: 8.06–18.20% for fixed carbon [
35,
36], 60.00–88.93% for volatile content, and 1.00–27.70% for ash [
37,
38].
Usually, biomass is rich in volatile content and has lower ash and fixed carbon content [
34]. This holds for SB in this study, where the volatile and ash content fall within the reported ranges, averaging 75.240% and 4.292%, respectively. The fixed carbon content is slightly higher (19.640%), but its impact is minimal, as the volatile-to-fixed carbon ratio, commonly higher than 3.5 in the literature [
36], is observed in this study, with an average of 3.7. Additionally, the highly volatile content and low ash content favor a greater liquid yield, while the proportional relationship between ash and solid product formation suggests lower biochar production [
39]. Under these conditions, a higher rate of bio-oil formation is expected compared to biochar in SB fast pyrolysis.
The HCV data was generated with a sample moisture content of 4.044%, resulting in a db correction factor of 95.96%. LCV results were also generated (
Table 4). This analysis was done in duplicate. The results align with the published literature, with some comparative examples, including 16,050 kJ/kg [
40], 16,402 kJ/kg [
41], and 17,605 kJ/kg in this study. These values highlight the promising calorific potential of biomass, a key characteristic in fuel production. As the nature of the final products is directly influenced by the raw material, in this case, bagasse from energy cane, its high energy content reinforces its viability for sustainable fuel applications.
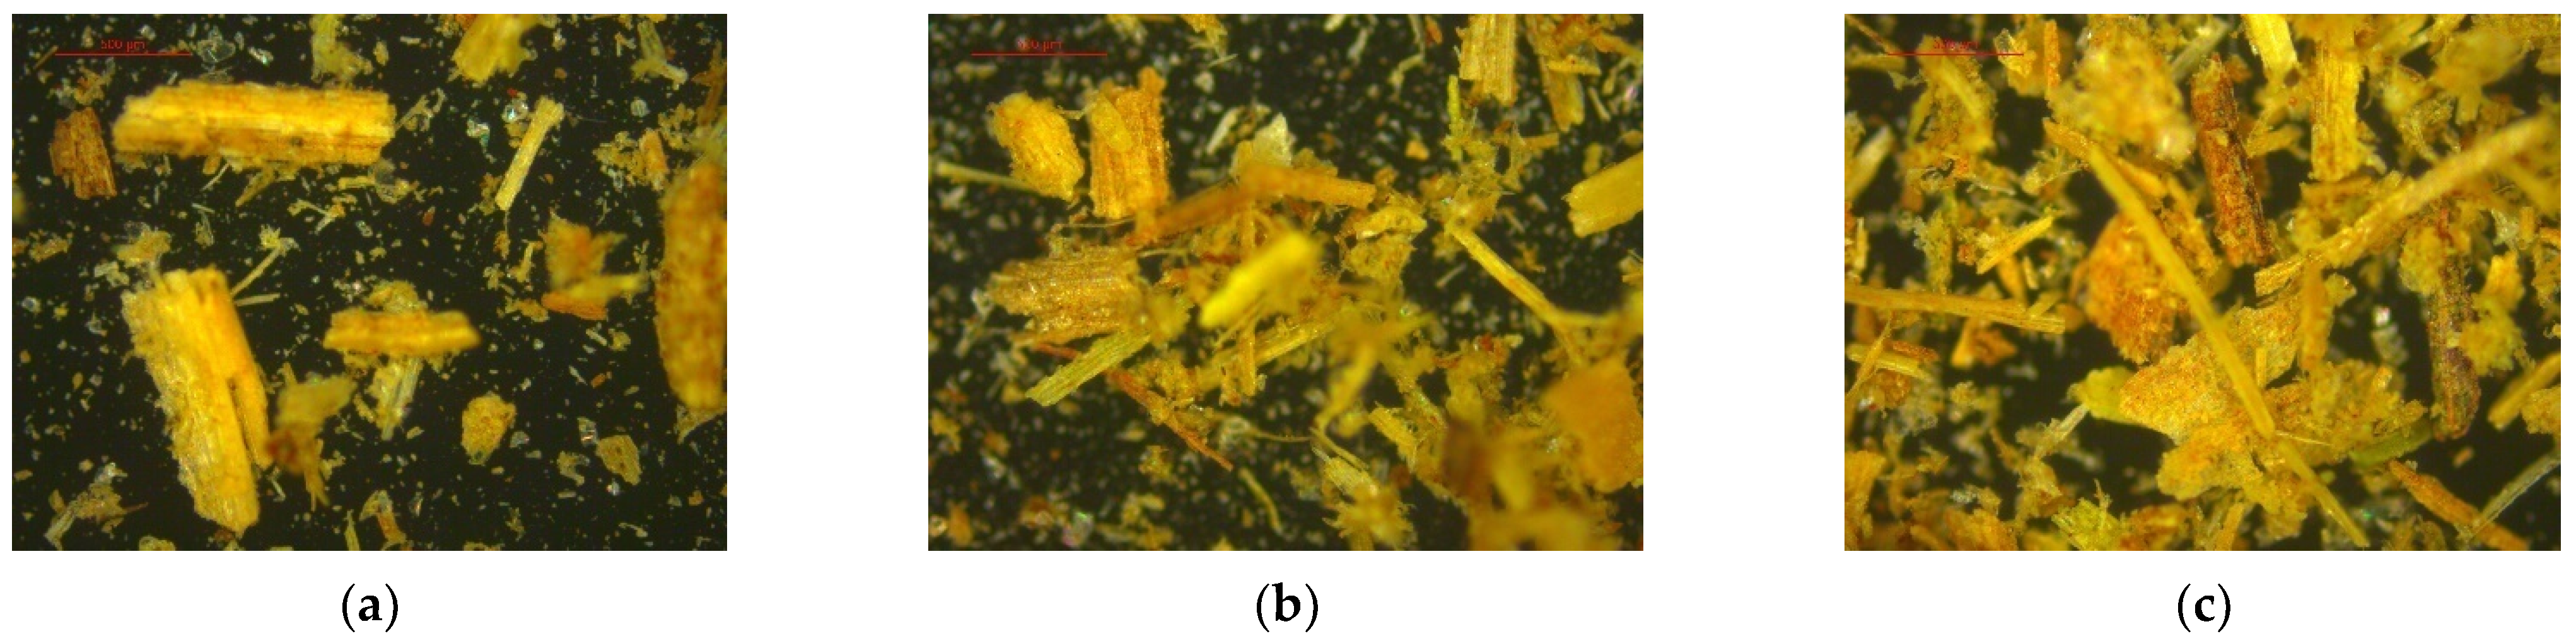
The MS analyzer provided six readings of the sample using the Fraunhofer model at a pressure of 2 bar and a feed rate of 60%. The results were expressed in percentiles, representing volume distribution—Dv (10), Dv (50), and Dv (90) (
Table 5).
The analysis also generated images of readings taken at three different points on the sample at 50× magnification (
Figure 3).
Since Dv (90) is equal to 433.232 μm (
Table 5), it indicates that 90% of the sample has an average particle size of 433.232 μm or less, while the remaining 10% exceeds this value. Similarly, Dv (50) means that 50% of the sample has a particle size of 192.483 μm or less, encompassing Dv (90). For Dv (10), 10% of the sample has an average size of 36.112 μm, while the remaining 90% consists of particles larger than this value. This particle size distribution is consistent with that found by Pérez et al. [
42] for sugarcane bagasse samples.
Particle size plays a crucial role in biomass fast pyrolysis, as it directly influences the heating rate of the particles within the system. Larger particles heat more slowly, which can reduce bio-oil yield and align more closely with the characteristics of slow pyrolysis. Thus, particle sizes smaller than 2 mm are preferred [
43]. Therefore, the MS analysis agrees with literature findings, indicating that for particles smaller than 0.2 mm, pyrolysis is primarily governed by vapor-phase reaction kinetics occurring outside the particles. On the other hand, larger particles favor internal mass and heat transfer, leading to increased volatile production [
44].
The ultimate analysis (CHNS/O) generated data on the percentage composition of carbon, hydrogen, nitrogen, sulfur, and oxygen (by difference) in the SB sample, and the results were compared with some other examples (
Table 6). The obtained contents were satisfactory and ensured the reliability of the biomass used in this study, as they corresponded to those reported in the literature.
Table 6.
Ultimate analysis of the SB of this study and from the literature.
Table 6.
Ultimate analysis of the SB of this study and from the literature.
| Data | Ultimate Analysis (db, wt.%) |
|---|
| C | H | N | S | O |
|---|
| SB | 44.18 | 6.43 | 0.49 | 1.67 | 47.23 |
| [45] | 46.37 | 6.29 | 0.55 | – | 46.79 |
| [46] | 47.46 | 6.28 | 0.57 | 0.59 | 45.11 |
| [47] | 44.80 | 5.80 | 0.20 | 0.10 | 49.00 |
The minimum molecular formula can be known from the ultimate analysis using the general molecular Formula (Equation (2)) [
9].
The coefficients “
a”; “
b”; “
c”; “
d”, and “
e” were obtained based on 100 g of sample, allowing for the calculation of each element’s mass in grams and its corresponding molar quantity by dividing the mass by the molar mass. The existing proportion between the elements was ensured by normalizing all molecular values using the smallest value, thereby generating the molecular formula coefficients. To derive the minimum molecular formula, these coefficients were further divided by the carbon coefficient (
Table 7).
Thus, Equation (3) provides the minimum molecular formula of the studied SB, necessary for achieving the complete combustion reaction (Equation (4)). This formulation enables the evaluation of the oxygen required for thermochemical conversion, ensuring conditions that avoid combustion and guarantee pyrolysis with a low equivalence ratio (ER).
By solving Equation (4), the amount of oxygen required for complete combustion is determined and can be expressed in Equation (5).
Based on the stoichiometry of the previous reaction, the calculated stoichiometric amount of O
2 required for complete combustion is 23.5424 L. Given that atmospheric air contains 21% oxygen, a total of 3333.45 L of air per kg of SB would be necessary to achieve SB complete combustion. This air-to-fuel stoichiometric ratio is represented in Equation (6), as suggested by Henao et al. [
48].
Considering a range of safe ER values for pyrolysis, the
Qair input to the plant can be obtained. According to Maitlo et al. [
49], gasification, as a thermochemical conversion process, operates optimally within a low ER range of 0.18 to 0.32, while values below this range, approaching zero, characterize pyrolysis. Given this, ER values between 0.01 and 0.18 were chosen for this study.
Another key process variable was
Qbagasse, which, according to Equation (6), needed to be combined with the ER ratio to guarantee a volumetric airflow sufficient to fluidize the pyrolysis reactor bed. Thus,
Table 8 indicates the different
Qair values derived from the ER/
Qbagasse relationship.
Q
bagasse was chosen based on the ideal value for which the plant’s pyrolysis reactor was designed, set at 3 kg/h [
32]. Therefore, to refine airflow calculations, Q
bagasse was incrementally varied by 0.1, while ER was adjusted in steps of 0.01, generating various airflow values. Among them, the experimental runs used airflow values of 24.56, 24.89, 25.00, 24.89, and 24.56 L/min (bolded in
Table 8) for ER l of 0.13, 0.14, 0.15, 0.16, and 0.17, respectively, all exceeding the minimum fluidization threshold of 22 L/min, according to Miranda [
31]. This ensured that the sand particles within the pyrolysis reactor reached a fluidized state, optimizing the reaction conditions.
3.2. Fast Pyrolysis Yield
The pyrolysis products were weighed to obtain the yield of each run (
Table 9) and subsequently sent for characterization analyses. The yields of bio-oil and biochar were determined by calculating the mass percentage of the product relative to the biomass consumed (% m/m) based on Q
bagasse and a run time of 15 min.
All fast pyrolysis runs (FP01–FP05) maintained a similar volumetric flow rate of fluidization gas, consistent reaction times, and set-point temperatures for reactor components (
Table 1 and
Table 2). Therefore, result comparisons focus on ER, Q
bagasse, and variations in pyrolysis reactor temperature between reactions despite the air heater’s set-point temperature being consistently maintained at 450 °C across all experimental runs (
Table 2).
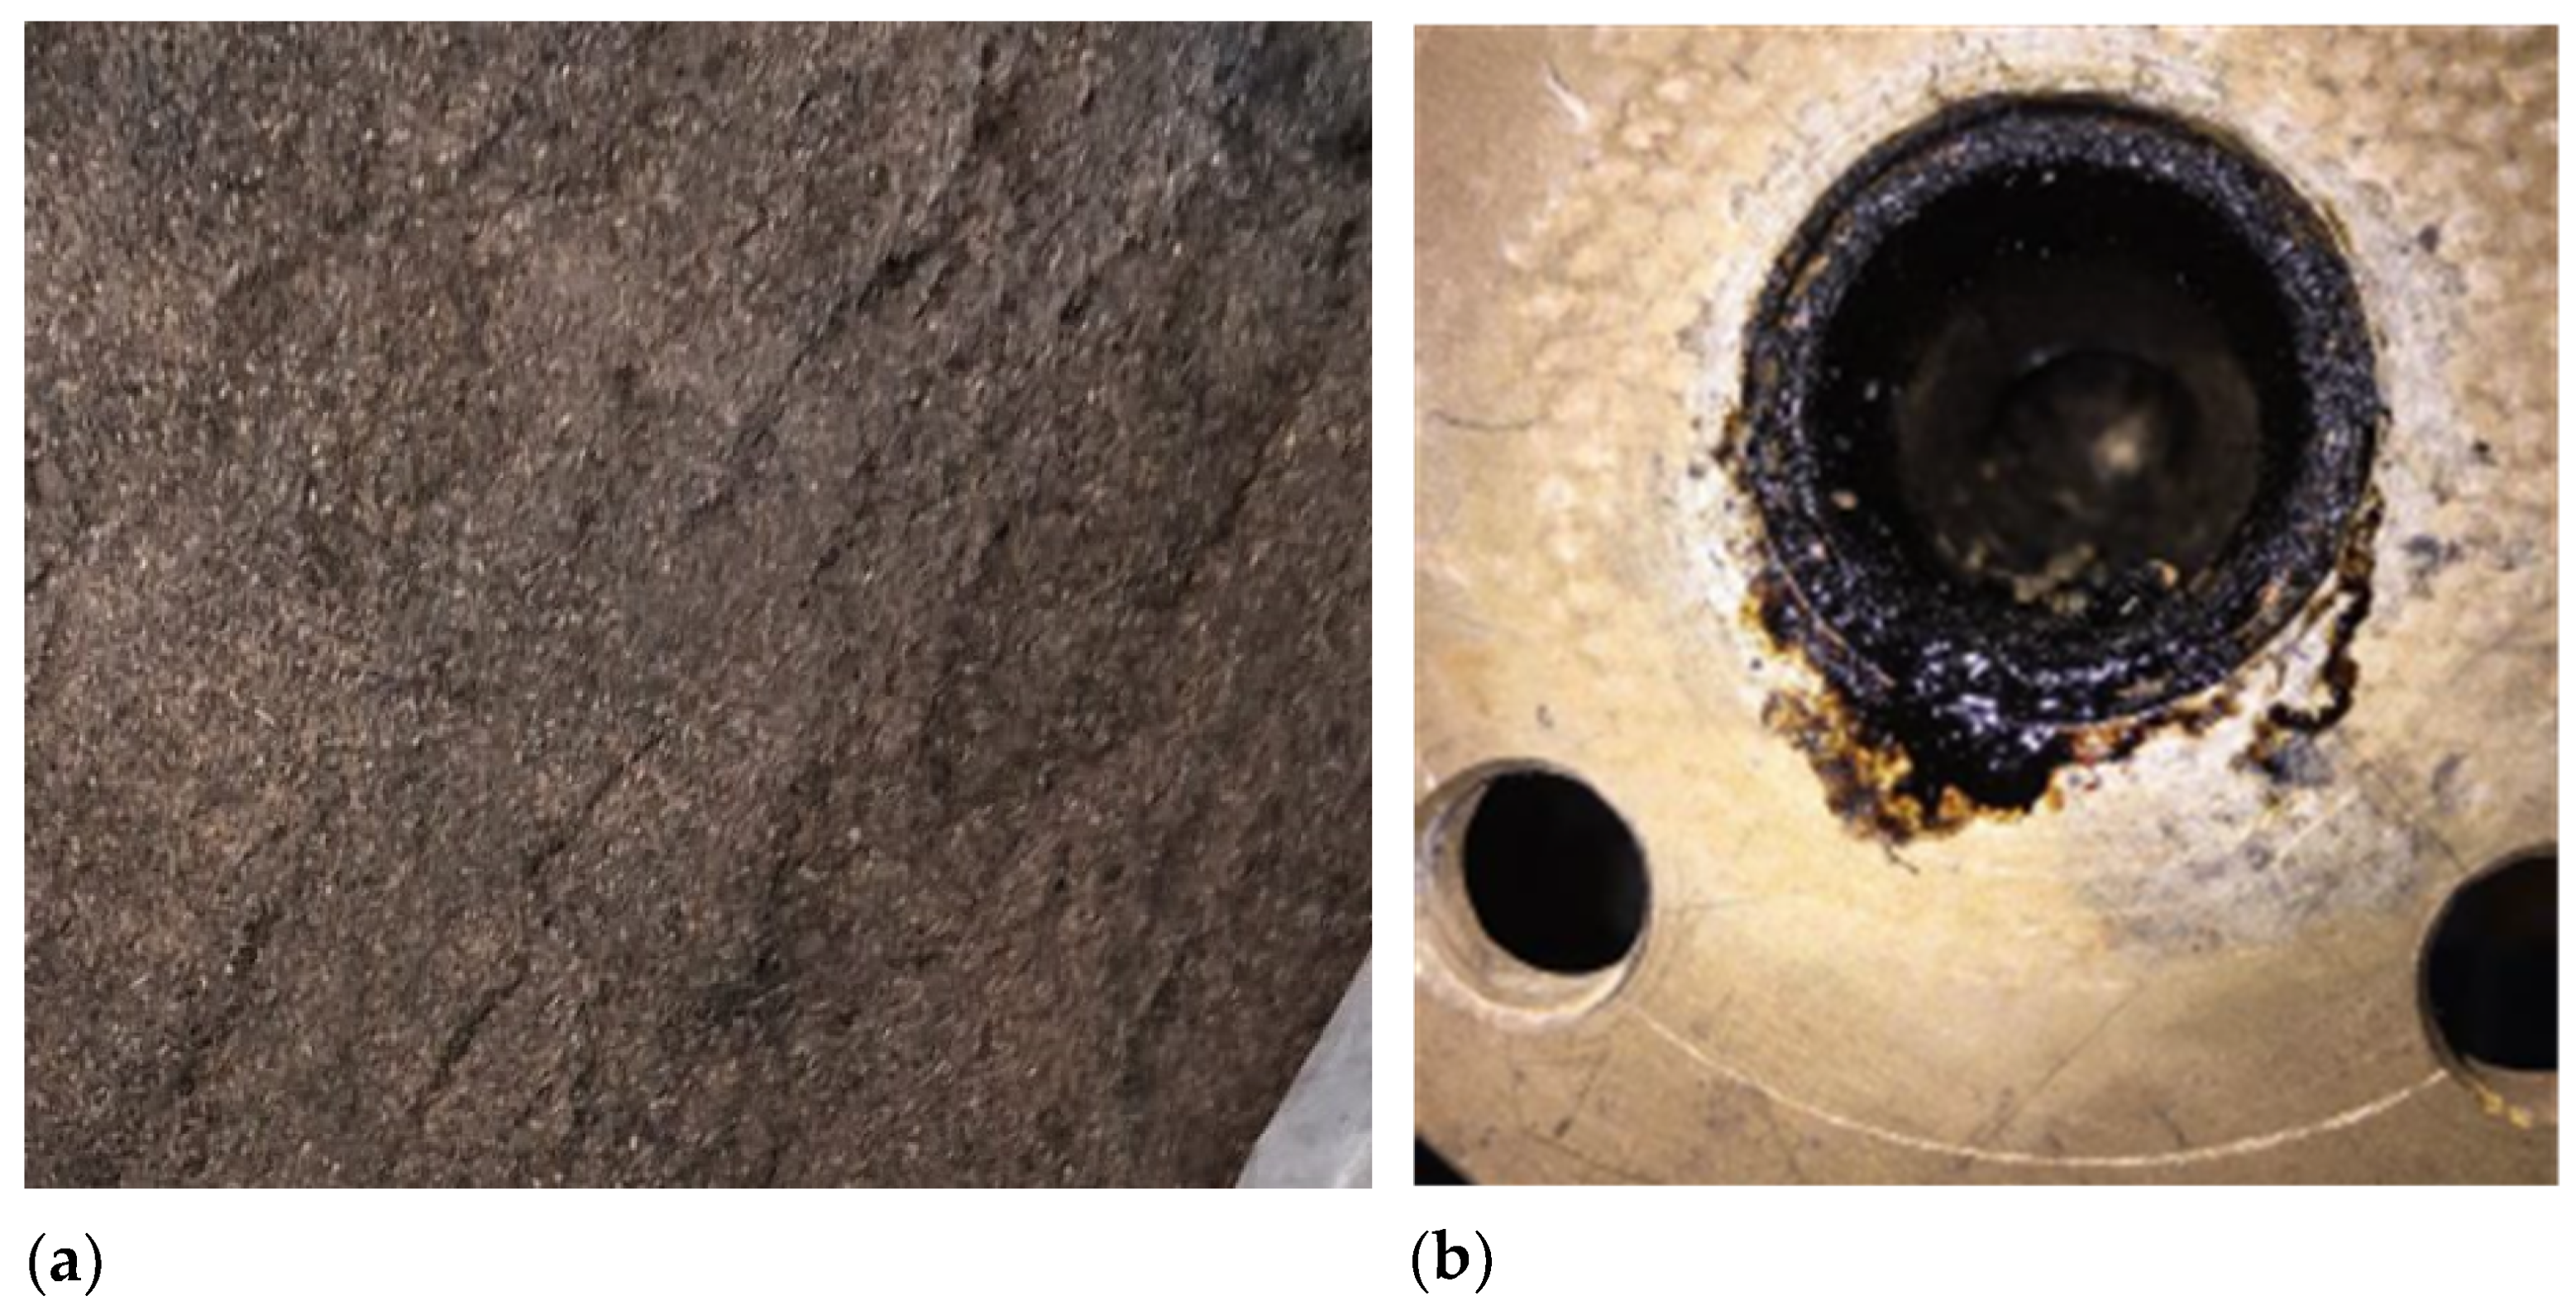
The highest bio-oil yields were observed in FP03 and FP04, at 56.21% and 61.64% yields, respectively. This can be attributed to the plant operating at its ideal biomass flow rate of 3.0 kg/h, which is associated with low condenser outlet temperatures, thereby ensuring efficiency. Additionally, the pyrolysis reactor temperatures of 556 and 527 °C fell within the ideal range for fast pyrolysis (400–600 °C) [
50]. In contrast, FP05 had a reactor temperature of 622 °C, resulting in a lower bio-oil yield (29.44%), which reaffirms that temperatures above 600 °C shift the process toward gasification rather than pyrolysis. For FP01 and FP02, yields were significantly lower, 1.25% for FP01 and none for FP02. These poor results were likely due to higher biomass flow rates of 3.4 and 3.2 kg/h, which exceeded the ideal 3.0 kg/h and overwhelmed the condenser, resulting in the generation of bio-oil in the pyrolysis plant pipeline (
Figure 4a). Despite low outlet temperatures, volatiles were not effectively condensed, leading to reduced bio-oil recovery. An efficient condenser and, consequently, a sufficient heat exchange area benefit the bio-oil yield in pyrolysis processes, as reported by [
51,
52].
The experimental tests on the fluidized bed pyrolysis reactor revealed that bed entrainment had a significant impact on process efficiency, resulting in low biochar production (biochar yields remained below 1% in all runs). Various operating and design factors can cause bed entrainment in a fluidized bed pyrolysis reactor. For example, if the fluidizing gas velocity exceeds the optimal level, intense particle movement may occur, resulting in significant entrainment of the solid bed (such as sand) out of the reaction zone before complete biomass conversion [
53], as shown in
Figure 4b. This issue may have been exacerbated by pressure drops in the bed and leakage problems in the pilot plant used, which were very difficult to resolve, causing instabilities and fluctuations in the rotameter that also controlled the gas velocity [
54]. Particle size could have been another contributing factor, as tiny and low-density particles are more likely to be carried away by the gas flow, reducing material retention and affecting process efficiency [
55].
Another aspect is related to the gas distributor, which, if poorly designed, fails to promote uniform fluidization, potentially creating preferential flow channels that increase entrainment in some areas of the reactor [
56]. The high entrainment rate of particles resulted in reduced solid material retention in the reaction zone, thereby impairing the conversion of biomass into biochar [
57]. Additionally, it was observed that gas velocity and operating conditions directly influenced this phenomenon, underscoring the need for adjustments to reactor parameters. The analysis of experimental data suggests that fluidization optimization can minimize the entrainment effect, ensuring better biomass utilization and improving the quality of the obtained biochar [
18]. Thus, it can be concluded that the actual yield was likely not as low as reported, but rather, there was difficulty in separating the produced biochar from the entrained sand coming from the reactor, a common issue found in the literature for pilot plants in thermochemical processes involving fluidized bed reactors.
3.3. Bio-Oil Components
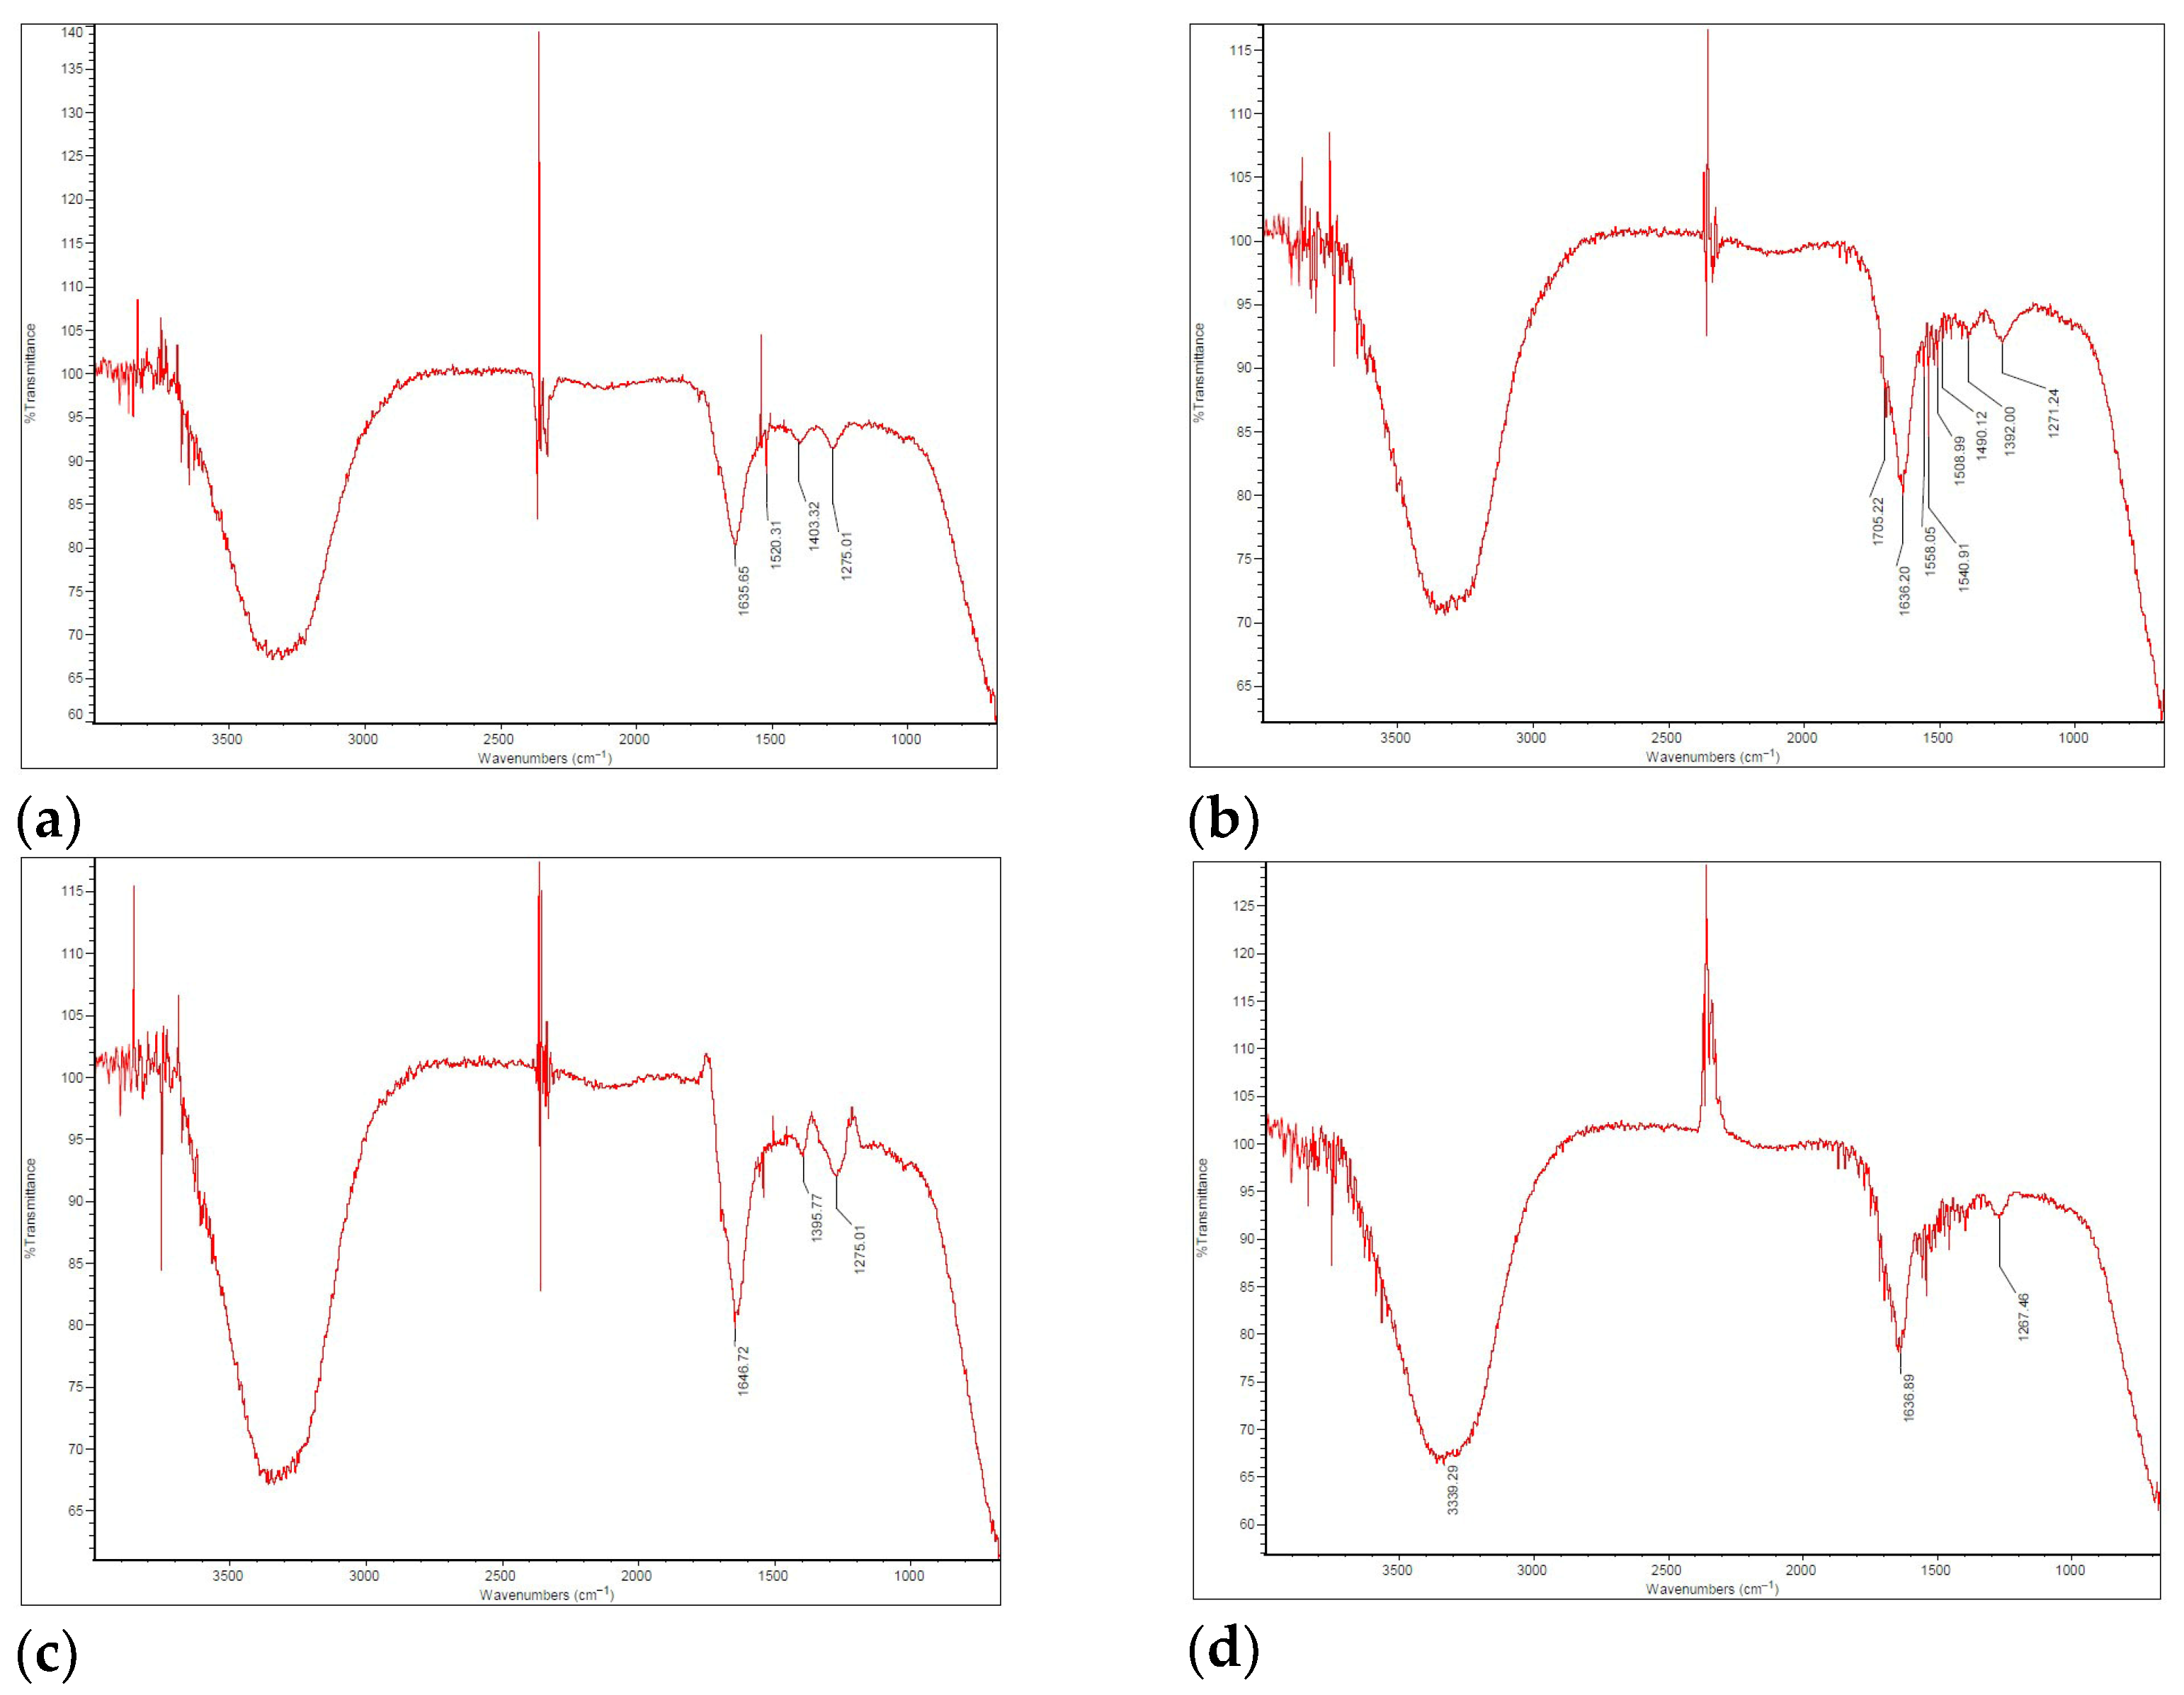
The FT-IR results for the bio-oil, generated using an Imaging Microscope (Thermo Scientific, Waltham, MA, USA) with a 4 cm
−1 resolution, are presented in the spectra shown in
Figure 5.
The FT-IR spectra of the bio-oil samples (except for FP02, in which no bio-oil was produced; therefore, no spectrum was recorded) predominantly feature aromatic and aliphatic compounds (including alkanes, alkenes, and alkynes), as well as various oxygenated functional groups. The spectra of the four analyzed samples exhibited overall chemical similarity, although slight variations were observed in the absorption intensities. Notably, the stretching region between 3400 and 3200 cm
−1 corresponds to O–H bonds, indicating the presence of impurities such as water, hydroxyl-containing compounds, and alcohols, as previously reported [
58]. The vibration around 1650–1630 cm
−1 can be attributed to the overlapping C=O and C=C bonds, as their spectral regions range from 1630 to 1850 cm
−1 and 1620 to 1680 cm
−1, respectively, suggesting the presence of aromatics, esters, carboxylic acids, and ketones, as previously reported [
59].
Usually, C=O vibrations appear in the 1750–1700 cm
−1 range, but shifts to lower wavelengths can occur due to interference with the molecular structure. Signals near 1500 cm
−1 may result from angular deformation symmetrical to the water molecule’s plane, as discussed by Vega et al. [
60] in their work on SB pyrolysis.
In all samples, the presence of alkenes (unsaturated hydrocarbons) was evidenced by absorption bands in the 1500–1375 cm
−1 region, corresponding to the C=C stretching vibrations. The decomposition of high molecular weight polymers into compounds such as phenols, esters, ethers, and alcohols was indicated by absorbance in the 1300–950 cm
−1 range, associated with C–O stretching and O–H deformation, as reported by Gautam and Chaurasia [
61]. The absorbance bands for C–O and aromatic C–H functional groups exhibited a marked decrease with increasing pyrolysis temperature, likely due to the enhanced cracking and reforming of aromatic compounds at elevated temperatures [
62]. Finally, the detection of hydrocarbon groups, including C=C and C–H bonds, as well as alcohols, suggests the potential of the bio-oil for use as a fuel [
63].
Therefore, it can be concluded that the bio-oil obtained across the four experimental runs exhibited a high degree of similarity. Even in FP05, where the reaction temperature reached 622 °C, exceeding the target (approximately 550 °C), the liquid yield was 29.44%, lower than the highest yields of 56.21% and 61.64% in FP03 and FP04, respectively (
Table 9). Still, the bio-oil from FP05 remains comparable to the others in terms of composition and characteristics.


 and
and 
