Abstract
The world’s energy demand increases daily, fostering the search for renewable fuels to reconcile production needs with environmental sustainability. To prevent the severe atmospheric impact of fossil fuels, reducing greenhouse gas emissions is both essential and urgent, reinforcing the necessity of developing and adopting renewable fuel alternatives. Therefore, this work aimed to produce bio-oil through sugarcane bagasse fast pyrolysis. The methodology is based on fast pyrolysis operation in a fluidized bed reactor (pilot plant) as a thermochemical method for bio-oil production. This research required the conditioning of the raw material for system feeding, along with optimizing key variables, operating temperature, airflow, and sugarcane bagasse feed rate, to achieve improved yields compared to previous studies conducted in this pilot plant. The sugarcane bagasse was conditioned through drying and milling, followed by characterization using various analytical methods, including calorific value, thermogravimetric analysis (TGA), particle size analysis by laser diffraction (Mastersizer—MS), and ultimate analysis (determining carbon, hydrogen, nitrogen, sulfur, and oxygen by difference). The bio-oil produced showed promising yield results, with a maximum estimated value of 61.64%. Fourier Transform Infrared Spectroscopy (FT-IR) analysis confirmed the presence of aromatic compounds, as well as ester, ether, carboxylic acid, ketone, and alcohol functional groups.
1. Introduction
The rapid rise of urbanization, industrialization, and population growth, combined with high consumption patterns and modern lifestyles, means energy demand is evolving dramatically daily. This results in a high consumption of traditional energy resources from fossil fuels, which suggests that alternative forms of energy generation are being sought and are driving this transition forward [1,2,3,4]. According to the US Department of Energy, global energy demand is expected to rise by more than 28% by 2040, corresponding to 739 quadrillion BTU [5].
Biomass appears to have great potential for replacing petroleum raw materials due to its significant availability and chemical properties that promote its good conversion into liquid fuels [6]. Brazil is the largest producer and exporter of sugar in the world; Brazil produced 676.96 million tons of sugarcane in the 2024/2025 harvest, generating between 0.270 and 0.290 tons of bagasse per ton of processed sugarcane [7], so a large volume of sugarcane bagasse (SB) is generated, motivating the search for ways to reuse and exploit the energy potential of this waste. New species, such as energy sugarcane, which was used in this work, are interesting since they may yield more than 160 tons/ha, almost twice that of conventional sugarcane [8]. Biomass can be converted biologically (anaerobic digestion and fermentation) and thermochemically through pyrolysis, gasification, and combustion. Pyrolysis operates without oxygen or with a low amount of oxygen and can generate energy-dense products, including biochar, bio-oil, and non-condensable gases. The bioproduct to be obtained depends directly on the operating conditions of the system, and so, within this scenario, pyrolysis appears as one of the most efficient conversion methods and is categorized as fast, flash, or slow pyrolysis [9].
The bio-oil yields for slow, fast, and flash pyrolysis of biomass range from 30–40%, 50–60%, and 65–75%, respectively [10]. In terms of biochar production, the yields can range from 20–60%, 5–35%, and 10–20% for slow, fast, and flash pyrolysis, respectively [11]. These findings highlight the appeal of fast pyrolysis, which enables the production of significant amounts of bio-oil (up to 60%) while also generating considerable quantities of biochar (up to 35%) as a valuable byproduct. Therefore, this manuscript focuses on the fast pyrolysis of biomass.
The principle of fast pyrolysis is based on the incomplete thermal degradation of carbon-rich raw materials, which must have a grain size suitable for this purpose, with an average diameter of up to 2 mm and a moisture content of less than 10%.
By biomass thermochemical conversion at moderate temperatures (400–700 °C) and under an inert atmosphere or with a small amount of oxygen, condensable gases are generated, leading to the formation of liquid bio-oil [12]. The bio-oil produced has a high energy potential, with a calorific value equivalent to 40% of conventional diesel, allowing it to function similarly to crude oil and be converted into biofuel [13].
Some of the advantages of bio-oil production include storage, transportation, and handling for short periods [14]. Moreover, the liquid fraction can be converted into a renewable fuel, such as renewable diesel or green diesel [15,16].
The solid product of biomass pyrolysis is biochar, a term derived from charcoal by prefixing “bio” because it is produced from a renewable raw material. It is the secondary product of SB fast pyrolysis, with its formation conditioned by the ash content in the raw material, which in this case is less than 10%, as well as key process variables such as temperature and residence time [17]. It is also a high value-added product since it has high applicability, ranging from energy production, metallurgy, and agricultural and farming industries to the medical field [18].
While studies on the SB thermochemical conversion are available, they predominantly focus on conventional fast pyrolysis under inert atmosphere and often overlook the technical challenges involved in bio-oil production. Fardhyanti et al. [19] conducted fast pyrolysis of SB at 500 °C and 700 °C, using a heating rate of 10 °C/s. The authors indicated that the values of density, viscosity, and calorific value, among other properties, of the bio-oil produced from pyrolysis at 700 °C were closer to those of diesel oil compared to the bio-oil produced at 500 °C. Furthermore, the authors determined that the main components of the bio-oil are phenolic compounds, comprising approximately 48.43% and 58.89% of the bio-oils produced at 500 °C and 700 °C, respectively. Treedet and Suntivarakorn [20] analyzed the production of bio-oil from SB using a circulating fluidized bed reactor with bed temperatures ranging from 440 to 520 °C. Based on the experiments, the authors determined that the system could produce a maximum bio-oil yield of 78.07 wt.% at a bed temperature of 480 °C. In addition, the cold efficiency and total energy conversion for bio-oil production were 46.06% and 32.94%, respectively. The authors concluded that bed temperature, solids recirculation rate, and suspension density affected the bio-oil production yield.
Osorio and Chejne [21] studied the use of calcium oxide as a catalyst in the fast pyrolysis process of SB in a fluidized bed reactor. The results showed that the presence of the catalyst (10 wt.%) reduced the oxygen content of the bio-oil by 14%. However, the use of the catalyst decreased the total bio-oil yield by 17 wt.%, reduced the water content in the bio-oil, increased the gas yield, and had no effect on the biochar yield. Ahmed et al. [22] investigated the co-pyrolysis of scrap tire and SB at 500 °C with a heating rate of 20 °C/min and nitrogen (50 mL/min) as the carrier gas. The authors reported that the SB/scrap tire ratio of 1:3 produced the highest liquid yield (49.7 wt.% versus 42.1 wt.% of pure SB). The optimum feedstock mixture produced bio-oil with a calorific value of 41 MJ/kg, exhibiting lower viscosity compared to the bio-oil produced from SB pyrolysis.
This work focuses on the study of SB oxidative fast pyrolysis in a pilot plant. For this purpose, the influence of the operational parameters of the thermochemical conversion processes (airflow rate and SB rate) on the properties of the bio-oil is analyzed. Evaluating the bio-oil produced is also valuable for determining its expected characteristics, which can help develop a high-potential biofuel through upgrading. Therefore, assessing the conversion of sugarcane bagasse by fast pyrolysis contributes to understanding how renewable and biomass residues can contribute to advancing the energy transition. The novelty of this work lies in the detailed particle size analysis using laser diffraction to determine the minimum fluidization velocity in the pyrolyzer operating under an oxidative regime (equivalence ratios between 0.13 and 0.17), the proposed methodology for calculating air flow in fast pyrolysis, and the identification of potential operational issues associated with oxidative pyrolysis for bio-oil production. In addition, this work emphasizes the experimental execution of pyrolysis in a fluidized bed reactor operating with sugarcane bagasse, without focusing primarily on product characterization or the removal of any components during the process.
2. Materials and Methods
This section includes the conditioning of the raw material and a description of the methods and parameters that were evaluated during the SB thermochemical conversion process.
2.1. Raw Material Conditioning and Characterization
The SB sample used in this study underwent conditioning before its thermochemical conversion. In this manner, the SB was ground using a knife mill (Willey, model MA 680, Piracicaba, Brazil) to reduce its particle size to a cutting sieve equivalent to 840 μm. To standardize the entire sample, after grinding, homogenization was carried out in an analog homogenizer (Fritsch, model D-55743, Idar-Oberstein, Germany), followed by quartering to obtain representative samples for biomass characterization in a quartering machine (Fritsch Laborette 24/27, Idar-Oberstein, Germany).
The SB sample was analyzed to predict and evaluate its performance in generating bio-oil in fast pyrolysis. To perform the proximate analysis, determining the moisture content, volatile matter, ash, and fixed carbon in accordance with the ASTM D-5142 standard [23], a TGA analysis (Mettler, model TGA/DSC1, Columbus, OH, USA) was carried out under a controlled heating atmosphere, in an inert atmosphere of N2 to obtain the moisture content and volatile content, and an oxidizing atmosphere of O2 to generate the ash content present in the sample.
To determine the calorific value of the sample, the heat flow was measured using a calorimetric bomb (IKA, model C200, Wilmington, NC, USA) equipped with a water-insulated isoperibolic calorimeter, which is essential for quantifying the internal energy contained in the raw material. The analysis starts with an exothermic combustion reaction due to the ignition generated in the sample and the oxygen injected into the system at high pressure, which heats the water around the combustor, generating the result through the variation in water temperature due to the heat released as a function of the analysis time. The gas used for the analysis was O2 with 99.9% v/v purity at a pressure range of 20–30 bar. The calorific value analysis was performed following the ASTM D2015 standard [24].
Particle size is a significant factor to study because it directly affects the performance and product distribution in fast pyrolysis. In this work, particle size analysis was conducted using Fraunhofer’s theoretical diffraction model [25], which yields percentile distributions based on light scattering, where particle size is inversely proportional to the diffraction angle. Therefore, a laser diffraction particle size analyzer (Malvern Panalyttical, model MAZ3000, Malvern, Worcestershire, UK) was used, and the technique employed was dry pyrolysis, utilizing compressed air as the dispersing medium. The electromagnetic radiation in the visible region, with a fixed wavelength, was applied continuously to the sample dispersed in compressed air, and the diffracted radiation was detected by detectors positioned at different locations within the instrument.
Ultimate analysis (CHNS/O) was carried out to obtain the minimum SB molecular formula studied, which is essential for determining the stoichiometric amount of oxygen required for complete combustion and defining the values of the equivalence ratio (ER) (this was done in the results section for various bagasse flow rates—Section 3.1), which corresponds to the ratio between the air/fuel fed and the stoichiometric air/fuel (Equation (1)). The determination of CHNS content used a combustion technique in a pure oxygen environment, in accordance with ASTM D5373 [26], while the oxygen content was calculated by difference.
2.2. Experimental Setup
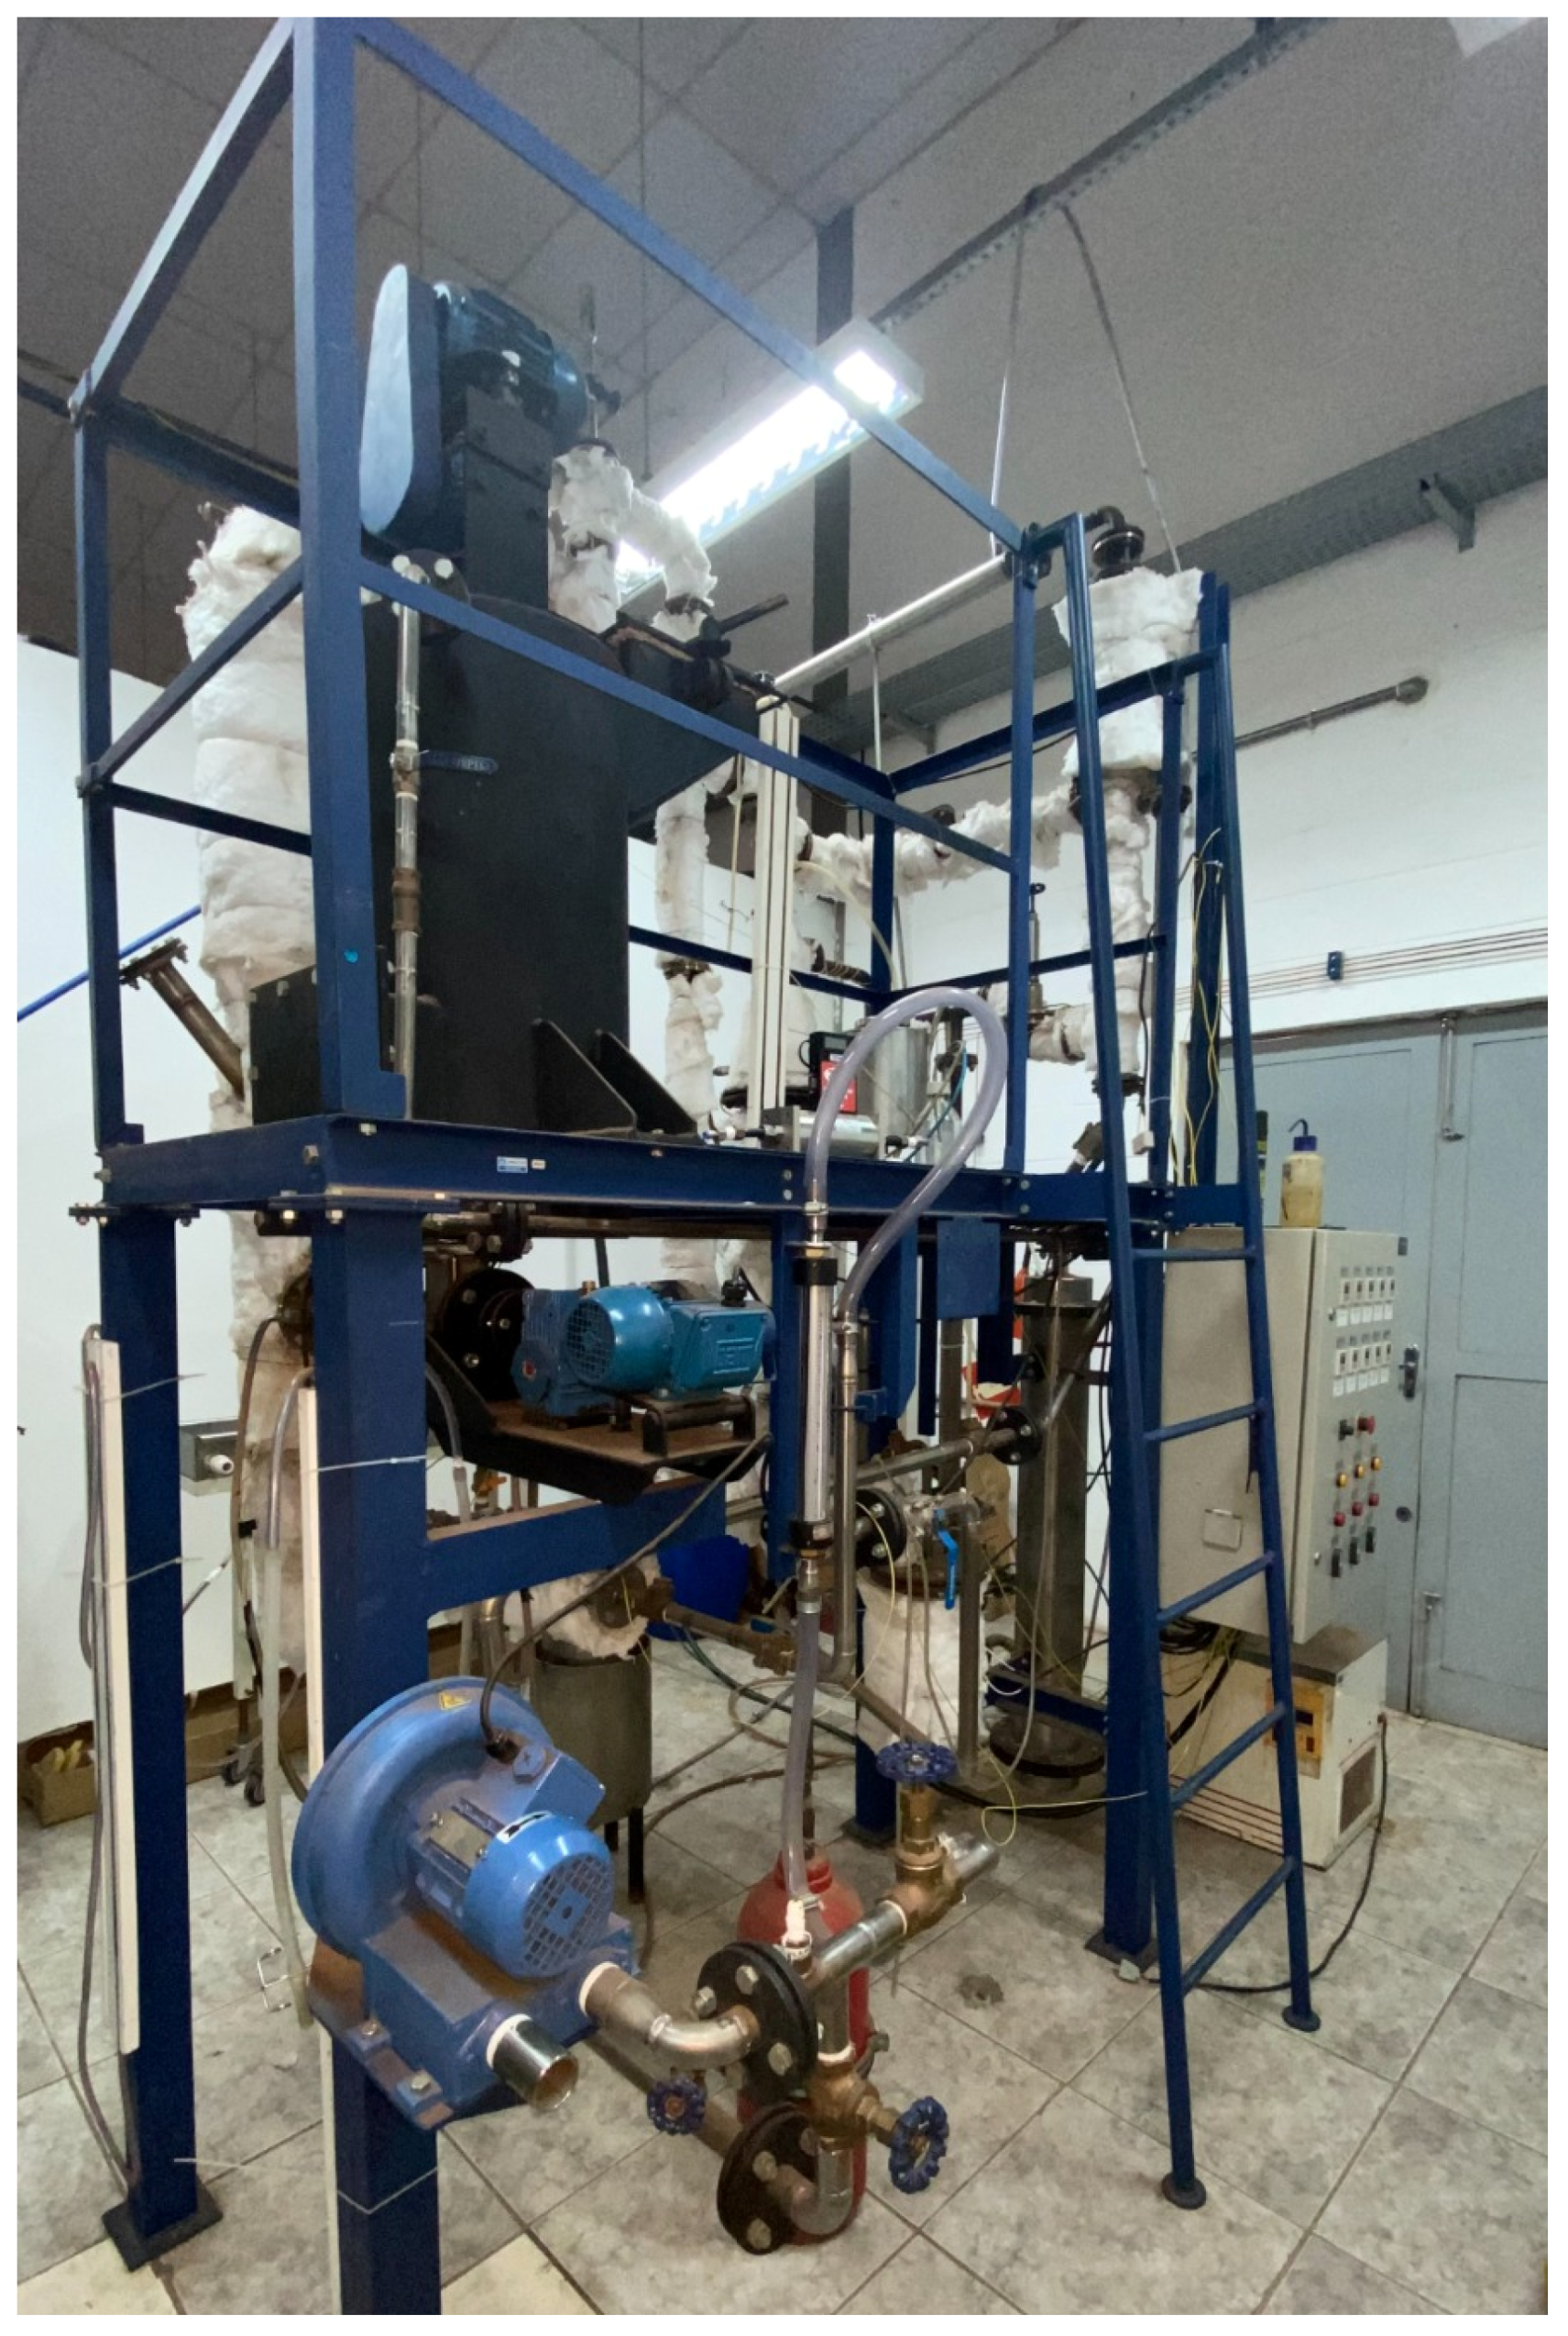
The experimental setup consists of a thermochemical conversion pilot plant operating in pyrolysis under atmospheric pressure (Figure 1), with atmospheric air as the carrier gas. The pyrolysis reactor is made of 316L stainless steel and features a fluidized bed with sand particles capable of handling flow rates of up to 3.8 kg/h.

Figure 1.
Overview of the pilot plant.
The reactor is fed with SB particles smaller than 2 mm and with a humidity of less than 10%. As pyrolysis occurs, biochar is generated and stored in upper reservoirs, while the stream of condensable and non-condensable gases continues with the process flow. Condensable gas undergoes condensation as it exchanges heat with a condenser supplied with an ethylene glycol and water mixture (95:5 ratio), ensuring a low temperature without freezing. The non-condensable gas stream, under atmospheric conditions, is composed of permanent gases or synthesis gases, including CO2, CO, H2, CH4, and other light hydrocarbons [25], which pass through a combustor at the end of the process to prepare the stream for safe disposal.
The fluidized bed reactor was chosen for this work due to its ability to operate at relatively low temperatures in fast pyrolysis processes and its adaptability to a wide range of feedstocks, including biomass, coal, municipal solid waste, and others [27]. Furthermore, this reactor type offers several advantages, such as ease of operation, precise temperature control, enhanced heat transfer rates, and scalability [28]. As a result, pyrolysis in a fluidized bed reactor is characterized by high reaction rates owing to its superior heat transfer capabilities [29]. Additionally, literature reports indicate that this reactor can achieve bio-oil yields exceeding 50%, outperforming other reactor configurations and enabling continuous bio-oil production [30].
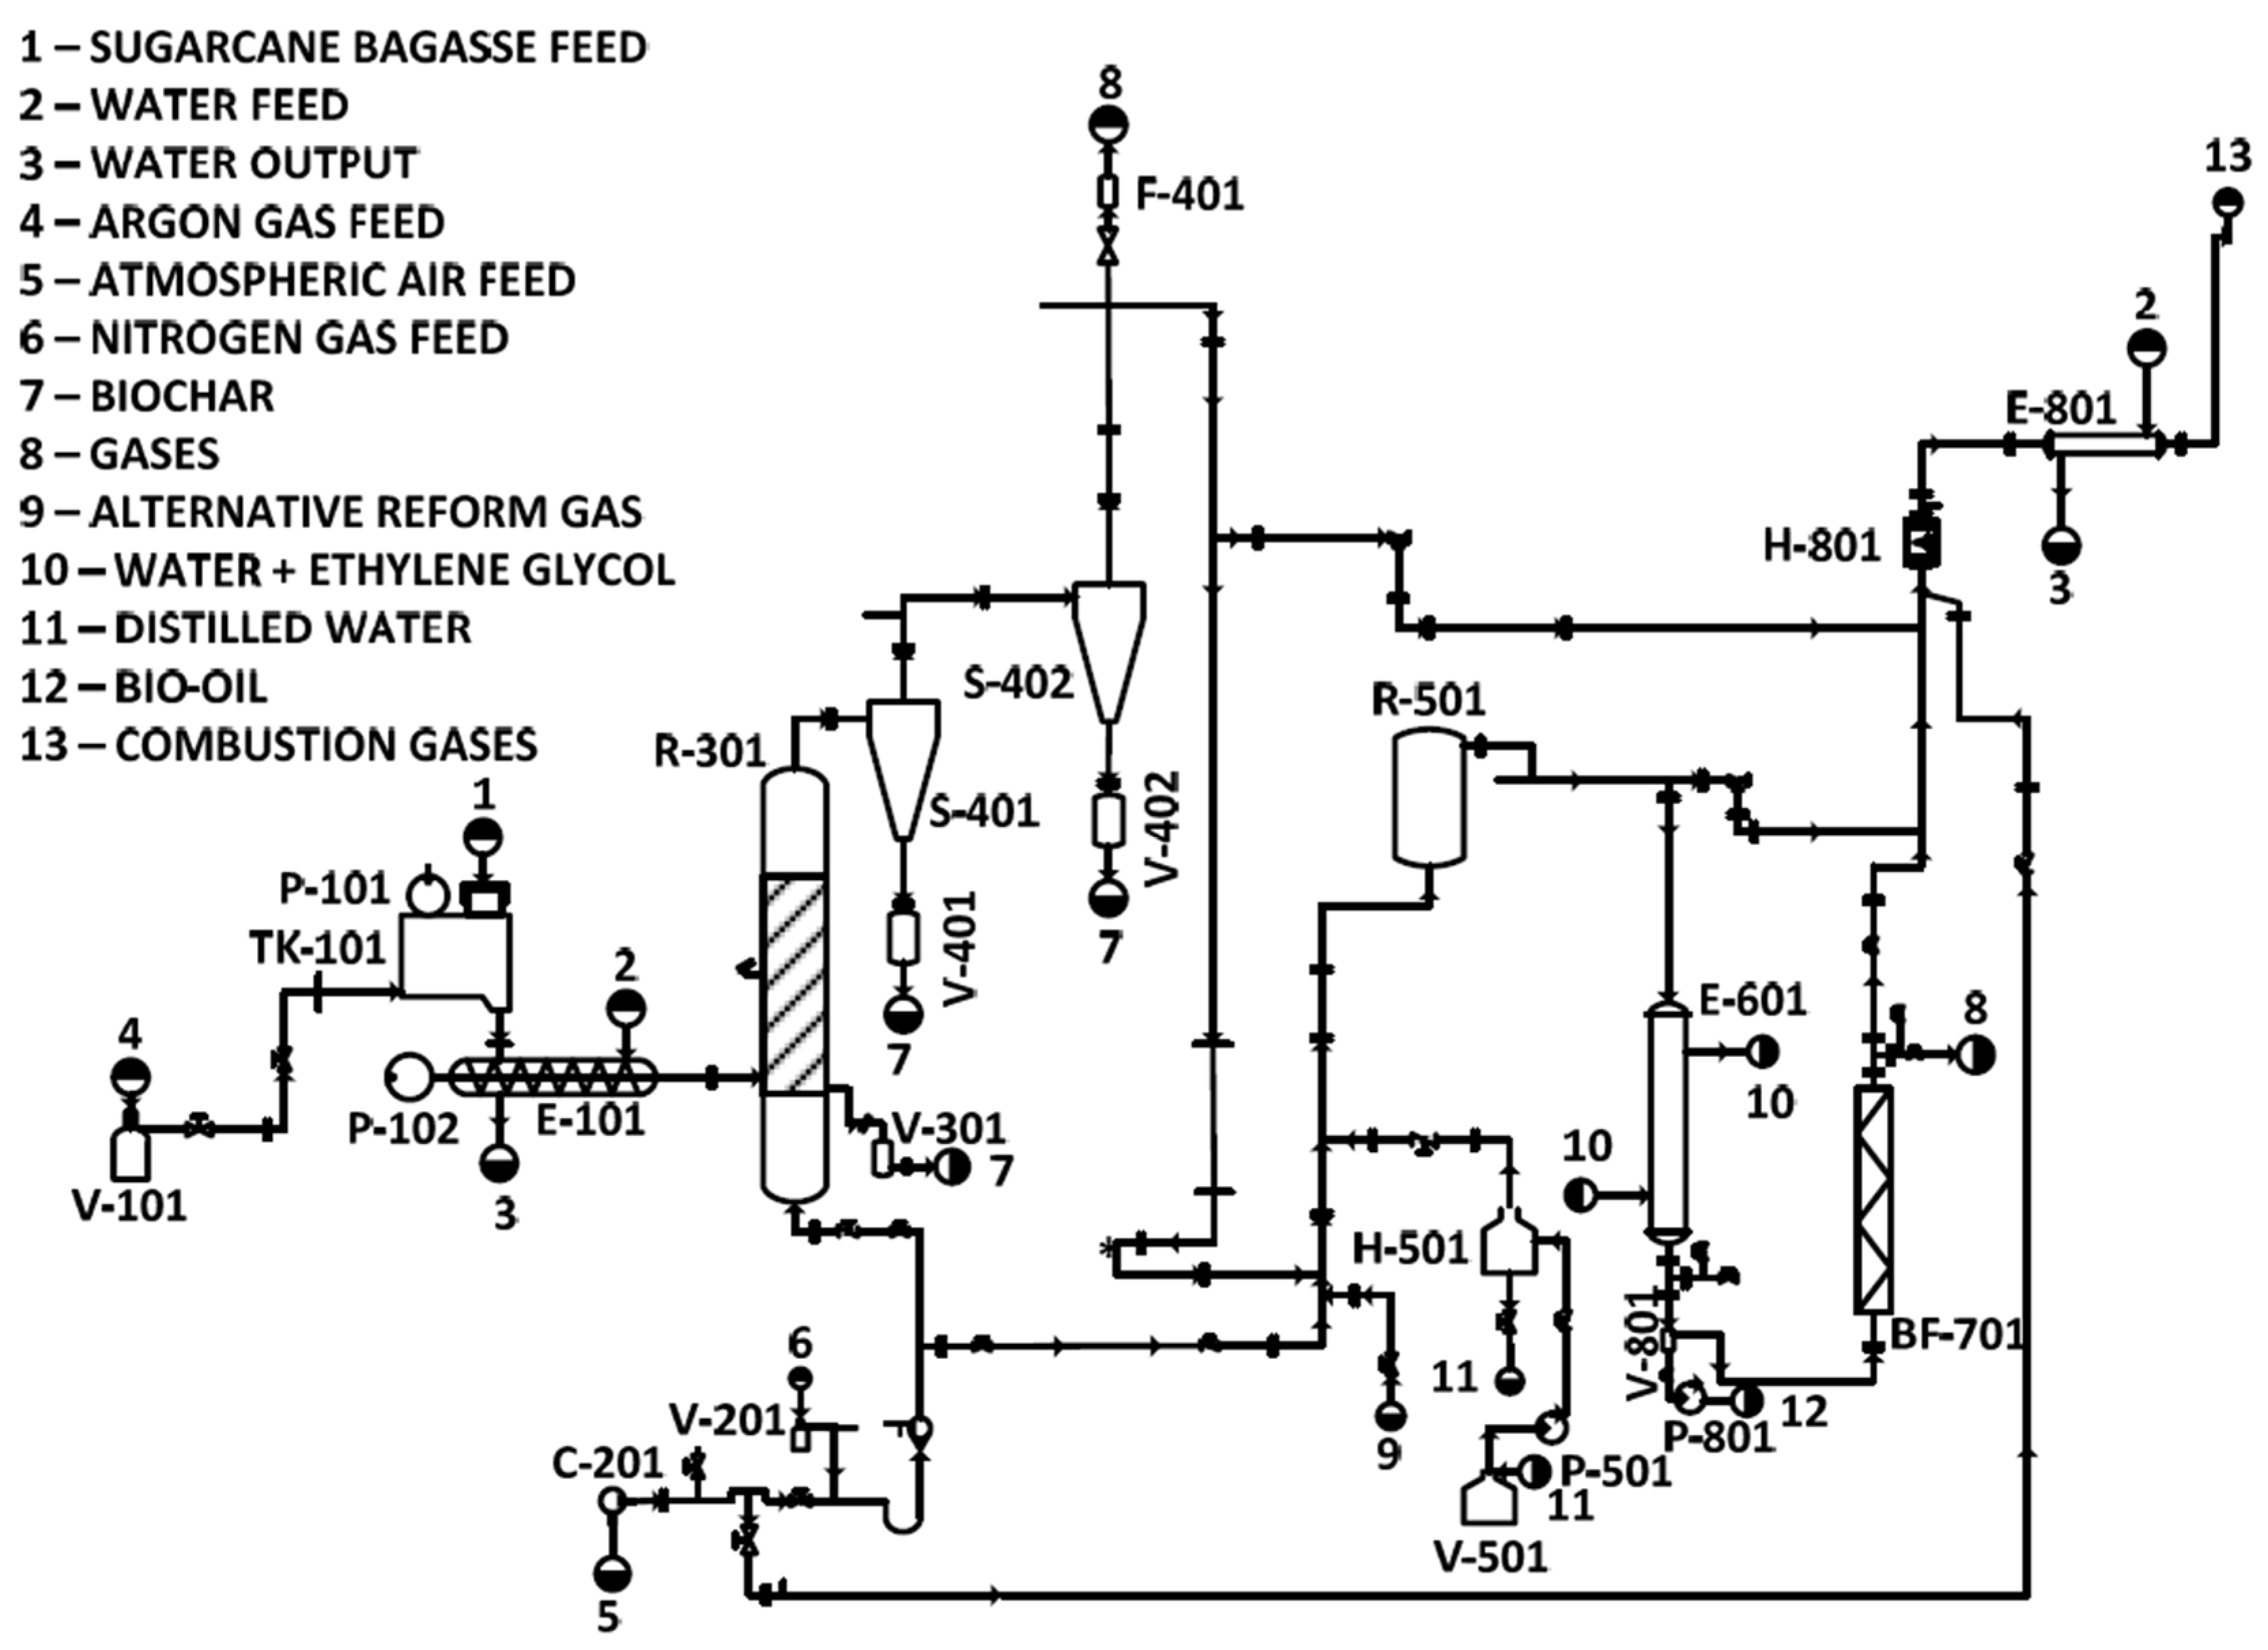
The pilot plant used in this study was divided into sections (Figure 2). The areas from 100 to 800 represent, respectively: 100—SB feed, 200—gas feed, 300—pyrolysis reaction, 400—solid separation, 500—catalytic reforming, 600—bio-oil recovery, 700—gas cleaning, and 800—catalytic combustion. The operation and components of each area were described in Section 2.2.1, Section 2.2.2, Section 2.2.3, Section 2.2.4, Section 2.2.5, Section 2.2.6, Section 2.2.7 and Section 2.2.8, representing areas 100 to 800, respectively, and the system’s operation with the configurations adopted in this project is shown in Section 2.3.
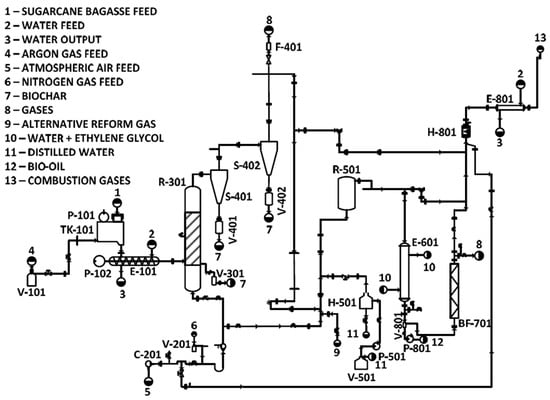
Figure 2.
Pyrolysis pilot plant flowchart (translated from [31]).
2.2.1. SB Feed—Area 100
The SB feed is identified by area 100, which contains some equipment, promotes feeding, and supplies the raw material for the following stages. The components include an argon cylinder, a geared motor, a frequency inverter for the mixer in the feed silo, the feed silo itself, a motor, the screw conveyor, and its frequency inverter [31].
A valve regulates the injection of argon gas into the feed silo, ensuring an inert environment and preventing potential contamination from gases produced in the process that could flow back to the silo.
The feed silo supplies raw materials for processing, with agitation provided by a coupled gearmotor, whose speed is regulated by the control unit. After this stage, the raw material falls onto the screw conveyor, which allows its transfer into the fluidized bed reactor (area 300). This process is driven by a motor connected to a gearbox, controlled by a frequency inverter to regulate the feed rate into the reactor precisely.
2.2.2. Gas Feed—Area 200
Area 200 of the plant comprises gas feed operations. As highlighted earlier, argon gas is applied before the pyrolysis reaction begins, but atmospheric air serves as the carrier gas for bed fluidization in area 300 and supports combustion in the catalytic combustor in area 800. For this purpose, an atmospheric air compressor was used with a gas flow rate controlled by a rotameter. This methodology has been carefully designed to use atmospheric air, with the applied flow rate pre-established for plant operation to prevent combustion in the reactor, ensuring an ER below 0.2.
2.2.3. Pyrolysis Reaction—Area 300
The fast pyrolysis thermochemical process takes place in area 300, featuring a fluidized bed reactor coupled to a biochar reservoir. The raw material from the screw conveyor is fed into the reactor, set at an optimized temperature determined through some studies on fast pyrolysis in the literature [32,33], which was fixed for different experimental runs (Section 2.3). Upon contact with air and the high temperature imposed by the reactor, the SB volatile components are converted into gas, while the solid fraction (biochar) is produced and stored in the first reservoir. The subsequent biochar fractions are stored in reservoirs located below two cyclones (area 400).
2.2.4. Solid Separation—Area 400
Area 400, consisting of two cyclones and two biochar tanks, is designed to capture and recover suspended solids remaining in the gas stream originating from the reactor in area 300. Therefore, the raw material heated in the fluidized bed reactor was converted into gaseous and solid fractions. The solid fraction was directed into three reservoirs to filter out particulate matter from the gas stream, ensuring that process efficiency remains uncompromised.
2.2.5. Catalytic Reforming—Area 500
The pilot plant used in this study was initially designed for gasification. Consequently, it includes a catalytic reforming reactor, which is not required for pyrolysis. To maintain the plant’s versatility in operating different thermochemical processes, the catalytic reforming reactor was retained in this plant. Thus, it was operated in a manner that did not interfere with liquid recovery in pyrolysis, serving solely as a bypass [31].
Since the transformation of condensable gases is undesirable, the operating configuration was designed to use a moderate temperature in the reforming reactor (Table 1), i.e., lower than that of the pyrolysis reactor but not so low as to cause condensation in unintended areas of the plant.

Table 1.
Approximate fast pyrolysis operating conditions (FP01–FP05).
2.2.6. Bio-Oil Recovery—Area 600
Bio-oil recovery in area 600 of the plant features a shell-and-tube heat exchanger and a Schott-type glass tank for storage, which define the key equipment in this section. After leaving the catalytic reforming reactor, the condenser facilitates the recovery of condensable gases in the stream through heat exchange, converting them into bio-oil. Heat exchange is conducted through an ultra-thermostatic bath containing a 95:5 ethylene glycol-water mixture. This setup maintains a low temperature without freezing, enhancing energy transfer efficiency and enabling faster heat removal.
2.2.7. Gas Cleaning—Area 700
The gas cleaning section includes a scrubber integrated with an internal bag filter system equipped with a polyester sleeve, designed to remove any remaining solid residues from the non-condensable gas stream exiting area 600, thereby preparing it for the next stage of the process. Additionally, Area 700 includes critical gas sampling points that serve as valuable indicators for assessing the efficiency of the applied method.
2.2.8. Catalytic Combustion—Area 800
Finally, area 800 is designed to process gases by converting toxic compounds (hydrocarbons, CO, and NOx) into non-toxic gases (CO2, N2, O2, and H2O) at the end of the process. This transformation is achieved through complete combustion in a catalytic combustor, using the atmospheric air stream from area 200 and a shell-and-tube heat exchanger to reduce the temperature of exhaust gases.
2.3. Process Configuration
The primary consideration in configuring a fluidized bed reactor is its fluidization. Based on findings by Miranda [31], the minimum atmospheric airflow rate required to fluidize this pyrolytic reactor bed is 22 L/min. This value serves as the baseline for ensuring that the sand particles forming the bed achieve a fluidized state. Thus, the ER and the bagasse flow rate (Qbagasse) variables were adjusted to exceed the minimum required for fluidization, ensuring conditions favorable for oxidative pyrolysis. Thus, the atmospheric gas flow rate (Qair) and reaction time remained constant across all experimental runs—fast pyrolysis 01 to fast pyrolysis 05 (FP01–FP05), as did the reaction temperature (Table 1).
The selection of the working range for ER and Qbagasse, along with the calculation for determining Qair, is discussed later in Section 3.1. Meanwhile, Table 2 presents the setup temperatures for the components in FP01 to FP05.
Table 2.
Setup temperatures for the components in the experimental runs.
2.4. Bio-Oil Characterization
The bio-oil samples from each experimental run were collected, weighed, and characterized by Fourier Transform Infrared Spectroscopy (FT-IR) to identify their functional groups. The samples were dispersed onto glass slides and analyzed using an FT-IR spectrometer (Thermo Scientific, model Nicolet 6700, Waltham, MA, USA), equipped with a SNAP-IN BASEPLATE accessory (KBr method) and an imaging microscope. Spectra were recorded over the 4000–650 cm−1 range at a resolution of 4 cm−1. FT-IR analysis was employed to identify functional groups and chemical compounds (both organic and inorganic) present in solids and complex liquid mixtures, such as biochar and bio-oil, respectively [34].
3. Results and Discussion
3.1. SB Characterization
After drying, milling, homogenizing, and quartering the SB, a representative sample was collected for characterization and analysis using TGA analysis for proximate analysis (Table 3), Higher Calorific Value (HCV) and Lower Calorific Value (LCV) (Table 4), granulometric analysis (MS—Table 5 and Figure 3), and ultimate analysis (CHNS/O) (Table 6). For TGA analysis, 1.0199 g ± 0.0341 of SB was used in triplicate (Table 3).
Table 3.
SB TGA results (proximate analysis).
Table 4.
HCV and LCV results.
Table 5.
Sample particle sizes (MS analysis).

Figure 3.
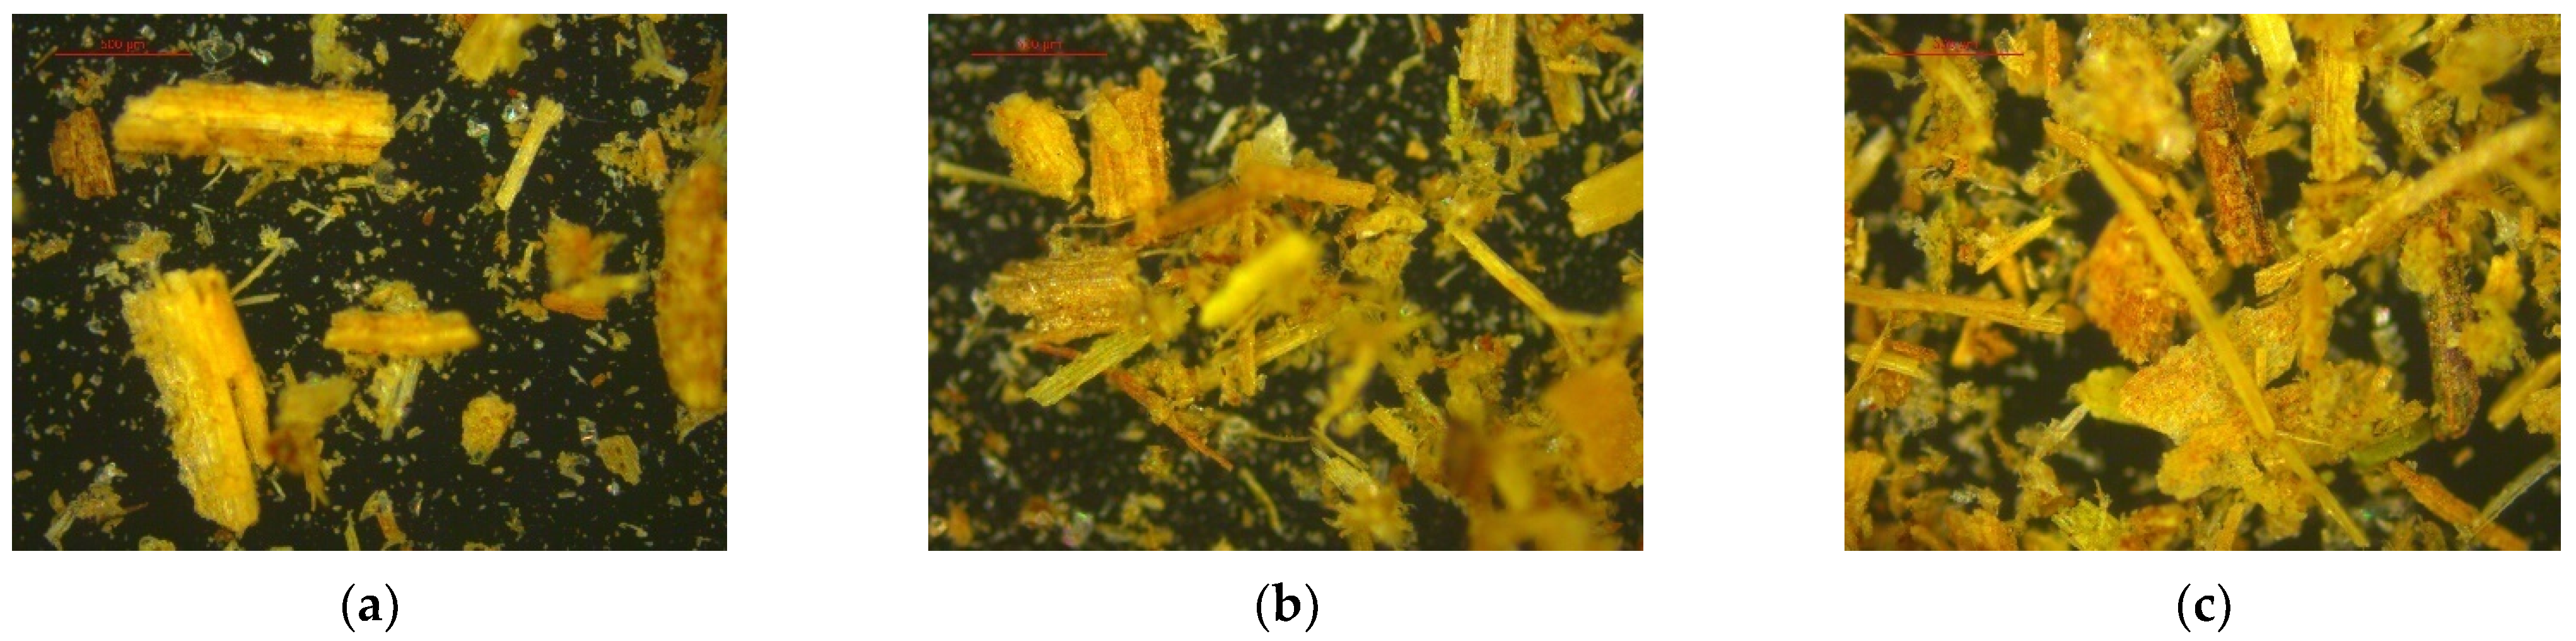
Images of SB captured by the MS detector: (a) position 1; (b) position 2; and (c) position 3.
The moisture content of SB was 4.044%, which is well within the optimal range for its use, as it should be less than or equal to 10% to ensure proper process efficiency. Excessive moisture can hinder feed flow by causing material buildup in equipment, potentially leading to system overheating and increased energy consumption during processing.
Najafi et al. [35] compared their findings with those of several studies available in the literature regarding the fixed carbon, volatile, and ash content of SB, encompassing a broad spectrum of published results. Based on this comparison, the study established the following ranges for these variables: 8.06–18.20% for fixed carbon [35,36], 60.00–88.93% for volatile content, and 1.00–27.70% for ash [37,38].
Usually, biomass is rich in volatile content and has lower ash and fixed carbon content [34]. This holds for SB in this study, where the volatile and ash content fall within the reported ranges, averaging 75.240% and 4.292%, respectively. The fixed carbon content is slightly higher (19.640%), but its impact is minimal, as the volatile-to-fixed carbon ratio, commonly higher than 3.5 in the literature [36], is observed in this study, with an average of 3.7. Additionally, the highly volatile content and low ash content favor a greater liquid yield, while the proportional relationship between ash and solid product formation suggests lower biochar production [39]. Under these conditions, a higher rate of bio-oil formation is expected compared to biochar in SB fast pyrolysis.
The HCV data was generated with a sample moisture content of 4.044%, resulting in a db correction factor of 95.96%. LCV results were also generated (Table 4). This analysis was done in duplicate. The results align with the published literature, with some comparative examples, including 16,050 kJ/kg [40], 16,402 kJ/kg [41], and 17,605 kJ/kg in this study. These values highlight the promising calorific potential of biomass, a key characteristic in fuel production. As the nature of the final products is directly influenced by the raw material, in this case, bagasse from energy cane, its high energy content reinforces its viability for sustainable fuel applications.
The MS analyzer provided six readings of the sample using the Fraunhofer model at a pressure of 2 bar and a feed rate of 60%. The results were expressed in percentiles, representing volume distribution—Dv (10), Dv (50), and Dv (90) (Table 5).
The analysis also generated images of readings taken at three different points on the sample at 50× magnification (Figure 3).
Since Dv (90) is equal to 433.232 μm (Table 5), it indicates that 90% of the sample has an average particle size of 433.232 μm or less, while the remaining 10% exceeds this value. Similarly, Dv (50) means that 50% of the sample has a particle size of 192.483 μm or less, encompassing Dv (90). For Dv (10), 10% of the sample has an average size of 36.112 μm, while the remaining 90% consists of particles larger than this value. This particle size distribution is consistent with that found by Pérez et al. [42] for sugarcane bagasse samples.
Particle size plays a crucial role in biomass fast pyrolysis, as it directly influences the heating rate of the particles within the system. Larger particles heat more slowly, which can reduce bio-oil yield and align more closely with the characteristics of slow pyrolysis. Thus, particle sizes smaller than 2 mm are preferred [43]. Therefore, the MS analysis agrees with literature findings, indicating that for particles smaller than 0.2 mm, pyrolysis is primarily governed by vapor-phase reaction kinetics occurring outside the particles. On the other hand, larger particles favor internal mass and heat transfer, leading to increased volatile production [44].
The ultimate analysis (CHNS/O) generated data on the percentage composition of carbon, hydrogen, nitrogen, sulfur, and oxygen (by difference) in the SB sample, and the results were compared with some other examples (Table 6). The obtained contents were satisfactory and ensured the reliability of the biomass used in this study, as they corresponded to those reported in the literature.
Table 6.
Ultimate analysis of the SB of this study and from the literature.
Table 6.
Ultimate analysis of the SB of this study and from the literature.
| Data | Ultimate Analysis (db, wt.%) | ||||
|---|---|---|---|---|---|
| C | H | N | S | O | |
| SB | 44.18 | 6.43 | 0.49 | 1.67 | 47.23 |
| [45] | 46.37 | 6.29 | 0.55 | – | 46.79 |
| [46] | 47.46 | 6.28 | 0.57 | 0.59 | 45.11 |
| [47] | 44.80 | 5.80 | 0.20 | 0.10 | 49.00 |
The minimum molecular formula can be known from the ultimate analysis using the general molecular Formula (Equation (2)) [9].
The coefficients “a”; “b”; “c”; “d”, and “e” were obtained based on 100 g of sample, allowing for the calculation of each element’s mass in grams and its corresponding molar quantity by dividing the mass by the molar mass. The existing proportion between the elements was ensured by normalizing all molecular values using the smallest value, thereby generating the molecular formula coefficients. To derive the minimum molecular formula, these coefficients were further divided by the carbon coefficient (Table 7).
Table 7.
Data used to obtain the minimum molecular formula coefficients for SB in this study.
Thus, Equation (3) provides the minimum molecular formula of the studied SB, necessary for achieving the complete combustion reaction (Equation (4)). This formulation enables the evaluation of the oxygen required for thermochemical conversion, ensuring conditions that avoid combustion and guarantee pyrolysis with a low equivalence ratio (ER).
By solving Equation (4), the amount of oxygen required for complete combustion is determined and can be expressed in Equation (5).
Based on the stoichiometry of the previous reaction, the calculated stoichiometric amount of O2 required for complete combustion is 23.5424 L. Given that atmospheric air contains 21% oxygen, a total of 3333.45 L of air per kg of SB would be necessary to achieve SB complete combustion. This air-to-fuel stoichiometric ratio is represented in Equation (6), as suggested by Henao et al. [48].
Considering a range of safe ER values for pyrolysis, the Qair input to the plant can be obtained. According to Maitlo et al. [49], gasification, as a thermochemical conversion process, operates optimally within a low ER range of 0.18 to 0.32, while values below this range, approaching zero, characterize pyrolysis. Given this, ER values between 0.01 and 0.18 were chosen for this study.
Another key process variable was Qbagasse, which, according to Equation (6), needed to be combined with the ER ratio to guarantee a volumetric airflow sufficient to fluidize the pyrolysis reactor bed. Thus, Table 8 indicates the different Qair values derived from the ER/Qbagasse relationship.
Table 8.
Volumetric airflow (L/min) resulting from the combination of ER and Qbagasse.
Qbagasse was chosen based on the ideal value for which the plant’s pyrolysis reactor was designed, set at 3 kg/h [32]. Therefore, to refine airflow calculations, Qbagasse was incrementally varied by 0.1, while ER was adjusted in steps of 0.01, generating various airflow values. Among them, the experimental runs used airflow values of 24.56, 24.89, 25.00, 24.89, and 24.56 L/min (bolded in Table 8) for ER l of 0.13, 0.14, 0.15, 0.16, and 0.17, respectively, all exceeding the minimum fluidization threshold of 22 L/min, according to Miranda [31]. This ensured that the sand particles within the pyrolysis reactor reached a fluidized state, optimizing the reaction conditions.
3.2. Fast Pyrolysis Yield
The pyrolysis products were weighed to obtain the yield of each run (Table 9) and subsequently sent for characterization analyses. The yields of bio-oil and biochar were determined by calculating the mass percentage of the product relative to the biomass consumed (% m/m) based on Qbagasse and a run time of 15 min.
Table 9.
Experimental run data in FP01–FP05.
All fast pyrolysis runs (FP01–FP05) maintained a similar volumetric flow rate of fluidization gas, consistent reaction times, and set-point temperatures for reactor components (Table 1 and Table 2). Therefore, result comparisons focus on ER, Qbagasse, and variations in pyrolysis reactor temperature between reactions despite the air heater’s set-point temperature being consistently maintained at 450 °C across all experimental runs (Table 2).
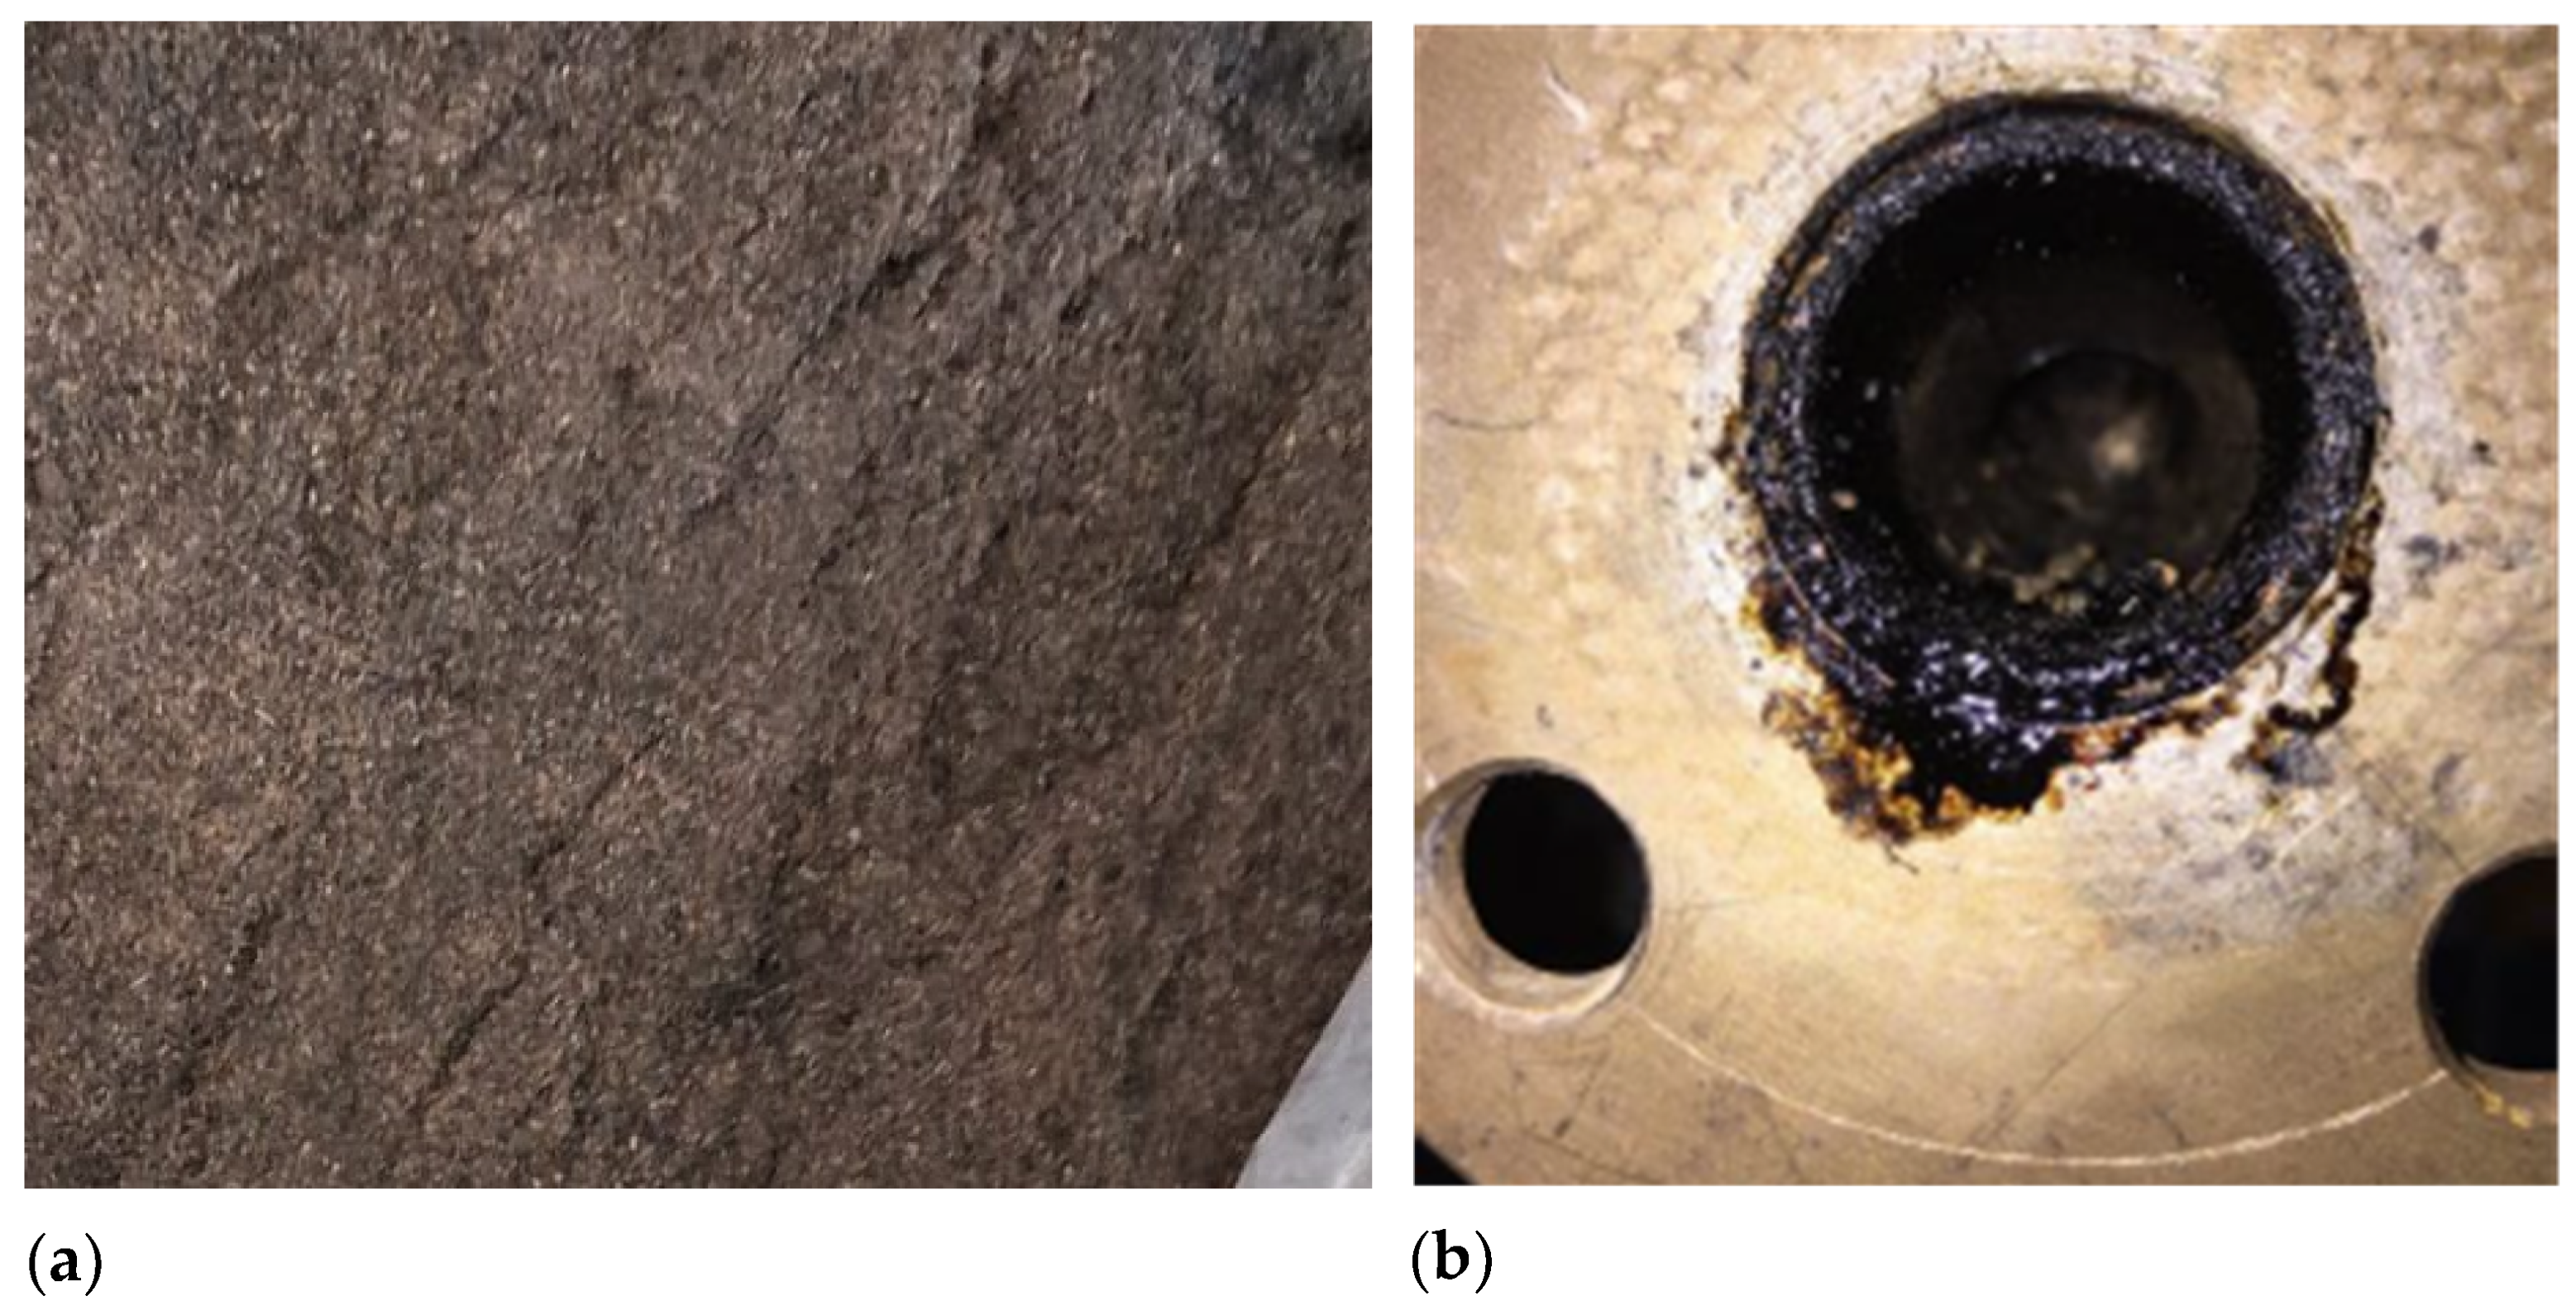
The highest bio-oil yields were observed in FP03 and FP04, at 56.21% and 61.64% yields, respectively. This can be attributed to the plant operating at its ideal biomass flow rate of 3.0 kg/h, which is associated with low condenser outlet temperatures, thereby ensuring efficiency. Additionally, the pyrolysis reactor temperatures of 556 and 527 °C fell within the ideal range for fast pyrolysis (400–600 °C) [50]. In contrast, FP05 had a reactor temperature of 622 °C, resulting in a lower bio-oil yield (29.44%), which reaffirms that temperatures above 600 °C shift the process toward gasification rather than pyrolysis. For FP01 and FP02, yields were significantly lower, 1.25% for FP01 and none for FP02. These poor results were likely due to higher biomass flow rates of 3.4 and 3.2 kg/h, which exceeded the ideal 3.0 kg/h and overwhelmed the condenser, resulting in the generation of bio-oil in the pyrolysis plant pipeline (Figure 4a). Despite low outlet temperatures, volatiles were not effectively condensed, leading to reduced bio-oil recovery. An efficient condenser and, consequently, a sufficient heat exchange area benefit the bio-oil yield in pyrolysis processes, as reported by [51,52].

Figure 4.
(a) Biochar mixed with the bed (sand); (b) Bio-oil generated in the pipeline of the plant.
The experimental tests on the fluidized bed pyrolysis reactor revealed that bed entrainment had a significant impact on process efficiency, resulting in low biochar production (biochar yields remained below 1% in all runs). Various operating and design factors can cause bed entrainment in a fluidized bed pyrolysis reactor. For example, if the fluidizing gas velocity exceeds the optimal level, intense particle movement may occur, resulting in significant entrainment of the solid bed (such as sand) out of the reaction zone before complete biomass conversion [53], as shown in Figure 4b. This issue may have been exacerbated by pressure drops in the bed and leakage problems in the pilot plant used, which were very difficult to resolve, causing instabilities and fluctuations in the rotameter that also controlled the gas velocity [54]. Particle size could have been another contributing factor, as tiny and low-density particles are more likely to be carried away by the gas flow, reducing material retention and affecting process efficiency [55].
Another aspect is related to the gas distributor, which, if poorly designed, fails to promote uniform fluidization, potentially creating preferential flow channels that increase entrainment in some areas of the reactor [56]. The high entrainment rate of particles resulted in reduced solid material retention in the reaction zone, thereby impairing the conversion of biomass into biochar [57]. Additionally, it was observed that gas velocity and operating conditions directly influenced this phenomenon, underscoring the need for adjustments to reactor parameters. The analysis of experimental data suggests that fluidization optimization can minimize the entrainment effect, ensuring better biomass utilization and improving the quality of the obtained biochar [18]. Thus, it can be concluded that the actual yield was likely not as low as reported, but rather, there was difficulty in separating the produced biochar from the entrained sand coming from the reactor, a common issue found in the literature for pilot plants in thermochemical processes involving fluidized bed reactors.
3.3. Bio-Oil Components
The FT-IR results for the bio-oil, generated using an Imaging Microscope (Thermo Scientific, Waltham, MA, USA) with a 4 cm−1 resolution, are presented in the spectra shown in Figure 5.
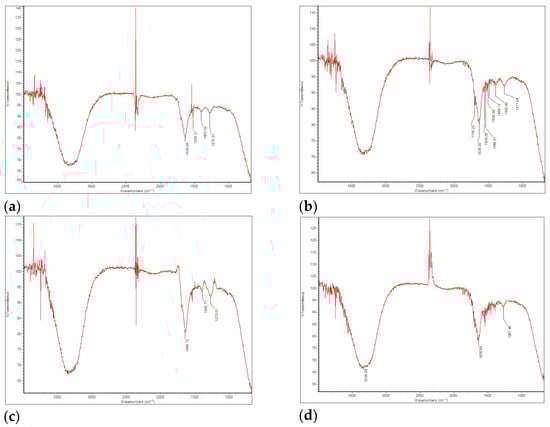
Figure 5.
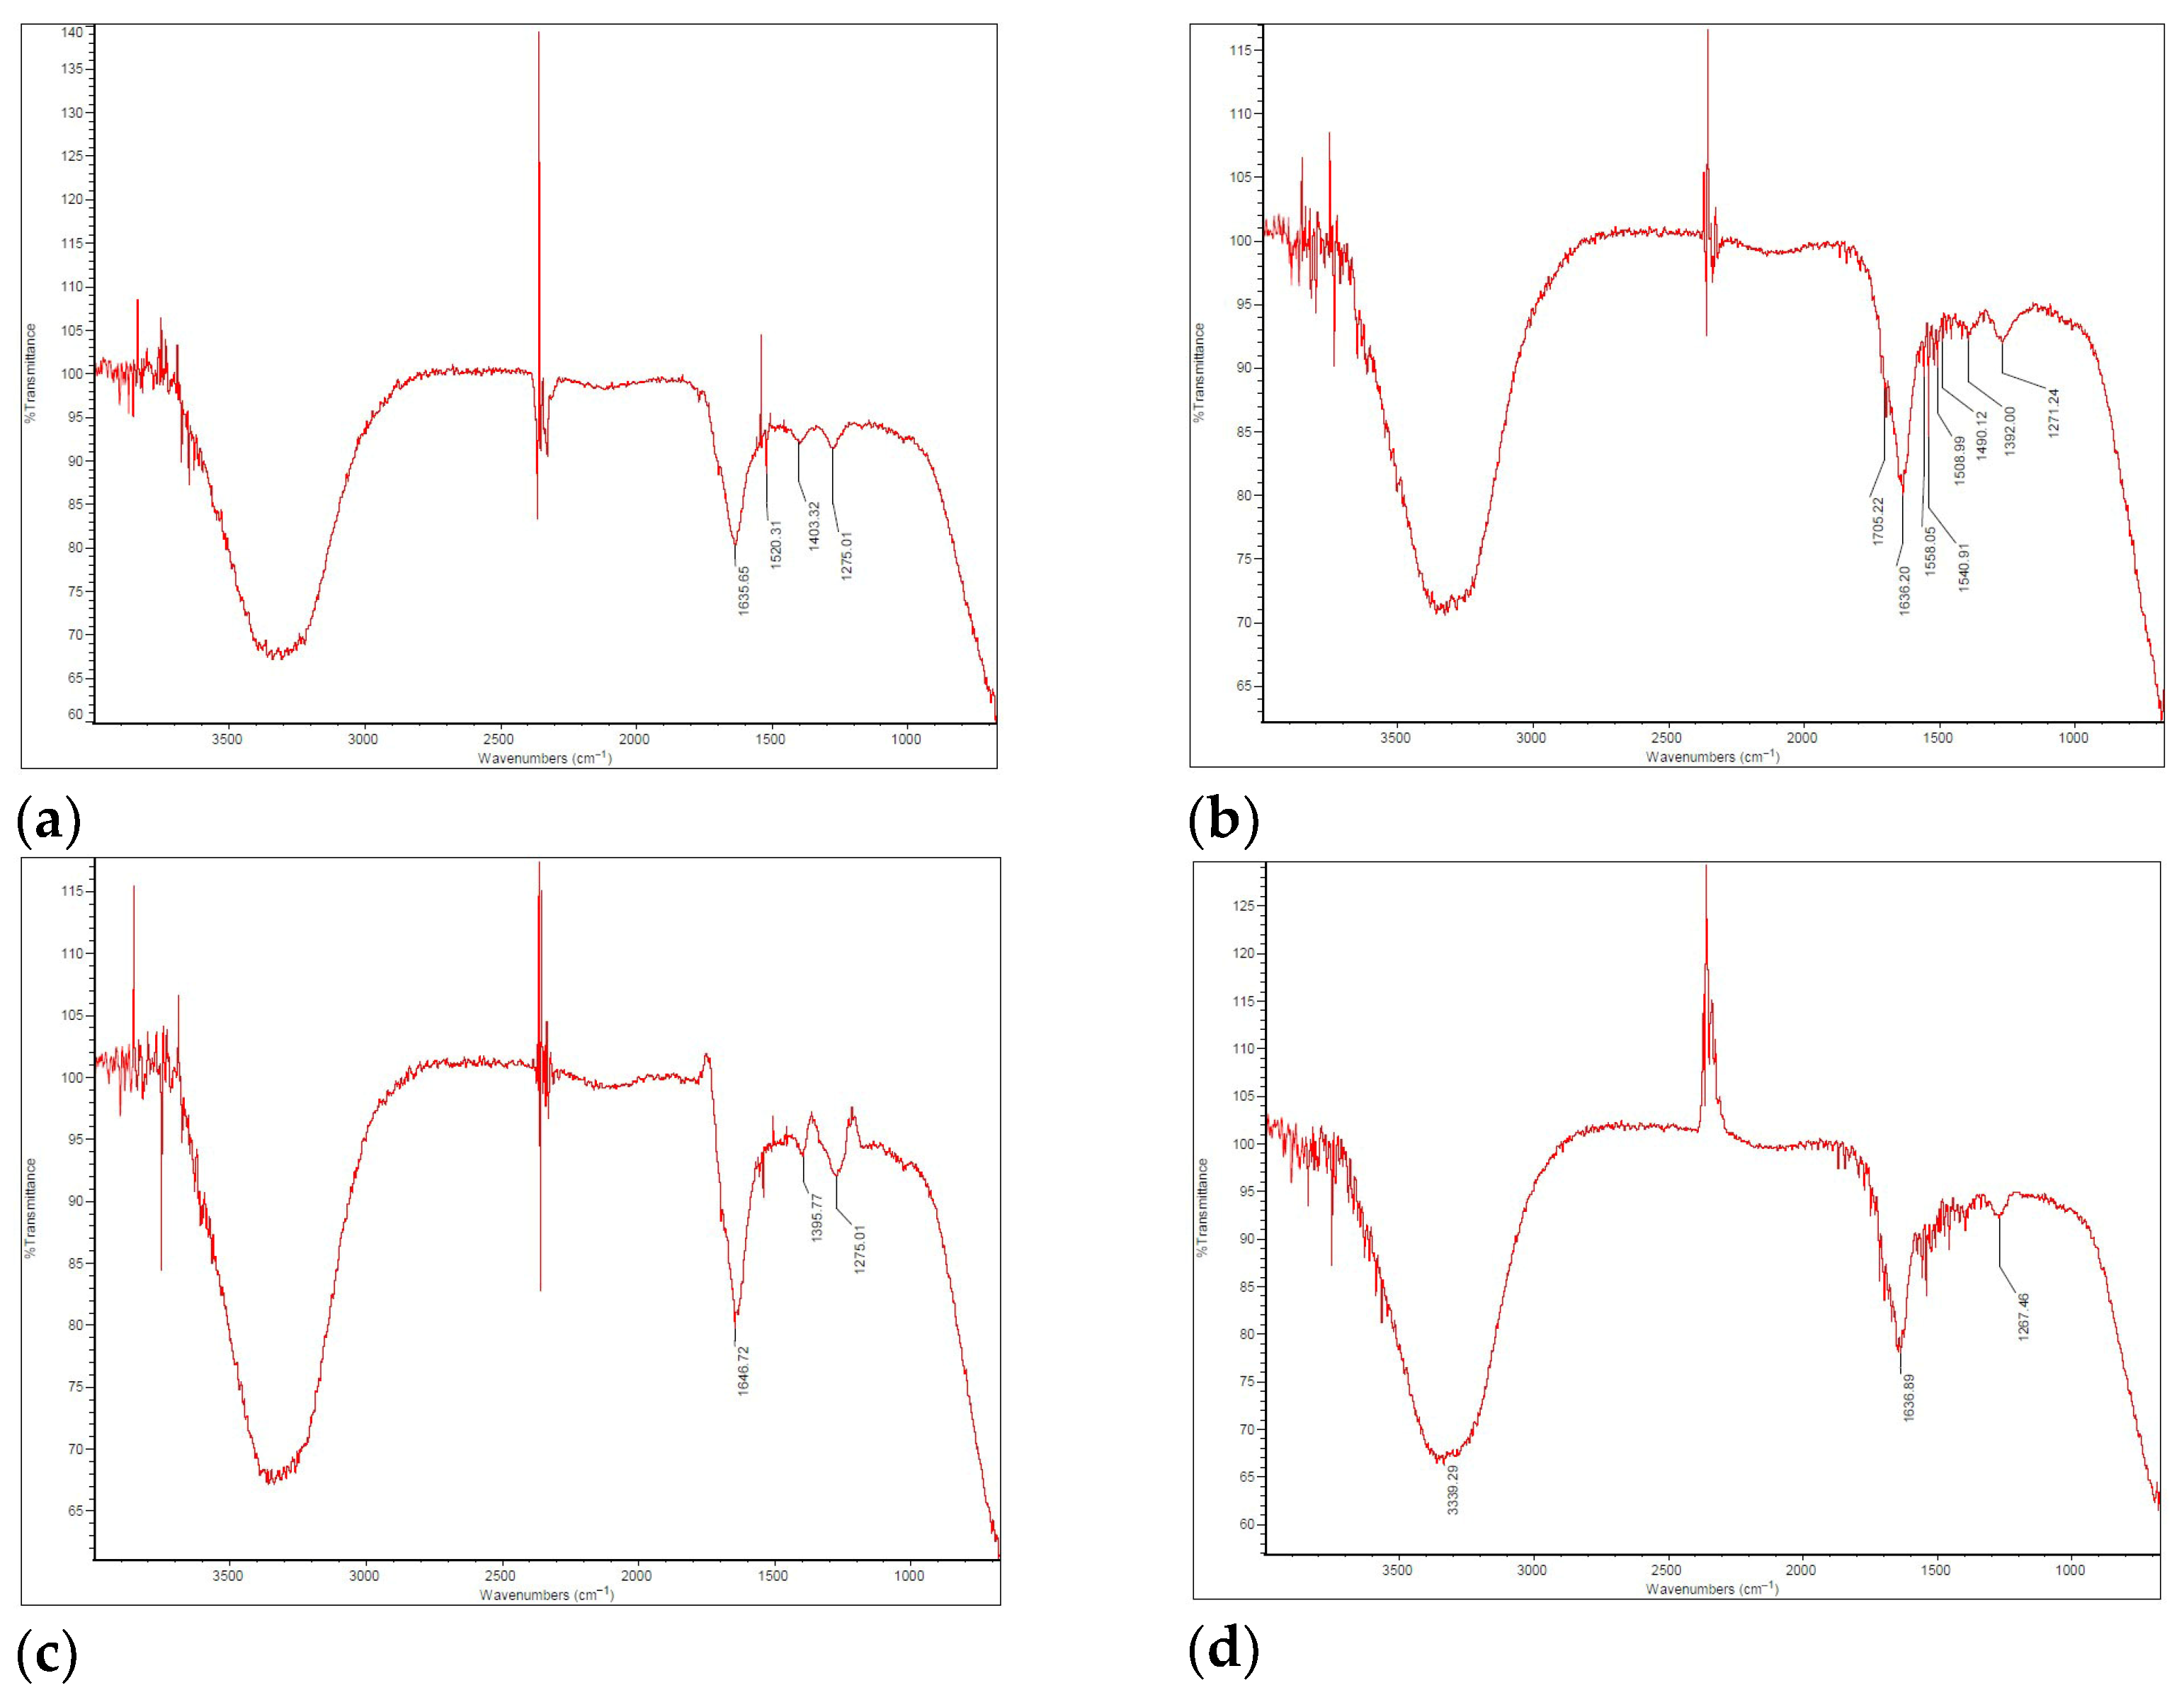
FT-IR spectrum for bio-oil in (a) FP01; (b) FP03; (c) FP04; (d) FP05.
The FT-IR spectra of the bio-oil samples (except for FP02, in which no bio-oil was produced; therefore, no spectrum was recorded) predominantly feature aromatic and aliphatic compounds (including alkanes, alkenes, and alkynes), as well as various oxygenated functional groups. The spectra of the four analyzed samples exhibited overall chemical similarity, although slight variations were observed in the absorption intensities. Notably, the stretching region between 3400 and 3200 cm−1 corresponds to O–H bonds, indicating the presence of impurities such as water, hydroxyl-containing compounds, and alcohols, as previously reported [58]. The vibration around 1650–1630 cm−1 can be attributed to the overlapping C=O and C=C bonds, as their spectral regions range from 1630 to 1850 cm−1 and 1620 to 1680 cm−1, respectively, suggesting the presence of aromatics, esters, carboxylic acids, and ketones, as previously reported [59].
Usually, C=O vibrations appear in the 1750–1700 cm−1 range, but shifts to lower wavelengths can occur due to interference with the molecular structure. Signals near 1500 cm−1 may result from angular deformation symmetrical to the water molecule’s plane, as discussed by Vega et al. [60] in their work on SB pyrolysis.
In all samples, the presence of alkenes (unsaturated hydrocarbons) was evidenced by absorption bands in the 1500–1375 cm−1 region, corresponding to the C=C stretching vibrations. The decomposition of high molecular weight polymers into compounds such as phenols, esters, ethers, and alcohols was indicated by absorbance in the 1300–950 cm−1 range, associated with C–O stretching and O–H deformation, as reported by Gautam and Chaurasia [61]. The absorbance bands for C–O and aromatic C–H functional groups exhibited a marked decrease with increasing pyrolysis temperature, likely due to the enhanced cracking and reforming of aromatic compounds at elevated temperatures [62]. Finally, the detection of hydrocarbon groups, including C=C and C–H bonds, as well as alcohols, suggests the potential of the bio-oil for use as a fuel [63].
Therefore, it can be concluded that the bio-oil obtained across the four experimental runs exhibited a high degree of similarity. Even in FP05, where the reaction temperature reached 622 °C, exceeding the target (approximately 550 °C), the liquid yield was 29.44%, lower than the highest yields of 56.21% and 61.64% in FP03 and FP04, respectively (Table 9). Still, the bio-oil from FP05 remains comparable to the others in terms of composition and characteristics.
4. Conclusions
In this work, SB pyrolysis was conducted in a fluidized bed reactor with air injection to ensure effective bed fluidization. The results demonstrated the feasibility of using atmospheric air, with ER values ranging from 0.13 to 0.17, allowing pyrolysis to occur without initiating biomass combustion. The highest bio-oil yield (61.64%) was achieved at 556 °C. However, at 622 °C, the yield decreased markedly to 29.44%, underscoring the critical importance of temperature control in optimizing pyrolysis performance. This temperature rise was likely due to increased heat release associated with a higher air supply, which may have slightly favored the combustion process, leading to a 32.2% reduction in bio-oil yield.
FT-IR analysis of the bio-oil revealed spectral similarities to water, confirming its high moisture content. However, additional absorption bands and signal interferences were detected, indicating the presence of aromatic compounds (C=C), esters, carboxylic acids, and ketones (C=O), along with C–O and C–H bonds, suggesting the presence of alkanes, alcohols, esters, ethers, and carboxylic acids. The elevated water content was further evidenced by the absence of ignition during HCV analysis, resulting in no measurable output. These findings are consistent with the literature, which notes the challenges in combusting bio-oil due to its high moisture content, typically ranging from 15 to 35% by weight, as well as its acidic and viscous characteristics.
Therefore, exploring strategies to reduce biomass moisture content represents a valuable direction for future work, with demulsification serving as a potential preliminary approach. Furthermore, alternative techniques such as co-pyrolysis warrant investigation, as they may improve the stability and quality of bio-oil, reducing the reliance on post-production upgrading processes.
Author Contributions
Conceptualization, S.d.A.D. and R.M.F.; methodology, S.d.A.D., Y.C.S. and N.T.M.; formal analysis, S.d.A.D.; investigation, S.d.A.D.; resources, S.d.A.D.; data curation, S.d.A.D., Y.C.S. and N.T.M.; writing—original draft preparation, S.d.A.D.; writing—review and editing, N.T.M., Y.C.S., L.A.S. and R.M.F.; supervision, R.M.F.; project administration, S.d.A.D.; funding acquisition, R.M.F. All authors have read and agreed to the published version of the manuscript.
Funding
The authors would like to acknowledge the National Council for Scientific and Technological Development (CNPq), the Coordination for the Improvement of Higher Education Personnel (CAPES), the São Paulo Research Foundation (FAPESP), and the Carlos Chagas Filho Foundation for Research Support in the State of Rio de Janeiro (FAPERJ) for their financial support, which was provided through the following process numbers: CNPq (130620/2023-8), CAPES (88887.695756/2022-00, 88887.714906/2022-00, and 88887.968191/2024-00), FAPESP (2008/57860-3 and 2015/20630-4), and FAPERJ (SEI processes E-26/200.387/2025 and E-26/200.388/2025).
Data Availability Statement
The data presented in this study are available on request from the corresponding author. The data are not publicly available due to the project’s confidentiality.
Conflicts of Interest
The authors declare that they have no known competing financial interests or personal relationships that could have appeared to influence the work reported in this paper.
Abbreviations
The following abbreviations are used in this manuscript:
| BO | Bio-oil |
| SB | Sugarcane bagasse |
| CHNS/O | Ultimate analysis: carbon, hydrogen, nitrogen, sulfur, and oxygen by difference |
| db | Dry basis |
| ER | Equivalence ratio |
| FT-IR | Fourier-transform infrared spectroscopy |
| HCV | Higher calorific value |
| LCV | Lower calorific value |
| TGA | Thermogravimetric analysis |
| SD | Standard deviation |
| Qair | Airflow |
| Qbagasse | Bagasse flow rate |
| FP01 | Fast pyrolysis run 01 |
| FP02 | Fast pyrolysis run 02 |
| FP03 | Fast pyrolysis run 03 |
| FP04 | Fast pyrolysis run 04 |
| FP05 | Fast pyrolysis run 05 |
References
- Ambaye, T.G.; Djellabi, R.; Vaccari, M.; Prasad, S.; Aminabhavi, T.M.; Rtimi, S. Emerging Technologies and Sustainable Strategies for Municipal Solid Waste Valorization: Challenges of Circular Economy Implementation. J. Clean. Prod. 2023, 423, 138708. [Google Scholar] [CrossRef]
- Joshi, N.C.; Gururani, P.; Bhatnagar, P.; Kumar, V.; Vlaskin, M.S. Advances in Metal Oxide-Based Nanocatalysts for Biodiesel Production: A Review. ChemBioEng. Rev. 2023, 10, 258–271. [Google Scholar] [CrossRef]
- Bisht, B.; Gururani, P.; Pandey, S.; Kumar Jaiswal, K.; Kumar, S.; Vlaskin, M.S.; Verma, M.; Kim, H.; Kumar, V. Multi-Stage Hydrothermal Liquefaction Modeling of Sludge and Microalgae Biomass to Increase Bio-Oil Yield. Fuel 2022, 328, 125253. [Google Scholar] [CrossRef]
- Shahbeik, H.; Peng, W.; Kazemi Shariat Panahi, H.; Dehhaghi, M.; Guillemin, G.J.; Fallahi, A.; Amiri, H.; Rehan, M.; Raikwar, D.; Latine, H.; et al. Synthesis of Liquid Biofuels from Biomass by Hydrothermal Gasification: A Critical Review. Renew. Sustain. Energy Rev. 2022, 167, 112833. [Google Scholar] [CrossRef]
- Elgarahy, A.M.; Hammad, A.; El-Sherif, D.M.; Abouzid, M.; Gaballah, M.S.; Elwakeel, K.Z. Thermochemical Conversion Strategies of Biomass to Biofuels, Techno-Economic and Bibliometric Analysis: A Conceptual Review. J. Environ. Chem. Eng. 2021, 9, 106503. [Google Scholar] [CrossRef]
- Martinez, G.L.; Arboleda, C.I.B.; Lora, E.E.S.; Santiago, Y.C.; del Olmo, O.A. Techno-Economic Evaluation of Converting Biomass to Electricity in Isolated Areas of Colombia. Biofuels Bioprod. Biorefin. 2025. [Google Scholar] [CrossRef]
- CONAB Brasil Deve Atingir Recorde Na Produção de Açúcar Mesmo Com Redução Na Produção de Cana-de-Açúcar Na Safra 2024/2025. Available online: https://www.gov.br/conab/pt-br/assuntos/noticias/brasil-deve-atingir-recorde-na-producao-de-acucar-mesmo-com-reducao-na-producao-de-cana-de-acucar-na-safra-2024-2025 (accessed on 29 October 2024).
- Caraballo, L.D.G.; dos Santos Junior, J.M.; Zelioli, I.A.M.; Castillo Santiago, Y.; Bayer, J.F.P.; Mariano, A.P. Thermodynamic Assessment of Different Feedstocks Gasification Using Supercritical Water and CO2 for Hydrogen and Methane Production. Eng 2025, 6, 12. [Google Scholar] [CrossRef]
- Ocampo Batlle, E.A.; Castillo Santiago, Y.; Venturini, O.J.; Escobar Palacio, J.C.; Silva Lora, E.E.; Yepes Maya, D.M.; Albis Arrieta, A.R. Thermodynamic and Environmental Assessment of Different Scenarios for the Insertion of Pyrolysis Technology in Palm Oil Biorefineries. J. Clean. Prod. 2020, 250, 119544. [Google Scholar] [CrossRef]
- Dada, T.K.; Sheehan, M.; Murugavelh, S.; Antunes, E. A Review on Catalytic Pyrolysis for High-Quality Bio-Oil Production from Biomass. Biomass Convers. Biorefin. 2023, 13, 2595–2614. [Google Scholar] [CrossRef]
- Safarian, S. Performance Analysis of Sustainable Technologies for Biochar Production: A Comprehensive Review. Energy Rep. 2023, 9, 4574–4593. [Google Scholar] [CrossRef]
- Lee, D.; Nam, H.; Seo, M.W.; Lee, S.H.; Tokmurzin, D.; Wang, S.; Park, Y.-K. Recent Progress in the Catalytic Thermochemical Conversion Process of Biomass for Biofuels. Chem. Eng. J. 2022, 447, 137501. [Google Scholar] [CrossRef]
- Mei, D.; Guo, D.; Wang, C.; Dai, P.; Du, J.; Wang, J. Evaluation of Esterified Pyrolysis Bio-Oil as a Diesel Alternative. J. Energy Inst. 2020, 93, 1382–1389. [Google Scholar] [CrossRef]
- Miranda, N.T.; Dianin, L.M.; Fernandes, D.S.; Filho, R.M.I.; MacIel, M.R.W. Experimental Study on Sugarcane Bagasse Pyrolysis in a Thermochemical Processes Pilot Plant. Chem. Eng. Trans. 2020, 80, 37–42. [Google Scholar] [CrossRef]
- de Sousa, F.P.; dos Reis, G.P.; Pasa, V.M.D. Catalytic Pyrolysis of Vegetable Oils over NbOPO4 for SAF and Green Diesel Production. J. Anal. Appl. Pyrolysis 2024, 177, 106314. [Google Scholar] [CrossRef]
- Terry, L.M.; Li, C.; Chew, J.J.; Aqsha, A.; How, B.S.; Loy, A.C.M.; Chin, B.L.F.; Khaerudini, D.S.; Hameed, N.; Guan, G.; et al. Bio-Oil Production from Pyrolysis of Oil Palm Biomass and the Upgrading Technologies: A Review. Carbon Resour. Convers. 2021, 4, 239–250. [Google Scholar] [CrossRef]
- Santiago, Y.C.; Pérez, J.F.; Mariano, A.P.; Sphaier, L.A. Characterization for Potential Uses of Char as a Byproduct from Co-Gasification of Oil Sludge and Palm Oil Waste-Biomass. Biomass Convers. Biorefin. 2025, 1–19. [Google Scholar] [CrossRef]
- Weber, K.; Quicker, P. Properties of Biochar. Fuel 2018, 217, 240–261. [Google Scholar] [CrossRef]
- Fardhyanti, D.S.; Megawati; Chafidz, A.; Prasetiawan, H.; Raharjo, P.T.; Habibah, U.; Abasaeed, A.E. Production of Bio-Oil from Sugarcane Bagasse by Fast Pyrolysis and Removal of Phenolic Compounds. Biomass Convers. Biorefin. 2024, 14, 217–227. [Google Scholar] [CrossRef]
- Treedet, W.; Suntivarakorn, R. Design and Operation of a Low Cost Bio-Oil Fast Pyrolysis from Sugarcane Bagasse on Circulating Fluidized Bed Reactor in a Pilot Plant. Fuel Process. Technol. 2018, 179, 17–31. [Google Scholar] [CrossRef]
- Osorio, J.; Chejne, F. Bio-Oil Production in Fluidized Bed Reactor at Pilot Plant from Sugarcane Bagasse by Catalytic Fast Pyrolysis. Waste Biomass Valorization 2019, 10, 187–195. [Google Scholar] [CrossRef]
- Ahmed, N.; Zeeshan, M.; Iqbal, N.; Farooq, M.Z.; Shah, S.A. Investigation on Bio-Oil Yield and Quality with Scrap Tire Addition in Sugarcane Bagasse Pyrolysis. J. Clean. Prod. 2018, 196, 927–934. [Google Scholar] [CrossRef]
- ASTM D5142-04; Standard Test Methods for Proximate Analysis of the Analysis Sample of Coal and Coke by Instrumental Procedures. ASTM: West Conshohocken, PA, USA, 2004; p. 5.
- ASTM D2015-00; Standard: Test Method for Gross Calorific Value of Coal and Coke by the Adiabatic Bomb Calorimeter. ASTM: West Conshohocken, PA, USA, 2000; p. 9.
- Etzler, F.M.; Deanne, R. Particle Size Analysis: A Comparison of Various Methods II. Part. Part. Syst. Charact. 1997, 14, 278–282. [Google Scholar] [CrossRef]
- ASTM D5373-08; Standard Test Methods for Instrumental Determination of Carbon, Hydrogen, and Nitrogen in Laboratory Samples of Coal. ASTM: West Conshohocken, PA, USA, 2008.
- Gao, W.; Zhang, M.; Wu, H. Bed Agglomeration during Fast Pyrolysis of Bio-Oil Derived Fuels in a Fluidized-Bed Reactor. Fuel 2022, 328, 125359. [Google Scholar] [CrossRef]
- Talwar, P.; Agudelo, M.A.; Nanda, S. Pyrolysis Process, Reactors, Products, and Applications: A Review. Energies 2025, 18, 2979. [Google Scholar] [CrossRef]
- Bieniek, A.; Sieradzka, M.; Jerzak, W.; Magdziarz, A. Fast Pyrolysis of Agricultural Biomass in Drop Tube Reactor for Bio-Oil Production: Numerical Calculations. J. Anal. Appl. Pyrolysis 2023, 176, 106241. [Google Scholar] [CrossRef]
- Rasaq, W.A.; Golonka, M.; Scholz, M.; Białowiec, A. Opportunities and Challenges of High-pressure Fast Pyrolysis of Biomass: A Review. Energies 2021, 14, 5426. [Google Scholar] [CrossRef]
- Toscano Miranda, N. Investigação Das Condições Operacionais Para Produção de Bio-Óleo e Biochar a Partir de Bagaço de Cana-de-Açúcar Por Meio de Simulação e Aplicação Em Planta Piloto; Universidade Estadual de Campinas: Campinas, Brazil, 2018. [Google Scholar]
- Toscano Miranda, N.; Lopes Motta, I.; Maciel Filho, R.; Wolf Maciel, M.R. Sugarcane Bagasse Pyrolysis: A Review of Operating Conditions and Products Properties. Renew. Sustain. Energy Rev. 2021, 149, 111394. [Google Scholar] [CrossRef]
- Suárez Useche, M.A.; Castillo Santiago, Y.; Restrepo, J.B.; Albis Arrieta, A.R.; Agámez Salgado, K.P. Evaluation of the Zinc Sulfate Catalytic Effect in Empty Fruit Bunches Pyrolysis. Processes 2022, 10, 1748. [Google Scholar] [CrossRef]
- Fajobi, M.O.; Lasode, O.A.; Adeleke, A.A.; Ikubanni, P.P.; Balogun, A.O. Investigation of Physicochemical Characteristics of Selected Lignocellulose Biomass. Sci. Rep. 2022, 12, 2918. [Google Scholar] [CrossRef]
- Najafi, H.; Golrokh Sani, A.; Sobati, M.A. A Comparative Evaluation on the Physicochemical Properties of Sugarcane Residues for Thermal Conversion Processes. Ind. Crops Prod. 2023, 202, 117112. [Google Scholar] [CrossRef]
- de Rezende, T.T.G.; Venturini, O.J.; Palacio, J.C.E.; de Oliveira, D.C.; de Souza Santos, D.J.; Lora, E.E.S.; Dovichi Filho, F.B. Technical and Economic Potential for Hydrogen Production from Biomass Residue Gasification in the State of Minas Gerais in Brazil. Int. J. Hydrogen Energy 2025, 101, 358–378. [Google Scholar] [CrossRef]
- Camargo, J.M.O.; Gallego-Ríos, J.M.; Neto, A.M.P.; Antonio, G.C.; Modesto, M.; Leite, J.T.C. Characterization of Sugarcane Straw and Bagasse from Dry Cleaning System of Sugarcane for Cogeneration System. Renew. Energy 2020, 158, 500–508. [Google Scholar] [CrossRef]
- Athira, G.; Bahurudeen, A.; Appari, S. Thermochemical Conversion of Sugarcane Bagasse: Composition, Reaction Kinetics, and Characterisation of By-Products. Sugar Tech. 2021, 23, 433–452. [Google Scholar] [CrossRef]
- Tan, H.; Lee, C.T.; Ong, P.Y.; Wong, K.Y.; Bong, C.P.C.; Li, C.; Gao, Y. A Review On The Comparison Between Slow Pyrolysis And Fast Pyrolysis On The Quality Of Lignocellulosic And Lignin-Based Biochar. IOP Conf. Ser. Mater. Sci. Eng. 2021, 1051, 12075. [Google Scholar] [CrossRef]
- Kalifa, M.A.; Habtu, N.G.; Jembere, A.L.; Genet, M.B. Characterization and Evaluation of Torrefied Sugarcane Bagasse to Improve the Fuel Properties. Curr. Res. Green Sustain. Chem. 2024, 8, 100395. [Google Scholar] [CrossRef]
- Hameed, Z.; Khan, Z.; Khurram, S.; Inayat, A.; Amin, N.; Aslam, M.; Watson, I. Co-Gasification Study of Blends of Municipal Solid Waste with Sugarcane Bagasse and Rice Husk Using the Coats-Redfern Method. J. Energy Inst. 2024, 113, 101542. [Google Scholar] [CrossRef]
- Pérez, N.P.; Pedroso, D.T.; Machin, E.B.; Antunes, J.S.; Tuna, C.E.; Silveira, J.L. Geometrical Characteristics of Sugarcane Bagasse for Being Used as Fuel in Fluidized Bed Technologies. Renew. Energy 2019, 143, 1210–1224. [Google Scholar] [CrossRef]
- Al-Rumaihi, A.; Shahbaz, M.; Mckay, G.; Mackey, H.; Al-Ansari, T. A Review of Pyrolysis Technologies and Feedstock: A Blending Approach for Plastic and Biomass towards Optimum Biochar Yield. Renew. Sustain. Energy Rev. 2022, 167, 112715. [Google Scholar] [CrossRef]
- Shen, Q.; Liaw, S.B.; Costa, M.; Wu, H. Rapid Pyrolysis of Pulverized Biomass at a High Temperature: The Effect of Particle Size on Char Yield, Retentions of Alkali and Alkaline Earth Metallic Species, and Char Particle Shape. Energy Fuels 2020, 34, 7140–7148. [Google Scholar] [CrossRef]
- Manatura, K. Inert Torrefaction of Sugarcane Bagasse to Improve Its Fuel Properties. Case Stud. Therm. Eng. 2020, 19, 100623. [Google Scholar] [CrossRef]
- Menezes, F.F.; Nascimento, V.M.; Gomes, G.R.; Rocha, G.J.; Strauss, M.; Junqueira, T.L.; Driemeier, C. Depolymerization of Enzymatic Hydrolysis Lignin: Review of Technologies and Opportunities for Research. Fuel 2023, 342, 127796. [Google Scholar] [CrossRef]
- Baloch, H.A.; Siddiqui, M.T.H.; Nizamuddin, S.; Mubarak, N.M.; Khalid, M.; Srinivasan, M.P.; Griffin, G.J. Catalytic Co-Liquefaction of Sugarcane Bagasse and Polyethylene for Bio-Oil Production under Supercritical Conditions: Effect of Catalysts. J. Anal. Appl. Pyrolysis 2021, 153, 104944. [Google Scholar] [CrossRef]
- Calderon Henao, N.; Venturini, O.J.; Castillo Santiago, Y.; Silva Lora, E.E.; Yepes Maya, D.M.; Pamplona, E.D.; Navarro Hoyos, J.S.; Ando Junior, O.H. Energy and Economic Assessment of a System Integrated by a Biomass Downdraft Gasifier and a Gas Microturbine. Processes 2022, 10, 2377. [Google Scholar] [CrossRef]
- Maitlo, G.; Ali, I.; Mangi, K.H.; Ali, S.; Maitlo, H.A.; Unar, I.N.; Pirzada, A.M. Thermochemical Conversion of Biomass for Syngas Production: Current Status and Future Trends. Sustainability 2022, 14, 2596. [Google Scholar] [CrossRef]
- Cai, W.; Luo, Z.; Zhou, J.; Wang, Q. A Review on the Selection of Raw Materials and Reactors for Biomass Fast Pyrolysis in China. Fuel Process. Technol. 2021, 221, 106919. [Google Scholar] [CrossRef]
- Treedet, W.; Suntivarakorn, R.; Mufandi, I.; Singbua, P. Improvement of Bio-Oil Production System by Using Spray Condenser: Investigation of Yields, Properties, and Production Cost. Bioenergy Res. 2022, 15, 1579–1594. [Google Scholar] [CrossRef]
- Wang, C.; Luo, Z.; Li, S.; Zhu, X. Coupling Effect of Condensing Temperature and Residence Time on Bio-Oil Component Enrichment during the Condensation of Biomass Pyrolysis Vapors. Fuel 2020, 274, 117861. [Google Scholar] [CrossRef]
- Bi, X. Gas Fluidization Flow Regimes. In Essentials of Fluidization Technology; John Wiley & Sons, Inc.: Hoboken, NJ, USA, 2020; pp. 55–74. ISBN 9783527699483. [Google Scholar]
- Nascimento, F.R.M.; González, A.M.; Silva Lora, E.E.; Ratner, A.; Escobar Palacio, J.C.; Reinaldo, R. Bench-Scale Bubbling Fluidized Bed Systems around the World—Bed Agglomeration and Collapse: A Comprehensive Review. Int. J. Hydrogen Energy 2021, 46, 18740–18766. [Google Scholar] [CrossRef]
- Jameson, G.J.; Cooper, L.; Tang, K.K.; Emer, C. Flotation of Coarse Coal Particles in a Fluidized Bed: The Effect of Clusters. Min. Eng. 2020, 146, 106099. [Google Scholar] [CrossRef]
- Li, L.; Zhao, Y.; Lian, W.; Han, C.; Zhang, Q.; Huang, W. Review on the Effect of Gas Distributor on Flow Behavior and Reaction Performance of the Bubble/Slurry Reactors. Ind. Eng. Chem. Res. 2021, 60, 10835–10853. [Google Scholar] [CrossRef]
- Benny, M.; Suraj, P.; Arun, P.; Muraleedharan, C. Agglomeration Behavior of Lignocellulosic Biomasses in Fluidized Bed Gasification: A Comprehensive Review. J. Therm. Anal. Calorim. 2023, 148, 9289–9308. [Google Scholar] [CrossRef]
- Barros, J.A.; Schneider, J.K.; Farrapeira, R.O.; Andrade, Y.B.; Krause, L.C.; Bjerk, T.R.; Caramão, E.B. Recovery of Waste Biomass: Pyrolysis and Characterization of Sugarcane Residues and Their Bio-Oils. Biofuels 2022, 13, 843–852. [Google Scholar] [CrossRef]
- Ordonez-Loza, J.; Chejne, F.; Jameel, A.G.A.; Telalovic, S.; Arrieta, A.A.; Sarathy, S.M. An Investigation into the Pyrolysis and Oxidation of Bio-Oil from Sugarcane Bagasse: Kinetics and Evolved Gases Using TGA-FTIR. J. Environ. Chem. Eng. 2021, 9, 106144. [Google Scholar] [CrossRef]
- da Silva Veiga, P.A.; Cerqueira, M.H.; Gonçalves, M.G.; da Silva Matos, T.T.; Pantano, G.; Schultz, J.; de Andrade, J.B.; Mangrich, A.S. Upgrading from Batch to Continuous Flow Process for the Pyrolysis of Sugarcane Bagasse: Structural Characterization of the Biochars Produced. J. Environ. Manag. 2021, 285, 112145. [Google Scholar] [CrossRef]
- Gautam, N.; Chaurasia, A. Study on Kinetics and Bio-Oil Production from Rice Husk, Rice Straw, Bamboo, Sugarcane Bagasse and Neem Bark in a Fixed-Bed Pyrolysis Process. Energy 2020, 190, 116434. [Google Scholar] [CrossRef]
- Chen, D.; Cen, K.; Zhuang, X.; Gan, Z.; Zhou, J.; Zhang, Y.; Zhang, H. Insight into Biomass Pyrolysis Mechanism Based on Cellulose, Hemicellulose, and Lignin: Evolution of Volatiles and Kinetics, Elucidation of Reaction Pathways, and Characterization of Gas, Biochar and Bio-Oil. Combust. Flame 2022, 242, 112142. [Google Scholar] [CrossRef]
- Hansen, S.; Mirkouei, A.; Diaz, L.A. A Comprehensive State-of-Technology Review for Upgrading Bio-Oil to Renewable or Blended Hydrocarbon Fuels. Renew. Sustain. Energy Rev. 2020, 118, 109548. [Google Scholar] [CrossRef]
Disclaimer/Publisher’s Note: The statements, opinions and data contained in all publications are solely those of the individual author(s) and contributor(s) and not of MDPI and/or the editor(s). MDPI and/or the editor(s) disclaim responsibility for any injury to people or property resulting from any ideas, methods, instructions or products referred to in the content. |
© 2025 by the authors. Licensee MDPI, Basel, Switzerland. This article is an open access article distributed under the terms and conditions of the Creative Commons Attribution (CC BY) license (https://creativecommons.org/licenses/by/4.0/).