Article

Digital Twin for Upstream and Downstream Integration of Virus-like Particle Manufacturing

1
Institute for Separation and Process Technology, Clausthal University of Technology, 38678 Clausthal-Zellerfeld, Germany
2
Faculty of Applied Natural Sciences, Technische Hochschule Köln, 51379 Leverkusen, Germany
*
Author to whom correspondence should be addressed.
Processes 2025, 13(7), 2101; https://doi.org/10.3390/pr13072101
Submission received: 15 April 2025 / Revised: 23 May 2025 / Accepted: 17 June 2025 / Published: 2 July 2025
(This article belongs to the Section Biological Processes and Systems)

Abstract

Virus-like particles (VLPs) have the potential to become a versatile carrier platform for vaccination against multiple diseases. In the light of short process development timelines and the demand for reliable and robust processes, metabolic modeling of cell culture processes offers great advantages when coupled with a Quality-by-Design (QbD) development approach. A previous work was able to demonstrate the accurate prediction of HEK293F PiggyBac cell concentration as well as VLP titer and metabolite production with a reduced metabolic model. This work presents the reduced metabolic model for a more productive cell line Sleeping Beauty and emphasizes the need for model re-parameterization when the producer cell line changes. The goal of precise prediction for a fed-batch and continuous HEK293 cultivation can, therefore, be achieved. In terms of decision-making for downstream unit operations, a soft sensor for the prediction of main impurities like proteins and DNA was introduced for the first time for the production of lentiviral vectors with several terms describing the release of impurities like DNA and proteins, growth-related protein production, and enzymatic degradation activity associated with cell dissociation in an accurate manner. The additional information can contribute to a more efficient design phase by reducing experimental effort as well as during cultivation with data-based decision-making. With the aid of real-time process data acquisition through process analytical technology (PAT), its predictive power can be enhanced and lead to more reliable processes.

1. Introduction

Virus-like particles (VLPs) can become the next generation of a versatile and flexible vaccine carrier platform [1,2]. As they do not carry genomic material for replication, VLPs are safe to handle and can be decorated with various antigens for a strong immunomodulatory effect [3,4]. Gag-VLPs mimic the structure of human immunodeficiency virus type 1 (HIV-1) and consist of an enveloped Gag-protein core [5]. Gag-VLP production in HEK293 suspension cells is widely utilized [6,7]. The cell lines used in this work were provided by the Stitz lab. The production vector systems derived from the parental transposons PiggyBac (PB) and Sleeping Beauty (SB) were used to generate stable lines expressing Gag proteins [8,9,10,11]. A previous study demonstrated the outperformance of the SB cell line regarding VLP titer and productivity compared to the PB cell line [12].
In the following section we briefly describe the current challenges in VLP production and how the implementation of modeling approaches can enhance not only the development process but can also lead to more reliable process control. Like other viral carrier platforms, the production of Gag-VLPs has to overcome multiple hurdles in the development process. Besides long timelines, the overall process often lacks high yields and purities [13,14]. This raises the demand for robust platform processes enabling the purification of VLPs from different feed streams as those are a good starting point for further optimization [12]. The gold standard to ensure product quality over the entire life cycle is the Quality-by-Design (QbD) process development approach. QbD defines design spaces for operational process parameters (critical process attributes, CPPs) in which it is ensured that critical quality attributes (CQAs) are met [15,16]. Process changes are possible even after approval when there is potential for further optimization.
One approach to gain a deeper process understanding can be achieved through model-based approaches. In the upstream (USP) those models can then predict harvest timepoints with low impurity levels, leading to better performance in the downstream (DSP) [17,18]. Several models have been developed recently to gain knowledge and better predict process parameters, which were then used to determine the CPPs and CQAs of a cultivation process [19,20]. While statistical models rely on many experimental data and can only be applied to their calibrated design space, a mechanistic model can overcome these limitations [19,21]. Mechanistic models in the USP mimic the cell metabolism with several degrees of complexity. While macroscopic models only identify extracellular concentrations of metabolites to calculate, for example, kinetic consumption and growth rates, metabolic models can also investigate intracellular concentrations by modeling the metabolic fluxes of several metabolic pathways [22,23,24].
As the full landscape of intra- and extracellular fluxes is rather complex and difficult to gain experimental data from, often only the main metabolic pathways are considered [25,26]. Those reduced metabolic models have shown good predictive capabilities [25,27,28,29]. Figure 1 shows all the pathways considered in the model presented in this work. It was first developed by Robitaille et al. for the prediction of monoclonal antibody production in CHO cells [29]. In recent studies the model adaptation to HEK293 cells for producing Gag-VLPs could be demonstrated successfully in different cultivation media [30,31]. The model consists of several major metabolic pathways that are mathematically described by multiplicative Michaelis–Menten kinetics with additional inhibition or activation kinetics. For biomass and product prediction, amino acid concentration and glycolysis dependent metabolites are introduced (dark blue). The glycolysis pathway metabolizes glucose into pyruvate (green) to feed the tricarboxylic acid cycle (TCA, bright blue). Redox equivalents like NADPH, NADH, and ATP as the energy resource are restored in a separate recycling pathway (orange). The overflow metabolism produces or consumes lactate and alanine (red) while amino acids can feed the TCA or recycling of redox equivalents (yellow).
The reduced metabolic model once calibrated to a specific cell line can be used to reduce the experimental effort during process development [32,33]. Optimizing feed compositions or implementing set-points for substrate concentrations in continuous applications can significantly affect upstream performance and lead to higher productivities and lower impurity levels [34]. When the model is integrated into a digital twin to control the upstream process and deviations are detected quickly, counteracting by adapting the inlet and outlet streams accordingly, these interventions can shift the process back to stable conditions. When a process somehow trends towards failure, the digital twin can abort the cultivation by applying certain thresholds from which the DSP still can purify the feed within the critical quality attributes defined. With the aid of a digital twin, the hold times of the complete process can also be reduced and lead to higher productivities by a factor of two as has been demonstrated in previous work [27].
In a fully integrated process, the final product titer, as well as impurity levels from the feed broth, are mandatory to control downstream processes. Therefore, the need for a digital twin to predict these parameters accurately is indispensable. In the case of VLP titer and the main impurities, DNA and total protein content, the direct measurement in real time with the aid of process analytical technology (PAT) is difficult to implement due to the heterogeneous culture broth and the overall low concentrations of those contents [18]. An indirect measurement of the accumulation of those variables can result in a soft sensor that predicts concentration and purity which will be presented in this study [35,36].

2. Materials and Methods

The VLP-producing HEK293 cell lines—here named PiggyBac and Sleeping Beauty referring to the respective transposon vector system used for their establishment—were cultivated in a 1 L Fed-Batch (2.5 L glass bioreactor, Sartorius, Göttingen, Germany) with Gibco Dynamis medium (Thermo Fisher Scientific, Waltham, MA, USA). When glucose fell under 2.5 g/L a bolus feed with HEK FS2 feed (Sartorius, Göttingen, Germany) was applied every 24 h to obtain final glucose concentrations between 2.5 and 3.0 g/L. The culture was harvested 1 day after the maximum viable cell density was reached. Sampling of the cultivation was performed daily to analyze viable cell density, product titer, metabolites, and impurities. For further method details the reader is referred to the previous study [12]. Viable cell density was determined automatically with the trypan blue exclusion method in a CEDEX XS system (Roche Holding, Basel, Switzerland). To determine the VLP product titer, a VPK-107-H HIV p24-specific ELISA was performed according to the manufacturer’s instructions (Bio-Cat GmbH, Heidelberg, Germany). Glucose and lactate measurements were analyzed electrochemically via biosensor (LaboTRACE compact, TRACE Analytics GmbH, Braunschweig, Germany). Amino acids were measured via RP-HPLC (InfinityLab Poroshell 120 HPH-C18, 3.0 × 100 mm, 2.7 µm, Agilent Technologies, Santa Clara, CA, USA). DNA content was determined by a fluorescence-based assay (Quant-iTTM PioGreen dsDNA Reagent kit, Thermo Fisher Scientific, Waltham, MA, USA). Total protein content was determined with a Bradford assay (Pierce Bradford Protein Assay, Thermo Fisher Scientific, Waltham, MA, USA).
The reduced metabolic model was first published by Robitaille et al. and model parameters were adapted to a HEK293 cell line [29,30,31]. In this study the previous Sleeping Beauty cultivation is modeled [12]. Further adaptations of the model were made beforehand to enhance its predictive power. The death term was modified from Alhuthali et al. to account for the exponential decline in viable cell concentration at the end of a cultivation [37]:
v d e a t h = k d e a t h , m a x e ( v i n h , N H 4 k d e a t h , H E K )
v i n h , N H 4 = v i n h , m a x N H 4 K d , N H 4 + N H 4
where kdeath,max and kdeath,HEK are cell-specific constants determined during cell parameterization. For additional description of the impurities, several kinetics and Monod equations were introduced:
c i m p u r i t y , i = m i m p u r i t y , i , c e l l   n c e l l s , d e a d V
v d e g r , i = n d e a d   c e l l s v d e g r   m a x , i c i K m , i + c i
v p r o t , g r o w t h = n c e l l s v p r o t , g r o w t h   m a x
cimpurity,i gives the concentration of the respective impurity i (protein or DNA) dependent on the number of dead cells and their contained protein and DNA amount. The protein content per cell was assumed to be 200 µg/mio. cells as a typical cell weighs about 1 ng and contains about 20% of protein [38]. DNA content was assumed to be 6 µg/mio. cells based on the literature for a typical mammalian cell [39]. The pH was modeled by the Henderson–Hasselbach equation which accounts for the carbonate species and the partial pressure of carbon dioxide for the respecting bicarbonate buffer system. To account for the reduction in pH due to the production of lactic acid, the buffer capacity β was introduced [40].
p H = p K a + l o g H C O 3 p C O 2
β = H + Δ p H
The dynamic simulations were solved by the Gear algorithm [41]. It is used for solving non-linear problems and can reduce its step size if needed. For the estimation of model parameter values, the NL2SOL solver was used. This module solves non-linear problems by reducing the partial least square error of the overall error function to determine the optimum of all model variables [42].

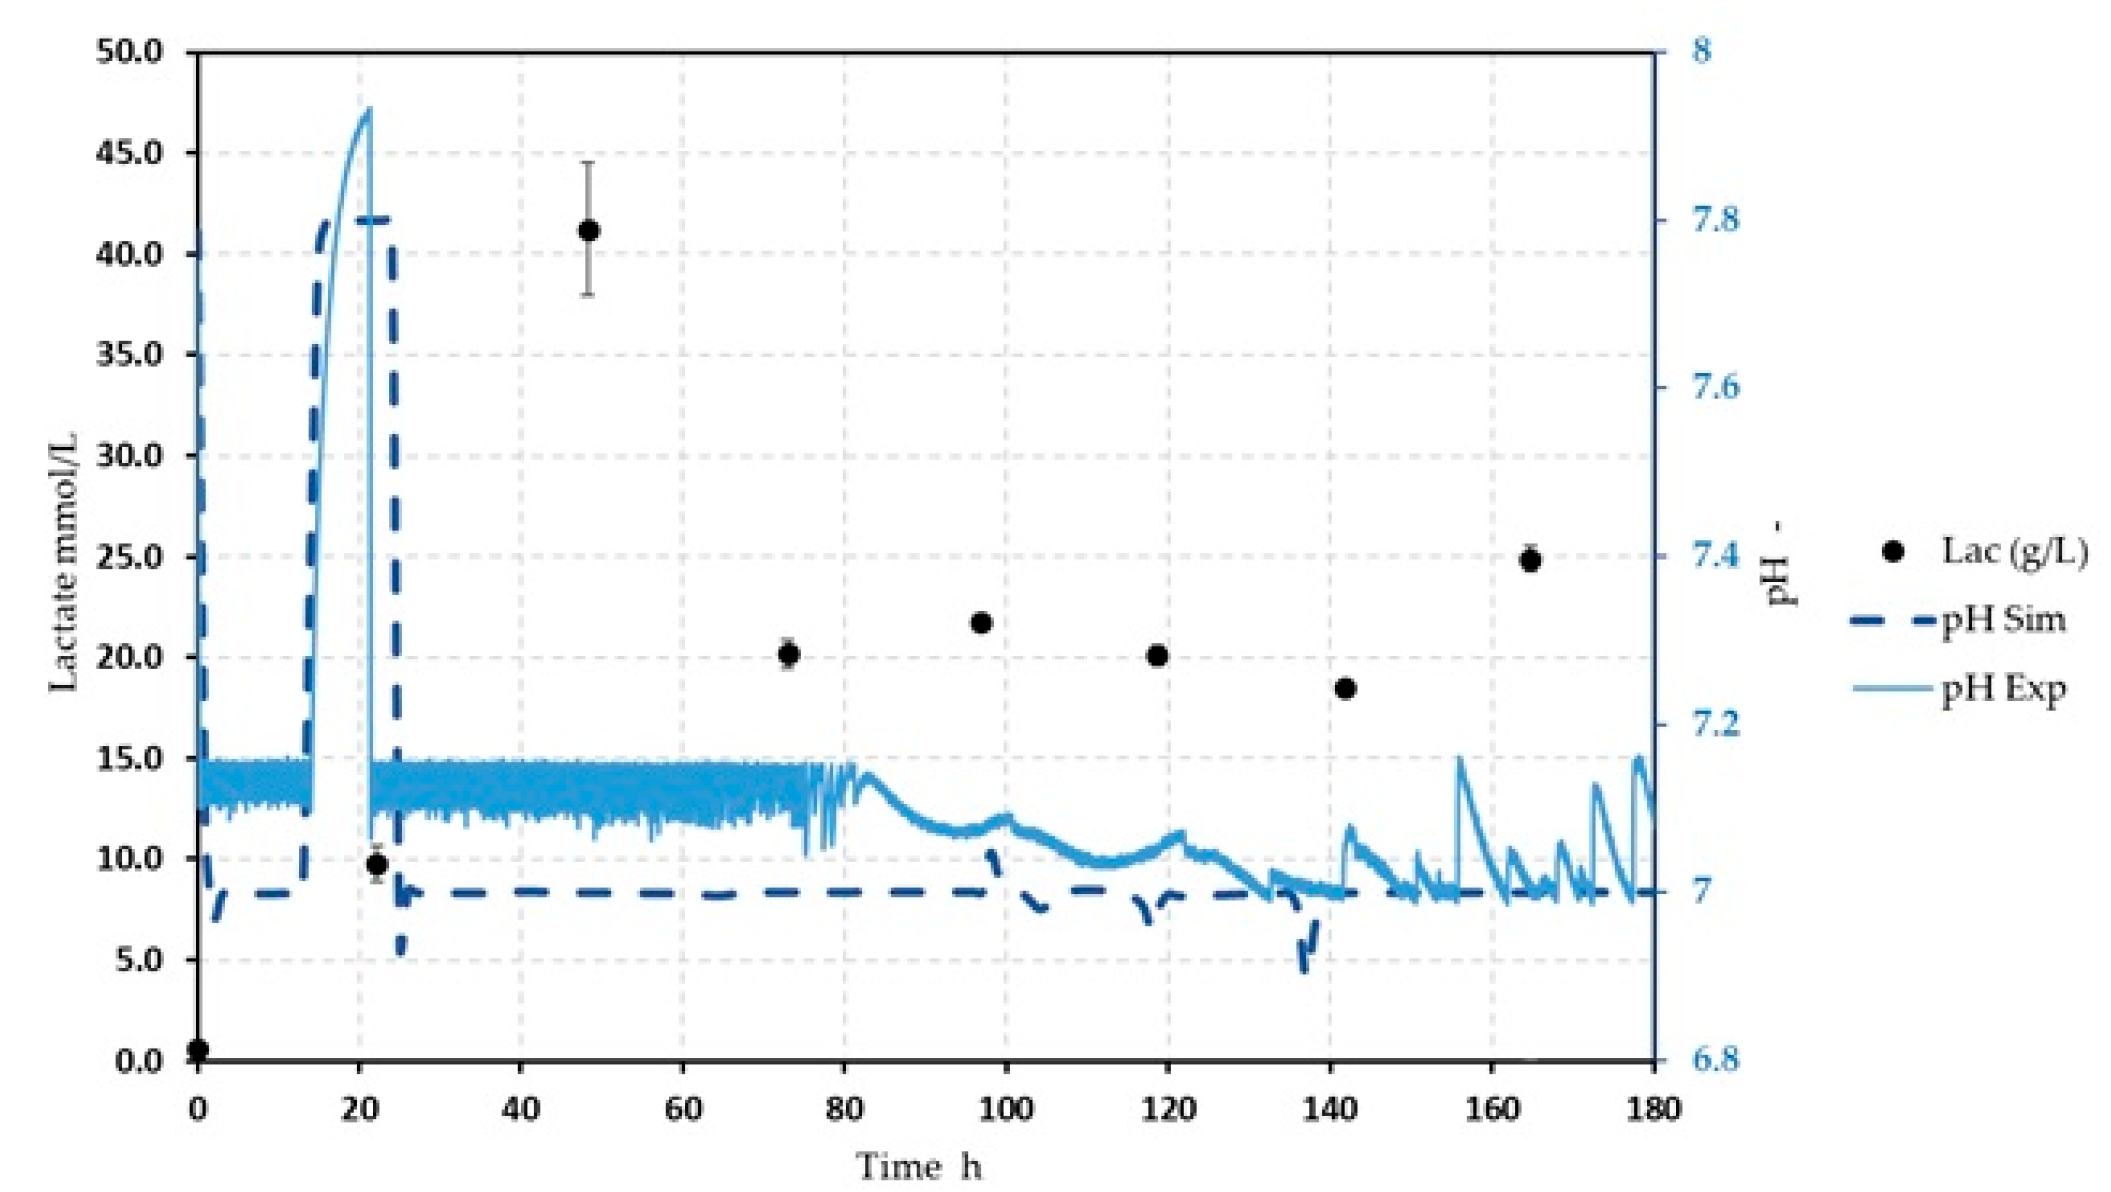
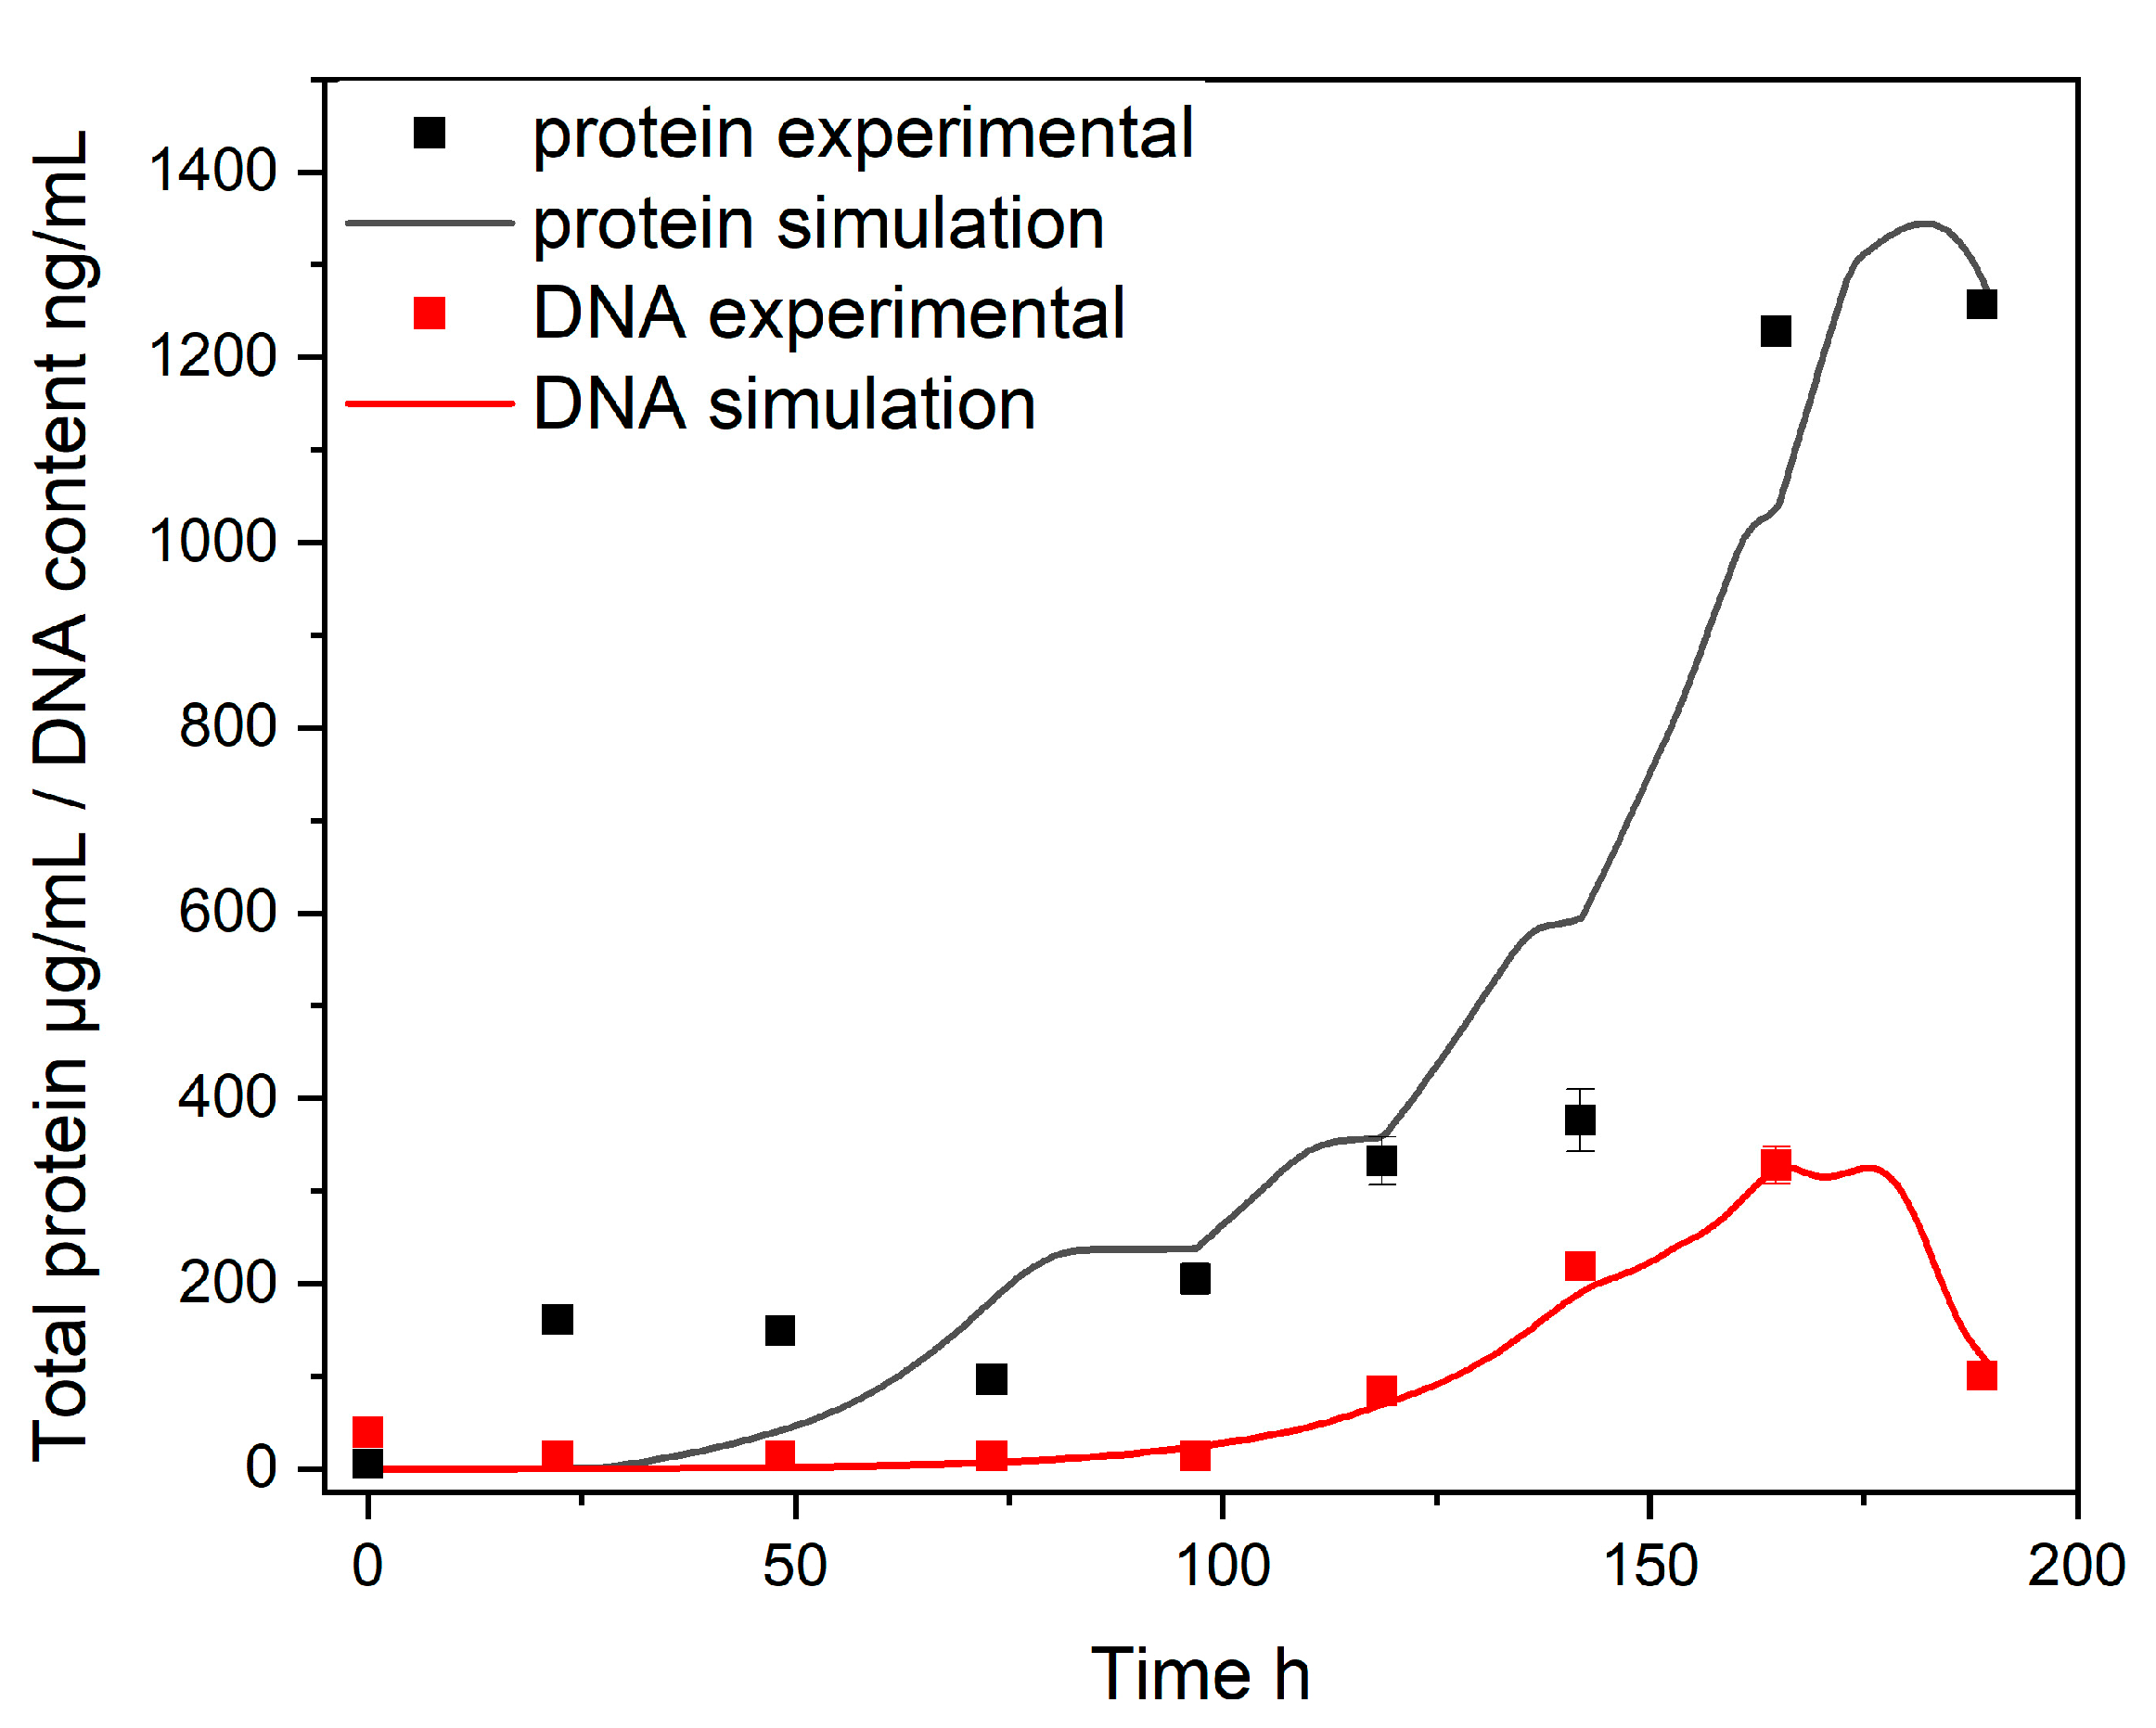
3. Results and Discussion

Literature data suggested that the reduced metabolic model cannot be applied to different cell lines [29,30]. The difference between cell lines PiggyBac (PB) and Sleeping Beauty (SB) originates from their respective parental transposon from which the vector systems were derived and used to incorporate the genomic information for Gag-VLP production into the host cells genomes [8,9,10,11]. To prove that thesis, simulations were run under the conditions applied to the Sleeping Beauty cultivation with model parameters obtained from PB cultivations [30].
Table 1 shows the relative difference between model parameters from PB to SB runs. The 41 parameters were chosen based on significance which was demonstrated from previous model parameterization steps [29,43]. Overall, most parameters values changed within the range of ±300%. The greatest changes in parameter values were obtained from parameters and kinetics that correlate with the main glycolysis and recycling reactions (KM ADP/ATP, KM G6P, and vPGI), overflow mechanism (vAlaTA, vGlnT, and vLDH), and amino acid metabolism feeding the TCA cycle (vASTA and vSDH). Lower values for Michaelis–Menten constants result in faster consumption/activation of kinetics, as can be seen for the ADP/ATP recycling mechanism. This is expected, as the SB cell line was more productive with a maximum productivity of 7.5 × 10⁸  VLPs / mL · h   compared to SB with a maximum productivity of 2.1 × 10⁸  VLPs / mL · h   [12]. Therefore, Sleeping Beauty displays a higher demand for energy and redox equivalents. As glucose consumption was comparable between PB and SB but the overall productivity was higher in SB, this justifies the higher value for KM G6P as this leads to slower intracellular glucose uptake. As the forward kinetic from vPGI is reduced and the reverse kinetic is enhanced, this leads to additional G6P that can be utilized in the recycling and biomass/product formation stream. Higher kinetics in the overflow metabolism are also expected as overall higher lactate production and consumption rates were observed in SB compared to PB [12]. While the lactate concentrations between both cell lines during the exponential phase of cultivation were comparable with 25 mM, the viable cell density at inoculum was 0.5 × 10⁶ cells/mL for SB and 1.3 × 10⁶ cells/mL for PB.
The results from the model parameterization to Sleeping Beauty led to a single set of constant parameters that can account for all three phases of the cultivation. Robitaille et al. also stated that subdividing cultivation into a lag, exponential, and death phase is not necessary as the initial parameters already can account for the whole upstream process [29]. Those findings were also consistent with our observations and emphasize the advantage of the presented reduced metabolic model as no further adaptions regarding the state of the cultivation phase need to be performed as the other groups had implemented [44,45]. From Table 1 the change in model parameters led to a precise prediction of the viable cell density, the product concentration, and the main metabolites glucose and lactate. The additional exponential death term implemented in the model led to the desired effect for exponential cell death at the end of cultivation where simulated data lie within the experimental error (see Figure 2a and Equations (1) and (2)). This behavior is necessary to better predict the transition from growth to death and therefore, the exponential release of impurities. The lactate plot (Figure 2b) shows a clear outlier at around 48 h which was a possible result of short-stressed cells due to a mass flow controller failure for CO2 aeration which led to a rise in pH as the medium was buffered by a bicarbonate system.
The literature already showed the self-buffering effect of cells under high pH conditions, which was possibly the reason for the spike in lactate concentration [46,47]. Figure 3 shows that the model can account for changes in pH like the CO2 mass flow controller failure (see Equations (6) and (7)). Those findings could be used in further model applications taking pH shifts into account and enhancing the predictability when those shifts occur [48].
Due to the fast consumption of excess lactate and the ongoing normal culture behavior regarding growth, glucose consumption, and lactate production, the cultivation batch was considered to perform in its normal operating range regardless of the MFC failure. Glucose consumption (Figure 2c) could accurately be simulated with the reduced metabolic model as well as VLP titer (Figure 2d). For the VLP titer the final product concentration is rather important for the downstream as the concentration steps during UF/DF determine load volumes for the chromatography step and need to be kept inside the normal operating range (NOR) to avoid the over- or under-loading of the chromatography column. The control strategy was discussed in detail for a fully autonomous process control strategy [30].
The amino acid (AA) composition over the course of cultivation can be seen in Figure 2e. For most amino acids, it was possible to predict the trend in consumption over the course of cultivation, with only aspartic acid, glutamic acid, and alanine not being predicted well. In previous works, the model also failed to predict those AAs accurately in HEK cells [30,31]. The results from a three factorial Design of Experiment showed that those amino acids were insignificant to parameters like maximum viable cell density, doubling time, and cell-specific productivity in the tested range which was defined for the design space [30]. Robitaille et al. also stated that the implemented mechanism for describing alanine and glutamic acid consumption as well as production might not be ideally implemented, therefore leading to less precise courses of those amino acids. Asparagine and glycine courses were also considered valid as those amino acids were not limiting substrates during cultivation, and the model was able to predict that course in a general trend. Overall, the model was able to provide a deeper understanding of amino acid consumption and can, therefore, be utilized for process design and control strategies.
To enhance the predictive power of the model, additional kinetics were introduced to describe the accumulation of impurities like DNA and total protein (see Equations (3)–(5)). Figure 4 shows the results predicted from Sleeping Beauty cultivation. A good agreement between the experimental and simulated data can be observed. At harvest, the simulated curves for DNA and protein content lie within the experimental error. Major differences for the total protein content are observed in the earlier stages of the cultivation, possibly due to additional protein accumulation not related to cell growth which was not covered by the model. From the course of the data, the growth-associated term clearly enhances the accuracy of the model. During later stages when the number of dead cells accumulate faster, an exponential rise in total protein correlates accordingly. On the other hand, the experimental course of DNA shows no rise during earlier stages underlying the release of DNA when cells die and dissociate. The release of proteases and DNases shows their effect only during the plateau and death phase of the fed-batch when the number of dead cells rises to its maximum [49].
The simple soft sensor based on growth-associated production and release during cell dissociation can help in the decision-making process of process design and during process control. The presented reduced metabolic model with adapted kinetics accounting for impurity accumulation can predict a whole cultivation with only one set of parameters. Predicting impurities establishes an innovative model for process design and predictable control within an integrated process lowering the analytical effort [30]. While the accumulation of DNA is only dependent on cell death, the release of proteins is also dependent on growth conditions. The reliability of the soft sensor should, therefore, be proven under different culture settings within a risk-based approach. The FDA recently published guidance for a risk-based credibility assessment to establish and evaluate artificial intelligence (AI) models [50]. It is reasonable to adopt those steps for the described model. To mitigate the risk of inaccurate predictions, additional process information can enhance the reliability of the model. PAT sensors such as the in situ microscope (SOPAT) or the established Raman spectroscopy can be utilized within a control strategy for critical process parameters like VCD or glucose concentration, resulting in reduced batch-to-batch variations leading to more robust soft sensors for impurity predictions [12,51,52].
When developing a process, feed strategies can be tested to enhance VLP titer or reduce impurity levels. Besides glucose, separate glutamine feeding can control the accumulation of ammonia which is a main contributor to cell death as glutamine is quickly metabolized under the release of ammonia [53]. Continuous processes controlled by a digital twin can meet their desired purity targets with higher accuracy, as real-time data acquisition and prediction of impurities is possible enabling autonomous processes. This so-called advanced process control (APC) reduces the cost of goods (COGs) by switching from batch-wise to continuous production and lowering personnel efforts, and also reduces the risk of failures as feed stream variabilities are minimized [54]. Previous work demonstrated the feasibility of the APC concept in VLP production to recover feed streams with variations in VLP titer for up to 10% and DNA fluctuations up to 600% [30]. Even under conditions where the digital twin cannot recover a failing trend, the introduction of abort scenarios with impurity and titer levels that still can be covered by the downstream process ultimately reduces the risk of total batch failure.

4. Conclusions

The presented reduced metabolic model covers central kinetics and pathways with parameter values that are unique to the tested cell lines PiggyBac and Sleeping Beauty. As the model had to undergo a re-parameterization step where most values varied within 300%, major differences in parameter values could be explained due to the higher productivity of Sleeping Beauty. The modeling of pH disturbance from a CO2 mass flow failure was also presented. The metabolic model with estimated parameter values for Sleeping Beauty was able to predict viable cell density, titer, and with the adapted kinetics able to predict growth-related protein production and the release of proteins and DNA during cell death. The simulated courses of those process parameters were all within the experimental error at the time of harvest and are of particular interest for the subsequent DSP to ensure successful purification enabling its applicability within a digital twin. The model can be beneficial to gain information from during process development, where different feeding strategies with glucose and glutamine were discussed. Within process control, the soft sensor for impurity quantification complements the data acquisition strategy via PAT sensors and offers purity calculations in real time [12]. That reduces the effort for offline analytics and optimizes endpoint definitions for purity and productivity determination at harvest. Those findings can then be implemented into the demonstrated integrated process with APC and reduce hold times by a factor of two [30]. Further research can aim at the integration of the reduced metabolic model into a fully autonomous and continuous process with the goal of maximizing VCD, reducing impurities, and extending process time by lowering process fluctuations leading to lower cost of goods [54].

Author Contributions

Conceptualization, J.S. (Jochen Strube); software, process, analytics, and experiments, S.B., A.H. and A.S.; writing—original draft preparation, S.B., A.H., A.S. and J.S. (Jochen Strube); writing—review and editing, S.B., A.H., A.S., K.K., J.S. (Jörn Stitz) and J.S. (Jochen Strube); supervision, J.S. (Jochen Strube); project administration, J.S. (Jochen Strube). All authors have read and agreed to the published version of the manuscript.

Funding

K.K. was supported by a grant from the German Federal Ministry of Education and Research, funding program Forschung an Fachhochschulen, contract number 13FH048KX1 to J.S. (Jörn Stitz). Otherwise, we acknowledge the support by Open Access Publishing Fund of Clausthal University of Technology.

Data Availability Statement

The original contributions presented in this study are included in the article.

Acknowledgments

The authors would like to thank their laboratory, mechanical, and electrical institute team. For their excellent laboratory work, the authors would also like to thank Kathy Khounsombath, Abirami Tharmalingam, and Nele Zielke. A special mention to Annett Wollmann from the particle science working group of Alfred Weber at TU Clausthal for the support with the DLS measurements and nanoparticle tracking analysis.

Conflicts of Interest

The authors declare no conflicts of interest.

References

  1. Kushnir, N.; Streatfield, S.J.; Yusibov, V. Virus-like Particles as a Highly Efficient Vaccine Platform: Diversity of Targets and Production Systems and Advances in Clinical Development. Vaccine 2012, 31, 58–83. [Google Scholar] [CrossRef] [PubMed]
  2. Hadj Hassine, I.; Ben M’hadheb, M.; Almalki, M.A.; Gharbi, J. Virus-like Particles as Powerful Vaccination Strategy against Human Viruses. Rev. Med. Virol. 2024, 34, e2498. [Google Scholar] [CrossRef] [PubMed]
  3. González-Domínguez, I.; Lorenzo, E.; Bernier, A.; Cervera, L.; Gòdia, F.; Kamen, A. A Four-Step Purification Process for Gag VLPs: From Culture Supernatant to High-Purity Lyophilized Particles. Vaccines 2021, 9, 1154. [Google Scholar] [CrossRef]
  4. Chackerian, B. Virus-like particles: Flexible Platforms for Vaccine Development. Expert Rev. Vaccines 2007, 6, 381–390. [Google Scholar] [CrossRef]
  5. Von Elling-Tammen, M.S.; Taft, F.; Thom, V.; Stitz, J.; Barbe, S.; Krause, A. Optimizing Nuclease Treatment to Enhance Anion Exchange Chromatography of HIV-Derived Virus-like Particles. J. Chromatogr. B 2025, 1256, 124539. [Google Scholar] [CrossRef]
  6. Deng, F. Advances and Challenges in Enveloped Virus-like Particle (VLP)-Based Vaccines. J. Immunol. Sci. 2018, 2, 36–41. [Google Scholar] [CrossRef]
  7. Petiot, E. Influence of HEK293 Metabolism on the Production of Viral Vectors and Vaccine. Vaccine 2015, 33, 5974–5981. [Google Scholar] [CrossRef]
  8. Rosengarten, J.F.; Schatz, S.; Wolf, T.; Barbe, S.; Stitz, J. Components of a HIV-1 Vaccine Mediate Virus-like Particle (VLP)-Formation and Display of Envelope Proteins Exposing Broadly Neutralizing Epitopes. Virology 2022, 568, 41–48. [Google Scholar] [CrossRef] [PubMed]
  9. Yusa, K.; Zhou, L.; Li, M.A.; Bradley, A.; Craig, N.L. A Hyperactive piggyBac Transposase for Mammalian Applications. Proc. Natl. Acad. Sci. USA 2011, 108, 1531–1536. [Google Scholar] [CrossRef]
  10. Bire, S.; Gosset, D.; Jégot, G.; Midoux, P.; Pichon, C.; Rouleux-Bonnin, F. Exogenous mRNA Delivery and Bioavailability in Gene Transfer Mediated by piggyBac Transposition. BMC Biotechnol. 2013, 13, 75. [Google Scholar] [CrossRef]
  11. Tschorn, N.; Van Heuvel, Y.; Stitz, J. Transgene Expression and Transposition Efficiency of Two-Component Sleeping Beauty Transposon Vector Systems Utilizing Plasmid or mRNA Encoding the Transposase. Mol. Biotechnol. 2023, 65, 1327–1335. [Google Scholar] [CrossRef] [PubMed]
  12. Baukmann, S.; Hengelbrock, A.; Katsoutas, K.; Stitz, J.; Schmidt, A.; Strube, J. Platform Process for an Autonomous Production of Virus-like Particles. ACS Omega 2025, 10, 3917–3929. [Google Scholar] [CrossRef] [PubMed]
  13. Cervera, L.; Gòdia, F.; Tarrés-Freixas, F.; Aguilar-Gurrieri, C.; Carrillo, J.; Blanco, J.; Gutiérrez-Granados, S. Production of HIV-1-based virus-like particles for vaccination: Achievements and limits. Appl. Microbiol. Biotechnol. 2019, 103, 7367–7384. [Google Scholar] [CrossRef] [PubMed]
  14. Bandeira, V.; Peixoto, C.; Rodrigues, A.F.; Cruz, P.E.; Alves, P.M.; Coroadinha, A.S.; Carrondo, M.J.T. Downstream Processing of Lentiviral Vectors: Releasing Bottlenecks. Hum. Gene Ther. Methods 2012, 23, 255–263. [Google Scholar] [CrossRef]
  15. Schmidt, A.; Helgers, H.; Vetter, F.L.; Zobel-Roos, S.; Hengelbrock, A.; Strube, J. Process Automation and Control Strategy by Quality-by-Design in Total Continuous mRNA Manufacturing Platforms. Processes 2022, 10, 1783. [Google Scholar] [CrossRef]
  16. Yu, L.X.; Amidon, G.; Khan, M.A.; Hoag, S.W.; Polli, J.; Raju, G.K.; Woodcock, J. Understanding Pharmaceutical Quality by Design. AAPS J. 2014, 16, 771–783. [Google Scholar] [CrossRef]
  17. Hogwood, C.E.; Bracewell, D.G.; Smales, C.M. Measurement and Control of Host Cell Proteins (HCPs) in CHO Cell Bioprocesses. Curr. Opin. Biotechnol. 2014, 30, 153–160. [Google Scholar] [CrossRef]
  18. Capito, F.; Skudas, R.; Stanislawski, B.; Kolmar, H. Matrix Effects during Monitoring of Antibody and Host Cell Proteins Using Attenuated Total Reflection Spectroscopy. Biotechnol. Prog. 2013, 29, 265–274. [Google Scholar] [CrossRef]
  19. Yatipanthalawa, B.S.; Gras, S.L. Predictive Models for Upstream Mammalian Cell Culture Development—A Review. Digit. Chem. Eng. 2024, 10, 100137. [Google Scholar] [CrossRef]
  20. Zehetner, L.; Széliová, D.; Kraus, B.; Graninger, M.; Zanghellini, J.; Hernandez Bort, J.A. Optimizing VLP Production in Gene Therapy: Opportunities and Challenges for in Silico Modeling. Biotechnol. J. 2023, 18, 2200636. [Google Scholar] [CrossRef]
  21. Bayer, B.; Duerkop, M.; Pörtner, R.; Möller, J. Comparison of Mechanistic and Hybrid Modeling Approaches for Characterization of a CHO Cultivation Process: Requirements, Pitfalls and Solution Paths. Biotechnol. J. 2023, 18, 2200381. [Google Scholar] [CrossRef] [PubMed]
  22. Ben Yahia, B.; Malphettes, L.; Heinzle, E. Macroscopic Modeling of Mammalian Cell Growth and Metabolism. Appl. Microbiol. Biotechnol. 2015, 99, 7009–7024. [Google Scholar] [CrossRef]
  23. Pimentel, G.A.; Dewasme, L.; Santos-Navarro, F.N.; Boes, A.; Côte, F.; Filée, P.; Wouwer, A.V. Macroscopic Dynamic Modeling of Metabolic Shift to Lactate Consumption of Mammalian Cell Batch Cultures. In Proceedings of the 2023 9th International Conference on Control, Decision and Information Technologies (CoDIT), IEEE, Rome, Italy, 3–6 July 2023; pp. 1–6. [Google Scholar]
  24. Martínez-Monge, I.; Albiol, J.; Lecina, M.; Liste-Calleja, L.; Miret, J.; Solà, C.; Cairó, J.J. Metabolic Flux Balance Analysis during Lactate and Glucose Concomitant Consumption in HEK293 Cell Cultures. Biotechnol. Bioeng. 2019, 116, 388–404. [Google Scholar] [CrossRef]
  25. Nolan, R.P. Dynamic Model of CHO Cell Metabolism. Metab. Eng. 2011, 13, 108–124. [Google Scholar] [CrossRef]
  26. Van Rosmalen, R.P.; Smith, R.W.; Martins Dos Santos, V.A.P.; Fleck, C.; Suarez-Diez, M. Model Reduction of Genome-Scale Metabolic Models as a Basis for Targeted Kinetic Models. Metab. Eng. 2021, 64, 74–84. [Google Scholar] [CrossRef] [PubMed]
  27. Hengelbrock, A.; Helgers, H.; Schmidt, A.; Vetter, F.L.; Juckers, A.; Rosengarten, J.F.; Stitz, J.; Strube, J. Digital Twin for HIV-Gag VLP Production in HEK293 Cells. Processes 2022, 10, 866. [Google Scholar] [CrossRef]
  28. Cloutier, M.; Perrier, M.; Jolicoeur, M. Dynamic Flux Cartography of Hairy Roots Primary Metabolism. Phytochemistry 2007, 68, 2393–2404. [Google Scholar] [CrossRef] [PubMed]
  29. Robitaille, J.; Chen, J.; Jolicoeur, M. A Single Dynamic Metabolic Model Can Describe mAb Producing CHO Cell Batch and Fed-Batch Cultures on Different Culture Media. PLoS ONE 2015, 10, e0136815. [Google Scholar] [CrossRef]
  30. Hengelbrock, A.; Probst, F.; Baukmann, S.; Uhl, A.; Tschorn, N.; Stitz, J.; Schmidt, A.; Strube, J. Digital Twin for Continuous Production of Virus-like Particles toward Autonomous Operation. ACS Omega 2024, 9, 34990–35013. [Google Scholar] [CrossRef]
  31. Helgers, H.; Hengelbrock, A.; Rosengarten, J.F.; Stitz, J.; Schmidt, A.; Strube, J. Towards Autonomous Process Control—Digital Twin for HIV-Gag VLP Production in HEK293 Cells Using a Dynamic Metabolic Model. Processes 2022, 10, 2015. [Google Scholar] [CrossRef]
  32. Sidoli, F.R.; Mantalaris, A.; Asprey, S.P. Modelling of Mammalian Cells and Cell Culture Processes. Cytotechnology 2004, 44, 27–46. [Google Scholar] [CrossRef] [PubMed]
  33. Li, F.; Vijayasankaran, N.; Shen, A.; Kiss, R.; Amanullah, A. Cell Culture Processes for Monoclonal Antibody Production. mAbs 2010, 2, 466–479. [Google Scholar] [CrossRef]
  34. Radhakrishnan, D.; Wells, E.A.; Robinson, A.S. Strategies to Enhance Productivity and Modify Product Quality in Therapeutic Proteins. Curr. Opin. Chem. Eng. 2018, 22, 81–88. [Google Scholar] [CrossRef]
  35. Brunner, V.; Siegl, M.; Geier, D.; Becker, T. Challenges in the Development of Soft Sensors for Bioprocesses: A Critical Review. Front. Bioeng. Biotechnol. 2021, 9, 722202. [Google Scholar] [CrossRef] [PubMed]
  36. Bayer, B.; Von Stosch, M.; Melcher, M.; Duerkop, M.; Striedner, G. Soft Sensor Based on 2D-fluorescence and Process Data Enabling Real-time Estimation of Biomass in Escherichia coli Cultivations. Eng. Life Sci. 2020, 20, 26–35. [Google Scholar] [CrossRef]
  37. Alhuthali, S.; Kontoravdi, C. Population Balance Modelling Captures Host Cell Protein Dynamics in CHO Cell Cultures. PLoS ONE 2022, 17, e0265886. [Google Scholar] [CrossRef]
  38. Bianconi, E.; Piovesan, A.; Facchin, F.; Beraudi, A.; Casadei, R.; Frabetti, F.; Vitale, L.; Pelleri, M.C.; Tassani, S.; Piva, F.; et al. An Estimation of the Number of Cells in the Human Body. Ann. Hum. Biol. 2013, 40, 463–471. [Google Scholar] [CrossRef]
  39. Russo, J.; Russo, I.H. Techniques and Methodological Approaches in Breast Cancer Research; Springer: New York, NY, USA, 2014; ISBN 978-1-4939-0717-5. [Google Scholar]
  40. Amaral Silva, D.; Al-Gousous, J.; Davies, N.M.; Bou Chacra, N.; Webster, G.K.; Lipka, E.; Amidon, G.; Löbenberg, R. Simulated, Biorelevant, Clinically Relevant or Physiologically Relevant Dissolution Media: The Hidden Role of Bicarbonate Buffer. Eur. J. Pharm. Biopharm. 2019, 142, 8–19. [Google Scholar] [CrossRef]
  41. Gear, C.W. Numerical Initial Value Problems in Ordinary Differential Equations; Prentice-Hall Series in Automatic Computation; Prentice-Hall: Englewood Cliffs, NJ, USA, 1971; ISBN 978-0-13-626606-8. [Google Scholar]
  42. Dennis, J.E.; Gay, D.M.; Walsh, R.E. An Adaptive Nonlinear Least-Squares Algorithm. ACM Trans. Math. Softw. 1981, 7, 348–368. [Google Scholar] [CrossRef]
  43. Helgers, H.; Schmidt, A.; Lohmann, L.J.; Vetter, F.L.; Juckers, A.; Jensch, C.; Mouellef, M.; Zobel-Roos, S.; Strube, J. Towards Autonomous Operation by Advanced Process Control—Process Analytical Technology for Continuous Biologics Antibody Manufacturing. Processes 2021, 9, 172. [Google Scholar] [CrossRef]
  44. Provost, A.; Bastin, G.; Agathos, S.N.; Schneider, Y.-J. Metabolic Design of Macroscopic Bioreaction Models: Application to Chinese Hamster Ovary Cells. Bioprocess Biosyst. Eng. 2006, 29, 349–366. [Google Scholar] [CrossRef]
  45. Dorka, P.; Fischer, C.; Budman, H.; Scharer, J.M. Metabolic Flux-Based Modeling of mAb Production during Batch and Fed-Batch Operations. Bioprocess Biosyst. Eng. 2009, 32, 183–196. [Google Scholar] [CrossRef]
  46. Liste-Calleja, L.; Lecina, M.; Lopez-Repullo, J.; Albiol, J.; Solà, C.; Cairó, J.J. Lactate and Glucose Concomitant Consumption as a Self-Regulated pH Detoxification Mechanism in HEK293 Cell Cultures. Appl. Microbiol. Biotechnol. 2015, 99, 9951–9960. [Google Scholar] [CrossRef] [PubMed]
  47. Trummer, E.; Fauland, K.; Seidinger, S.; Schriebl, K.; Lattenmayer, C.; Kunert, R.; Vorauer-Uhl, K.; Weik, R.; Borth, N.; Katinger, H.; et al. Process Parameter Shifting: Part I. Effect of DOT, pH, and Temperature on the Performance of Epo-Fc Expressing CHO Cells Cultivated in Controlled Batch Bioreactors. Biotechnol. Bioeng. 2006, 94, 1033–1044. [Google Scholar] [CrossRef] [PubMed]
  48. Großeholz, R.; Koh, C.-C.; Veith, N.; Fiedler, T.; Strauss, M.; Olivier, B.; Collins, B.C.; Schubert, O.T.; Bergmann, F.; Kreikemeyer, B.; et al. Integrating Highly Quantitative Proteomics and Genome-Scale Metabolic Modeling to Study pH Adaptation in the Human Pathogen Enterococcus faecalis. NPJ Syst. Biol. Appl. 2016, 2, 16017. [Google Scholar] [CrossRef] [PubMed]
  49. Geng, S.-L.; Zhao, X.-J.; Zhang, X.; Zhang, J.-H.; Mi, C.-L.; Wang, T.-Y. Recombinant Therapeutic Proteins Degradation and Overcoming Strategies in CHO Cells. Appl. Microbiol. Biotechnol. 2024, 108, 182. [Google Scholar] [CrossRef]
  50. O’Connor, T.F.; Chatterjee, S.; Lam, J.; De La Ossa, D.H.P.; Martinez-Peyrat, L.; Hoefnagel, M.H.N.; Fisher, A.C. An Examination of Process Models and Model Risk Frameworks for Pharmaceutical Manufacturing. Int. J. Pharm. X 2024, 8, 100274. [Google Scholar] [CrossRef]
  51. Costa, M.H.G.; Costa, M.S.; Painho, B.; Sousa, C.D.; Carrondo, I.; Oltra, E.; Pelacho, B.; Prosper, F.; Isidro, I.A.; Alves, P.; et al. Enhanced Bioprocess Control to Advance the Manufacture of Mesenchymal Stromal Cell-derived Extracellular Vesicles in Stirred-tank Bioreactors. Biotechnol. Bioeng. 2023, 120, 2725–2741. [Google Scholar] [CrossRef]
  52. Santos, R.M.; Kessler, J.; Salou, P.; Menezes, J.C.; Peinado, A. Monitoring mAb Cultivations with In-situ Raman Spectroscopy: The Influence of Spectral Selectivity on Calibration Models and Industrial Use as Reliable PAT Tool. Biotechnol. Prog. 2018, 34, 659–670. [Google Scholar] [CrossRef]
  53. Krampe, B.; Al-Rubeai, M. Cell Death in Mammalian Cell Culture: Molecular Mechanisms and Cell Line Engineering Strategies. Cytotechnology 2010, 62, 175–188. [Google Scholar] [CrossRef]
  54. Schmidt, A.; Helgers, H.; Vetter, F.L.; Juckers, A.; Strube, J. Fast and Flexible mRNA Vaccine Manufacturing as a Solution to Pandemic Situations by Adopting Chemical Engineering Good Practice—Continuous Autonomous Operation in Stainless Steel Equipment Concepts. Processes 2021, 9, 1874. [Google Scholar] [CrossRef]
Figure 1. Kinetic pathways of the reduced metabolic model. The main pathways are marked by their respective color. Green: glycolysis; dark blue: biomass/product formation; orange: recycling reactions; red: overflow mechanism; blue: tricarboxylic acid; yellow: amino acid metabolism. Dashed lines indicate inhibition and dotted lines indicate activation of kinetics. Adapted from Robitaille et al. [16].
Processes 13 02101 g001
Figure 2. Results from model parameterization to Sleeping Beauty. Experimental and simulation data from (a) viable cell density, (b) lactate, (c) glucose, (d) VLP product titer, and (e) amino acids are given. Experimental data are displayed by dots and simulation data are shown by solid lines.
Processes 13 02101 g002
Figure 3. Successful simulation of a CO2 mass flow controller failure with the Henderson–Hasselbach equation.
Processes 13 02101 g003
Figure 4. Results from impurity prediction of total protein content (black) and DNA content (red). Experimental data are displayed as dots and simulation data as solid lines.
Processes 13 02101 g004
Table 1. Relative change in model parameters obtained from the Sleeping Beauty parameterization compared to the PiggyBac model parameters. Model parameters that had the greatest changes are displayed in bold numbers.
ParameterSleeping Beauty to PiggyBac [%]ParameterSleeping Beauty to PiggyBac [%]
αAMP/ATP62vG6PDH max125
βAMP/ATP321vGlnT fmax21
KA AMP/ATP48vGlnT rmax58
KD G6P100vgrowth max40
Kgrowth dLAC125vHK max31
Kgrowth dNH4100vLDH fmax804
KM ADP/ATP25vLDH rmax501
KM ATP39vleak max30
KM G6P789vPC max100
KM NADH46vPDH max125
KM PYR40vPFK max84
vAAtoSuc max100vPGI fmax22
vAK fmax81vPGI rmax217
vAK rmax140vPGK max246
vAlaTA fmax262vPK max60
vAlaTA rmax889vPPRibP max125
vASTA max15vresp max82
vATPase max242vSDH max3
vCITS max64vSDHH fmax216
vCS max80vSDHH rmax113
vEP max80
Disclaimer/Publisher’s Note: The statements, opinions and data contained in all publications are solely those of the individual author(s) and contributor(s) and not of MDPI and/or the editor(s). MDPI and/or the editor(s) disclaim responsibility for any injury to people or property resulting from any ideas, methods, instructions or products referred to in the content.

