Abstract
To address the unclear coupling mechanism between bubble detachment behavior and acoustic characteristics in gas–liquid two-phase flow, this paper systematically studied bubble behavior and acoustic characteristics under different conditions by building a high-precision synchronous measurement system, combining acoustic signal analysis and bubble dynamics observation. The influence mechanism of liquid surface tension, dynamic viscosity, and orifice diameter on the critical gas flow velocity of bubble flow transition was analyzed, and a flow pattern classification criterion system was established. The experimental results showed that the bubble flow state could be divided into three states according to the characteristics of the acoustic signals: discrete bubble flow, single-chain bubble flow, and dual-stage chain bubble flow. The liquid surface tension and dynamic viscosity had no significant effect on the critical gas flow velocity of the transition from discrete bubble flow to single-chain bubble flow, but significantly increased the critical gas flow velocity of the transition from single-chain bubble flow to dual-stage chain bubble flow. The increase in the orifice diameter reduced the critical gas flow velocity of the two types of flow transition. In addition, the Weber number (We) and Galileo number (Ga) were introduced to construct a quantitative classification system of flow pattern, which provided theoretical support for the optimization of industrial gas–liquid two-phase flow.
1. Introduction
As a core medium for material transport and energy conversion, gas–liquid two-phase flow research has transcended the traditional boundaries of fluid mechanics to become deeply integrated into diverse domains of modern industrial innovation. Whether in megawatt-scale energy systems or millimeter-scale biomedical devices, gas–liquid interactions are ubiquitous, occurring across all aspects and scales of these systems [1,2]. In the engineering application scenario of gas–liquid two-phase flow, the dynamic characteristics of bubble detachment at the orifice are the key control factors for the optimization of mass transfer processes. On the one hand, the bubble size distribution dynamically reflects the real-time state characteristics of the flow system; on the other hand, the bubble detachment frequency directly affects the contact area and mass transfer efficiency by regulating interfacial renewal rates [3,4].
Based on current research, bubble flow patterns mainly include discrete bubble flow and chain bubble flow. Studying the evolution mechanisms of these patterns holds significant value in frontier fields such as chemical reactor design, marine acoustic monitoring, and microfluidic device development. For example, in a gas–liquid reaction engineering study, due to the limitation of gas–liquid contact area and contact degree, the effective collision frequency between gas–liquid molecules was low, which made it difficult to improve the overall reaction efficiency which was at a low level for a long time in discrete bubble flow [5]. In contrast, in chain bubble flow, with its unique bubble arrangement and flow mode, the gas–liquid contact area can be greatly expanded and the gas–liquid contact time can be effectively extended, thus significantly improving the reaction conversion rate at the macro level and effectively promoting the optimization and upgrading of chemical production efficiency [6].
From the analysis of acoustic characteristics, there may be complex physical interactions between bubble groups in different bubble flow patterns, and such interactions can induce unique acoustic characteristics, which can lead to different amplitude distributions and waveform structures of acoustic signals under different flow patterns. Therefore, it is of great theoretical exploration value and engineering application significance to reveal the internal mapping mechanism between bubble flow pattern and acoustic signal for the precise control of the flow state of multiphase flow systems.
Existing research has focused on bubble behavior and acoustic characteristics in pure water, while research on bubble detachment behavior and acoustic characteristics under different surface tension, dynamic liquid viscosity, and different orifice diameters is still insufficient [7]. In the actual industrial setting, gas often enters the liquid phase system with different surface tension, dynamic solution viscosity, and different orifice diameters [8]. When the above operating conditions change, whether the acoustic characteristics of bubbles will change in advance, that is, whether the critical gas flow rate of different bubble flow patterns to maintain stable flow will shift, still needs to be further explored. The research on this issue has a guiding role that cannot be ignored in realizing the fine control of industrial processes, optimizing equipment design, and ensuring the stable improvement of production efficiency.
Based on the above background information, bubble flow pattern was divided into three typical bubble flow patterns based on the significant characteristics of acoustic signals in the time domain distribution, and the influence mechanism of parameters such as the surface tension of liquid, the dynamic viscosity of liquid, and orifice diameter on the critical gas flow velocity of three flow pattern transitions was deeply analyzed. Two dimensionless parameters were introduced to construct a universal and scientific bubble flow pattern quantitative classification system, which provided an accurate classification basis for engineering designs involving gas–liquid two-phase flow, and promoted technological innovation and efficiency improvement in related fields.
2. Experiment
2.1. Equipment
The experimental platform consists of a water tank support system, data acquisition system, flow monitoring system, and gas supply pipeline system. The schematic diagram of the bubble behavior and acoustic characteristics synchronous measurement system is shown in Figure 1.
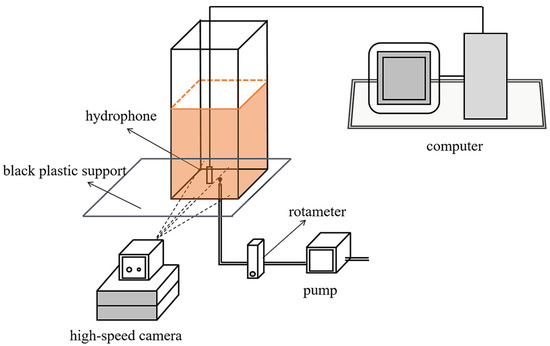
Figure 1.
Bubble behavior and acoustic characteristics synchronous measurement system diagram.
2.1.1. Water Tank Support System
The water tank support system consists primarily of an acrylic container and a black plastic support frame. Acrylic containers are made of high-transparency organic glass, which have excellent characteristics such as low density, fragmentation resistance, and chemical corrosion resistance. The structure is designed as a square with a bottom section of 250 mm × 250 mm and a regular cubic configuration with a vertical height of 300 mm. This geometric feature can effectively suppress the interference of acoustic reflection from the wall of the bubble dynamics experiment.
There are three kinds of small holes of 2 mm, 3 mm, and 4 mm in the center of the bottom of the container. The aperture range covers typical apertures such as tower equipment and underwater gas release devices. At the same time, the hollow cylindrical connection component with an inner diameter of 8 mm and an outer diameter of 10 mm can realize the stable connection between the experimental pipeline and the external gas source system, and ensure the stability of gas transmission during the experiment.
2.1.2. Data Acquisition System
The data acquisition system mainly includes two aspects, one is the image acquisition system, the other is the sound acquisition system, and the two are carried out simultaneously.
An important part of the image acquisition system is the high-speed camera and computer. Its core function is to record the changes in specific morphology with time during the generation and detachment of bubbles from the orifice in real time, and to visualize the morphological changes in bubbles from the orifice by selecting the appropriate number of frames. The type of high-speed camera used in the experiment is PCO.dimax: CS1 (Guangzhou Yuan ‘ao Instrument Co., Ltd., Guangzhou, China). The equipment is equipped with professional PCO.CamWare64 control software, which can accurately control the shooting parameters. Based on the flow field characteristics and image analysis requirements, the shooting parameters are set as: frame rate of 5000–10,000 fps and resolution of 1296 × 1024 dpi. This configuration scheme can realize the dynamic capture of bubble dynamic behavior under the premise of ensuring time resolution accuracy, and provide the original image data with a high signal-to-noise ratio for the subsequent flow field feature extraction.
The sound acquisition system is mainly composed of a Teledyne Reson TC-4013 hydrophone (Guangzhou Huiyang Information Technology Co. Ltd., Guangzhou, China), a USB8812 dynamic signal acquisition card (Guangzhou Huiyang Information Technology Co., Ltd., Guangzhou, China), and a computer. The core function of the system is to record the acoustic signal generated by the bubbles during their formation and detachment from the orifice. The system realizes accurate signal acquisition using a double sampling frequency setting: the main sampling frequency is set to be 10,000 Hz to cover the wide frequency domain signal, and the sampling frequency is set to be 1000 Hz to realize the high-precision extraction of the characteristic acoustic wave signal of the bubble dynamic process.
Considering that the intensity of the acoustic signal will change with the change in the distance between the hydrophone and the orifice, during the experiment, the hydrophone is accurately fixed at a distance of 20 ± 0.1 mm from the orifice using high-speed camera positioning technology [9]. Under this setting, the hydrophone has no effect on the formation of bubbles and their dynamic characteristics [10].
2.1.3. Flow Monitoring and Gas Supply Pipeline System
The flow monitoring and gas supply pipeline system is mainly composed of an air pump, a rotor flowmeter, and a pipeline. Its main function is to control the gas flow velocity, so that the external air flow through the system into the acrylic container generates bubbles. The air pump model used in the experiment is Fengying M, and the peristaltic pump model is LHZW002-18, which can provide a stable pressure volume flow. The rotor flowmeter model is LZB-3WB, with a maximum volume flow velocity of 500 mL/min, which can effectively control the volume flow velocity. The gas supply pipeline can provide a stable gas input channel. It adopts a nylon pipe, which has low fluid resistance and is easy to bend and install.
2.2. Experimental Materials
We explored the influence of surface tension and dynamic viscosity on the morphology of bubble formation, bubble detachment, and the generated acoustic signal. At the same time, considering that the experiment needs to have low cost, non-toxic, and harmless characteristics, this paper finally chose two substances: sodium dodecyl sulfate solution (Aladdin Reagent Co., Ltd., Shanghai, China) and polyvinyl alcohol solution (Tianjin Fengchuan Chemical Reagent Technology Co., Ltd., Tianjin, China)—their physical properties are shown in Table 1 and Table 2, respectively.

Table 1.
Properties of sodium dodecyl sulfate solution.
Table 2.
Properties of polyvinyl alcohol solution.
2.3. Experimental Method
2.3.1. Sound Signal Noise Reduction
In the laboratory environment, environmental noise usually shows relatively stable characteristics, and its main frequency components are concentrated below 300 Hz and above 3000 Hz. Therefore, a band-pass filter with a passband frequency range of 300–3000 Hz is chosen. At present, band-pass filters are divided into Infinite Impulse Response (IIR) and Finite Impulse Response (FIR) filters [11]. Compared with FIR filters, IIR filters can usually achieve similar filtering performance with fewer coefficients and have higher computational efficiency in many cases. Therefore, the IIR band-pass filter is selected to reduce the noise of the sound waveform, and then the relevant information about the acoustic waveform is obtained [12]. The frequency response curve of the IIR band-pass filter is shown in Figure 2. It can be seen from the figure that the frequencies below 300 Hz and above 3000 Hz are processed, and that the attenuation reaches more than 40 db. The energy retention rate of the target signal in the passband is high, which provides a guarantee for the accuracy of the experiment.
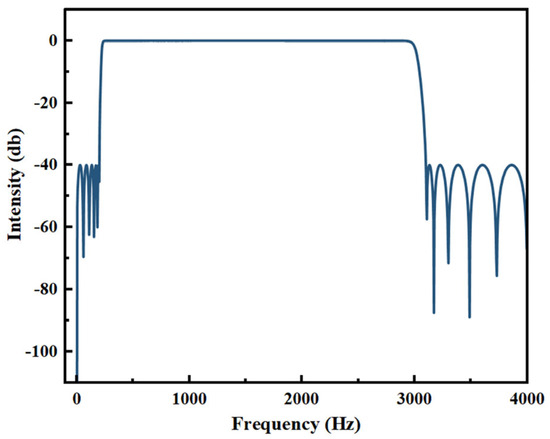
Figure 2.
Frequency response curve of IIR band-pass filter.
The time domain analysis shown in Figure 3 further proves the filtering effect: the original acoustic signal before noise reduction is disturbed by environmental noise and presents a cluttered spectrum. After the IIR band-pass filter is used, the non-passband noise is effectively suppressed, and the waveform of the target signal frequency band is completely preserved. The filtering scheme significantly improves the repeatability of the experimental method by accurately matching the noise spectrum characteristics.
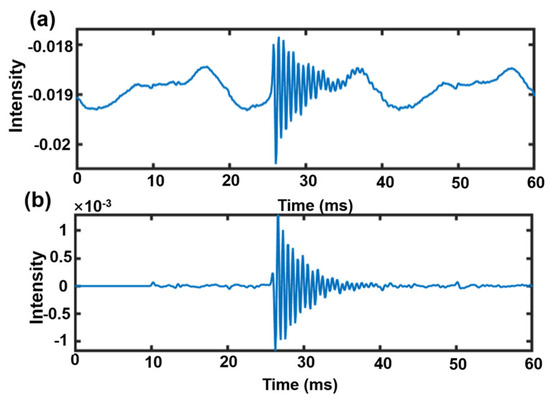
Figure 3.
Acoustic signal processing before and after comparison: (a) the original acoustic signal; (b) acoustic signal after noise reduction by IIR band-pass filter.
2.3.2. Framed Windowing
The core technique of framing technology is to use a fixed-length window to cut the passive acoustic signal in the time domain to form a short-term frame sequence. After framing, the stationary signal sequence can be constructed by extracting frame-by-frame features and recombining them along the time axis. The physical nature of the acoustic signal determines its short-term stationary characteristics: the vibration source can maintain an approximately stable state within the time scale of 2–10 ms, so the frame length of this study is set within this range.
In the process of framing, although the signal in the middle of each frame maintains a good continuity, there is significant information loss during the truncation of both ends of the frame [13]. In order to ensure the overall coherence of the signal, a windowing operation is introduced in this study. The essence of the windowing operation is to make a partial overlap area between two adjacent frames. This overlapping part is called frame shift, which reflects the distance that the window function moves each time on the time axis. According to conventional practice, the frame shift is set to half of the frame length.
Commonly used window functions include rectangular window, Hanning window, and Hamming window. Among them, Hamming window shows excellent performance advantages in reducing spectrum leakage due to its low high-frequency interference, low spectrum leakage, and the widest main lobe [14]. Based on this, this paper chooses Hamming window as the key tool of signal processing.
2.3.3. Frequency Domain Analysis
In the frequency domain analysis, this paper mainly uses the fast Fourier transform method to extract the main frequency of the acoustic signal [15]. In order to effectively extract acoustic signal information, the FFT length is set to 0.01 s in this paper. When the sampling point is insufficient, 0 is used to complete the audio clip.
3. Results
3.1. Bubble Flow Pattern
At a lower gas flow velocity, when there is only one bubble in the solution, or there are multiple bubbles, but the distance between these bubbles is far enough, the bubbles will not affect each other. At this time, the flow state of the bubbles is discrete bubble flow, as shown in Figure 4a. The acoustic signal waveform corresponding to discrete bubble flow is shown in Figure 4(a1). It can be seen that the acoustic signal waveform is basically monotonous. From Figure 4(a2) and Table 3, it can be seen that the acoustic signal in this flow state is dominated by natural frequency, the frequency range is 1000–1600 Hz (energy accounts for 90%), and there is no obvious harmonic component in the spectrum.
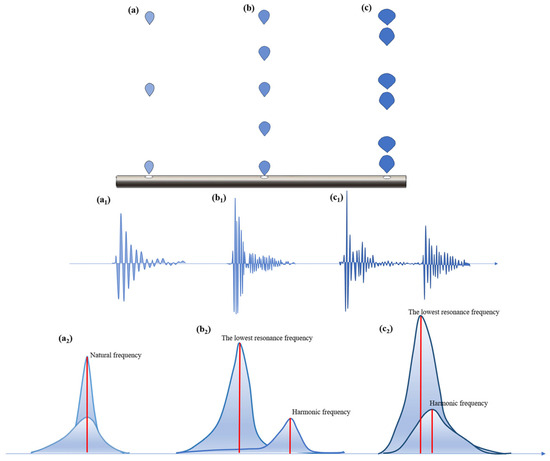
Figure 4.
Bubble flow state and acoustic signal under different bubble flow states: (a) bubble flow state, (a1) time domain diagram, and (a2) frequency domain corresponding to discrete bubble flow; (b) bubble flow state, (b1) time domain diagram, and (b2) frequency domain corresponding to single-chain bubble flow; (c) bubble flow state, (c1) time domain diagram, and (c2) frequency domain corresponding to dual-stage chain bubble flow.
Table 3.
Comparison of acoustic indexes of different bubble flow patterns.
With the increase in gas flow velocity, when the distance between bubbles is close enough, an obvious resonance phenomenon occurs between bubbles, and the bubble flow state changes from discrete bubble flow to single-chain bubble flow, as shown in Figure 4b [16]. Although the shape of the two bubbles does not interact with each other at this time, obvious differences can be seen in the acoustic signal, as shown in Figure 4(b1). It can be seen from the figure that the waveform of the bubble at this time shows a stage oscillation phenomenon. According to Figure 4(b2) and Table 3, the main frequency of the flow acoustics is the lowest resonance frequency, which is mainly in the range of 760–1000 Hz (energy ratio of 85%), and the second harmonic with an energy ratio of 5% appears in the frequency band of 1300–1600 Hz.
Then, with the further increase in gas flow velocity, the bubble flow pattern changed from single-chain bubble flow to dual-stage chain bubble flow. The bubbles begin to interact with each other in terms of shape, as shown in Figure 4c. Due to the influence of the wake flow of the previous bubble, the shape of the next bubble will change significantly, that is, the bottom angle of the previous bubble is much larger than that of the second bubble [17]. Correspondingly, the acoustic signal waveform characteristics of the bubbles appear alternately, and the adjacent acoustic signals show obvious differences. As shown in Figure 4(c1), it can be seen that since the bottom angle of the previous bubble is larger than the bottom angle of the second bubble, the highest peak value of the previous bubble is much larger than the peak value of the next bubble [18]. It can be seen from Figure 4(c2) and Table 3 that the lowest resonance frequency of this flow pattern is even lower than 760 Hz (energy ratio of 90%), and the harmonic frequency band gradually approaches the lowest resonance frequency.
It can be clearly observed from the above discussion that discrete bubble flow, single-chain bubble flow, and dual-stage chain bubble flow show significant differences in acoustic characteristics. In order to maintain the bubble system in the target flow state, the critical gas flow velocity when the acoustic signal characteristics change needs to be explored, which is shaped by the inertial characteristics of the flow field, the physical parameters of the fluid, and the geometric conditions. In the actual fluid system, the change in surface tension, dynamic viscosity, and orifice diameter may have an important influence on the change in flow state. The in-depth analysis of the influence of surface tension, dynamic viscosity, and orifice diameter on the critical gas flow velocity of these three typical flow transitions has important theoretical guiding significance for the prediction and control of flow patterns in engineering applications.
3.2. Effect of Surface Tension
3.2.1. The Effect of Surface Tension on the Critical Gas Flow Velocity of Discrete to Single-Chain Bubble Flow Transition
Figure 5 shows the influence of surface tension on the critical gas flow velocity of the discrete to single-chain bubble flow transition under different orifice diameters. The experimental results show that when the surface tension increases from 0.04 N/m to 0.07 N/m, the critical gas flow velocities are stable at 0.111 ± 0.006 m/s, 0.07 ± 0.004 m/s, and 0.04 ± 0.002 m/s in the systems with orifice diameters of 2 mm, 3 mm, and 4 mm, respectively, which indicates that the change in surface tension basically does not affect the critical gas flow velocity of the discrete to single-chain bubble flow state transition. This phenomenon can be explained by the interface dynamic coupling effect, as shown in Figure 6.
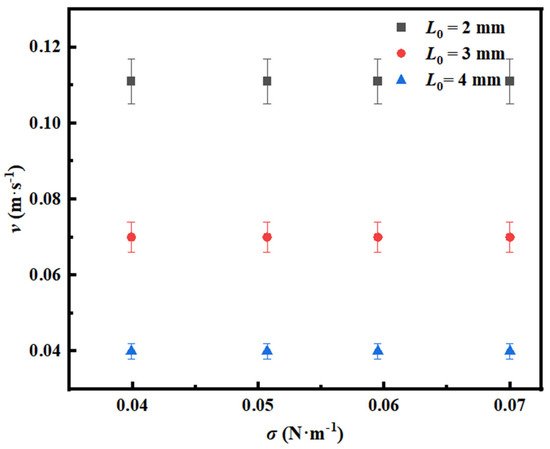
Figure 5.
Effect of surface tension on the critical gas flow velocity of the discrete to single-chain bubble flow transition.
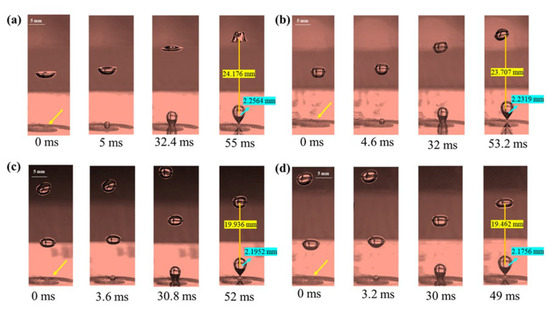
Figure 6.
Effect of surface tension on bubble formation under the conditions of gas flow velocity of 0.111 m/s and orifice diameter of 2 mm: (a) 0.07 N/m; (b) 0.06 N/m; (c) 0.05 N/m; (d) 0.04 N/m.
As shown in Figure 6, under the condition of a gas flow velocity of 0.111 m/s and orifice diameter of 2 mm, the increase in surface tension will lead to the increase in bubble radius and bubble spacing. The phenomenon can be explained as follows: As the surface tension increases, the rear interface of a growing bubble extends backward along the liquid phase, while the front interface continuously stretches, forming new gas–liquid interfaces. When the bubble surface near the orifice is subjected to squeezing, the liquid accumulates at the orifice edge, enhancing interfacial adhesion and significantly delaying the bubble detachment process [19]. This mechanism directly leads to the increase in bubble radius from 2.1756 mm to 2.2564 mm. The increase in surface tension will aggravate the shrinkage rate at the bottom of the bubble and accelerate the rising speed of the bubble, which leads to the increase in bubble spacing [18]. Because the influence of the two on the critical gas flow velocity offsets each other, the critical gas flow velocity finally remains stable when the surface tension changes.
3.2.2. The Effect of Surface Tension on the Critical Gas Flow Velocity of Single- to Dual-Stage Chain Bubble Flow Transition
Figure 7 shows the influence of surface tension on the critical gas flow velocity of the single- to dual-stage chain flow transition under different orifice diameters. When the surface tension increases from 0.04 N/m to 0.07 N/m, the critical gas flow velocity shows a significant increasing trend in the system with the corresponding orifice diameters of 2 mm, 3 mm, and 4 mm. The specific reasons behind this phenomenon can be further learned from Figure 8.
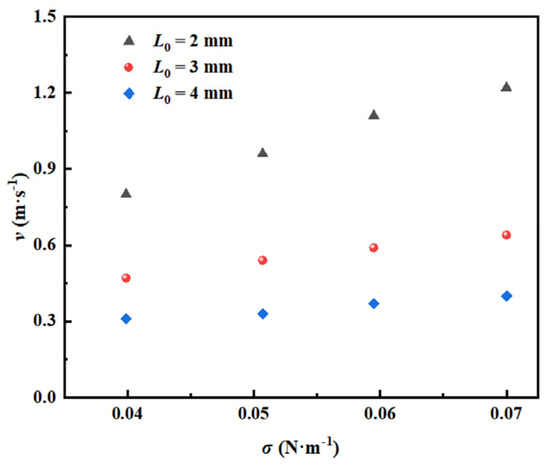
Figure 7.
Effect of surface tension on the critical gas flow velocity of the single- to dual-stage chain bubble flow transition.
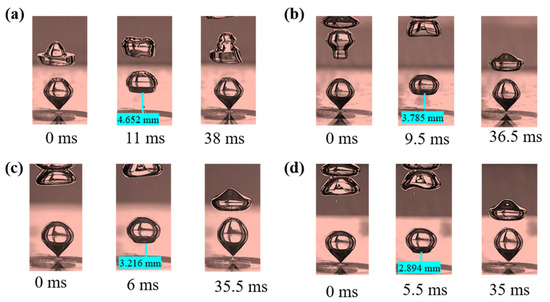
Figure 8.
The effect of surface tension on bubble formation under the conditions of gas flow velocity of 0.8 m/s and orifice diameter of 2 mm: (a) 0.07 N/m; (b) 0.06 N/m; (c) 0.05 N/m; (d) 0.04 N/m.
It can be seen from Figure 8 that the surface tension increases under the conditions of a constant orifice diameter and gas flow velocity, and that the time interval of the second bubble formation is prolonged. Meanwhile, the increase in surface tension accelerates the shrinkage rate of the bubble bottom. The synergistic effect of the two makes the distance between the lower surface of the first bubble and the upper surface of the second bubble increase from 2.894 mm to 4.652 mm with the increase in surface tension. When the distance exceeds the critical interaction distance, the disturbance effect of the first bubble on the second bubble formation process is significantly weakened. Therefore, in order to realize the transition from single-chain bubble flow to dual-stage chain bubble flow, the decoupling effect caused by the increase in surface tension must be compensated for by increasing the gas flow velocity.
3.3. The Influence of Dynamic Viscosity
3.3.1. The Effect of Dynamic Viscosity on the Critical Gas Flow Velocity of Discrete to Single-Chain Bubble Flow Transition
Figure 9 shows the effect of dynamic viscosity on the critical gas flow velocity of the discrete to single-chain bubble flow transition under different orifice diameters. The experimental data show that when the dynamic viscosity increases from 0.0044 Pa·s to 0.0161 Pa·s, the critical gas flow velocities of the corresponding orifice diameters 2 mm, 3 mm, and 4 mm systems are stable at 0.111 ± 0.006 m/s, 0.07 ± 0.004 m/s, and 0.04 ± 0.002 m/s, respectively, which indicates that the change in dynamic viscosity does not significantly change the critical condition of flow pattern transition. The physical mechanism of this phenomenon can be explained by the bubble dynamics characteristics revealed in Figure 10.
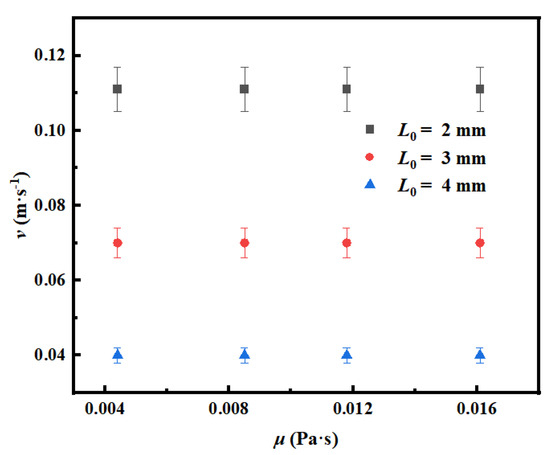
Figure 9.
The effect of dynamic viscosity on the critical gas flow velocity of the discrete to single-chain bubble flow transition.
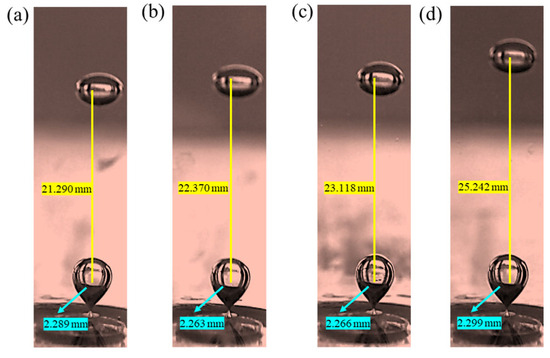
Figure 10.
Under the conditions of gas flow velocity of 0.111 m/s and orifice diameter of 2 mm, the effect of dynamic viscosity on bubble formation: (a) 0.016 Pa·s; (b) 0.012 Pa·s; (c) 0.008 Pa·s; (d) 0.004 Pa·s.
It can be seen from Figure 10 that the bubble radius remains constant (2.25 ± 0.05 mm) with the change in liquid dynamic viscosity at the gas flow velocity of 0.111 m/s and 2 mm orifice diameter, which is mainly attributed to the fact that the bubble formation process is dominated by surface tension at low gas flow velocity. At this time, the control effect of surface tension on bubble detachment behavior is significantly stronger than that of inertial force and viscous force [20]. It is worth noting that with the increase in liquid dynamic viscosity, the bubble spacing decreases from 25.242 mm to 21.290 mm, which is due to the change in momentum diffusion velocity in the wake region caused by the enhancement of the viscous dissipation effect. At the same time, when the dynamic viscosity increases to 0.0161 Pa·s, the dissipation of acoustic energy by the viscous medium weakens the acoustic coupling effect between bubbles. The synergistic effect of the above competition mechanism eventually leads to the stability of the critical gas flow velocity within the dynamic viscosity range in the experiment.
3.3.2. The Effect of Dynamic Viscosity on the Critical Gas Flow Velocity of Single- to Dual-Stage Chain Bubble Flow Transition
Figure 11 shows the effect of dynamic viscosity on the critical gas flow velocity of the single- to dual-stage chain bubble flow transition under different orifice diameters. It can be seen from the figure that in the system with orifice diameters of 2 mm, 3 mm, and 4 mm, the critical gas flow velocity increases gradually with the increase in dynamic viscosity. The specific reason can be seen in Figure 12.
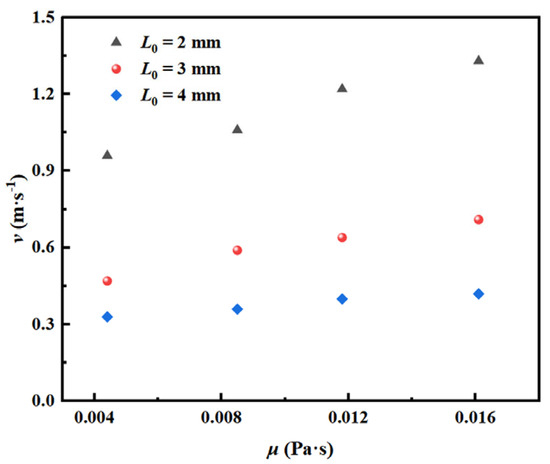
Figure 11.
The effect of dynamic viscosity on the critical gas flow velocity of the single- to dual-stage chain bubble flow transition.
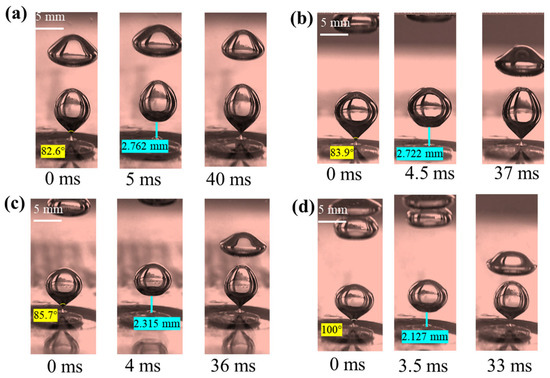
Figure 12.
Under the conditions of gas flow velocity of 0.8 m/s and orifice diameter of 2 mm, the effect of dynamic viscosity on bubble formation: (a) 0.016 Pa·s; (b) 0.012 Pa·s; (c) 0.008 Pa·s; (d) 0.004 Pa·s.
It can be seen from Figure 12 that in the bubble formation stage, the dynamic viscosity significantly inhibits the liquid phase flow, resulting in an asymmetric pressure gradient on both sides of the bubble interface. Due to the significant increase in flow resistance at high dynamic viscosity, the strength of the vortex ring structure between the bubble and the bottom of the orifice in the velocity field is weakened, which inhibits the momentum transfer of the transverse expansion of the bubble. At the same time, in high dynamic viscous fluid, the transverse pressure gradient is weakened by dynamic viscous damping, forming a longitudinally dominant pressure driving mechanism [21]. Therefore, this mechanism causes the aspect ratio of the bubble to increase monotonously with the increase in the power. This morphological evolution directly leads to the decrease in the contact angle at the bottom of the bubble from 102° in the low-viscosity system to 68°in the high-viscosity system, and the increase in the bottom angle of the bubble significantly reduces the rising rate of the bubble. Meanwhile, the liquid viscosity delay effect significantly affects the bubble dynamics. In the high dynamic viscosity system, the free surface relaxation time after the first bubble detachment is significantly longer than that in the low viscosity fluid, which directly leads to a significant increase in the occurrence time of secondary bubbles. Therefore, the coupling effect of time delay and velocity gradient makes the distance between the lower surface of the previous bubble and the upper surface of the next bubble increase from 2.127 mm to 2.762 mm with the increase in dynamic viscosity. When the distance exceeds the critical value, the flow field disturbance intensity generated by the previous bubble is not enough to affect the bubbles behind it. At this time, the gas flow velocity must be increased to above the critical value to make the bubbles interact with each other, and then realize the transition from a single- to a dual-stage chain flow state.
3.4. The Influence of Orifice Diameter
3.4.1. The Effect of Orifice Diameter on the Critical Gas Flow Velocity of Discrete to Single Bubble Chain Flow Transition
Figure 13 illustrates the influence of orifice diameter on the critical gas flow velocity for the transition from discrete to single-chain bubble flow in different solutions. It is evident that the critical gas flow velocity required to initiate this flow regime transition gradually decreases with increasing orifice diameter across all tested solutions. The underlying mechanism can be elucidated through the analysis in Figure 14.
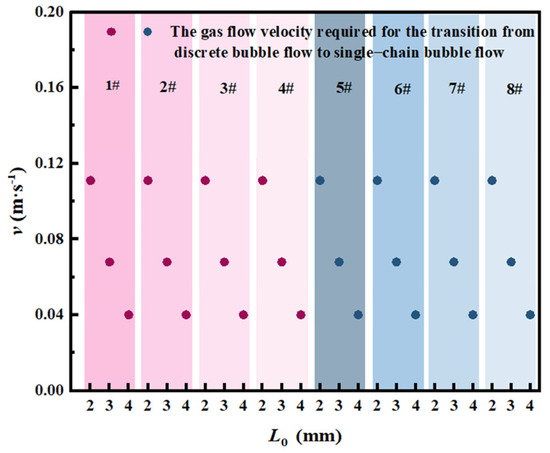
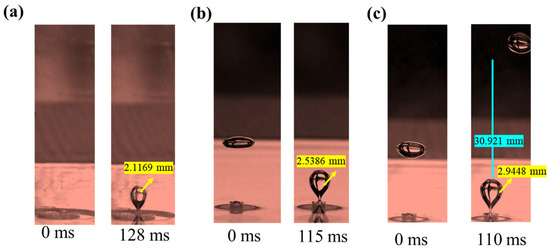
Figure 14.
Under the conditions of gas flow velocity of 0.05 m/s and in solution 1#, the effect of orifice diameters on bubble formation: (a) 2 mm; (b) 3 mm; (c) 4 mm.
Figure 14 demonstrates that at a constant gas flow velocity, an increase in orifice diameter leads to a corresponding enhancement in gas flow rate, resulting in larger bubble radii at detachment. Furthermore, the expansion of the orifice diameter reduces the pressure drop resistance at the gas–liquid interface, facilitating smoother gas penetration into the liquid phase, resulting in a decrease in the spacing between the two bubbles. These observations indicate that smaller orifice diameters necessitate higher gas flow velocities to achieve the transition from discrete bubble flow to single-chain bubble flow.
3.4.2. Effect of Orifice Diameter on the Critical Gas Flow Velocity of Single- to Dual-Stage Chain Bubble Flow Transition
Figure 15 illustrates the influence of orifice diameter on the critical gas flow velocity for the flow regime transition from single- to dual-stage chain bubble patterns in various solutions. The results demonstrate that the critical gas flow velocity decreases gradually with increasing orifice diameter across all tested solutions. The underlying mechanism of this phenomenon can be explained through the observations presented in Figure 16.
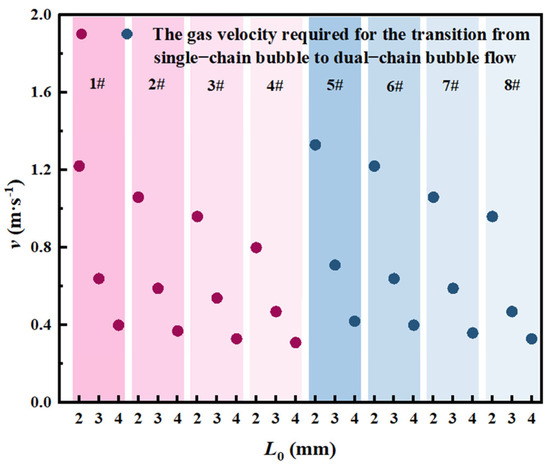
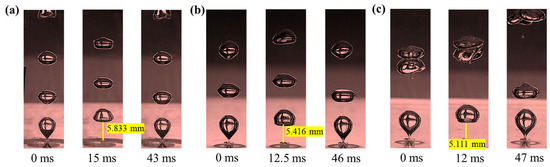
Figure 16.
Under the conditions of gas flow velocity of 0.4 m/s and in solution 1#, the effect of orifice diameters on bubble formation: (a) 2 mm; (b) 3 mm; (c) 4 mm.
As shown in Figure 16, systems with larger orifice diameters exhibit higher volumetric flow velocities during bubble generation under identical gas flow velocity conditions. Following the detachment of the initial bubble, the augmented gas volumetric flow velocity significantly shortens the time interval required for subsequent bubble formation. This acceleration reduces the vertical spacing between the lower surface of the preceding bubble and the upper surface of the following bubble as the orifice diameter increases. The diminished inter-bubble distance enhances hydrodynamic interactions, where the flow characteristics of the preceding bubble exert a substantial influence on the formation dynamics of subsequent bubbles. Consequently, the critical gas flow velocity required for the transition from single- to dual-stage chain bubble flow regimes shows a marked reduction with increasing orifice diameter.
3.5. Quantitative Classification of Bubble Flow Pattern
As demonstrated in the preceding discussion, this work systematically and comprehensively investigates the roles and influences of gas flow velocity, liquid surface tension, liquid viscosity, and orifice size on distinct flow regimes. Given that the study involves multiple critical parameters, including gas flow velocity, orifice size, liquid dynamic viscosity, and liquid surface tension, this study employs the Weber number (We) and the Galileo number (Ga) as classification criteria to scientifically and effectively analyze bubble flow patterns. By leveraging these two dimensionless numbers, a detailed classification and in-depth investigation of bubble flow regimes are conducted.
The We represents the ratio of inertial forces to surface tension forces, as expressed by the following Equation (1):
where ρ0, L0, v, and σ are the density of the liquid (kg·m−3), orifice diameter (mm), gas flow velocity (m·s−1), and surface tension of the liquid (N·m−1).
The Ga represents the dimensionless ratio of gravitational forces to viscous forces, as expressed by the following Equation (2):
where g and σ are the acceleration of gravity (m·s−2) and dynamic viscosity of the liquid (Pa·s).
Figure 17 displays a bubble flow regime diagram constructed based on We and Ga. Within the blue region (We < 0.4), the flow pattern predominantly manifests as discrete bubble flow. In this regime, surface tension and inertial forces govern bubble morphology, where the We, which represents the ratio of inertial forces to surface tension forces, exhibits a sufficiently low value. This condition enables surface tension to sustain the elliptical contour of the bubble during its detachment from the orifice. Following necking rupture, the substantial spatial separation between successive bubbles prevents resonant interactions. Consequently, the acoustic wave signals generated during necking and detachment exhibit no periodic beats, as evidenced by the absence of beat phenomena in the recorded acoustic signatures.
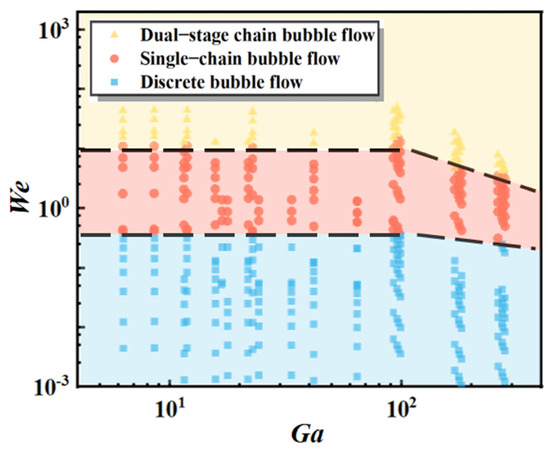
Figure 17.
Bubble flow pattern.
With the gradual increase in the We, the bubble flow regime transitions from discrete bubble flow to single-chain bubble flow, corresponding to the red region in Figure 17 (0.4 < We < 15). In this regime, the inertial forces dominate, driving bubbles to detach from the orifice at higher velocities and consequently reducing inter-bubble spacing. The enhanced inertial effects induce periodic pressure fluctuations within the bubble wake field. These fluctuations propagate through the fluid medium, leading to the coupling of acoustic signals between adjacent bubbles, which manifests as a distinct beat pattern in the acoustic signatures. When the Ga exceeds 96, the influence of viscous forces intensifies, amplifying viscous dissipation. This reduces the energy threshold required to sustain a discrete bubble flow regime, thereby lowering the critical We and promoting an earlier transition from the discrete bubble regime to the single-chain bubble flow regime.
When the We exceeds 15, the bubble flow regime transitions from single-chain bubble flow to dual-stage chain bubble flow (corresponding to the yellow region in the figure). Under this condition, the synergistic effects between the dimensionless parameters We and Ga significantly alter the distribution of both the velocity and pressure fields. Enhanced hydrodynamic interactions between adjacent bubbles manifest as mutual influences during their morphological evolution, resulting in observable amplitude disparities in the temporal waveforms of neighboring bubbles. As Ga increases, the strengthening inertial effects facilitate the single to dual-chain bubble flow transition at lower critical We values, thereby considerably accelerating the flow regime transition process. This phenomenon underscores the critical role of parameter coupling in modulating multiphase flow dynamics at reduced time scales.
4. Conclusions
- (1)
- Three flow regimes were characterized by their corresponding acoustic signals. In discrete bubble flow, the motion state of preceding bubbles remains independent from subsequent bubbles without mutual influence, while adjacent bubbles exhibit consistent time domain waveforms. In single-chain bubble flow, the time domain diagrams of bubbles demonstrate a stage oscillation. In dual-stage chain bubble flow, the motion state of preceding bubbles exerts a significant periodic influence on subsequent bubbles, leading to distinct differences in time domain waveforms between adjacent bubbles.
- (2)
- The effects of liquid surface tension, dynamic viscosity, and orifice diameter variations on critical gas flow velocities were examined for regime transitions: from discrete bubble flow to single-chain bubble flow, and from single-chain to dual-stage chain bubble flow. The results indicate that surface tension and dynamic viscosity exert a negligible influence on the critical gas flow velocity for the discrete to single chain transition. Increasing orifice diameter reduces this critical value. Conversely, elevated surface tension and dynamic viscosity enhance the critical gas flow velocity from single-chain to dual-stage chain flow, whereas increased orifice diameter diminishes it.
- (3)
- A quantitative classification of bubble flow patterns was established using the Ga and We numbers. This approach provides a universal theoretical framework for flow regime prediction and mass transfer optimization in industrial gas–liquid two-phase flow systems.
Author Contributions
Conceptualization, W.Z.; methodology, W.Z.; validation, H.W.; formal analysis, W.Z. and K.Y.; investigation, W.Z. and G.W.; resources, W.Z. and G.W.; data curation, W.Z.; writing—original draft, G.W.; writing—review and editing, H.W. and G.W.; visualization, W.Z. and K.Y.; supervision, H.W.; funding acquisition, H.W. All authors have read and agreed to the published version of the manuscript.
Funding
This research was funded by the Natural Science Foundation of Hebei Province, grant number B2023202025.
Data Availability Statement
The original contributions presented in this study are included in the article. Further inquiries can be directed to the corresponding author.
Conflicts of Interest
The authors declare no conflict of interest.
Abbreviations
The following abbreviations are used in this manuscript:
| ρ0 | Density of liquid, kg·m−3 |
| L0 | Orifice diameter, mm |
| V | Gas flow velocity, m·s−1 |
| Σ | Surface tension of liquid, N·m−1 |
| Ga | Galileo number |
| We | Weber number |
| G | Acceleration of gravity, m·s−2 |
| Μ | Dynamic viscosity of liquid, Pa·s |
References
- Liang, J.H.; Fei, Y.; Yin, Y.H.; Han, Q.; Liu, Y.Z.; Feng, L.; Zhang, L.Q. Advancements in wastewater treatment: A comprehensive review of ozone microbubbles technology. Environ. Res. 2025, 266, 120469. [Google Scholar] [CrossRef] [PubMed]
- Quintero-Gonzalez, C.A.; Martinez, J.; Calva-Yanez, J.C.; Oropeza-Guzman, M.T. Physicochemical wastewater treatment improvement by hydrodynamic cavitation nanobubbles. J. Water Process Eng. 2025, 69, 106581. [Google Scholar] [CrossRef]
- Rashid, F.L.; Al-Obaidi, M.A.; Hussein, A.K.; Ahmad, S.; Albdeiri, M.S.; Mujtaba, I.M. Bubble dynamics in sustainable technologies: A review of growth, collapse, and heat transfer. Processes 2024, 13, 38. [Google Scholar] [CrossRef]
- Wang, Z.; Sun, T.; Liu, N. Dispersed phase formation and separation mechanism using high resolution CFD and artificial intelligence technique for simulation of reactors. Chem. Eng. Sci. 2025, 306, 121268. [Google Scholar] [CrossRef]
- Moiz, M.; Prajapat, R.; Srivastava, A.; Srivastava, A. Machine learning-inspired study of dynamical parameters of single vapor bubble under nucleate flow boiling regime. Appl. Thermal Eng. 2025, 259, 124827. [Google Scholar] [CrossRef]
- Lai, K.; Yang, S.L.; Wang, H. Numerical investigation of bubble dynamics and multi-scale flow characteristics in the bottom-blown gas-liquid reactor. Chem. Eng. J. 2023, 474, 145868. [Google Scholar] [CrossRef]
- Qi, H.Y.; Sun, X.Y.; Liu, J.T. Study on acoustic characteristics of bubb1e interaction. IOP Publ. 2024, 2752, 012192. [Google Scholar] [CrossRef]
- Gaurav, K.; Mittal, G.; Karn, A. On the morphology of elongated bubbles during their formation at submerged orifices. Chem. Eng. Sci. 2022, 250, 117395. [Google Scholar] [CrossRef]
- Fattahi, K.; Boffito, D.C.; Robert, E. Quantifying the chemical activity of cavitation bubbles in a cluster. Sci. Rep. 2024, 14, 7978. [Google Scholar] [CrossRef]
- Manasseh, R.; Riboux, G.; Risso, F. Sound generation on bubble coalescence following detachment. Int. J. Multiph. Flow 2008, 34, 938–949. [Google Scholar] [CrossRef]
- Stavrou, V.N.; Tsoulos, I.G.; Mastorakis, N.E. Transformations for FIR and IIR Filters’ Design. Symmetry 2021, 13, 533. [Google Scholar] [CrossRef]
- Stojanovic, N.; Krstic, I.; Stamenkovic, N. Performance analysis of optimum chebyshev filters at microwave frequencies. AEU-Int. J. Electron. Commun. 2024, 187, 8. [Google Scholar] [CrossRef]
- Ali, M.A.; Dhanaraj, R.K.; Nayyar, A. A high performance-oriented AI-enabled IoT-based pest detection system using sound analytics in large agricultural field. Microprocess. Microsyst. 2023, 103, 104946. [Google Scholar] [CrossRef]
- Bojkovic, Z.; Bakmaz, B.; Bakmaz, M. Hamming window to the digital world. Proc. IEEE 2017, 105, 1185–1190. [Google Scholar] [CrossRef]
- Jiang, L.; Zhang, H.J.; Yu, L.; Hua, G. A data-driven high-resolution time-frequency distribution. IEEE Signal Process. Lett. 2022, 29, 1512–1516. [Google Scholar] [CrossRef]
- Qi, H.Y.; Liu, J.T.; Sun, X.Y.; Deng, P.; Zhang, D.M.; Song, Y.X. Investigation of bubble interaction and influence on acoustic signals. Phys. Fluids 2024, 36, 13. [Google Scholar] [CrossRef]
- Tang, J.; Hu, R.; Xu, L.; Liu, H.; Luo, J. Shape oscillation-induced early detachment of bubble from a submerged microcapillary nozzle. Langmuir 2023, 39, 16596–16605. [Google Scholar] [CrossRef]
- Deane, G.; Czerski, H. A mechanism stimulating sound production from air bubbles released from a nozzle. J. Acoust. Soc. Am. 2008, 123, EL126–EL132. [Google Scholar] [CrossRef]
- Babu, R.; Das, M. Effects of surface-active agents on bubble growth and detachment from submerged orifice. Chem. Eng. Sci. 2018, 179, 172–184. [Google Scholar] [CrossRef]
- Gerlach, D.; Biswas, G.; Durst, F.; Kolobaric, V. Quasi-static bubble formation on submerged orifices. Int. J. Heat Mass Transf. 2005, 48, 425–438. [Google Scholar] [CrossRef]
- Islam, M.T.; Ganesan, P.B.; Billah, M.M.; Uddin, M.N. A numerical study of single air bubble formation comparison between in viscous liquid and in water. Asia-Pac. J. Chem. Eng. 2019, 14. [Google Scholar] [CrossRef]
Disclaimer/Publisher’s Note: The statements, opinions and data contained in all publications are solely those of the individual author(s) and contributor(s) and not of MDPI and/or the editor(s). MDPI and/or the editor(s) disclaim responsibility for any injury to people or property resulting from any ideas, methods, instructions or products referred to in the content. |
© 2025 by the authors. Licensee MDPI, Basel, Switzerland. This article is an open access article distributed under the terms and conditions of the Creative Commons Attribution (CC BY) license (https://creativecommons.org/licenses/by/4.0/).