Article

An Operating Condition Diagnosis Method for Electric Submersible Screw Pumps Based on CNN-ResNet-RF

1
Key Lab of Industrial Fluid Energy Conservation and Pollution Control (Ministry of Education), Qingdao University of Technology, Qingdao 266520, China
2
College of Mechanical and Electronic Engineering, China University of Petroleum (East China), Qingdao 266580, China
3
Offshore Oil Engineering Co., Ltd., Tianjin 300451, China
4
Research Institute of Exploration & Development, PetroChina, Beijing 100083, China
*
Authors to whom correspondence should be addressed.
These authors contributed equally to this work.
Processes 2025, 13(7), 2043; https://doi.org/10.3390/pr13072043 (registering DOI)
Submission received: 8 April 2025 / Revised: 19 June 2025 / Accepted: 23 June 2025 / Published: 27 June 2025
(This article belongs to the Section Automation Control Systems)

Abstract

Electric submersible progressive-cavity pumps (ESPCPs) deliver high lifting efficiency but are prone to failure in the high-temperature, high-pressure, and multiphase down-hole environment, leading to production losses and elevated maintenance costs. To achieve reliable condition recognition under these noisy and highly imbalanced data constraints, we fuse deep residual feature learning, ensemble decision-making, and generative augmentation into a unified diagnosis pipeline. A class-aware TimeGAN first synthesizes realistic minority-fault sequences, enlarging the training pool derived from 360 field records. The augmented data are then fed to a CNN backbone equipped with ResNet blocks, and its deep features are classified by a Random-Forest head (CNN-ResNet-RF). Across five benchmark architectures—including plain CNN, CNN-ResNet, GRU-based, and hybrid baselines—the proposed model attains the highest overall validation accuracy (≈97%) and the best Macro-F1, while the confusion-matrix diagonal confirms marked reductions in the previously dominant misclassification between tubing-leakage and low-parameter states. These results demonstrate that residual encoding, ensemble voting, and realistic data augmentation are complementary in coping with sparse, noisy, and class-imbalanced ESPCP signals. The approach therefore offers a practical and robust solution for the real-time down-hole monitoring and preventive maintenance of ESPCP systems.

1. Introduction

In recent years, as oilfield development has steadily extended to deeper wells, high water-content phases, and unconventional reservoirs, electric submersible screw pumps have gained traction as a high-efficiency artificial lifting technique, significantly boosting the efficiency of oil recovery [1,2]. Under normal conditions, these pumps offer robust, continuous operations; however, the harsh downhole environment—marked by elevated temperatures, high pressures, and fluid composition variations (such as gases and particulate matter)—frequently triggers operational faults, including rod breakage, wax formation, and abnormal operating parameters. Such faults not only reduce oil production, resulting in economic losses, but also elevate equipment maintenance costs. The ability to rapidly and accurately diagnose these issues has therefore become a critical element in ensuring stable production and minimizing downtime.
In pursuit of effective and intelligent diagnostic methods, research has evolved from classical modeling approaches to more data-driven strategies. For instance, Peihao Yang et al. [3] demonstrated how combining a Denoising Autoencoder with a Support Vector Machine can markedly enhance fault recognition under multiple operating conditions. Meanwhile, Minzheng Jiang et al. [4] developed a diagnostic model based on random forest algorithms, verifying that it achieves high classification efficiency across diverse scenarios for ESPCP. Nevertheless, traditional mechanism-based modeling often lacks adequate robustness once conditions become highly complex or shift abruptly—challenges that are compounded by unbalanced samples, significant noise, or abrupt load changes [5]. Similarly, DongJiang Liu et al. [6] observed that while multi-sensor fusion may bolster diagnostic accuracy to some degree [7], it fails to guarantee stable and reliable results in especially noisy and intricate downhole environments.
Amid these concerns, deep learning has emerged as a powerful suite of tools for intelligent fault diagnosis in electric submersible screw pumps [8,9]. Alguliyev et al. [10] achieved heightened classification accuracy under complex conditions by leveraging convolutional neural networks and recurrent neural networks for automatic feature extraction, thereby capturing both the spatial and temporal signatures of pump behavior. Meanwhile, researchers have also begun exploring hybrid architectures tailored for more general industrial fault detection. For example, Guo et al. [11] proposed a CNN-LSTM-based mechanism to capture both spatial and sequential dependencies in dedicated equipment fault signals, demonstrating improved temporal sensitivity under multi-source working conditions. Similarly, He et al. [12] designed an intelligent fault diagnosis model that integrates Generative Adversarial Networks and transfer learning, effectively addressing issues of data imbalance and domain generalization under variable working environments. However, as the depth of these networks increases, issues such as gradient vanishing or degradation can arise, hampering model stability—particularly when sample sizes are small or the data are heavily corrupted by noise [13]. Such drawbacks mean that any single deep learning model may still struggle to cope with highly diverse, multi-fault operating contexts [14].
To relieve data-scarcity bottlenecks, recent studies have started to synthesize additional time-series samples with advanced generators such as Recurrent-GAN (RGAN) [15], TimeGAN [16], and diffusion-based few-shot models [17,18]. These methods have proved effective in bearing and rotor systems, yet they have rarely been applied to ESPCP field data.
In light of these limitations, fusion approaches have gained prominence as they combine complementary strengths from different algorithms. Bonella et al. [19] integrated Random Forest with deep learning, using the forest’s efficient classification to refine and denoise features extracted by deep models [20,21,22], thereby addressing the data imbalance issue more effectively and attaining superior diagnostic accuracy in complex operating environments.
Unlike existing ESPCP/ESP fusion schemes such as DAE-SVM [3], LSTM-CNN [7], and the Deep-Hybrid framework [19], the present study couples residual feature extraction (ResNet) with a Random-Forest classifier and embeds a TimeGAN-driven augmentation stage that is sanity-checked by a lightweight LSTM. All components are trained and evaluated on a genuinely small and highly imbalanced field dataset collected in the Xinjiang oilfield rather than on simulated or public benchmarks.
Concretely, the original corpus comprises 360 labelled sequences. For each minority fault, a class-conditioned TimeGAN generates candidate traces that are filtered by the LSTM probe to remove unrealistic examples. This expands the training pool to 950 sequences while preserving the natural rarity of minority faults, thereby creating a realistic yet data-sufficient test bed.
The augmented data are then processed by a CNN-ResNet feature extractor, for which their outputs feed a Random-Forest voting layer (CNN-ResNet-RF). This two-stage pipeline—TimeGAN + LSTM filtering followed by CNN-ResNet-RF—integrates synthetic-data generation, residual representation learning, and ensemble decision-making and is tailored to noisy, imbalanced, low-sample ESPCP signals.
The remainder of the paper is organized as follows: Section 2 describes the five fault categories, data-acquisition procedure, and TimeGAN/LSTM augmentation. Section 3 details the CNN-ResNet-RF architecture and four baseline models. Section 4 presents the experimental protocol, evaluation metrics, and comparative results. Section 5 concludes with deployment considerations and future work.

2. Electric Submersible Progressive Cavity Pump: Fault Characteristics and Data Processing

2.1. ESPCP Working Condition Analysis

During ESPCP lifting operations, the harsh downhole environment readily gives rise to various faults [23]. If the system continues running with an unaddressed fault for an extended period, even minor hidden issues may deteriorate swiftly, causing production declines and raising equipment maintenance costs. Xie Jianyong et al. [24] investigated fault modeling and intelligent diagnostic methods for ESPCP process control, proposing the use of multidimensional features and unit-structure information for fault prediction and prevention—an approach that is still valuable today for improving both diagnostic accuracy and operational safety.
Field surveys of the Xinjiang oilfield, combined with the structural characteristics of screw pumps, reveal a consistent pattern of potential failures during the lifting process, including rod breakage, tubing leakage, wax formation, high operating parameters, low operating parameters, and normal conditions [25,26]. In essence, the screw pump may encounter abrupt or progressive failures under these adverse conditions, highlighting the importance of robust diagnostic models that can swiftly detect anomalies.

2.2. Data Preprocessing

Drawing on field failure conditions and statistical data from multiple wells in the Xinjiang oilfield, six key parameters are identified: fluid production, dynamic liquid level, torque, rotational speed, casing pressure, and current signal. Among these parameters, the current signal stands out for its high sensitivity and real-time responsiveness, making it a more direct indicator of dynamic load changes in the pump. Furthermore, in certain faults—such as rod breakage or wax formation—the fluctuation of the current signal often appears earlier than shifts in any other parameters [27]. This early warning capability underscores why the current signal typically becomes the core feature in fault diagnosis tasks, especially when rapid detection is necessary. Based on an analysis of six representative operating conditions (one normal and five fault types) using real field data independently collected from Xinjiang Oilfield, we summarized the variation patterns of the current signal. Reference [28] was consulted to confirm that these trends are consistent with prior field-experienced fault characteristics, though the data in Table 1 originates from our own measurements.
As a key parameter that directly reflects dynamic pump-load changes, the current signal can rapidly respond to varying operating conditions. Its trend is illustrated in Figure 1, where each curve corresponds to a snapshot from a different well and time. Signals are not aligned on a unified timeline.
Given that other feature parameters typically lag in fault response, this study emphasizes extracting the current signal, which offers high sensitivity and real-time performance to capture fault-driven changes promptly. A multidimensional feature vector is then formed by integrating this signal with key operating parameters (fluid production, dynamic fluid level, torque, rotational speed, and casing pressure). By analyzing the signal’s time-domain, frequency-domain, and statistical properties, four indicators—mean value, standard deviation, main frequency, and steepness—can be extracted to describe the failure mode from multiple perspectives, including overall level, fluctuation amplitude, spectral features, and spike changes. Subsequently, these indicators are fused with other parameters, thereby retaining the current signal’s load sensitivity while enhancing diagnostic accuracy and stability for complex operating conditions through multidimensional information. The main equations are as follows.
The mean value (μ) is calculated using Equation (1):
μ = 1 N i = 1 N x i
where N represents the total number of sampling points, and xi denotes the current value at the i-th sampling point. The standard deviation (σ) is then determined by Equation (2):
σ = 1 N i = 1 N x i μ 2
After performing a fast Fourier transform on x(t), the frequency of highest amplitude (fd) is found via Equation (3):
f d = arg   max f X f
where X(f) is the spectral amplitude.
To compute kurtosis (K), we subtract the mean μ from each sampling point, take both the fourth power and the square of each difference, and derive the ratio of their respective averages according to Equation (4).
K = 1 N i = 1 N x i μ 4 1 N i = 1 N x i μ 2 2
Additionally, since each feature varies in scale and range, Z-Score normalization is applied to ensure data consistency and computational efficiency, avoiding excessive data volume or numerical issues. The normalization formula follows Equation (5):
z = x μ σ
The normalized feature vector is expressed as X = [μ, σ, fd, K, Q, H, T, N, P], where the first four indicators (μ, σ, fd, and K) are extracted from the current signal, and the latter five are field-acquired operating parameters: Q: fluid production rate; T: dynamic fluid level; H: pump shaft torque; N: motor rotation speed; P: casing pressure.

2.3. Synthetic-Data Augmentation with TimeGAN

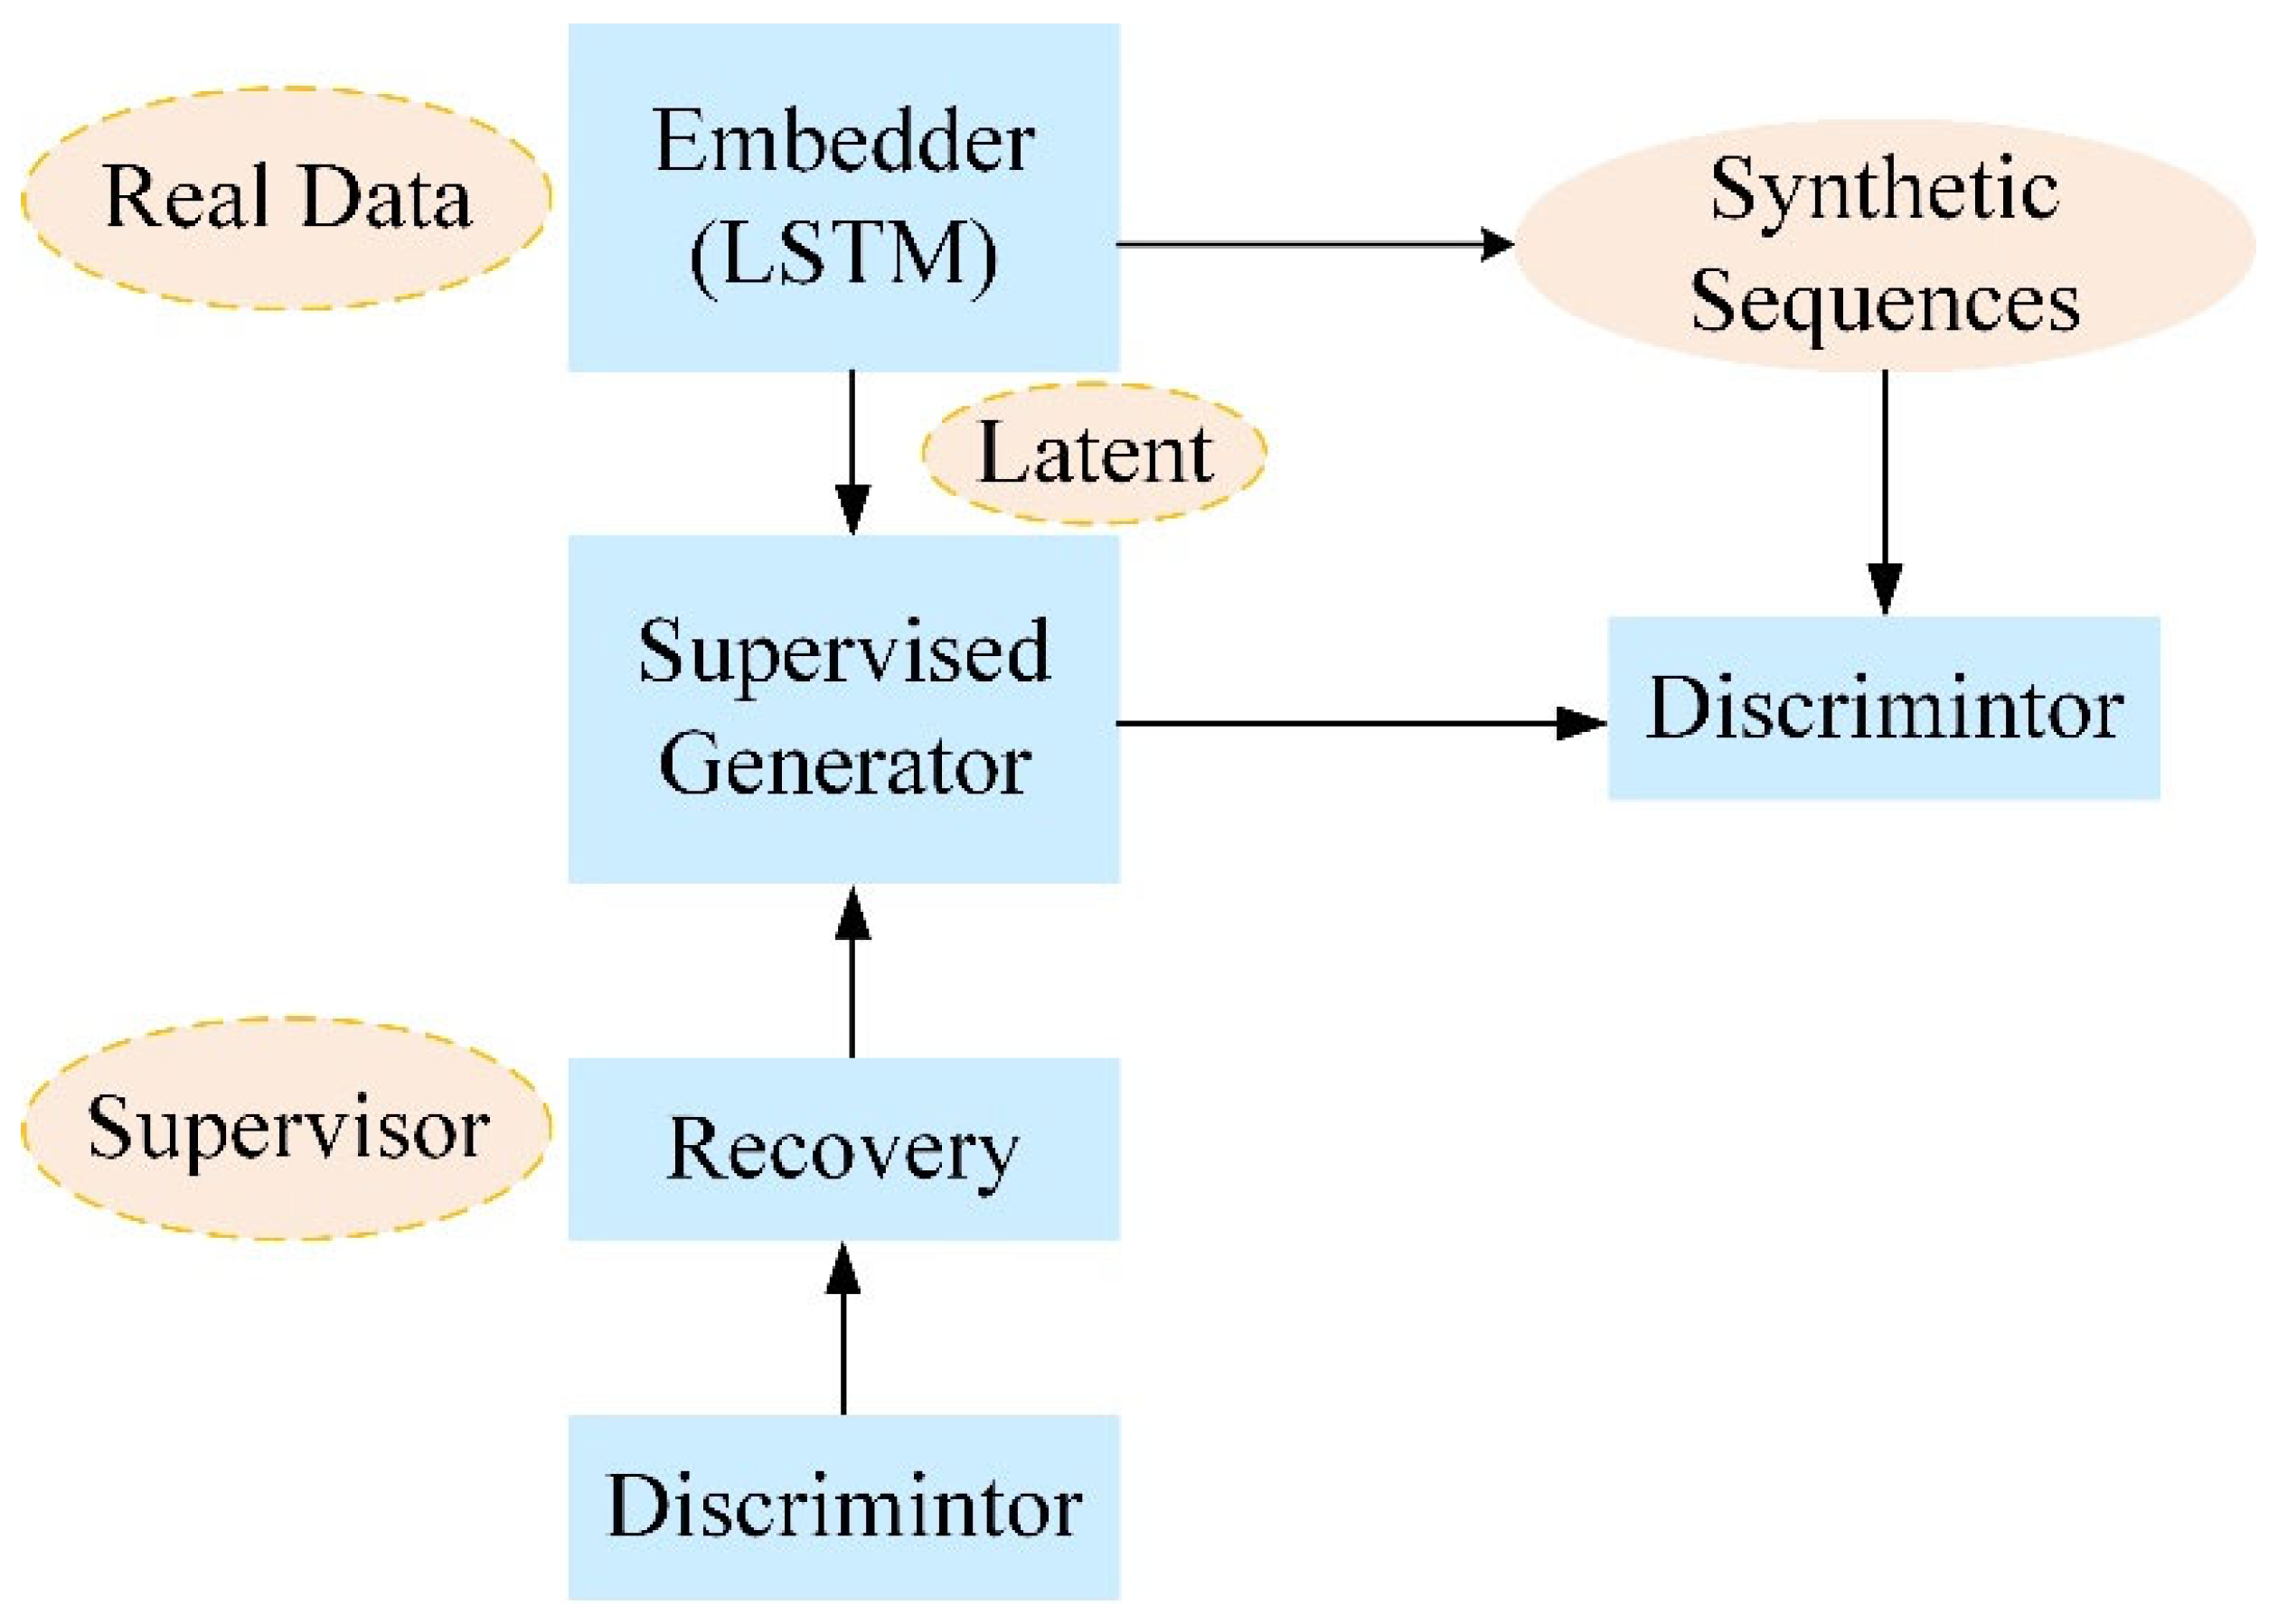
To alleviate the class imbalance that persists after the preprocessing, we employ a class-conditioned time-series GAN (TimeGAN) augmentation pipeline, as illustrated in Figure 2. For each minority fault type, a three-layer LSTM TimeGAN (hidden size = 24; input length = 300 × 6) is trained for 1000 epochs. The generator outputs about 130 candidate sequences per class; these are filtered by (i) a lightweight LSTM probe—rejecting samples with high reconstruction error—and (ii) basic physical heuristics (e.g., non-negative torque, fluid level ≤ well depth). After screening, every fault category retains 150 valid samples, while the normal class remains at 200, yielding 950 training sequences in total (200 normal + 5 × 150 fault). The validation and test sets are kept 100% real to ensure unbiased evaluation.

3. Research Method

To reliably diagnose multi-condition faults in ESPCP systems, this section introduces and compares five diagnostic models: CNN, CNN-ResNet, RF, CNN-RF, and CNN-ResNet-RF. Of these, the first four serve as baseline architectures; Section 3.4 details the CNN-ResNet-RF fusion model, which represents the core contribution of this study. This hybrid model leverages the local feature extraction ability of CNNs, the deep residual representation of ResNet, and the ensemble decision-making robustness of Random Forest. The following subsections provide structural details and rationales for each method’s inclusion.
In addition, we distinguish two experimental regimes: Baseline, trained on the original sample set, and Augment, trained on the TimeGAN-enlarged sample set. The model structures are identical, but the training data differ.

3.1. CNN Algorithm

A convolutional neural network is a deep learning algorithm designed to automatically extract essential features from multivariate time-series data [29,30], enabling highly efficient classification. By down-sampling data at multiple time scales, CNNs incrementally learn feature representations—from simpler, low-level patterns to more complex, high-level abstractions—thus exhibiting strong adaptability in demanding downhole environments [31].
In the context of electric submersible screw pump fault diagnosis, CNN can convolve and pool over input sequences to capture localized spatiotemporal features and then progressively transition to higher-level feature maps. Through these layered transformations, CNNs demonstrate robust resistance to noise and localized distortions [32,33], making them suitable for diagnosing pump conditions where data irregularities or partial faults may arise.

3.1.1. Convolutional Layer

The convolutional layer locally processes the input signal using a sliding window, extracting temporal correlations and localized feature variations. In the proposed CNN structure, we employ two convolutional layers. The first uses 16 × 3 × 3 filters and stride 1, with ReLU activation and padding to preserve the output dimension. The second convolutional layer increases the depth to 32 filters, maintaining the same kernel size and activation. This progression allows the model to capture both low-level transitions and higher-level semantic patterns associated with various fault types. The convolution operation is demonstrated by Equation (6):
z i = j = 1 k x i + j 1 w j + b
where zi is the output of the convolution operation, xi+j−1 is the (i + j − 1)-th data point of the input time series, wj is the weight of the convolution kernel, k is the kernel size, and b is the bias term [34]. By stacking multiple convolutional layers, CNNs can learn increasingly abstract features relevant to identifying faults such as rod breakage or wax formation.

3.1.2. Pooling Layer

The pooling layer reduces feature dimensionality while retaining dominant patterns. In our architecture, each convolutional layer is followed by a max-pooling layer with a 2 × 2 window and stride 2. This configuration accelerates computation, prevents overfitting, and improves translation invariance—ideal for capturing abrupt pump behavior. The pooling operation is defined as follows:
p i = max { z i + j : j = 0,1 , , k p }
p i = 1 k p j = 0 k p 1 z i + j
where Pi is the pooled output, Zi+j denotes the convolved features, and Kp is the pooling window size. These layers help the model to focus on the most salient features, effectively summarizing local behaviors of the pump’s dynamic signals.

3.1.3. Fully Connected Layer

The fully connected layer linearly combines the features output by the pooling layer, producing the final classification. The output of the final pooling layer is flattened into a size-96 vector, which is then passed through a fully connected layer with 128 neurons activated by ReLU. Mathematically, this process (outlined in Equations (9) and (10)) typically ends with a Softmax activation, converting the network’s output into a probability distribution over the fault classes:
F C h = W h + b
where FC(h) denotes the output of the fully connected layer; W is the weight matrix; b is the bias term. In the model, h denotes the high-level feature vector obtained after the final pooling layer in the CNN or CNN-ResNet module. This vector encapsulates the key discriminative features and is passed as an input to the fully connected layer for classification:
y = Softmax ( F C ( h ) )
where y denotes the output probability vector over the classes after Softmax normalization.

3.2. ResNet Network

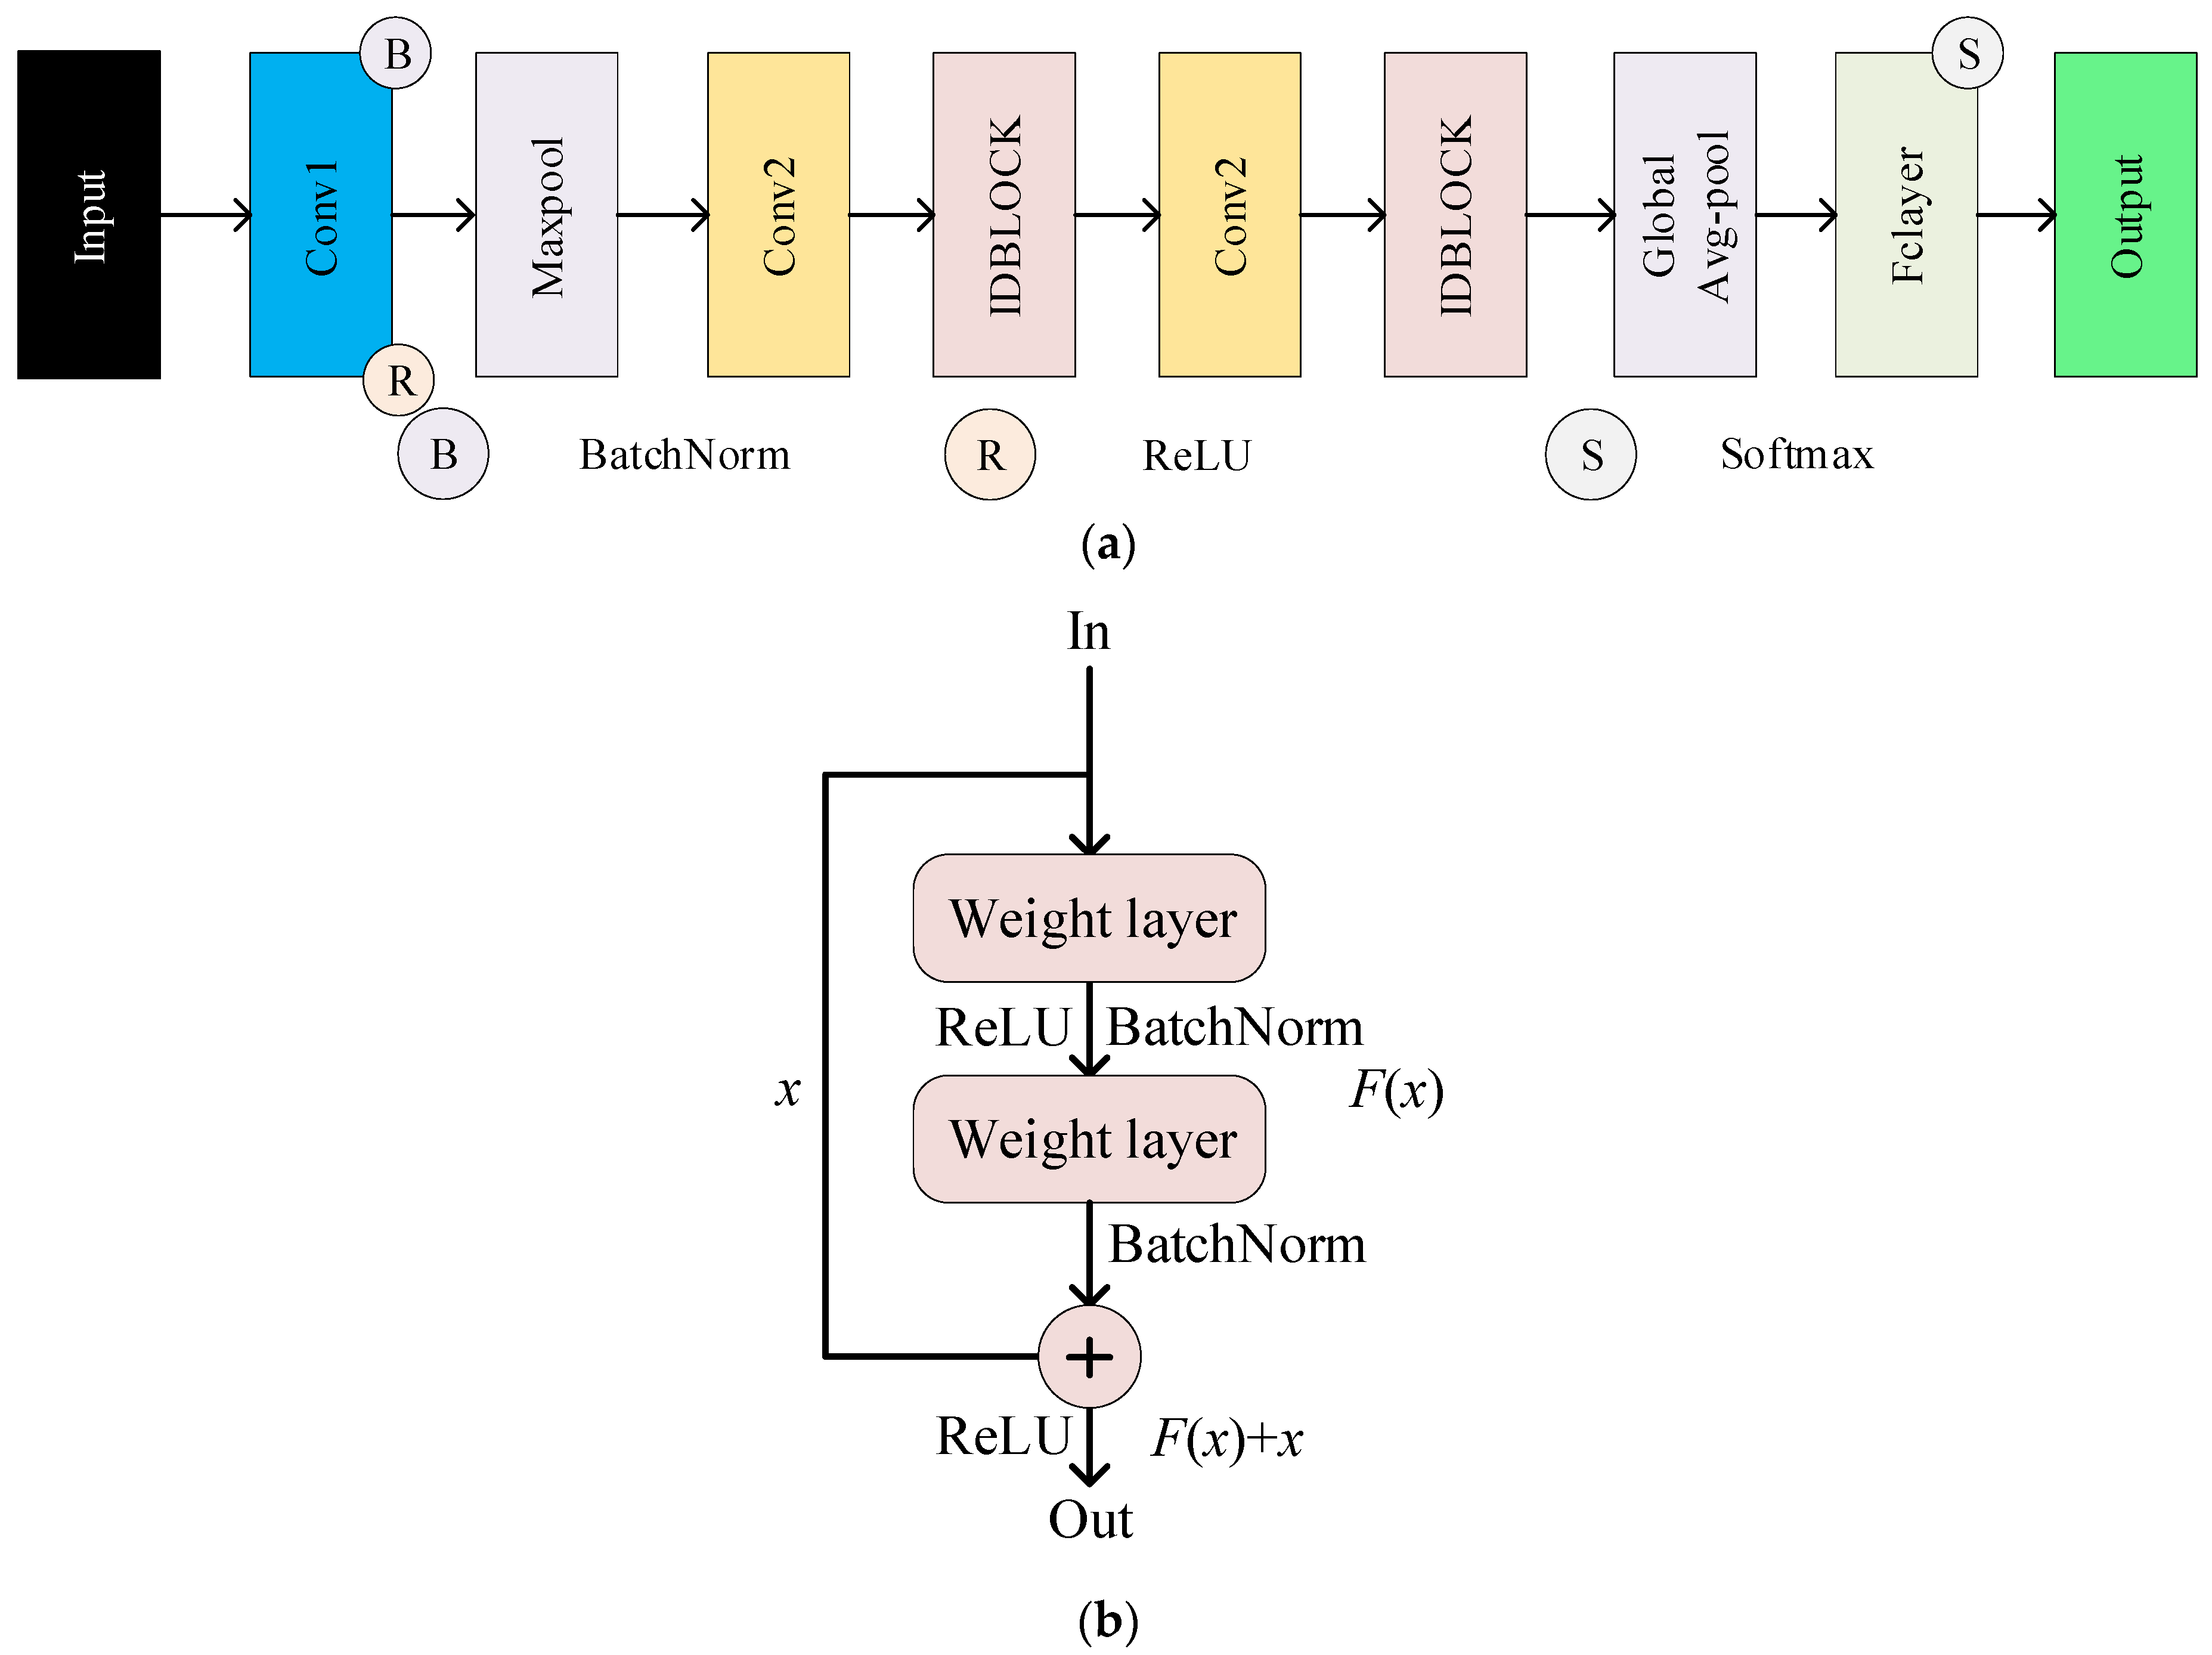
ResNet is a deep learning model primarily designed to address the performance degradation of deep neural networks caused by gradient vanishing or explosion during training [35]. By introducing residual connections, ResNet enables direct information flow between layers, substantially improving both network training effectiveness and model expressiveness [36]. As shown in Figure 3a, ResNet’s basic structure comprises multiple stages, each including a Conv Block and a residual block—either an identity residual block (if the input and output dimensions match) or a convolutional residual block (if the dimensions differ). Through shortcut connections, features propagate efficiently within each module:
  • The Conv Block employs extra convolution operations to adjust input–output dimensions and accommodate deeper networks.
  • The second-layer convolution plus BatchNorm yields F(x).
  • Summing x and F(x) and then applying another ReLU activation produces the final output, y = F(x) + x.
When the input and output dimensions coincide, the identity residual block is used, as illustrated in Figure 3b. By performing identity mapping, the block essentially avoids additional dimensional transformations; it simply adds the output, F(x), to the original input, x. When the input and output dimensions differ, a convolutional residual block is adopted instead, where convolution layers adjust the feature channels or spatial resolution to match shapes correctly.
In the final stage, ResNet reduces high-dimensional features via Global Average Pooling (Global Avg-Pool) and then feeds the result into a fully connected layer for classification or regression tasks. Overall, residual connections effectively alleviate gradient vanishing triggered by deeper network stacks while simultaneously boosting the performance of the deep model.
This ability to maintain stable gradient flow across deep layers is especially important in the context of ESPCP fault signals, which often exhibit low amplitude, non-stationary patterns, and temporal overlap between fault classes. Under such conditions, residual structures help the model extract weak and long-range dependencies across fault sequences, thereby improving its capacity to distinguish gradual degradation modes (e.g., wax buildup or stator swelling) from sudden anomalies in noisy sensor environments.

3.3. Random Forest

Random Forest is an ensemble learning algorithm composed of multiple independently trained decision trees. Integrating the outcomes of these trees, it attains high accuracy and robustness in both classification and regression tasks [37]. In the Random Forest workflow (Figure 4), each decision tree’s branching structure illustrates how features are split within that tree, while the final classification is obtained by aggregating the outputs of all trees via a voting mechanism. First, N features extracted from the raw data are simultaneously fed into multiple decision trees. Each tree is independently trained on a distinct subset of samples and features to generate its classification output. This property effectively mitigates overfitting (which may occur in a single decision tree) and enhances the model’s generalization to new data. Ultimately, Random Forest aggregates the predictions of all trees—often via Majority Voting—to form the final classification, as described by Equation (11):
Model x = vote h 1 x , h 2 x , , h m x
where hi(x) is the classification result of the i-th decision tree; the final model prediction is determined via Majority Voting over all trees.

3.4. Hybrid Model and Discriminative Value Analysis

By uniting CNN for local pattern extraction, ResNet for deeper and more stable representation learning, and Random Forest for flexible ensemble decision-making, the CNN-ResNet-RF model can cope with the highly imbalanced, multi-condition dataset and yields the highest discriminative value among the tested architectures (Figure 5).

3.5. Brief Comparison of the Five Models

This study evaluates five architectures—CNN, CNN-ResNet, RF, CNN-RF, and CNN-ResNet-RF—under two data regimes: Baseline (360 real sequences) and Augment (590 sequences after TimeGAN expansion and LSTM filtering).
Each model consumes the normalized nine-dimensional feature vector [μ, σ, fd, K, Q, H, T, N, P] and outputs the predicted operating condition.
CNN: CNN organizes the nine features into an input with shapes [9,300,1], uses multiple convolution/pooling layers for feature learning, and finally applies a fully connected layer with Softmax to classify six types of faults.
CNN-ResNet: CNN-ResNet adds residual blocks to the above, enabling stable optimization in deeper networks; it still ends with Softmax over six fault types.
RF: RF requires no convolution and directly takes the 9-dimensional features for training.
CNN-RF: CNN-RF uses the same CNN front-end as the first model to obtain deep features, which are then classified by an RF head instead of Softmax—combining automatic feature learning with ensemble robustness.
CNN-ResNet-RF: CNN-ResNet-RF stacks CNN and residual blocks for rich feature extraction and employs RF for final decision-level fusion, achieving the best trade-off between representational depth and noise-tolerant classification.
In the Augment regime, the first two layers (CNN/CNN-ResNet) are trained with the enlarged sample pool, while the validation and test stages remain purely real, allowing us to quantify the discriminative gain brought by TimeGAN-based data augmentation.

4. Experimentation and Analysis

4.1. Sample Selection and Processing

The experimental dataset comprises 360 labelled field samples that were collected in collaboration with on-site engineers from producing wells in the Xinjiang oilfield. Each sample corresponds to one real operating condition or fault episode. Unlike simulated or benchmark datasets, genuine failure events—such as rod breakage or tubing leakage—are rare and may occur only once every few months in practice; consequently, achieving balanced sampling is virtually impossible. This makes the present dataset particularly challenging, featuring both severe class imbalance and field noise.
To mitigate these issues, we construct a multidimensional feature vector that combines time-domain, frequency-domain, and statistical indicators, with special emphasis on the motor–current signal because of its high sensitivity and real-time response to dynamic load variations. According to actual operational differences, each sample is assigned to one of six interval-based labels defined by production experts [38] (see Table 2). The “Target Output” column adopts a one-hot encoding scheme, in which a six-dimensional vector uniquely represents the six conditions—for example, (1,0,0,0,0,0) denotes the Normal operation, whereas (0,1,0,0,0,0) denotes Rod Break, and so on. This encoding guarantees a clear correspondence between model outputs and fault categories, and it facilitates internal processing, visualization, and confusion-matrix analysis.
Because the minority fault classes still contain only 22–25 real records after cleaning, we further employ TimeGAN to augment these rare time-series samples. The generative protocol, together with an LSTM-based sanity filter, enlarges each minority class to 150 sequences while leaving the normal class unchanged. The augmented dataset is used exclusively for model training, whereas validation and testing rely on real sequences only, ensuring an unbiased evaluation of augmentation efficacy.
After data collection, the samples were randomly shuffled and divided into a training set and a testing set at an 8:2 ratio. Missing values were either removed or imputed as appropriate [39]. During the network training phase, the Adam optimizer was employed with an initial learning rate of 0.001, a mini-batch size of 64, and a maximum of 50 epochs. To mitigate gradient vanishing and degradation issues, residual connections were introduced into the CNN. When the loss dropped below a predefined threshold or after 50 iterations, CNN-ResNet was considered to have converged in terms of feature extraction. The extracted deep features, along with their corresponding labels, were then used to train a Random Forest model for multi-condition fault classification. During testing, new samples were first processed through the CNN-ResNet to extract deep features, which were then classified by the trained Random Forest model.

4.2. TimeGAN–LSTM Cross-Validation

4.2.1. Validation and Network Setup

To test whether the TimeGAN sequences faithfully reproduce the dynamics of the five minority faults (tubing leakage, rod break, wax deposition, high parameter, and low parameter), we designed two mirror LSTM classifiers:
LSTM-1 trained only on the original sample O and validated on the synthetic set A.
LSTM-2 trained only on the synthetic sample A and validated on the original set O.
Both networks share the same topology—two stacked LSTM layers with 24 hidden units, followed by a fully connected Softmax layer—and use Adam (lr = 0.001). Training stops if the validation loss does not improve for five consecutive epochs.

4.2.2. Convergence Behavior

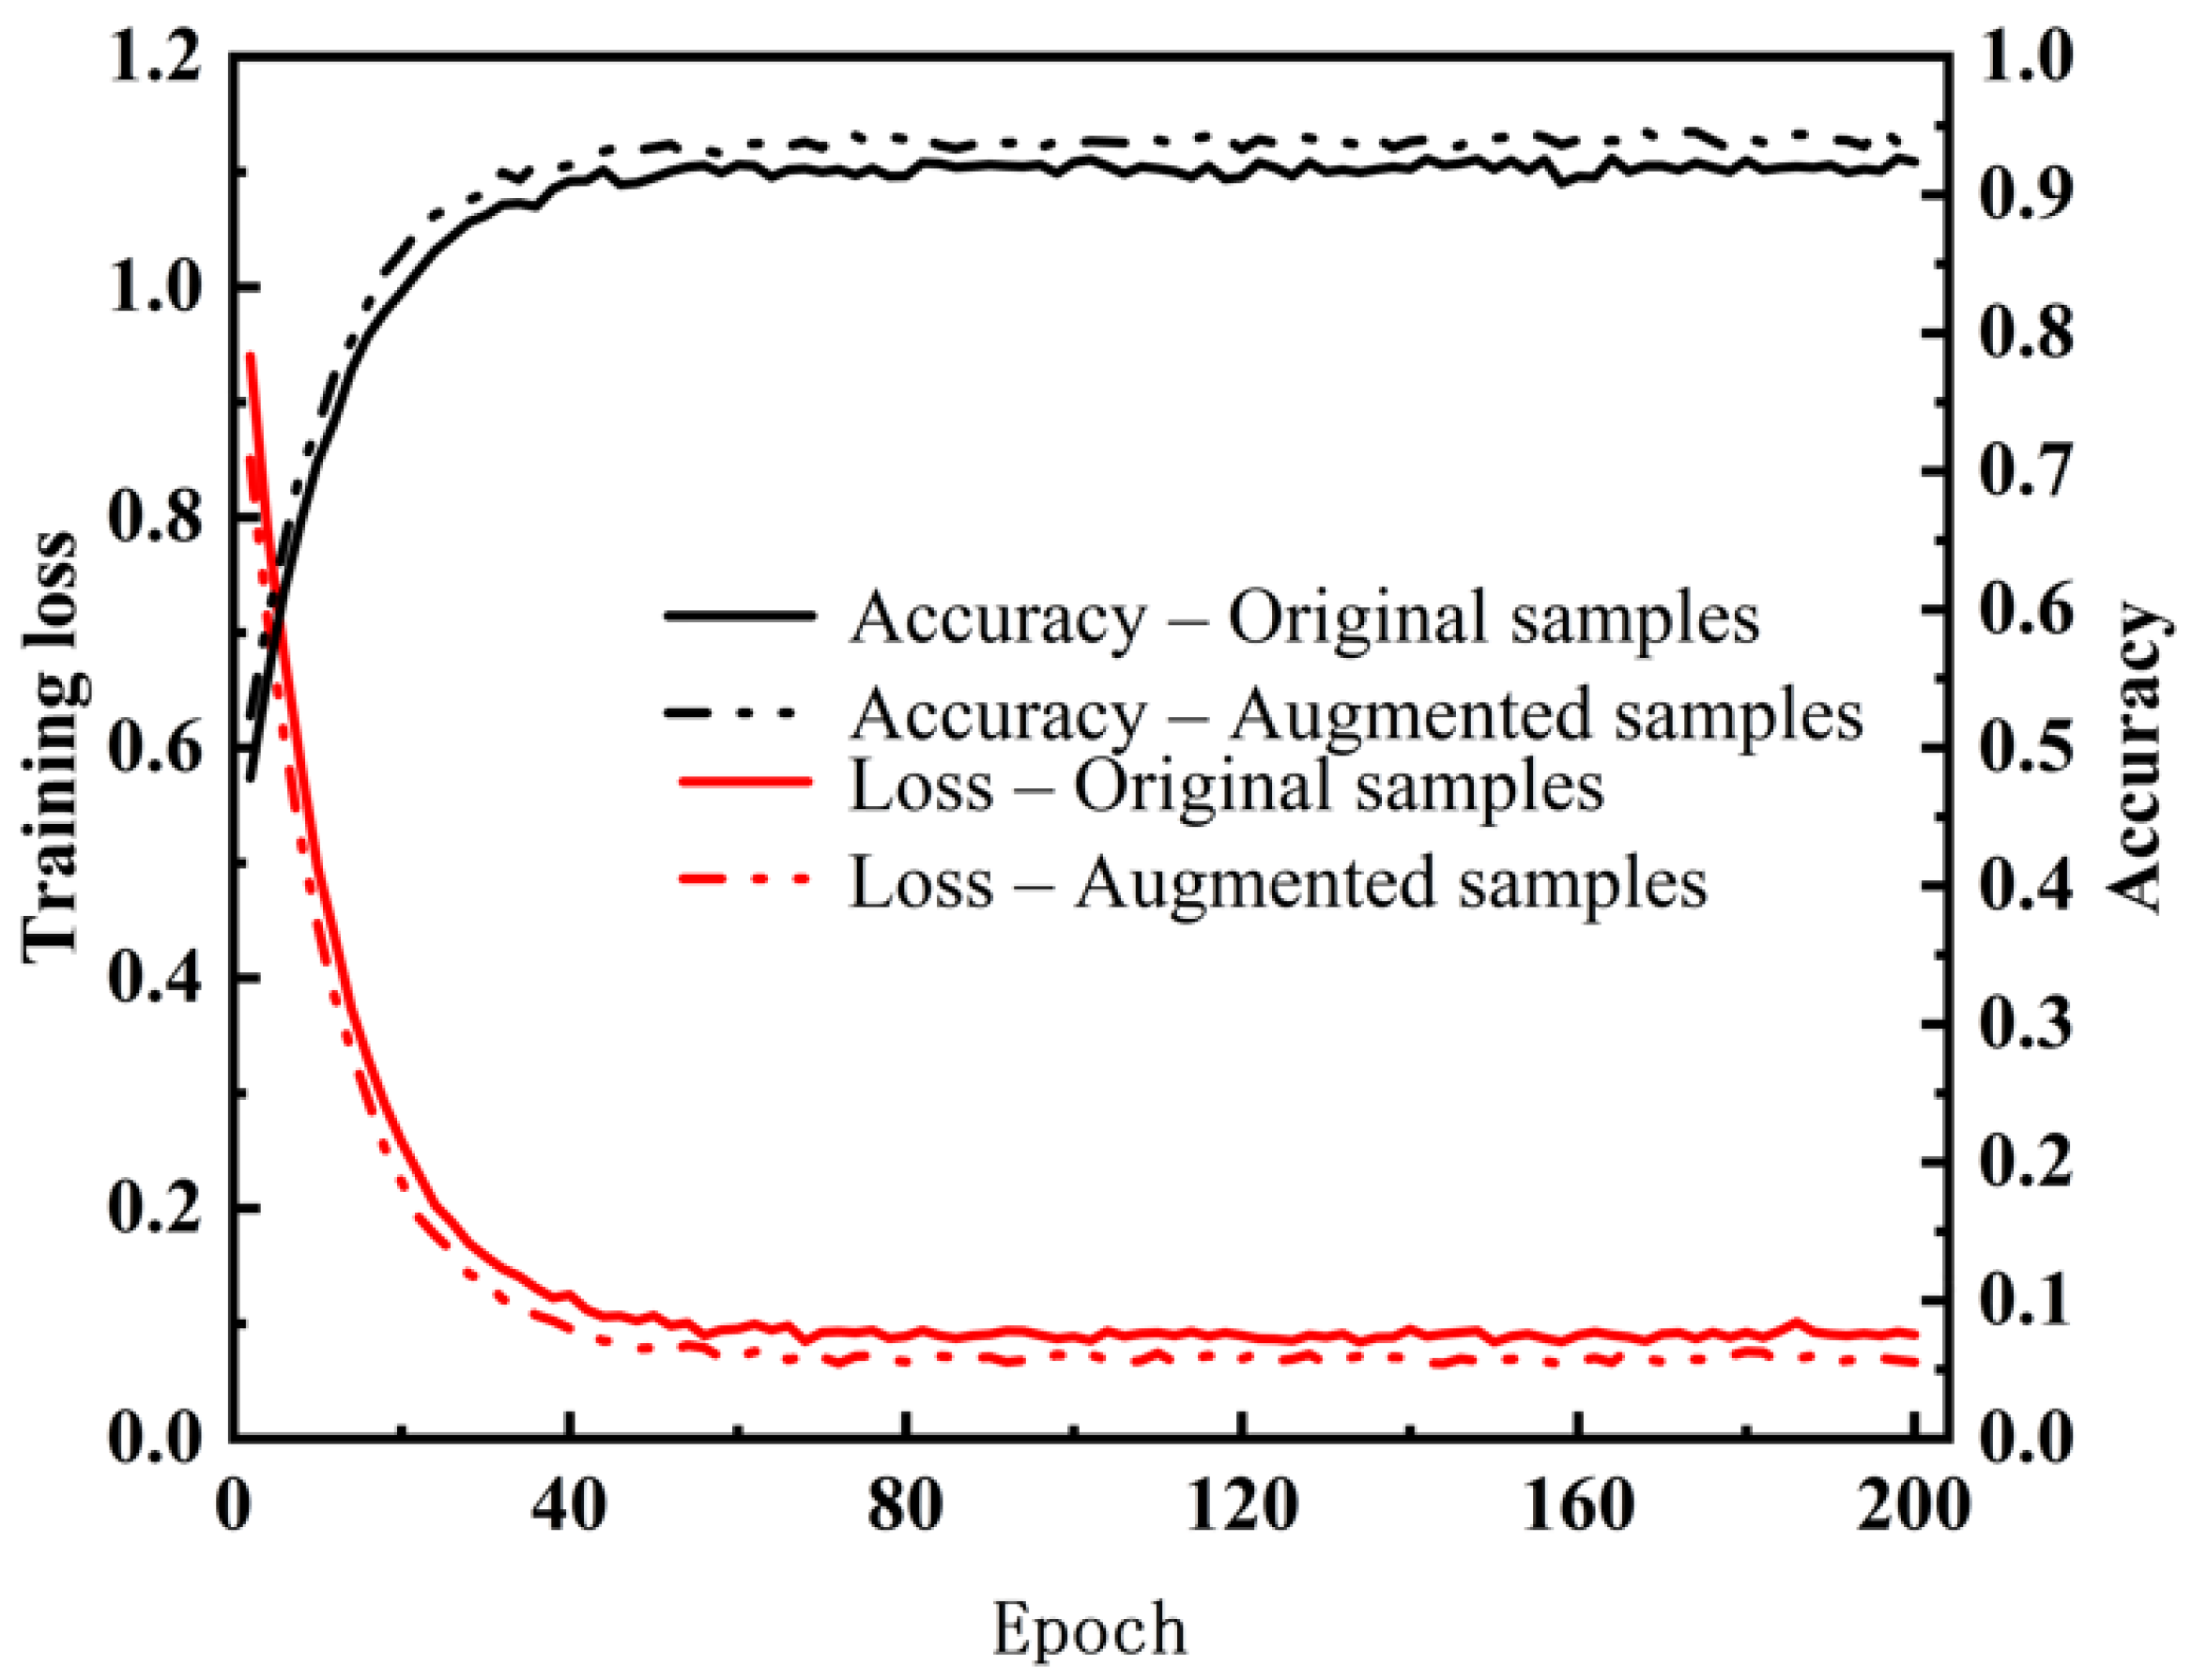
Figure 6 shows the accuracy (black) and loss (red) curves for the five minority faults (tubing leakage, rod break, wax deposition, high parameter, and low parameter). Solid lines correspond to LSTM-1, and dashed lines correspond to LSTM-2. In every case, we observe the following:
Val-ACC rises above 0.92 within 20 epochs, and the gap between the two directions is ≤0.02.
Val-Loss drops below 0.10, with both curves overlapping after convergence.
Only 44 of the initially generated 544 traces fail the dual criterion (Val-ACC ≥ 0.92 and Val-Loss ≤ 0.10) and are discarded, leaving 500 synthetic sequences for downstream use—an acceptance rate of 91.9%.
The near-identical LSTM-1 and LSTM-2 curves confirm that the accepted synthetic sequences occupy the same data manifold as the real records, adding diverse yet plausible variations.

4.3. CNN and CNN-ResNet Training Convergence Characteristics

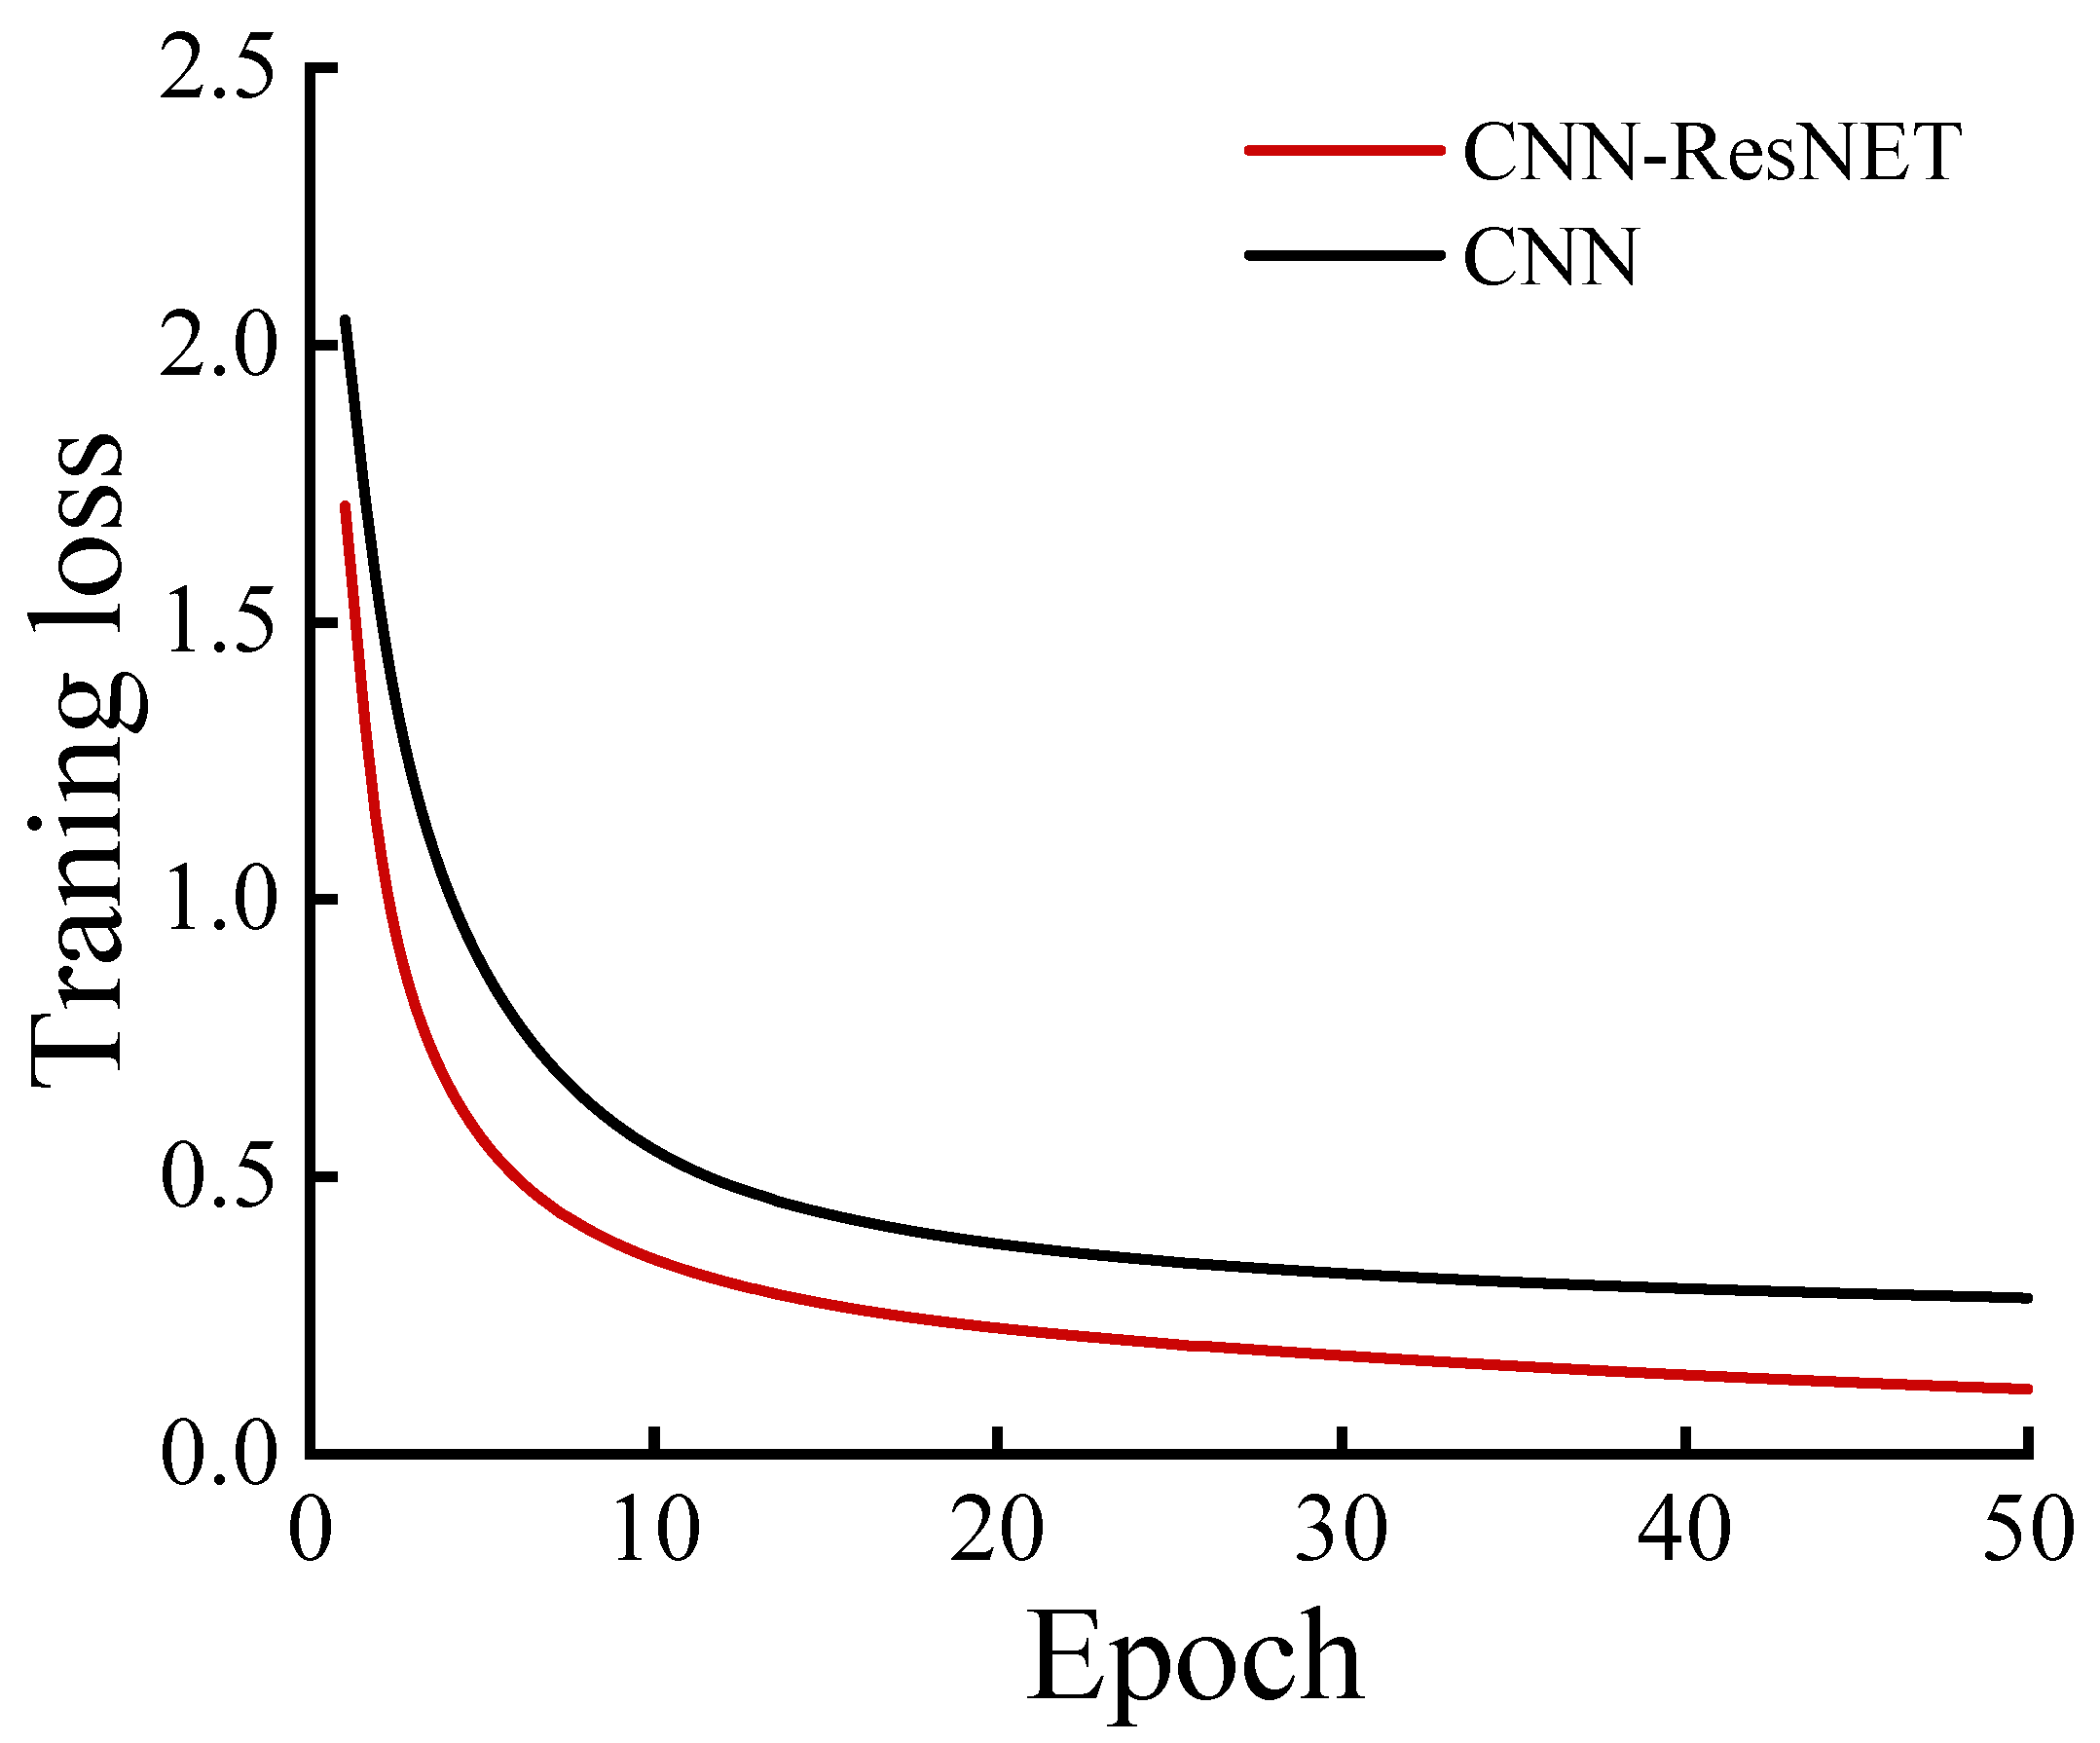
Building on the previous sample and training process, this section explores the convergence efficiency of CNN and CNN-ResNet under identical hyperparameters by comparing the epoch-wise Cross-Entropy Loss within the convolutional portion. The Cross-Entropy Loss is defined by Equation (12):
L = 1 N i = 1 N c = 1 C y i , c log y i , c ^
where N denotes the total number of samples, C denotes the number of categories, y i , c is the true label of sample i for category c, and y i , c ^ is the predicted probability of the model.
We compare these two algorithms independently because both employ gradient-based, end-to-end training—enabling a direct view of convergence via the “loss vs. iteration” curve. By contrast, Random Forest primarily reduces errors by “adding trees,” lacking a shared loss-iteration mechanism with deep networks.
As shown in Figure 7, training CNN and CNN-ResNet under the same hyperparameters reveals that CNN-ResNet converges faster and more stably. Specifically, CNN’s average loss rapidly declines to around 0.4 in the first five epochs and then slows and settles near 0.2. Meanwhile, CNN-ResNet decreases further to about 0.15 in the same epoch range—indicating that adding a residual structure better mitigates gradient decay or degradation in deeper networks and thus significantly improving training performance.

4.4. Random Forest Section and OOBError Analysis

After CNN or CNN-ResNet extracts deep features, we feed them into Random Forest (RF) for multi-condition classification. Random Forest training primarily reduces the out-of-bag error (OOBError) by increasing the number of decision trees; OOBError is computed via Equation (13):
O O B E r r o r = 1 N i = 1 N I y O O B , i ^ y i
where y O O B , i ^ denotes the prediction of sample i obtained using only the part of the decision tree that does not contain sample i; I ( · ) is an indicator function equal to 1 if the prediction differs from the true y i , and it is 0 otherwise.
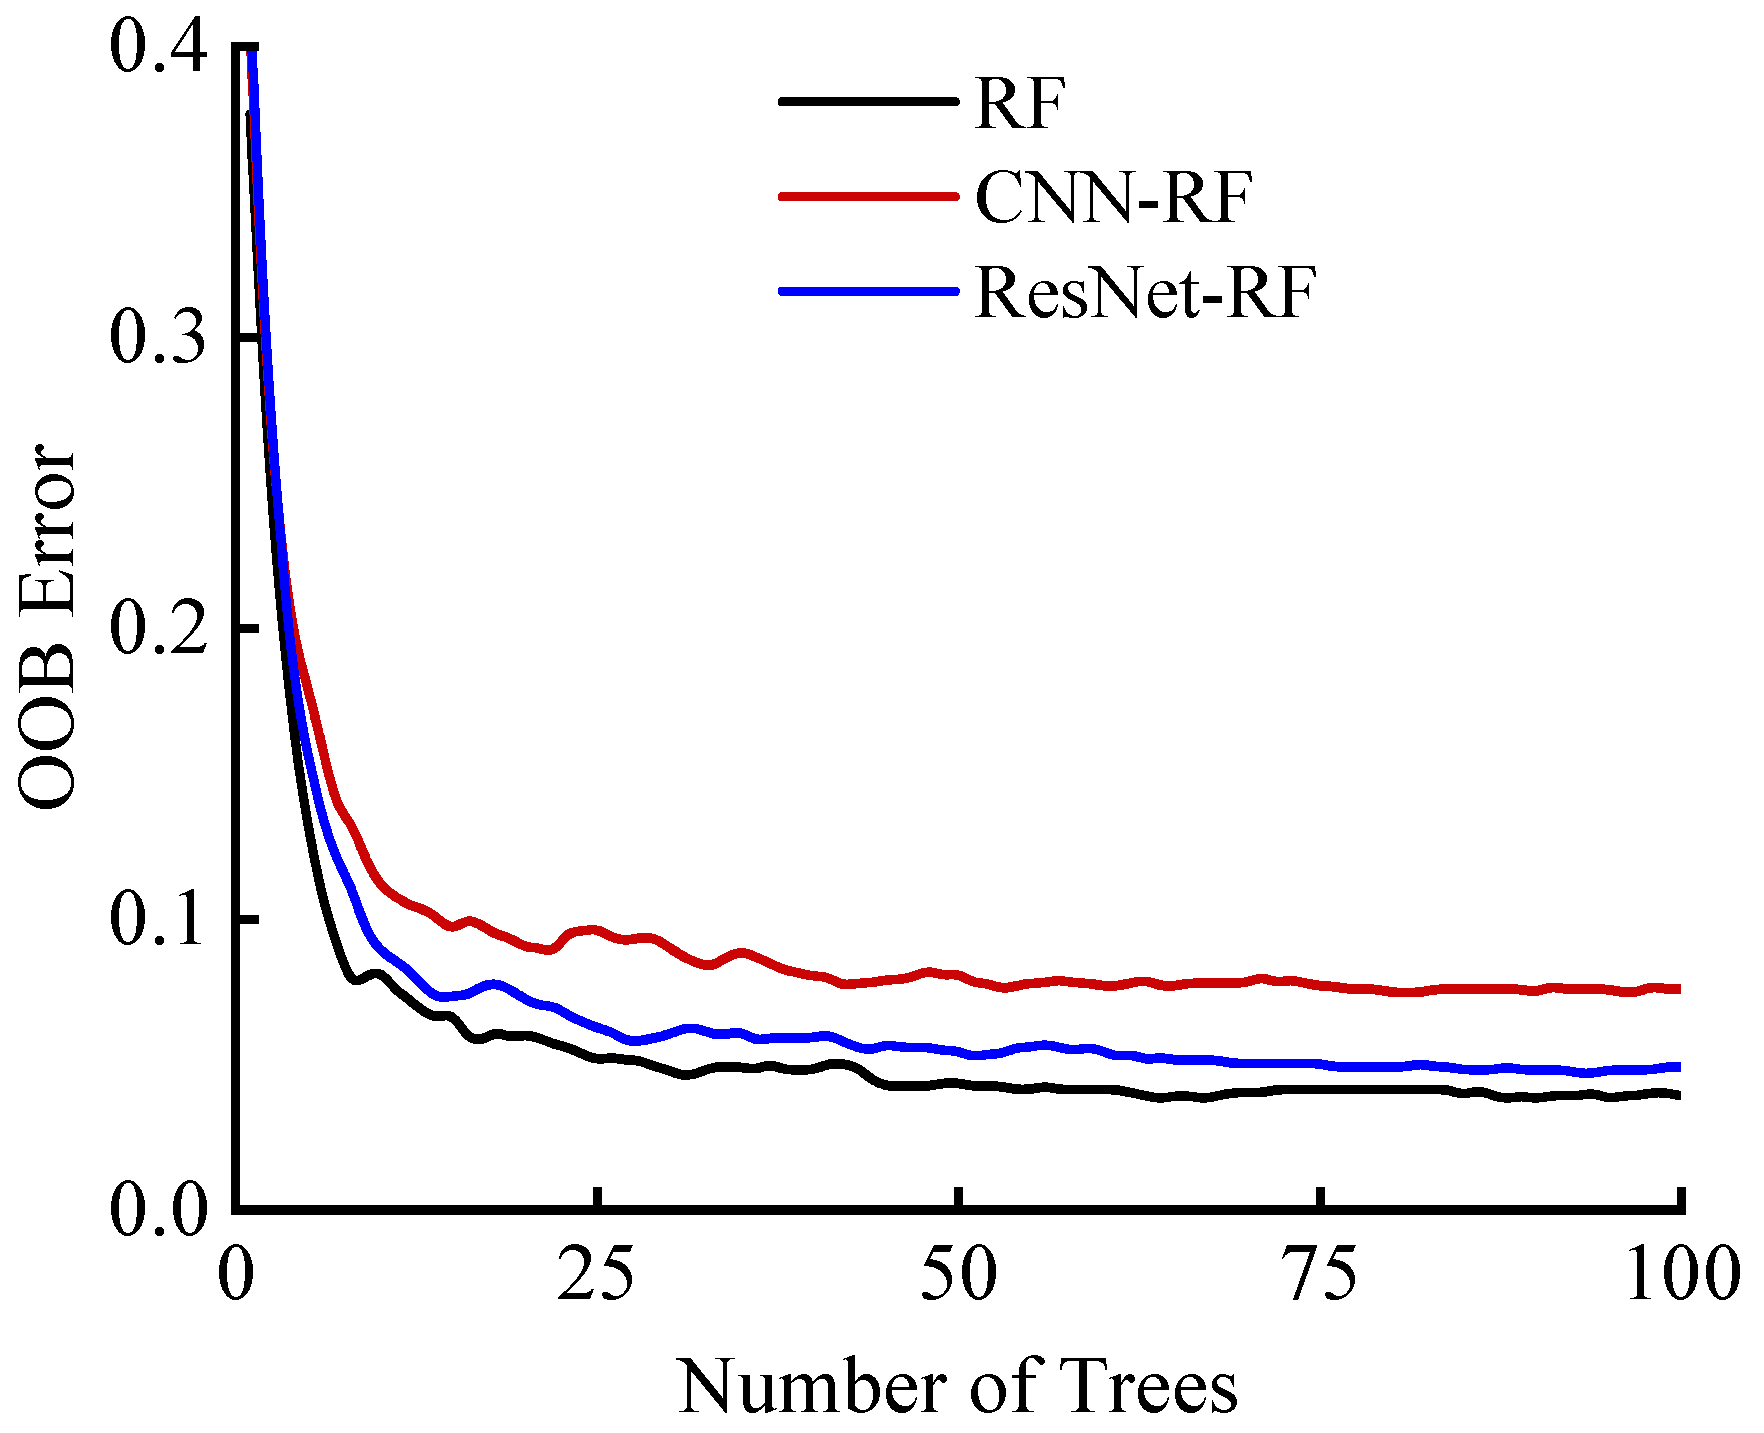
Specifically, three models are tested: (1) pure RF (using only raw features), (2) CNN-RF (CNN-extracted features fed into RF), and (3) CNN-ResNet-RF (CNN-ResNet features fed into RF). While increasing the number of decision trees from 1 to 100, we tracked OOBError, as shown in Figure 8. Notably, (a) the OOBError of pure RF drops steeply from 0.2 to 0.07 within the first 10 trees and then stabilizes after 20–30 trees; (b) CNN-RF shows slight improvements over pure RF yet experiences larger OOBError fluctuation mid-range; (c) CNN-ResNet-RF’s OOBError curve is smoother overall, stabilizing after around 40 trees and remaining between 0.03 and 0.04. These findings suggest that adding deep network-extracted features to RF further lowers the out-of-bag error and enhances generalization, particularly on imbalanced data. Compared with CNN-RF, CNN-ResNet-RF benefits from residual structures that yield more discriminative embeddings, thus accelerating OOBError reduction and achieving a lower stable value during tree addition.

4.5. Model Comparison and Analysis

To comprehensively evaluate the practical effectiveness of the five models, this section combines training performance analysis (Section 4.3 and Section 4.4) with accuracy-based metrics, including macro-averaged Precision, Recall, F1, and Overall Accuracy. These metrics enable a fair and interpretable comparison of model behaviors across fault types, especially under imbalanced data conditions.
As seen in Figure 9, the CNN model underperforms due to overfitting on limited field samples, which justifies the necessity of using enhanced architectures. Meanwhile, the “OOBError vs. Trees” comparison among RF, CNN-RF, and CNN-ResNet-RF in Section 4.3 illustrates how out-of-bag error evolves with added decision trees and how deep features improve generalization.
Nonetheless, neither training loss nor OOBError alone fully reflects each model’s classification performance in real working conditions. Hence, this study adopts multi-class Precision, Recall, and F1-score in the test set to evaluate the five models (CNN, CNN-ResNet, RF, CNN-RF, and CNN-ResNet-RF). The Precisionᵢ, Recallᵢ, and F1ᵢ for the i-th operating condition are calculated using Equations (14), (15) and (16), respectively:
P r e c i s i o n i = T P i T P i + F P i
R e c a l l i = T P i T P i + F N i
F 1 i = 2 × P r e c i s i o n i × R e c a l l i P r e c i s i o n i + R e c a l l i
where TPi denotes true cases (i.e., the number of samples that were predicted as positive by the model and are actually positive); FPi denotes false positive cases (i.e., the number of samples that were predicted as positive by the model but are actually negative); FNi denotes false negative cases (i.e., the number of samples that were predicted as negative by the model but are actually positive) [40,41]. Due to the uneven distribution of each category, to measure the overall level, Macro-Avg is usually performed for Precisioni, Recalli, and F1i, and the arithmetic mean of each category is taken to obtain Macro-Precision, Macro-Recall, and Macro-F1. In addition, this study also counts the overall correctness rate of the entire test’s Overall Accuracy (OverallAcc) for the whole test set for comparison. However, the base CNN model demonstrates relatively poor generalization capabilities in our experiment, particularly for fault types with limited samples. This is mainly because traditional CNN architectures, when trained on small-scale and imbalanced datasets, tend to overfit and fail to extract sufficiently robust features. In contrast, the residual structure in ResNet and the ensemble decision of Random Forest compensate for this limitation, leading to more stable classification performances across all six operating conditions.
Using these metrics, the five models’ test-set classification results can be summarized in Figure 9, listing Macro-Precision, Macro-Recall, Macro-F1, and OverallAcc. The CNN model shows lower accuracy due to its limited ability to generalize on small-scale and imbalanced field data. This result supports the need for residual feature extraction and ensemble classification in complex fault scenarios. As shown, CNN-ResNet-RF ranks highest or nearly the highest in macro-average metrics and overall accuracy. By combining residual deep features with Random Forest’s ensemble capabilities, CNN-ResNet-RF significantly lowers misclassification rates and offers better generalization in multi-condition diagnosis. In particular, the CNN model’s low scores reflect its limited capacity to generalize under small-sample and noisy conditions. While CNN captures coarse load trends, it lacks robustness against signal overlap or class similarity (e.g., C2 vs. C5). This further motivates the use of residual-enhanced and ensemble-based methods, as shown by CNN-ResNet-RF’s superior metrics.
To analyze class-level behavior, Table 3 lists the validation accuracy of each operating condition together with the overall accuracy of the five baseline models. CNN-ResNet-RF achieves the highest or near-highest scores in every column, notably reducing the confusion previously observed between C-2 (tubing leakage) and C-5 (low parameter). Figure 10a shows its class-wise Precision, Recall, and F1 when trained on real-only data; each metric already exceeds 0.90 for most categories.
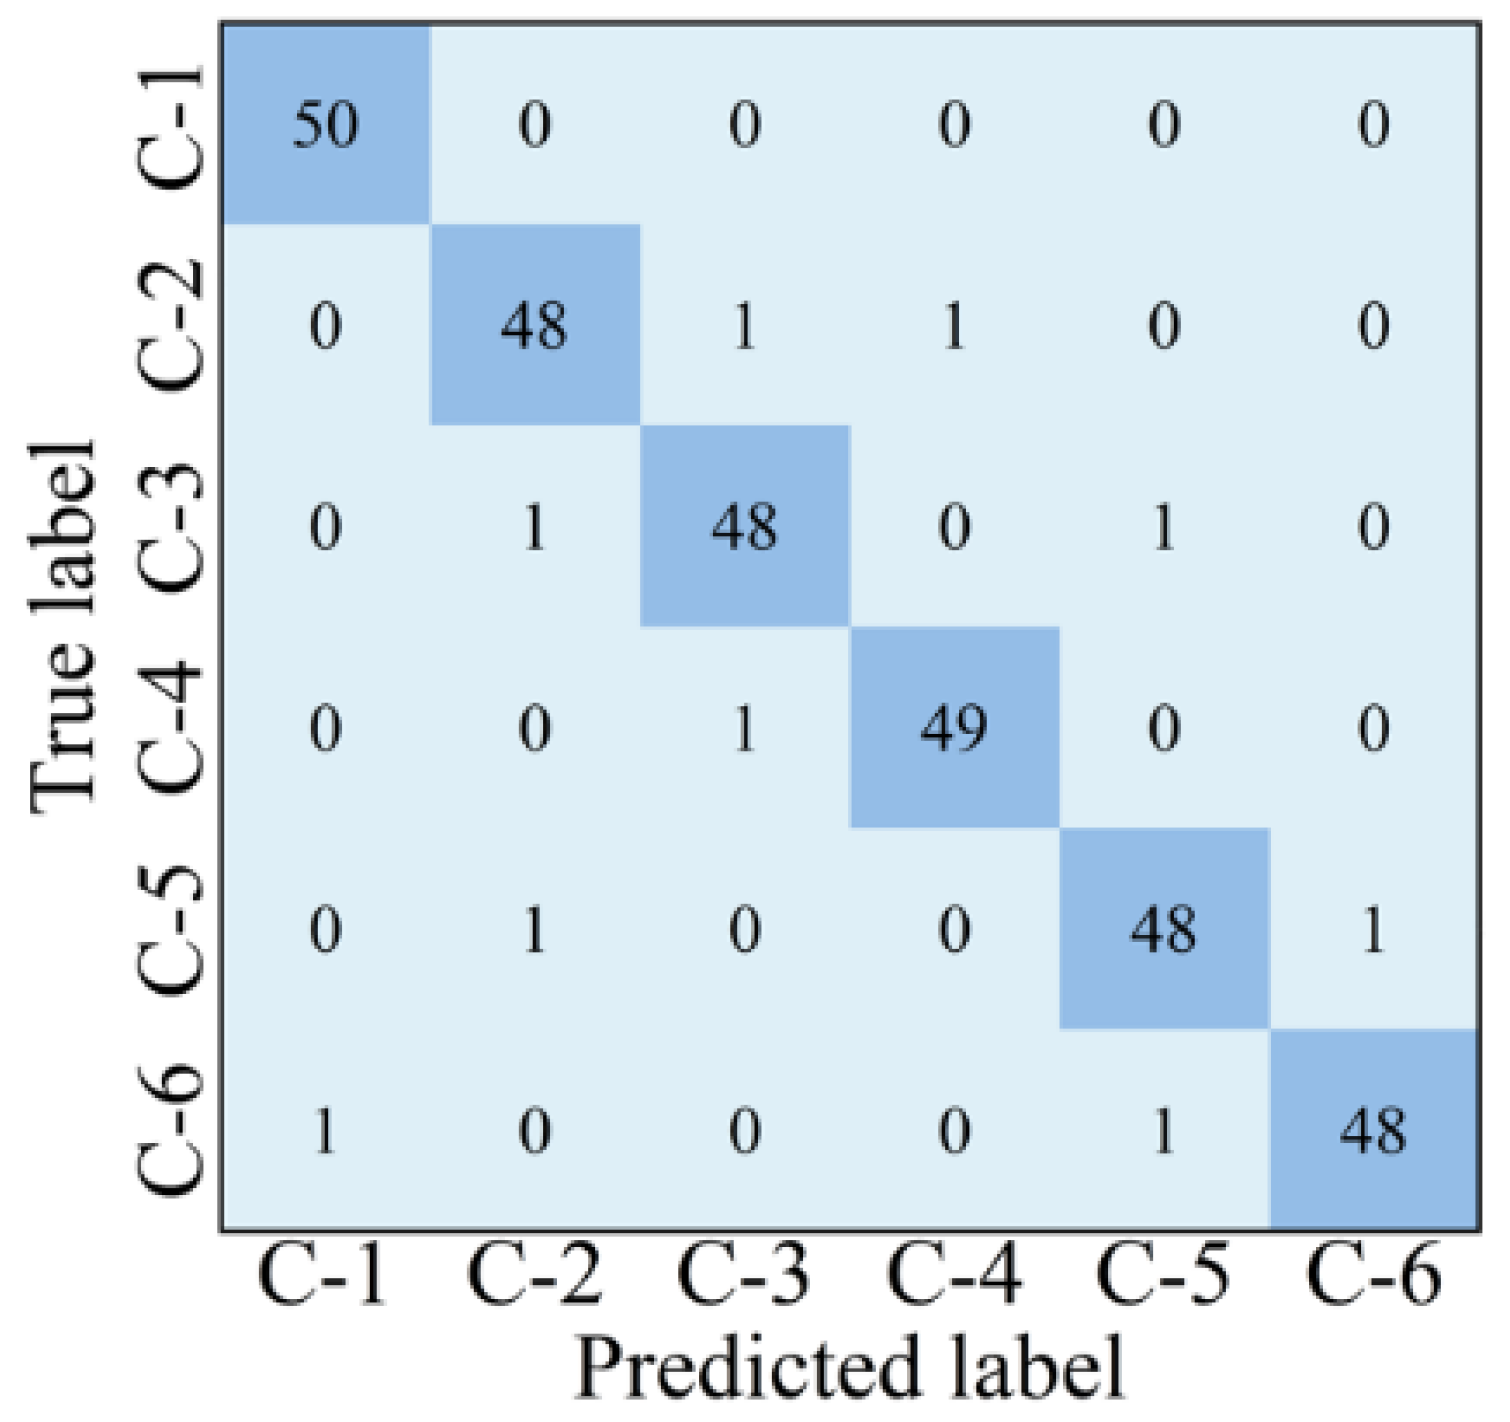
Guided by this baseline, the same architecture was retrained with the Augment set (360 real + 590 TimeGAN sequences) while the validation split remained 100% real. Figure 10b reveals a systematic upward shift for every class: Precision and Recall now lie between 92% and 99%, and no F1 value falls below 0.94. The accompanying confusion matrix in Figure 11 confirms the improvement, with an overall validation accuracy of 97.3% (vs. 96.1% in Figure 10a). Normal operation (C-1) reaches 100%, while the two minority faults C-2 and C-5 rise from 94–95% to 96%. Averaged over the six conditions, Macro-Precision, Macro-Recall, and Macro-F1 each climb by ≈ 1.5 pp, demonstrating that the TimeGAN sequences supply physically consistent variability that sharpens decision boundaries without harming the majority class.
To demonstrate that the performance gain is not merely a consequence of data augmentation but of the proposed fusion architecture itself, we also trained three widely adopted sequence-based classifiers—an LSTM network, its lighter gated-recurrent counterpart GRU, and a probabilistic-neural-network front-end coupled to LSTM (PNN-LSTM)—all on exactly the same augmented set of 360 real traces and 590 TimeGAN traces, validating on the identical 300-trace real hold-out. Under these conditions, the plain LSTM, which has proven effective in electric submersible-pump diagnostics [7], reached 92.8% overall accuracy (Macro-F1 = 93.6%); the GRU variant, frequently recommended for rotating machinery when shorter sequences are sufficient [42], improved to 92.6% (93.0%); the more elaborate PNN-LSTM, recently reported for time-series fault modelling [39], achieved 95.4% (95.9%). By contrast, our TimeGAN-enhanced CNN-ResNet-RF attained 97.2% overall accuracy and 97.4% Macro-F1 on the same validation split, confirming that the combination of residual feature extraction and ensemble voting contributes a decisive margin even after all models benefit from the additional synthetic sequences.
As summarized in Table 4, the TimeGAN-augmented CNN-ResNet-RF reproduces the field diagnosis for almost every faulted well in the hold-out set. For instance, well J033 exhibited a current trace that “slowly rises in concert with an increasing load,” which the model classified as wax deposition—a diagnosis later confirmed during maintenance. Likewise, well J420 showed the characteristic “current drop to near-zero followed by shutdown,” and the model correctly labelled the event as a rod break, a conclusion verified when the broken rod was retrieved. Such one-to-one agreement between predicted and observed fault types indicates that the enhanced network retains the robustness of the original CNN-ResNet-RF while benefiting from the broader fault variability introduced by TimeGAN, thereby offering reliable decision support for on-site diagnosis, preventative maintenance, and real-time monitoring.
In summary, the TimeGAN-augmented CNN-ResNet-RF model delivers the most reliable multi-condition diagnosis across all experiments. After synthetic balancing, Overall Accuracy, macro-averaged Precision, Recall, and F1 all improve, and the confusion-matrix diagonal becomes noticeably cleaner, indicating sharper class separation. In contrast, a plain CNN—lacking residual refinement and ensemble voting—remains constrained by the small, imbalanced field dataset and shows visibly higher off-diagonal errors. These observations confirm that residual feature encoding and Random-Forest voting are both indispensable and that class-aware TimeGAN augmentation further amplifies their strengths.
The evaluation was performed in a strictly stepwise manner. This progression isolates the individual contributions of spatial convolution, residual connections, ensemble voting, and generative augmentation. The resulting evidence shows that coarse architectures may detect gross anomalies, but only the residual-ensemble model trained on a realistically balanced dataset can distinguish fine-grained ESPCP faults under severe noise and imbalance. The TimeGAN-enhanced CNN-ResNet-RF therefore provides an effective and field-ready solution for the real-time condition monitoring of electric submersible progressive-cavity pumps.

5. Conclusions

In this study, we proposed an end-to-end fault-diagnosis framework for electric submersible progressive-cavity pumps that fuses four key ingredients: deep spatial encoding (1-D CNN), residual refinement, ensemble decision-making (Random Forest), and class-aware generative augmentation (TimeGAN). The residual blocks alleviate vanishing-gradient effects and preserve discriminative details in multichannel pump signals, while the RF head supplies robust, noise-tolerant voting. TimeGAN further enlarges minority-fault coverage with physically plausible sequences, allowing the network to learn a richer decision boundary from a small and imbalanced field dataset. Across all experiments, the augmented CNN-ResNet-RF model outperforms LSTM, GRU, PNN-LSTM, and two ablated CNN variants, achieving the highest overall accuracy and Macro-F1 without overfitting. Practically, the model differentiates field-critical faults—such as wax deposition versus tubing leakage—early enough to trigger fault-specific maintenance. An abrupt current drop that signals rod breakage can now prompt an immediate shutdown, whereas a slow torque rise indicating wax build-up can schedule a planned clean-out. These actionable outputs make the framework suitable for integration into real-time ESPCP monitoring and predictive-maintenance platforms. Methodologically, this work illustrates how residual encoding, ensemble classification, and realistic data augmentation can be co-designed to cope with weak class separability, high inter-class similarity, and severe data imbalance—hallmarks of many industrial time-series problems. The resulting blueprint extends beyond ESPCPs and can inform diagnostic solutions for other low-sample, high-noise equipment where conventional deep or shallow models alone fall short.

Author Contributions

Conceptualization, X.L. and J.S.; Methodology, X.L. and J.S.; Software, X.L. and J.S.; Validation, X.L., J.S., C.L., S.Z., D.Z., Z.H. and S.H.; Formal analysis, X.L., J.S. and C.L.; Investigation, X.L., J.S., S.Z. and D.Z.; Resources, X.L., C.L., D.Z., Z.H. and S.H.; Data curation, X.L., J.S., S.Z., Z.H. and S.H.; Writing—original draft, X.L., J.S., C.L. and S.Z.; Writing—review & editing, X.L., J.S., C.L., S.Z. and D.Z.; Visualization, J.S. and C.L.; Supervision, X.L. and Z.H.; Project administration, X.L., J.S., C.L. and D.Z.; Funding acquisition, X.L. All authors have read and agreed to the published version of the manuscript.

Funding

This work was financially supported by the National Natural Science Foundation of China (Grant Nos. 52074161 and 52005281), Taishan Scholar Project of Shandong Province (Grant No. tsqn202211177), Shandong Provincial Plan for Introduction and Cultivation of Young Pioneers in Colleges and Universities (Grant No. 2021-Qing Chuang-30613019), and Natural Science Foundation of Shandong Province (Grant Nos. ZR2022ME173 and ZR2023QE011).

Data Availability Statement

If necessary, please contact the corresponding author.

Conflicts of Interest

Authors Shousen Zhang and Di Zhang were employed by the Offshore Oil Engineering Co., Ltd. Authors Zhongxian Hao and Shouzhi Huang were employed by the PetroChina. The remaining authors declare that the research was conducted in the absence of any commercial or financial relationships that could be construed as a potential conflict of interest.

References

  1. Hao, Z.X.; Zhu, S.J.; Pei, X.H.; Huang, P.; Tong, Z.; Wang, B.Y.; Li, D.Y. Submersible direct-drive progressing cavity pump rodless lifting technology. Pet. Explor. Dev. 2019, 46, 621–628. [Google Scholar] [CrossRef]
  2. Liu, L.; Liu, W.H.; Ma, G.M.; Gen, H.Y. Field Practice of the Submersible Electric Screw Pump Production System. Oil Drill. Prod. Technol. 2003, 25 (Suppl. S1), 30–32+91–92. [Google Scholar] [CrossRef]
  3. Yang, P.H.; Chen, J.R.; Zhang, H.R.; Li, S. A Fault Identification Method for Electric Submersible Pumps Based on DAE-SVM. Shock. Vib. 2022, 2022, 5868630. [Google Scholar] [CrossRef]
  4. Jiang, M.Z.; Cheng, T.C.; Dong, K.X.; Xu, S.F.; Geng, Y.L. Fault diagnosis method of submersible screw pump based on random forest. PLoS ONE 2020, 15, e0242458. [Google Scholar] [CrossRef]
  5. Nolte, K.; Gerharz, A.; Jaitner, T.; Alt, T. Finding the needle in the haystack of isokinetic knee data: Random Forest modelling improves information about ACLR-related deficiencies. J. Sports Sci. 2025, 43, 173–181. [Google Scholar] [CrossRef]
  6. Liu, Y.C.; Li, Z.Y. Key technology and application of intelligent connected patrol vehicles for security scenario. Telecommun. Sci. 2020, 36, 53–60. [Google Scholar] [CrossRef]
  7. Liu, D.J.; Feng, G.Q.; Feng, G.Y.; Xie, L.J. Hybrid Long Short-Term Memory and Convolutional Neural Network Architecture for Electric Submersible Pump Condition Prediction and Diagnosis. SPE J. 2024, 29, 2130–2147. [Google Scholar] [CrossRef]
  8. Hu, Y.; Soltoggio, A.; Lock, R.; Cater, S. A fully convolutional two-stream fusion network for interactive image segmentation. Neural Netw. 2019, 109, 31–42. [Google Scholar] [CrossRef]
  9. LeCun, Y.; Bengio, Y.; Hinton, G. Deep learning. Nature 2015, 521, 436–444. [Google Scholar] [CrossRef]
  10. Alguliyev, R.; Imamverdiyev, Y.; Sukhostat, L. Intelligent diagnosis of petroleum equipment faults using a deep hybrid model. SN Appl. Sci. 2020, 2, 924. [Google Scholar] [CrossRef]
  11. Guo, Z.; Hao, Y.; Shi, H.; Wu, Z.; Wu, Y.; Sun, X. A Fault Diagnosis Algorithm for the Dedicated Equipment Based on the CNN-LSTM Mechanism. Energies 2023, 16, 5230. [Google Scholar] [CrossRef]
  12. He, W.; Chen, J.; Zhou, Y.; Liu, X.; Chen, B.; Guo, B. An Intelligent Machinery Fault Diagnosis Method Based on GAN and Transfer Learning under Variable Working Conditions. Sensors 2022, 22, 9175. [Google Scholar] [CrossRef]
  13. Chen, M.; Wu, J.J.; Liu, L.Z.; Zhao, W.H.; Tian, F.; Shen, Q.; Zhao, B.Y.; Du, R.H. DR-Net: An improved network for building extraction from high resolution remote sensing image. Remote Sens. 2021, 13, 294. [Google Scholar] [CrossRef]
  14. Chai, Y.J.; Ma, J.; Liu, H. Deep Graph Attention Convolution Network for Point Cloud Semantic Segmentation. Laser Optoelectron. Prog. 2021, 58, 208–215. [Google Scholar] [CrossRef]
  15. Esteban, C.; Hyland, S.L.; Rätsch, G. Real-valued (medical) time series generation with recurrent conditional gans. arXiv 2017, arXiv:1706.02633. [Google Scholar] [CrossRef]
  16. Yoon, J.; Jarrett, D.; Van der Schaar, M. Time-series generative adversarial networks. Adv. Neural Inf. Process. Syst. 2019, 32, 5508–5518. [Google Scholar] [CrossRef]
  17. Gao, X.; Deng, F.; Yue, X. Data augmentation in fault diagnosis based on the Wasserstein generative adversarial network with gradient penalty. Neurocomputing 2020, 396, 487–494. [Google Scholar] [CrossRef]
  18. Yu, S.; Li, Z.; Gu, J.; Wang, R.; Liu, X.; Li, L.; Guo, F.; Ren, Y. CWMS-GAN: A small-sample bearing fault diagnosis method based on continuous wavelet transform and multi-size kernel attention mechanism. PLoS ONE 2025, 20, e0319202. [Google Scholar] [CrossRef]
  19. Bonella, V.B.; Ribeiro, M.P.; Mello, L.H.S.; Oliveira-Santos, T.; Rodrigues, A.L.; Varejão, F.M. Deep learning intelligent fault diagnosis of electrical submersible pump based on raw time domain vibration signals. In Proceedings of the IEEE 31st International Symposium on Industrial Electronics (ISIE), Anchorage, AK, USA, 1–3 June 2022; IEEE: New York, NY, USA, 2022; pp. 156–163. [Google Scholar] [CrossRef]
  20. Liu, L.Y.; Li, X.Y.; Lan, T.; Cheng, Y.K.; Chen, W.; Li, Z.X.; Cao, S.; Han, W.L.; Zhang, X.S.; Chai, H.F. A Survey on Anti-Money Laundering Techniques in Blockchain Systems. Strateg. Study CAE 2020, 27, 287–303. [Google Scholar] [CrossRef]
  21. Jiang, G.X.; Zhang, N.; Wang, W.J. Cluster Distribution-guided Label Noise Detection and Cleaning. J. Chin. Comput. Syst. 2024, 50, 154–168. Available online: http://kns.cnki.net/kcms/detail/21.1106.tp.20250311.1815.024.html (accessed on 20 March 2025).
  22. Liu, J.H.; Zhou, M.L.; Shao, W.W. Spatio-Temporal Characteristics and Influencing Factors Analysis of Groundwater Storage Variations in the Yellow River Basin. Yellow River 2024, 46, 67–73. [Google Scholar] [CrossRef]
  23. Zhang, D.U.; Jiang, H.Y.; Tian, X.; Yuan, S.B.; Zhao, L.M. Principle and design of automatic pressure release device fordownhole drive pump. Min. Process. Equip. 2016, 44, 66–70. [Google Scholar] [CrossRef]
  24. Xie, J.Y.; Cheng, H.; Chu, Y.J.; Lu, L.M.; Zhang, J.W. Failure Model and Intelligent Diagnosis Method of Process Control of EPCP. China Pet. Mach. 2023, 51, 116–121. [Google Scholar] [CrossRef]
  25. Qu, W.T.; Yan, H.; Sun, Y.P.; Shi, C.Y.; Yang, B. Fault Diagnosis Method of Surface Driven Screw Pump Well. Mach. Des. Res. 2021, 37, 159–162. [Google Scholar] [CrossRef]
  26. Nie, F.P.; Ma, Y.; Zhang, X.M.; Li, L.H.; Chen, W. A new method for behavior diagnose of progressive cavity pump wells. Fault-Block Oil Gas Field 2007, 14, 76–77+94. [Google Scholar] [CrossRef]
  27. Yu, D.L.; Li, Y.M.; Ding, B.; Ren, Y.L.; Qi, W.G. Failure Diagnosis Method for Electric Submersible Plunger Pump Based on Mind Evolutionary Algorithm and Back Propagation Neural Network. Inf. Control 2017, 46, 698–705. [Google Scholar] [CrossRef]
  28. Lin, J.F. Fault Analysis and Treatment Method and Maintenance Management Practice of Double Submersible Electric Pump Well. Petro Chem. Equip. 2021, 24, 80–83. [Google Scholar] [CrossRef]
  29. Liu, Y.; Pu, H.; Sun, D.W. Efficient extraction of deep image features using convolutional neural network (CNN) for applications in detecting and analysing complex food matrices. Trends Food Sci. Technol. 2021, 113, 193–204. [Google Scholar] [CrossRef]
  30. Barbhuiya, A.A.; Karsh, R.K.; Jain, R. CNN based feature extraction and classification for sign language. Multimed. Tools Appl. 2021, 80, 3051–3069. [Google Scholar] [CrossRef]
  31. Zhou, F.Y.; Jin, L.P.; Dong, J. Review of Convolutional Neural Network. Chin. J. Comput. 2017, 40, 1229–1251. [Google Scholar] [CrossRef]
  32. Wang, Y.C.; Li, M.T.; Pan, Z.C.; Zheng, J.H. Pulsar candidate classification with deep convolutional neural networks. Res. Astron. Astrophys. 2019, 19, 133. [Google Scholar] [CrossRef]
  33. Gao, J. Network intrusion detection method combining CNN and BiLSTM in cloud computing environment. Comput. Intell. Neurosci. 2022, 2022, 7272479. [Google Scholar] [CrossRef] [PubMed]
  34. Yu, H.H.; Yan, X.P.; Liu, S.K.; Li, P.; Hao, X.H. Radar emitter multi-label recognition based on residual network. Def. Technol. 2022, 18, 410–417. [Google Scholar] [CrossRef]
  35. Zhang, Z.C.; Hong, W.C. Application of variational mode decomposition and chaotic grey wolf optimizer with support vector regression for forecasting electric loads. Knowl.-Based Syst. 2021, 228, 107297. [Google Scholar] [CrossRef]
  36. Li, B.; He, Y. An improved ResNet based on the adjustable shortcut connections. IEEE Access 2018, 6, 18967–18974. [Google Scholar] [CrossRef]
  37. Guo, X.; Chen, Y.P.; Tang, R.X.; Huang, R.Z.; Qing, Y.B. Predicate Head Identification Based on Boundary Regression. Comput. Eng. Appl. 2023, 59, 144–150. [Google Scholar] [CrossRef]
  38. Liu, H.L.; Cao, S.J.; Xu, J.Y.; Chen, S.Y. Anti-fraud Research Advances on Digital Credit Payment. J. Front. Comput. Sci. Technol. 2023, 17, 2300–2324. [Google Scholar] [CrossRef]
  39. Zhou, Y.F.; Liu, X.F.; Cao, Y.F.; Ou, Y.T.B. Fault Prediction Method for Electric Submersible Pumps Based on LSTM-PNN Neural Network. Mach. Tool Hydraul. 2024, 52, 209–215. [Google Scholar] [CrossRef]
  40. Wang, H.R.Q.; Wu, H.R.; Feng, S.; Liu, Z.C.; Xu, T.Y. Classification Technology of Rice Questions in Question Answer System Based on Attention_DenseCNN. Trans. Chin. Soc. Agric. Mach. 2021, 52, 237–243. [Google Scholar] [CrossRef]
  41. Lin, Z.X.; Wang, L.K. Network situation prediction method based on deep feature and Seq2Seq model. J. Comput. Appl. 2020, 40, 2241–2247. [Google Scholar] [CrossRef]
  42. Yuan, J.; Tian, Y. An Intelligent Fault Diagnosis Method Using GRU Neural Network towards Sequential Data in Dynamic Processes. Processes 2019, 7, 152. [Google Scholar] [CrossRef]
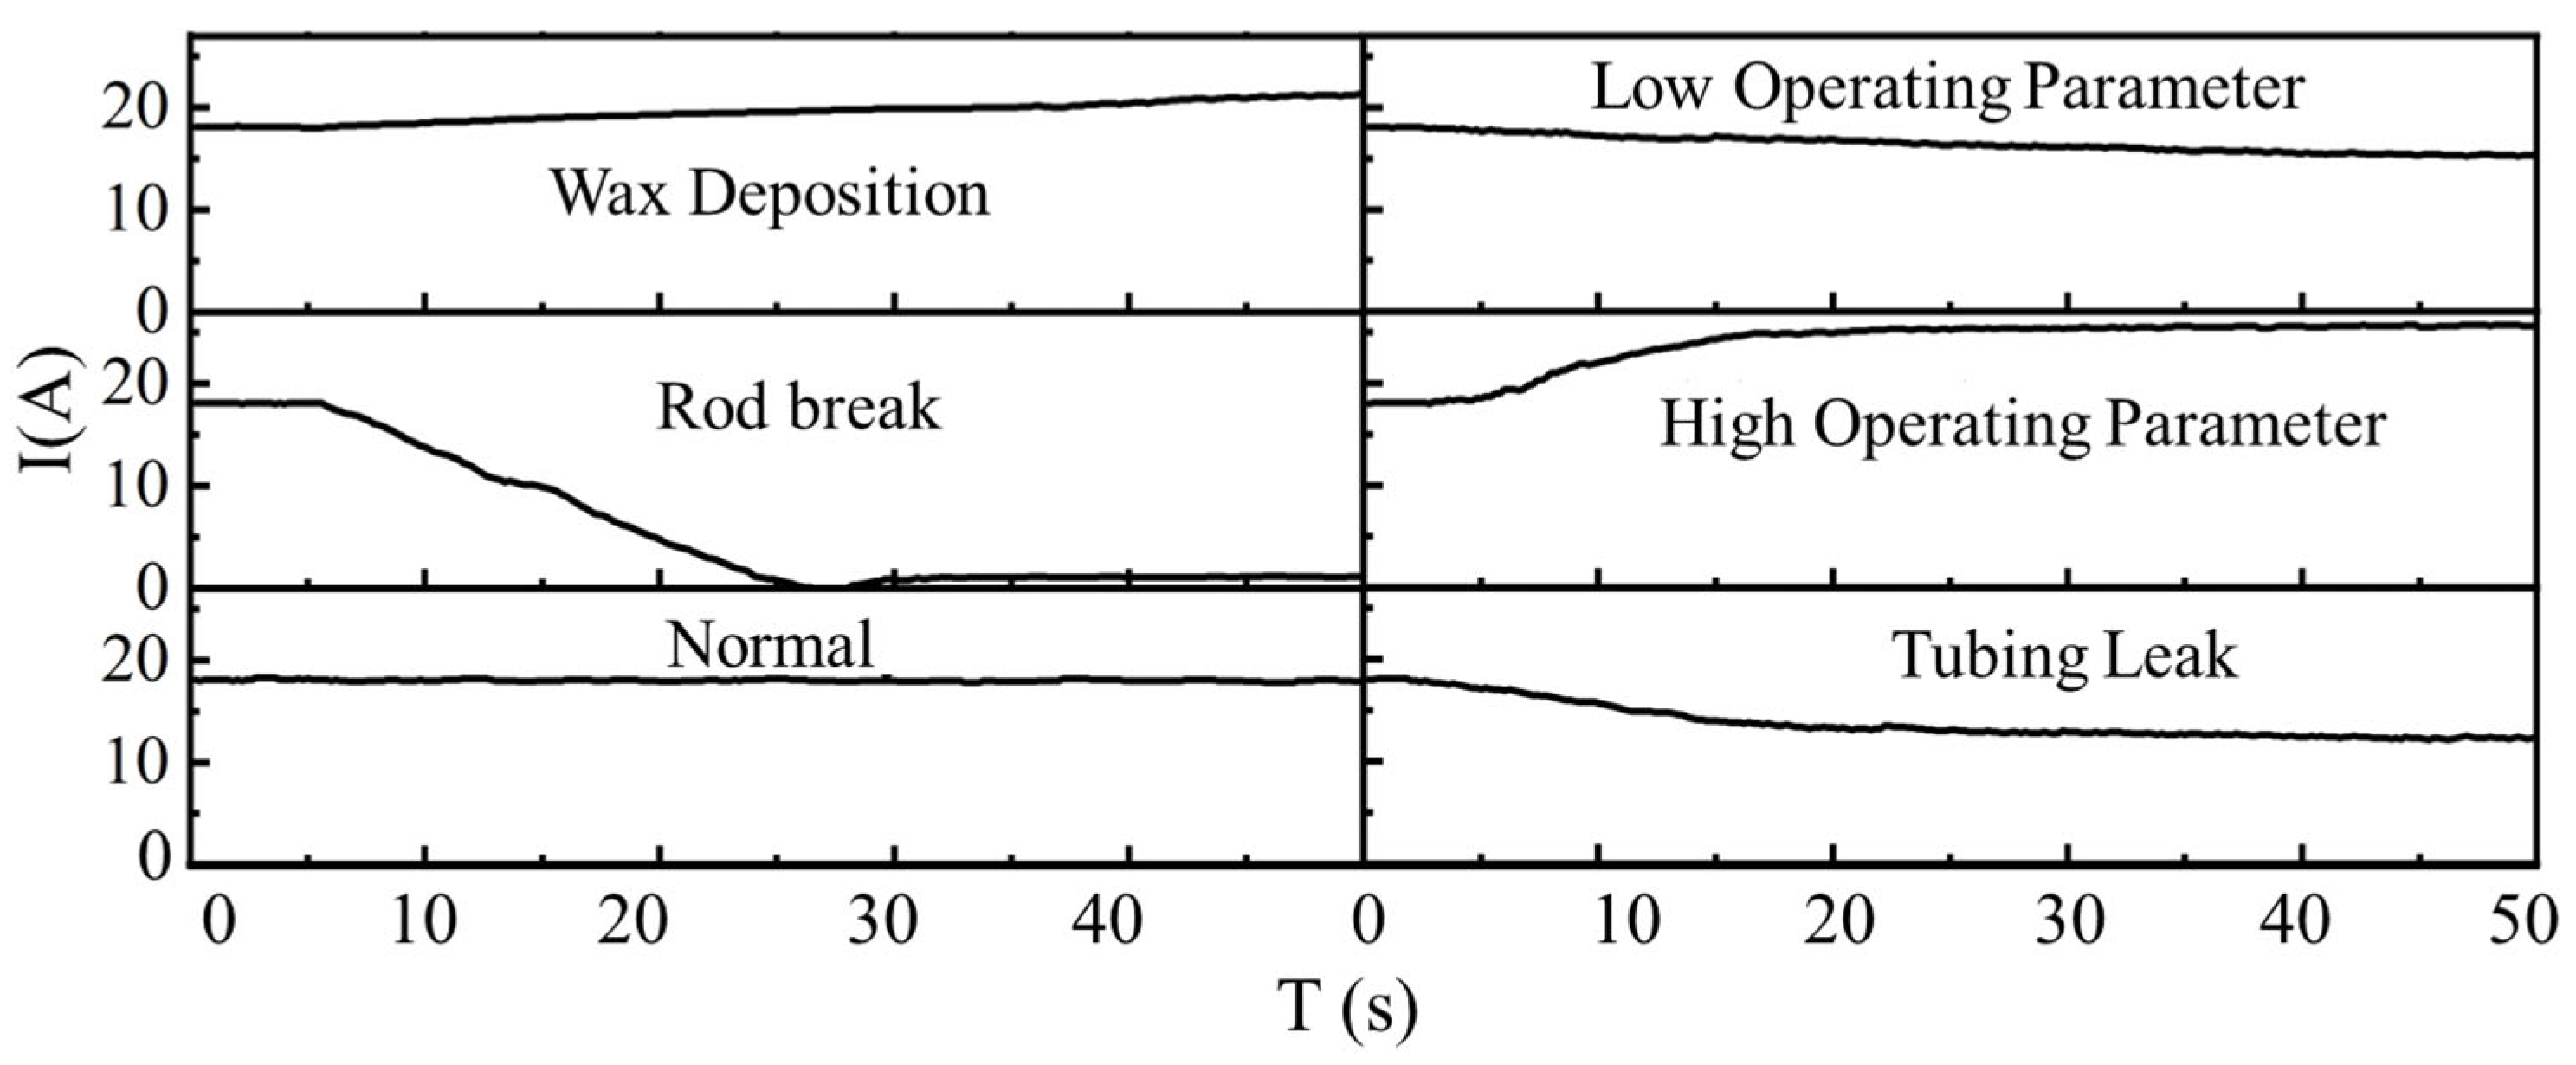
Figure 1. Current signal characteristics for different operating conditions. Note: Signals are independently sampled from different wells and not time-aligned. Each subplot displays time (in seconds) on the x-axis and current I (in amperes) on the y-axis. I(A) refers to the current magnitude.
Processes 13 02043 g001
Figure 2. TimeGAN-based class-conditioned data-augmentation pipeline.
Processes 13 02043 g002
Figure 3. Convolutional residual block ResNet network architecture design: (a) structure of the residual network; (b) identity residual block.
Processes 13 02043 g003
Figure 4. Schematic of the Random Forest principle.
Processes 13 02043 g004
Figure 5. CNN-ResNet-RF fusion architecture with optional TimeGAN-generated training samples.
Processes 13 02043 g005
Figure 6. Bidirectional LSTM sanity-check curves for the TimeGAN-augmented fault class.
Processes 13 02043 g006
Figure 7. Plot of training loss error function.
Processes 13 02043 g007
Figure 8. Comparison of different RF models’ OOBErrors.
Processes 13 02043 g008
Figure 9. Model-level performance comparison across CNN, RF, and fusion methods.
Processes 13 02043 g009
Figure 10. Class-wise Precision, Recall, and F1 of CNN-ResNet-RF. (a) Real-only training; (b) TimeGAN-augmented training.
Processes 13 02043 g010
Figure 11. Validation confusion matrix of the TimeGAN-augmented CNN-ResNet-RF.
Processes 13 02043 g011
Table 1. Classification and variation characteristics of current signals under different operating conditions.
Operating ConditionVariation in Current Signal
NormalThe current remains stable, fluctuating slightly around a fixed value.
Rod breakThe current drops sharply at the moment of rod failure, rapidly approaching zero from its normal level. It then stays at an extremely low value or triggers device shutdown, causing the pump to enter an unloaded state.
Tubing leakThe current gradually decreases as fluid leakage reduces the load, ultimately stabilizing at a lower-value region.
Wax depositionThe current slowly rises, accompanied by a gradual increase in load, showing a smooth transition into a higher range with no abrupt changes or surges.
High operating parameterThe current surges steeply over a short period into a high-value region, exhibiting larger fluctuations at that high level.
Low operating parameterThe current gently declines over a relatively longer duration, eventually settling in a low-value range with slight oscillations.
Table 2. Expected output of the system under different operating conditions.
Operating ConditionStatus NumberExpected Output
NormalC-1(1,0,0,0,0,0)
Rod BreakC-2(0,1,0,0,0,0)
Tubing LeakC-3(0,0,1,0,0,0)
Wax DepositionC-4(0,0,0,1,0,0)
High Operating ParameterC-5(0,0,0,0,1,0)
Low Operating ParameterC-6(0,0,0,0,0,1)
Table 3. Per-class and overall validation accuracy (%) of five baseline models (real-only training).
ModelC-1C-2C-3C-4C-5C-6Overall
CNN95.686.261.990.678.148.982.6
CNN-ResNET97.589.776.292.581.372.388.9
RF97.592.983.388.787.582.691.4
CNN-RF96.293.185.792.593.891.393.3
CNN-ResNET-RF97.596.695.290.696.997.896.1
Table 4. Partial fault diagnosis results for ESP screw pump units in Xinjiang oilfield.
Oil Well LabellingCurrentDiagnosisField Fault
J033Slow riseWax DepositionWax Deposition
J420Plummeting to zeroRod breakRod break
J172Gradually decline to a stable rangeTubing LeakTubing Leak
Disclaimer/Publisher’s Note: The statements, opinions and data contained in all publications are solely those of the individual author(s) and contributor(s) and not of MDPI and/or the editor(s). MDPI and/or the editor(s) disclaim responsibility for any injury to people or property resulting from any ideas, methods, instructions or products referred to in the content.