Article

Enhancing Electrokinetic Remediation of Cu- and Pb-Contaminated Loess Using Irregular Electrode Configurations: A Numerical Investigation of Transport and Remediation Mechanisms

1
School of Intelligent Construction and Civil Engineering, Luoyang Institute of Science and Technology, Luoyang 471023, China
2
School of Civil Engineering and Architechure, Henan University, Kaifeng 475000, China
3
School of Civil Engineering, Xi’an University of Architecture and Technology, Xi’an 710055, China
4
Henan Key Laboratory of Green Building Materials Manufacturing and Intelligent Equipment, Luoyang Institute of Science and Technology, Luoyang 471023, China
*
Author to whom correspondence should be addressed.
Processes 2025, 13(7), 1948; https://doi.org/10.3390/pr13071948
Submission received: 6 May 2025 / Revised: 6 June 2025 / Accepted: 13 June 2025 / Published: 20 June 2025

Abstract

:
The strong adsorption capacity of loess poses a significant limitation to the electrokinetic (EK) remediation process. Modified EK technologies, such as graphene oxide-alginate composite hydrogel (GOCH) electrodes, are increasingly employed for the remediation of heavy metal-contaminated loess. However, the complex interactions among multiple physical fields within these modified systems remain poorly understood. This study utilizes COMSOL Multiphysics version 6.0 to simulate diffusion, electromigration, electroosmotic flow, adsorption, and chemical reactions in loess contaminated with copper (Cu) and lead (Pb). A chemical precipitation and ion transport model, governed by the Nernst–Planck equation, was validated through a comparison of simulation results with experimental data. The investigation examines the effects of electrode placement and size on EK efficiency, revealing that diagonally placed irregular electrodes optimize the electric field, minimize ineffective regions, and enhance ion migration. Larger electrodes enhance current density, whereas smaller electrodes mitigate edge shielding effects. This research offers strategic insights into electrode configuration for improved EK remediation of Cu-Pb-contaminated loess, achieving greater efficiency than traditional systems.

1. Introduction

As soil heavy metal contamination becomes a growing concern [1,2,3,4], various remediation technologies have been applied to address this environmental issue, including solidification [5], leaching [6], phytoremediation [7], bioremediation [8], and electrokinetic (EK) remediation [9]. Among the various remediation technologies for heavy metals, EK remediation has garnered significant attention due to its high maneuverability [10,11,12,13,14,15]. Compared to other soil remediation technologies, electrokinetic remediation offers advantages such as ease of operation, efficiency, in situ application, and absence of secondary pollution [10,11]. Furthermore, EK remediation demonstrates higher removal efficiency than traditional methods when applied to low-permeability contaminated soils [16].
Extensive research has focused on mitigating electrochemical polarization and addressing the focusing effect in EK remediation to optimize the electric field and enhance removal efficiency [10,11,17]. However, it is widely acknowledged that the efficiency of EK remediation is heavily dependent on the presence of mobilizable ions in the soil [12,18,19]. The quantity and ratio of mobilizable ions depend on the adsorption properties of the soil. Specifically, the poor solubility of metal ions in soil porewater, combined with the difficulty of releasing ions adsorbed by soil clay particles or co-precipitated with minerals, leads to reduced removal efficiency. In Northwestern (NW) China, loess, with its high clay content, exhibits a remarkable ability to adsorb heavy metal ions [10,11]. Due to the typical negative surface charge of loess particles, heavy metals and other positively charged ions adhere to their surface. In other words, the adsorption capacity of loess for heavy metal ions governs the effectiveness of conventional EK remediation.
The EK remediation process typically utilizes two types of electrode systems: single-electrode systems and multi-electrode array systems. The single-electrode system is commonly employed in experiments and engineering applications for the removal of various pollutants [20]. Nevertheless, this system is constrained by its uneven and localized remediation effects [21]. In a single-electrode configuration, the radial symmetry of current density distribution leads to more significant remediation effects near the electrode, while the effects in distant regions are weaker [21] This current distribution results in uneven pollutant removal, limiting the comprehensiveness and consistency of the remediation. The multi-electrode system can be classified into one-dimensional parallel multi-electrode systems and two-dimensional polygonal array electrode systems based on their arrangement. The one-dimensional parallel multi-electrode system consists of multiple parallel electrodes and generates a uniform electric field distribution, which drives pollutants towards the cathode under the electric field [22]. However, this arrangement incurs additional costs and is unsuitable for pollution sites with limited space. The two-dimensional polygonal array electrode system arranges multiple electrodes in a polygonal array on a 2D plane. This arrangement covers a larger remediation area and shows significant potential, especially for large-scale polluted sites [16,19]. However, the multi-electrode two-dimensional array system has drawbacks, such as the repulsive effect between electrodes of the same polarity, which may create ineffective regions and reduce removal efficiency [23].
To better understand the EK remediation process, Segall et al. [24] and Penn et al. [25] conducted pioneering research on the transport models associated with these processes. Kim et al. [26] developed the first finite element-based numerical model for electrokinetic remediation, which simulates the migration of pollutants during the remediation process. As understanding of EK mechanisms deepened, Yan et al. [27] expanded the numerical model by incorporating additional physical and chemical processes, such as electromigration, electroosmotic flow, and chemical reactions. This model allowed for the numerical solutions of electric fields, ion migration, and charge distribution. To further validate the accuracy and reliability of the model, Mattson et al. [28] refined the numerical model to simulate ion migration and electrochemical reactions during EK remediation, comparing the results with experimental data. Numerical models for electrokinetic (EK) remediation have become increasingly refined, incorporating more influencing factors to better simulate the remediation process and predict removal efficiency. Xie et al. [29] developed a model to explore lead migration and transformation in porous soils, considering pH and enhancement techniques such as cation exchange membranes and anodic electrolyte circulation. However, numerical studies targeting soils with high adsorption capacity, like loess, remain limited.
This study aims to improve the electrokinetic remediation (EK) efficiency of Cu(II)-contaminated loess by designing a two-dimensional multi-electrode array with irregularly shaped electrodes. The unique geometry of irregular electrodes enhances pollutant coverage, increases the soil–electrode contact area, and reduces ineffective remediation zones. To investigate their performance, a coupled water–electric–chemical numerical model was developed, integrating key transport and reaction mechanisms such as electromigration, electroosmosis, adsorption, precipitation, and electrode reactions. While numerical simulations have been widely used in EK remediation, their application in highly adsorptive soils like loess remains limited. This work bridges that gap by combining experimental validation and simulation to assess the influence of electrode shape and placement on removal efficiency.

2. Overview of Experimental Research

2.1. Experimental Materials

The loess specimens utilized in this study were collected from Lantian County, Xi’an City, Shaanxi Province. The sampling procedure adhered strictly to the “Standard for Geotechnical Testing Methods (Beijing, China)” [30], ensuring that the natural state of the soil samples was preserved without disturbance from external factors. This careful approach guaranteed the representativeness of the soil samples and, consequently, the reliability of the experimental results. Upon collection, the soil samples were subjected to a series of laboratory tests to determine key physical properties, including particle size distribution, liquid and plastic limits, dry density, and porosity ratio, among others. The results of these tests are presented in Table S1. Based on these measured properties and in accordance with the Unified Soil Classification System (USCS) [31], the soil was classified as low-plasticity clay (CL).
To further investigate the soil’s particle composition, this study used a laser particle size analyzer (Mastersizer 2000, Malvern, UK) to measure the particle gradation of the samples. The laser particle size analyzer provides high efficiency and precision, enabling accurate measurement of the distribution of various particle sizes in the soil. Figure S1 presents the particle size distribution curve obtained from the analyzer, clearly illustrating the distribution characteristics of the soil sample across various particle size ranges. This data is essential for guiding the subsequent remediation experiments. In addition to particle size analysis, supplementary tests were conducted to assess other key physical properties of the soil, including moisture content, dry density, and compaction characteristics, as presented in Table S1. These additional analyses further enhanced the understanding of the soil’s physical behavior and stability, providing valuable insights into its performance during the EK remediation process. The results of these tests will serve as the scientific basis for guiding the subsequent EK remediation experiments.

2.2. Experimental Reactor

The EK remediation reactor is constructed from acrylic and is divided into three compartments: a loess sample chamber (500 mm × 150 mm × 150 mm) and two electrolyte chambers (100 mm × 150 mm × 150 mm). The main components of the reactor include a direct current (DC) power supply, cathode and anode electrodes [4,11], an overflow device, a liquid reservoir, a peristaltic pump, perforated partitions, and geotextiles. The detailed structure is shown in Figure S2. The loess sample chamber is divided into six equal sections, labeled S1 to S6 from left to right. The crushed and sieved loess samples were divided into seven equal portions. A mixed solution of Cu(NO3)2 and Pb(NO3)2 at a concentration of 500 mg/kg was prepared and sprayed evenly onto the soil samples. The samples were sealed in plastic wrap and stored for 72 h. The prepared contaminated loess was then added in three layers to the six sections of the loess sample chamber and compacted layer by layer. The electrolysis chambers contained composite gel electrodes and an electrolyte (deionized water). Overflow devices were installed beside the electrolyte chambers to measure electroosmotic flow during the experiment. The peristaltic pump was used to inject electrolyte into the chambers, maintaining the liquid level at the overflow device level. Perforated partitions and geotextiles were used to separate the loess sample chamber from the electrolyte chambers. During the experiment, changes in current, electroosmotic flow, and conductivity were monitored. After the experiment, the pH values and residual heavy metal concentrations in each soil section were measured.

2.3. Experimental Procedure

The pre-treated loess was placed in the loess sample chamber, and rubber hoses connected the peristaltic pump, electrolyte chamber, and liquid reservoir. Deionized water served as the electrolyte in the electrolyte chamber. The peristaltic pump, positioned near the anode, was activated to pump electrolyte from the liquid reservoir into the anode electrolyte chamber at a flow rate of 200 mL/min, replenishing the electrolyte in the loess sample chamber. Following the connection of the DC power supply to the anode and cathode via wires, the power was turned on, and the voltage was set to 45 V for a 72 h EK remediation experiment. During this process, pre-embedded sensors recorded pH changes every two hours. The current supplied by the DC power source was also measured, and the mass of the liquid reservoir was weighed to calculate variations in the electroosmotic flow rate. Upon completion of the 72 h EK remediation, the DC power supply was switched off, and the loess from each section was collected sequentially. The loess was then dried, ground, and sieved, followed by the extraction of the supernatant using the five-step extraction method proposed by Tessier et al. [32]. The heavy metal content in the supernatant was quantified using an atomic absorption spectrophotometer, and the residual concentration of heavy metals in the soil and removal efficiency were subsequently calculated. Finally, the measured data were compared with the simulation results to validate the accuracy of the numerical model.

3. Modelling Approach

A model was developed and used to simulate the experimental data obtained by Hu et al. [10,11]. In that work, an EK remediation treatment was performed on Cu- and Pb-contaminated loess. A detailed description of the loess properties was presented in a previous work [10,11]. This study presents a model system for EK remediation, which encompasses a mathematical model describing electric field distribution, a species transport model describing species migration, and a reaction model involving chemical reactions. Several assumptions were made in our model. Firstly, we neglected advective flow due to its lower magnitude compared to electroosmosis [33,34]. This is due to the different physical mechanisms and driving forces involved. Fundamentally, horizontal convection arises from density differences caused by uneven temperatures or concentrations, while electroosmosis is a phenomenon of fluid flow directly induced by the action of an electric field. Secondly, we assumed that the porous medium is isotropic and that the degree of water saturation remains constant at 100%. Thirdly, we assumed that pore geometry characteristics, such as porosity and tortuosity, do not change over time. Lastly, we neglected electrophoresis in our model as the immobile phase of loess primarily impedes colloid migration. This decision was based on the fact that the hydraulic permeability of the investigated loess was low.

3.1. Governing Equations

Transport Phenomena

Under the influence of an external electric field, the transport of pore fluids and substances through porous media is described as a combination of diffusion, electromigration, and electroosmosis. Given that soils typically treated by EK remediation have low hydraulic permeability, advective flow is generally ignored. The loess involved in this study possesses even lower hydraulic permeability; therefore, the impact of advective flow is disregarded here. Similarly, electrophoresis has limited relevance in EK remediation, and the immobile phase in porous media impedes the migration of colloids. Consequently, the mass transfer equation for chemical species i is derived based on the Nernst–Planck equation [1,33]. The total mass flux under an electric field in porous media of soil Ji (mol/m2/s) can be expressed as
J i = D i * c i U i * c i ϕ k e 0 c i ϕ
where Di* (m2/s) is the effective diffusion coefficient of the i-th specie, ci is the concentration of the i-th specie, Ui* (m2/s/V) is the effective ion mobility, Φ (V) is the electric potential, and ke0 (m2/V/s) the coefficient of electroosmotic permeability.
As the paths of ions in the porous matrix are tortuous, the effective diffusion coefficient and effective ion mobility used in Equation (1) take into account the effects of porosity n and tortuosity τ.
D i * = n τ D i
U i * = n τ U i
τ 2 = nr 2 8 K
where Di (m2/s) is the diffusion coefficient, and Ui (m2/s/V) is the ion mobility at infinite dilution, r is the average pore diameters of loess, and K is the hydraulic permeability of loess.
Diffusivity and ionic mobility can be related to a single property by the Nernst–Townsend–Einstein relation [1,33]:
U i * = D i * z i F R T
where R (8.314 J/K/mol) is the universal gas constant, T (K) is the absolute temperature, and F (96,485 C/mol) is the Faraday constant.
The saturated electroosmotic permeability, ke0 (m/V/s), can be expressed as Equation (6). To determine the electroosmotic coefficient, we performed a reverse calculation using the electroosmotic flow in the indoor model test. The average electroosmotic coefficient, ke1, was obtained from the test results. Subsequently, we analyzed the impact of this parameter difference on the model feedback using a numerical model. The appropriate electroosmotic coefficient is determined by comparing with experimental data.
k e 0 = n ε ξ η
where ε (F/m) is the dielectric constants of pore water, ƞ (N∙s/m2) is the viscosity of pore water, ζ (V) is the zeta potential.

3.2. Chemical Reactions

Among a wide range of possible reactions, we have considered only the main phenomena identified by most experiments as key factors in removing heavy metal contaminants from soil. Specifically, the reactions included in the model are (1) water electrolysis at the electrodes, (2) adsorption/desorption of contaminants on the soil surface, and (3) precipitation/dissolution of heavy metals and carbonate substances.
The applied electric current induces water electrolysis reactions at the electrodes, thereby producing protons at the anode and hydroxide ions at the cathode [33,35]. Competitive electrode reactions are not considered in this model. During the experiments under current I, the proton flux at the anode is set to JH+, and the hydroxide ion flux at the cathode is JOH+.
2 H 2 O O 2 ( g ) + 4 H + + 4 e ( a n o d e )
2 H 2 O + 2 e H 2 ( g ) + 2 O H ( c a t h o d e )
J H + = I F
J O H = I F
Loess, the soil used in the modelled experimental system, usually has a high clay content and cation exchange capacity. Therefore, the loess is able to retain heavy metal ions as adsorbed surface species. The adsorption/desorption process of heavy metal ions in loess conforms to the Langmuir model. Initial ion concentration distributions are set, and appropriate boundary conditions, such as concentration or flow rate conditions, are determined based on experimental or field conditions. The Langmuir adsorption equation is coded in COMSOL and applied to the relevant physical field equations. A transient solver is selected to address nonlinear issues. The adsorption of heavy metals (Cu and Pb) onto loess particle surfaces is modelled as an adsorption isotherm:
C e Q e = 1 K L × Q m + C e Q m
where Ce (mg/L) is the equilibrium concentration of Cu or Pb in the solution, Qm (mg/g) is the maximum amount of Cu or Pb adsorbed during the adsorption process, and KL (L/mg) is a constant corrected with the affinity of binding sites and energy of adsorption.
Moreover, the formation of aqueous complexes and the precipitation and dissolution reactions were incorporated into the model based on the studies by Carlos et al. [36] and Yeung et al. [37]. The formation of aqueous complexes of Cu and Pb ions, including precipitation and dissolution reactions, is calculated using the equilibrium constants from COMSOL’s thermodynamics database. The equilibrium reaction equations are as follows:
Cu ( OH ) 2     C u 2 +   +   2 O H
Pb ( OH ) 2     P b 2 + +   2 O H
H 2 O     H +   +   O H
c Cu 2 + c OH 2 = K Cu ( OH ) 2 = 2.2 × 10 20
c Pb 2 + c OH 2 = K Pb ( O H ) 2 = 2.8 × 10 16
c H + c OH = K w = 1.0 × 10 14
where KCu(OH)2 is the copper dissolution equilibrium constant, KPb(OH)2 is the lead dissolution equilibrium constant, Kw is the water ionization equilibrium constant, and cH+, cOH, cCu2+, and cPb2+ are the ion concentrations of H+, OH, Cu2+, and Pb2+, respectively.

3.3. Model Implementation

The aforementioned transport and chemical processes are calculated using a stepwise non-iterative operator splitting scheme (see Figure S3). The term “non-iterative operator” refers to a non-iterative operator splitting scheme, which decouples complex coupled processes (such as transport and chemical reactions) into sub-steps that are solved sequentially within a single time step, without iterative feedback between processes. Specifically, in our model, transport processes (e.g., electromigration and diffusion) are computed first, followed by chemical reactions (e.g., precipitation and adsorption), in a time-marching manner. This approach simplifies computation and reduces the overall cost compared to fully coupled iterative schemes, while maintaining acceptable accuracy. The first step involves initializing the model with certain assumptions. Initially, the transport behavior of dissolved chemicals under constant voltage is simulated using COMSOL Multiphysics software version 6.0. This step involves calculating chemical phenomena that drive EK through the chemical reaction module. The aforementioned steps are then integrated. In the computation cycle, the operator splitting method is used to compute the reaction–transport equilibrium, minimizing computational errors and ensuring acceptable computation time. The final step achieves numerical convergence and is used for post-processing data analysis. Based on error adjustments in COMSOL Multiphysics and model verification, possible calibration can be conducted by comparing predicted data with full-scale experimental results.
The modeling system under investigation consists of EK experiments, as conducted by Hu et al. [11], to remove Cu and Pb from loess. In that work, Hu et al. [10,11] presented comprehensive experimental results for contaminated loess. In our previous experimental study, we conducted experiments using artificially Cu- and Pb-contaminated loess [11]. The loess is characterized by its low permeability, weak alkalinity, and strong adsorption properties for heavy metal ions. The porosity, pH, density, zeta potential, tortuosity, and adsorption model parameters of the loess are summarized in Table 1. The behaviour of a laboratory-scale EK remediation reactor is simulated to verify the accuracy of the simulation model. The EK remediation reactor consists of two electrolyte compartments (15 cm × 10 cm × 12 cm) containing the anolyte and catholyte and a central compartment (30 cm × 15 cm × 12 cm) containing the contaminated loess (5400 cm3). The central compartment was divided equally into six compartments, namely S1 to S6. S1 was deployed next to the anode compartment, while S6 was deployed next to the cathode compartment. Figure S2 illustrates a schematic of the modeled system and the arrangement of the electrolyte compartments. GOCH electrodes were selected as the anode and cathode materials. A constant electrical potential gradient of 1.5 V/cm was applied for 72 h in both the numerical simulation and the experiment.
The proposed simulation model was fully implemented in COMSOL Multiphysics to analyze its capabilities. A series of simulation exercises were conducted to verify diffusive transport (SE1), test electromigration transport (SE2), test electroosmosis (SE3), test adsorption/desorption (SE4), test chemical remediation (SE5), and explore adsorption/desorption in GOCH electrode (SE6). These simulation exercises (SEs) were performed using different configurations (see Figure S4) and considering two species: Cu2+ and Pb2+. This study aimed to reduce the disparity between simulation and experiment by considering a more comprehensive range of influence mechanisms compared to traditional research. The main transport phenomena of charged species in this study were assumed to include diffusion, electromigration, electroosmosis, adsorption/desorption, chemical reactions, and the adsorption of the GOCH electrode. As a result, the six simulation exercises shown in Figure S4 represent a step-by-step iteration of these different mechanisms, with the goal of analyzing the roles and contributions of each mechanism.

3.4. Model Validation

The simulation results for the electric current distribution are presented in Figure S5a. The secondary current interface accounts for both the impact of electrode potential and the influence of exchange current density on the current distribution. A smaller exchange current density indicates weaker electrode ability to gain or lose electrons, requiring a higher current to drive the reaction. For an electrode reaction, a smaller exchange current density requires a higher current to drive the reaction. The calculated results for the secondary current interface exhibit patterns similar to the primary current interface; however, the actual secondary current distribution is significantly lower, aligning more closely with the experimental results (see Figure S5a). This is attributed to the consideration of exchange current density. As exchange current density increases, the current distribution curve obtained from the secondary current interface calculation gradually approaches that of the primary current interface.
Figure S5b illustrates the changes in electroosmotic flow during the experimental and simulated EK remediation processes. The figure demonstrates that the variation trends and accumulated electroosmotic flow volume after 72 h are in excellent agreement. In the early stages of the experiment, electroosmotic flow increased significantly compared to the simulation. This is because in the initial phase of EK remediation, the current rises rapidly, accelerating the electroosmotic flow rate. Figure S5c illustrates the changes in pH values of the six soil profiles after experimental and simulated electrokinetic remediation. The figure shows that as the anode electrode undergoes electrolysis and releases a large amount of H+, under electromigration, H+ moves from the anode electrolyte pool to the cathode, resulting in a gradual increase in soil pH from S1 to S6. A comparison of the experimental and simulated pH curves reveals good agreement between the two.
The simulation of diffusive transport (SE1) was conducted independently from the other simulation exercises. Cu and Pb are influenced by the concentration gradient, migrating from areas of higher concentration to lower concentration, specifically from the soil pore solution to the electrolyte. This results in a gradual decrease in Cu and Pb concentrations in the S1 and S6 profiles over time (see Figure S5d,e). The residual concentrations of copper and lead after simulated electrokinetic remediation were calculated using an iterative method to analyze the effects of various factors on the remediation process. SE1–SE5 correspond to free diffusion, electroosmotic flow, electromigration, soil adsorption, and chemical reactions, respectively. Additionally, the remaining concentrations in the S1 and S6 profiles stayed consistent during diffusion. The differences in residual copper and lead concentrations, resulting from diffusion, can be attributed to variations in their diffusion coefficients. Figure S5 demonstrates the model’s ability to accurately describe diffusive transport. The simulation exercise (SE2) examined the combined effects of diffusion and electromigration. Compared to SE1, electromigration caused both Cu and Pb to migrate out of the soil within 72 h of treatment. Under SE2, the concentration of Cu and Pb at S1 initially decreased to 0 mg/kg, and the time required for complete removal from S1 to S6 gradually increased. This occurred because the heavy metal migrated toward the cathode due to electromigration. The time for the concentration in S6 to reach 0 mg/kg determined the overall removal time in the simulation exercise. Notably, the concentration of Cu reached 0 mg/kg after 11 h, while the Pb concentration took approximately 32 h to reach 0 mg/kg. In other words, from Figure 1d,e, it is evident that the effect of free diffusion (SE1) is relatively insignificant, removing only about 10% of copper and 2% of lead near the electrodes. Next, the electroosmotic flow (SE3) was iterated, and the results show that in the absence of soil adsorption, all copper and lead ions were removed through electroosmotic flow and electromigration. The soil particle adsorption effect (SE4) was further iterated, and the green curves in Figure S5d,e show that soil particle adsorption significantly influenced removal efficiency. Approximately 100 mg/kg of copper ions (400 mg/kg of lead ions) remained near the anode, and approximately 300 mg/kg of copper ions (500 mg/kg of lead ions) remained near the cathode. The chemical reaction (SE5) was further iterated, and it was found that chemical reactions hindered the removal of some heavy metals, though the impact was relatively small. After iterative calculations from SE1 to SE6, it was found that the current, electroosmotic flow, pH values, residual copper and lead concentrations, experimental observations, and mass balance were consistent, further verifying the model’s accuracy.

3.5. Irregular Electrode Configurations

This study employed an innovative approach, combining the electrokinetic remediation reactor with arc-shaped electrodes. The arc-shaped electrodes offer several advantages, including a larger remediation area, higher current density, and smaller ineffective regions, without increasing the number of anodes. Figure S6a–g display the electrode configuration with arc-shaped electrodes in the numerical model, with Figure S6a,c representing comparative experiments to study electrode placement. Figure S6b represents the traditional two-dimensional electrode configuration used as the control, while Figure S6c–g show simulated studies of arc-shaped electrode dimensions based on the correct configuration method. These simulations investigate the impact of electrode size on removal efficiency.
After EK treatment, the contaminant distribution exhibited an uneven yet centrally symmetric pattern. Thus, the top-left corner area was selected to represent the overall residual concentration distribution. To ensure sampling accuracy, we controlled the number of sampling points inside and outside the ring based on the area ratio principle. Given that the soil within the ring constituted 78.5% of the total area, 11 sampling points were selected inside the ring and 3 outside, resulting in a total of 14 sampling points. These points effectively represent the residual concentrations of copper and lead across the entire region (11/14 ≈ 78.5%). The distribution of residual pollutants within the ring was significantly influenced by the radius. Consequently, the 11 sampling points inside the ring were categorized into four sections based on varying radii, designated as A, B, C, and D. The average value of the sampling points in these sections was then calculated to represent the residual concentration in the soil inside the ring. Three sampling points were uniformly selected outside the ring and labeled E, representing the residual concentration in the soil outside the ring. The specific sampling points are illustrated in Figure S6h.

4. Results and Discussion

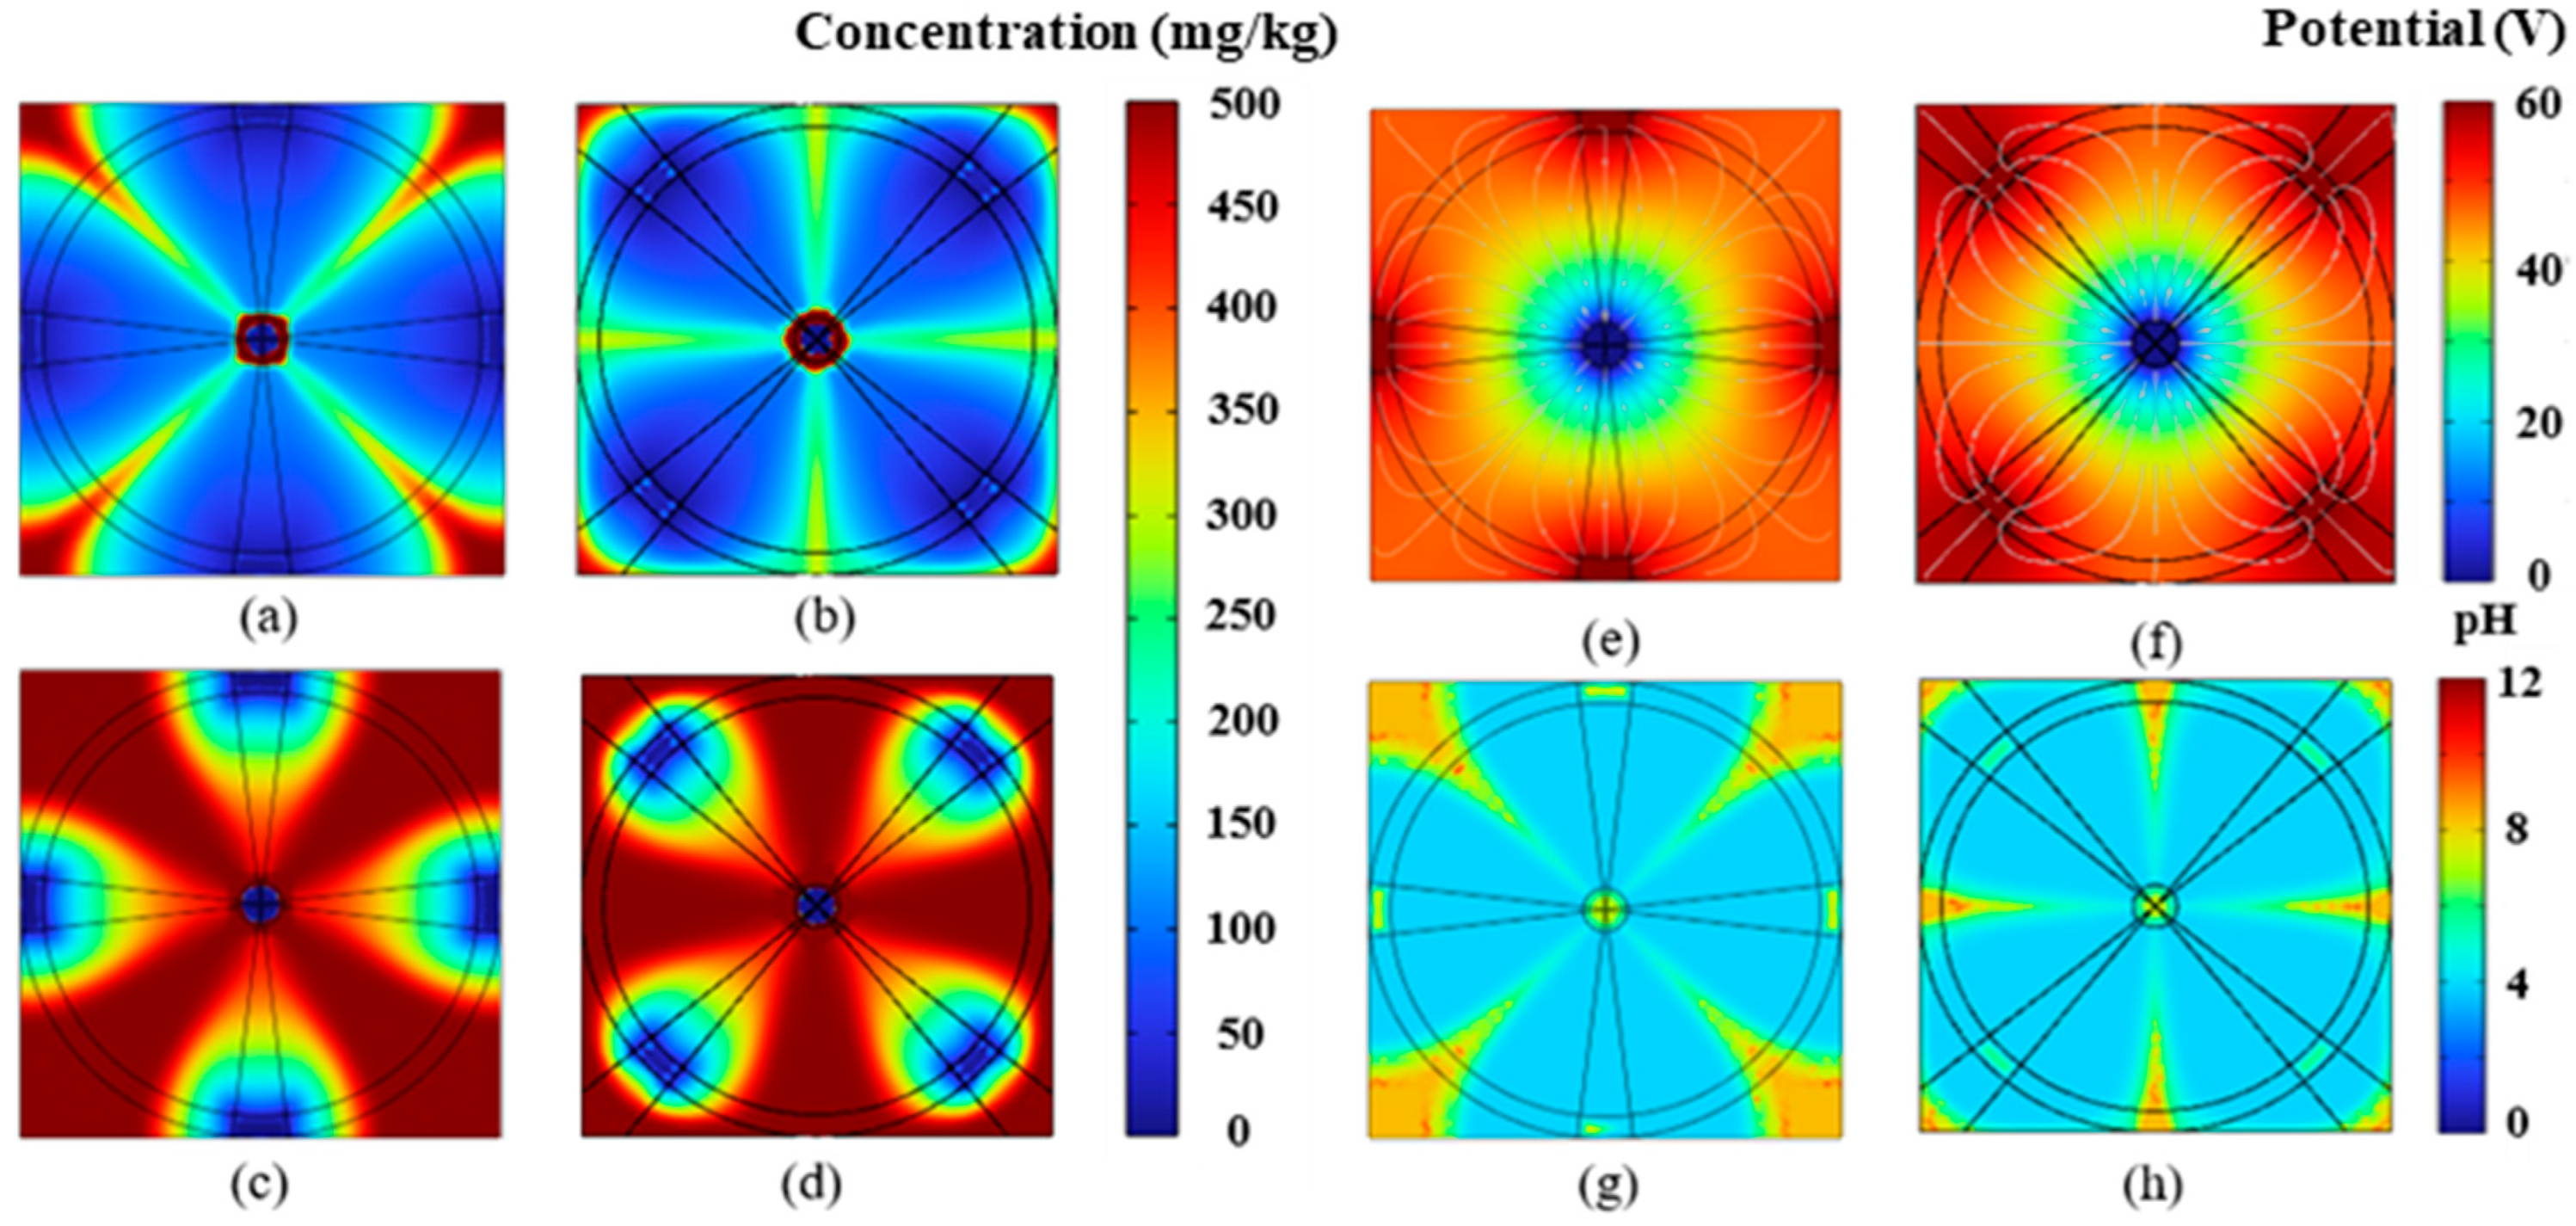
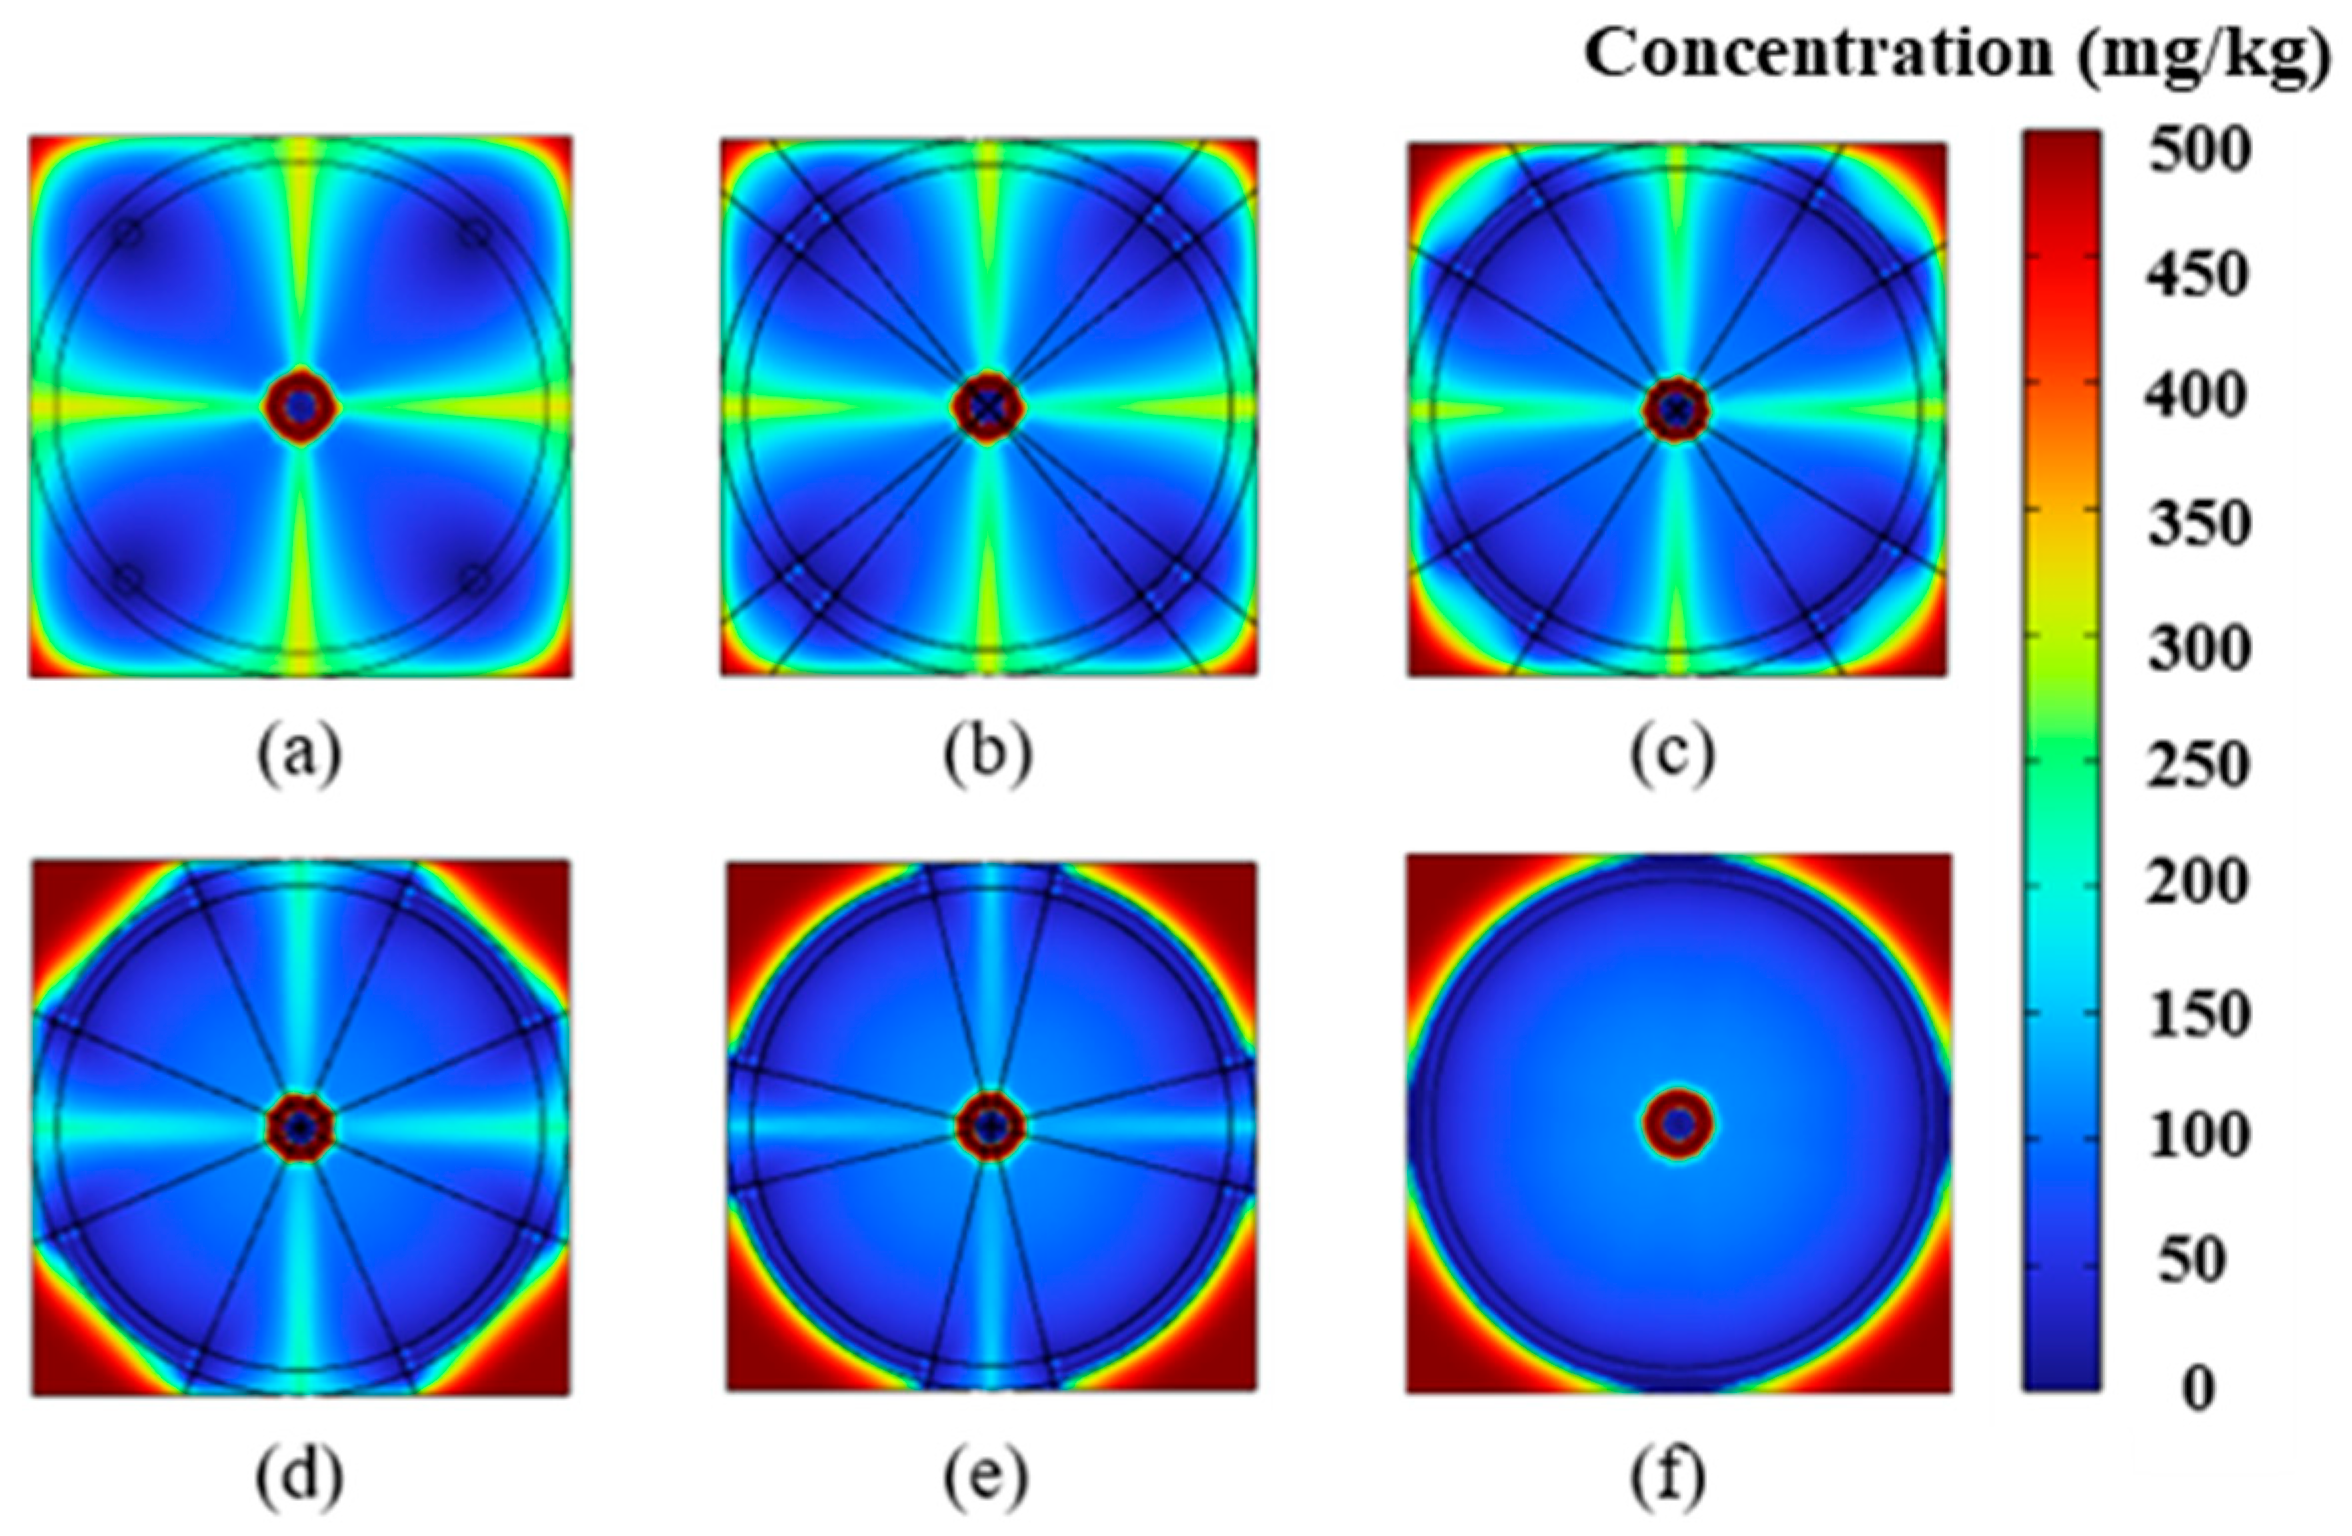
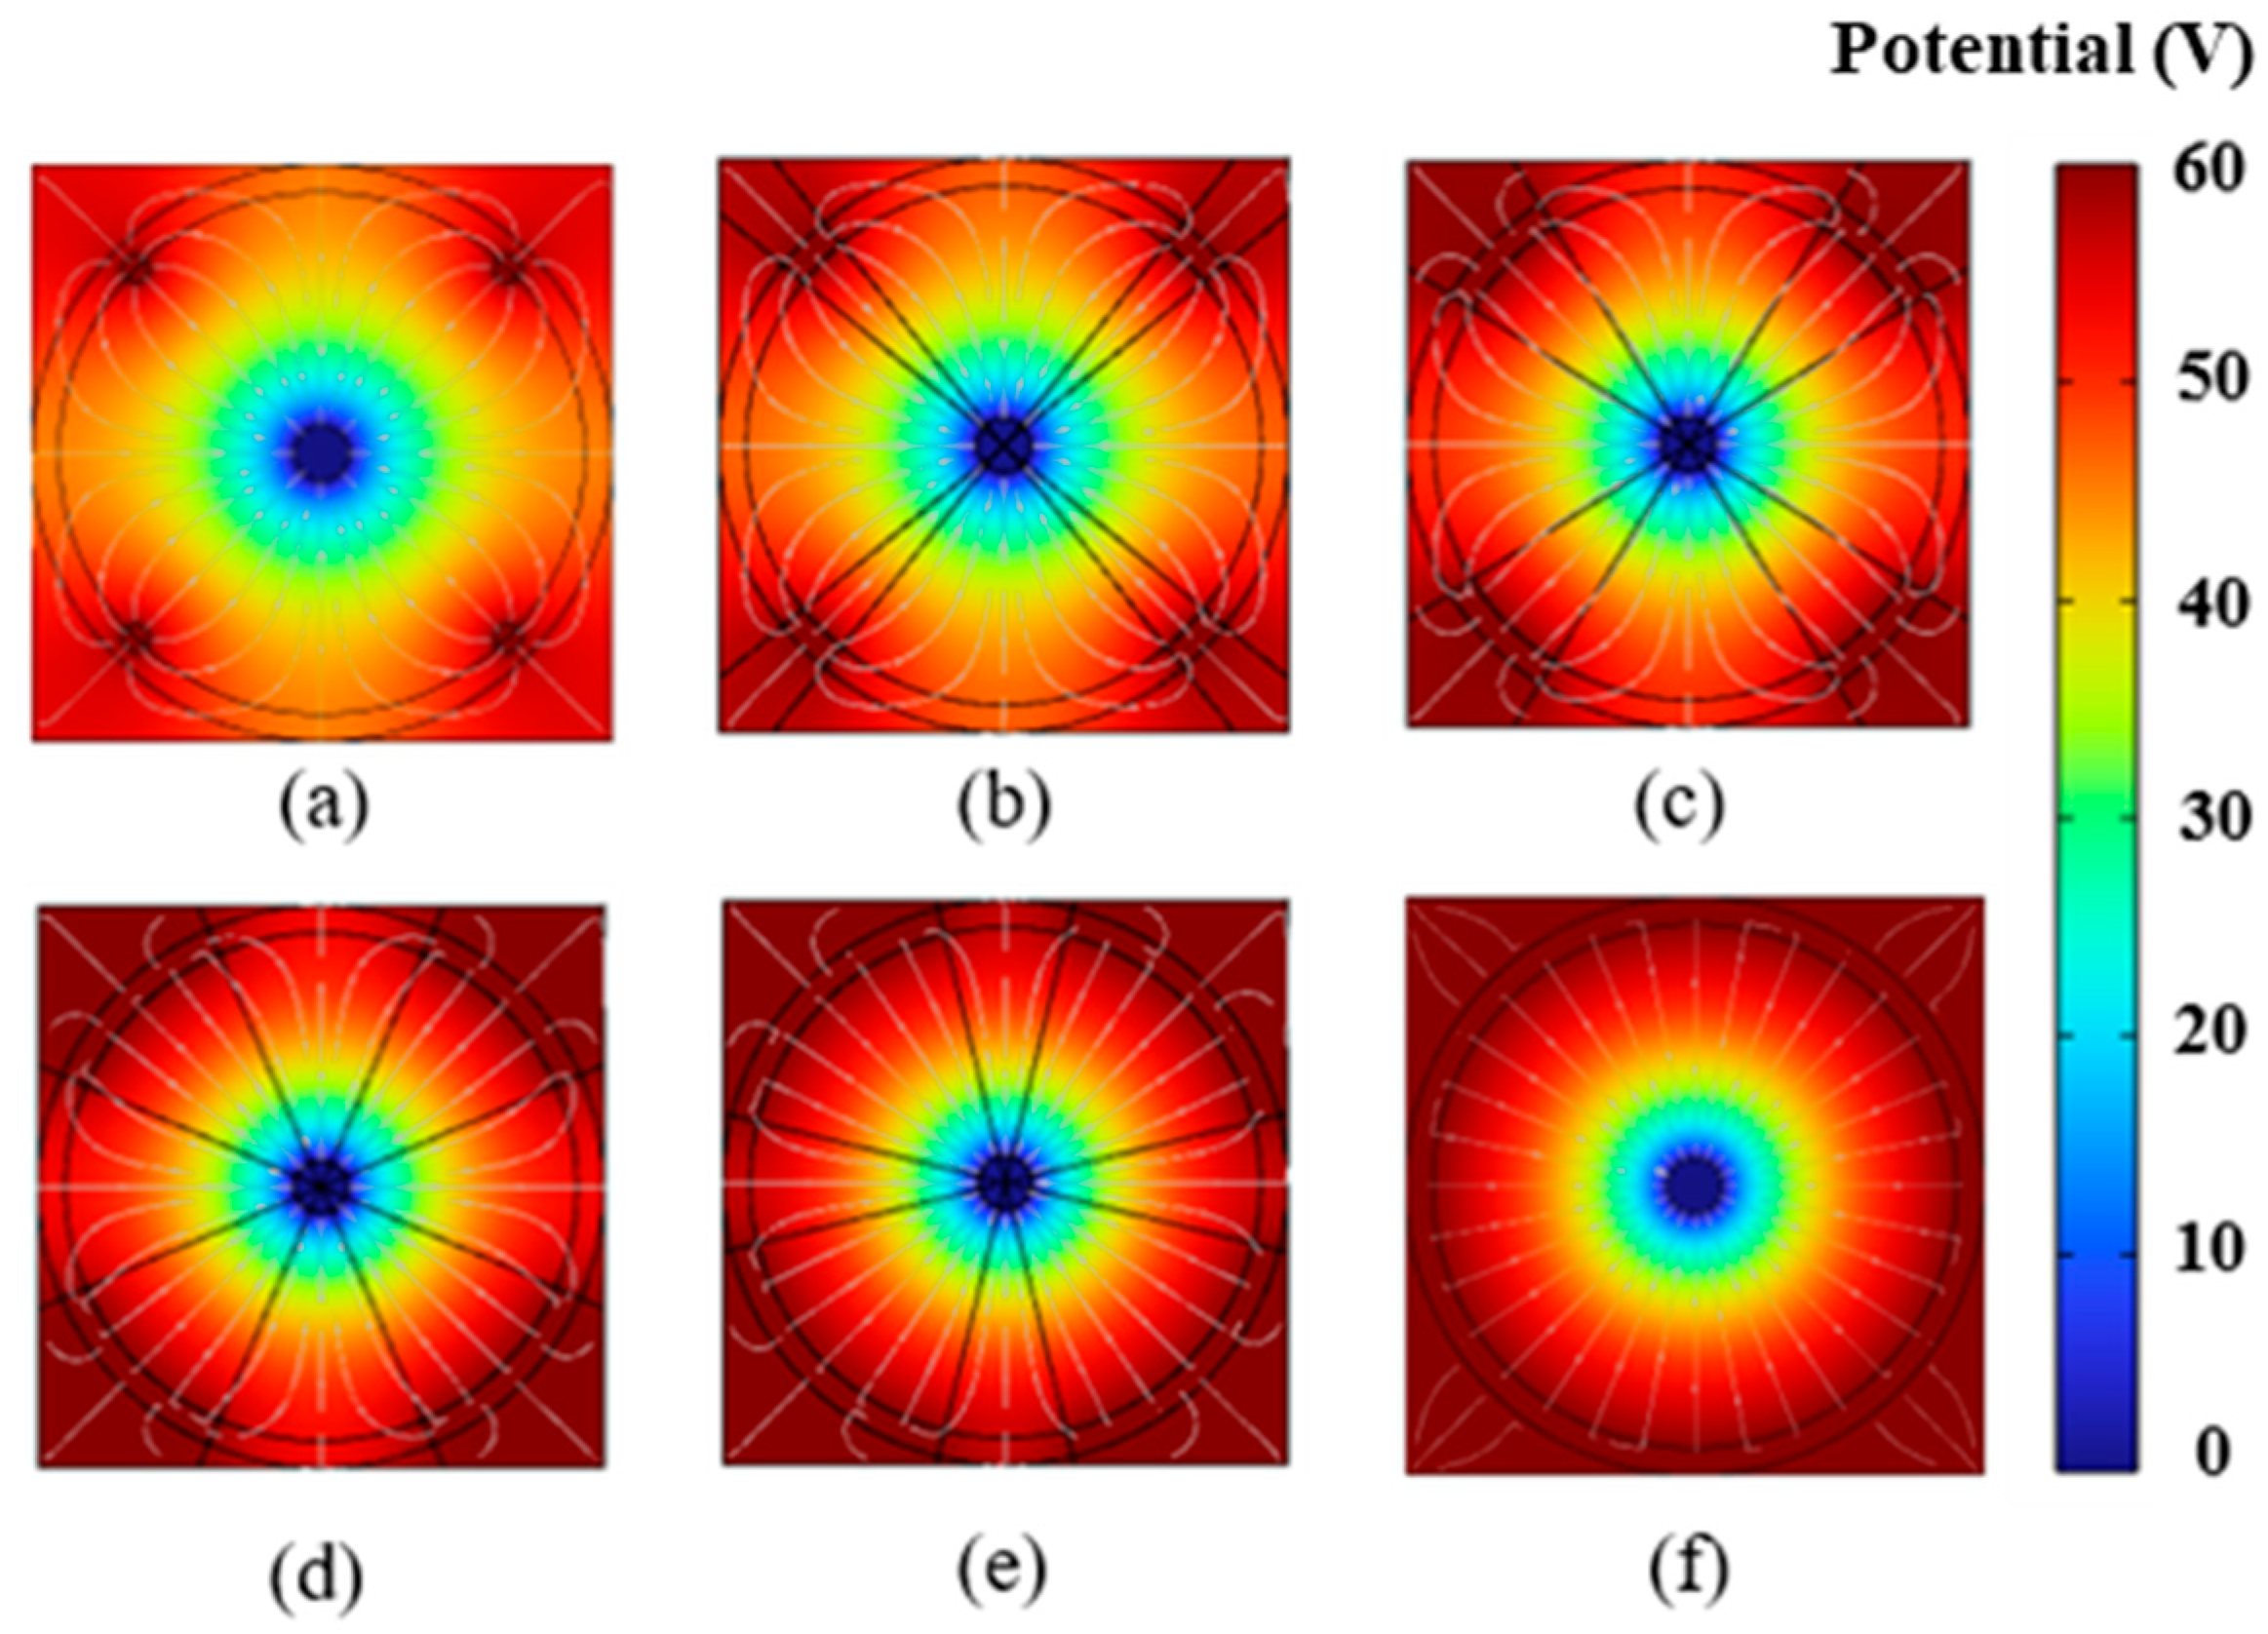
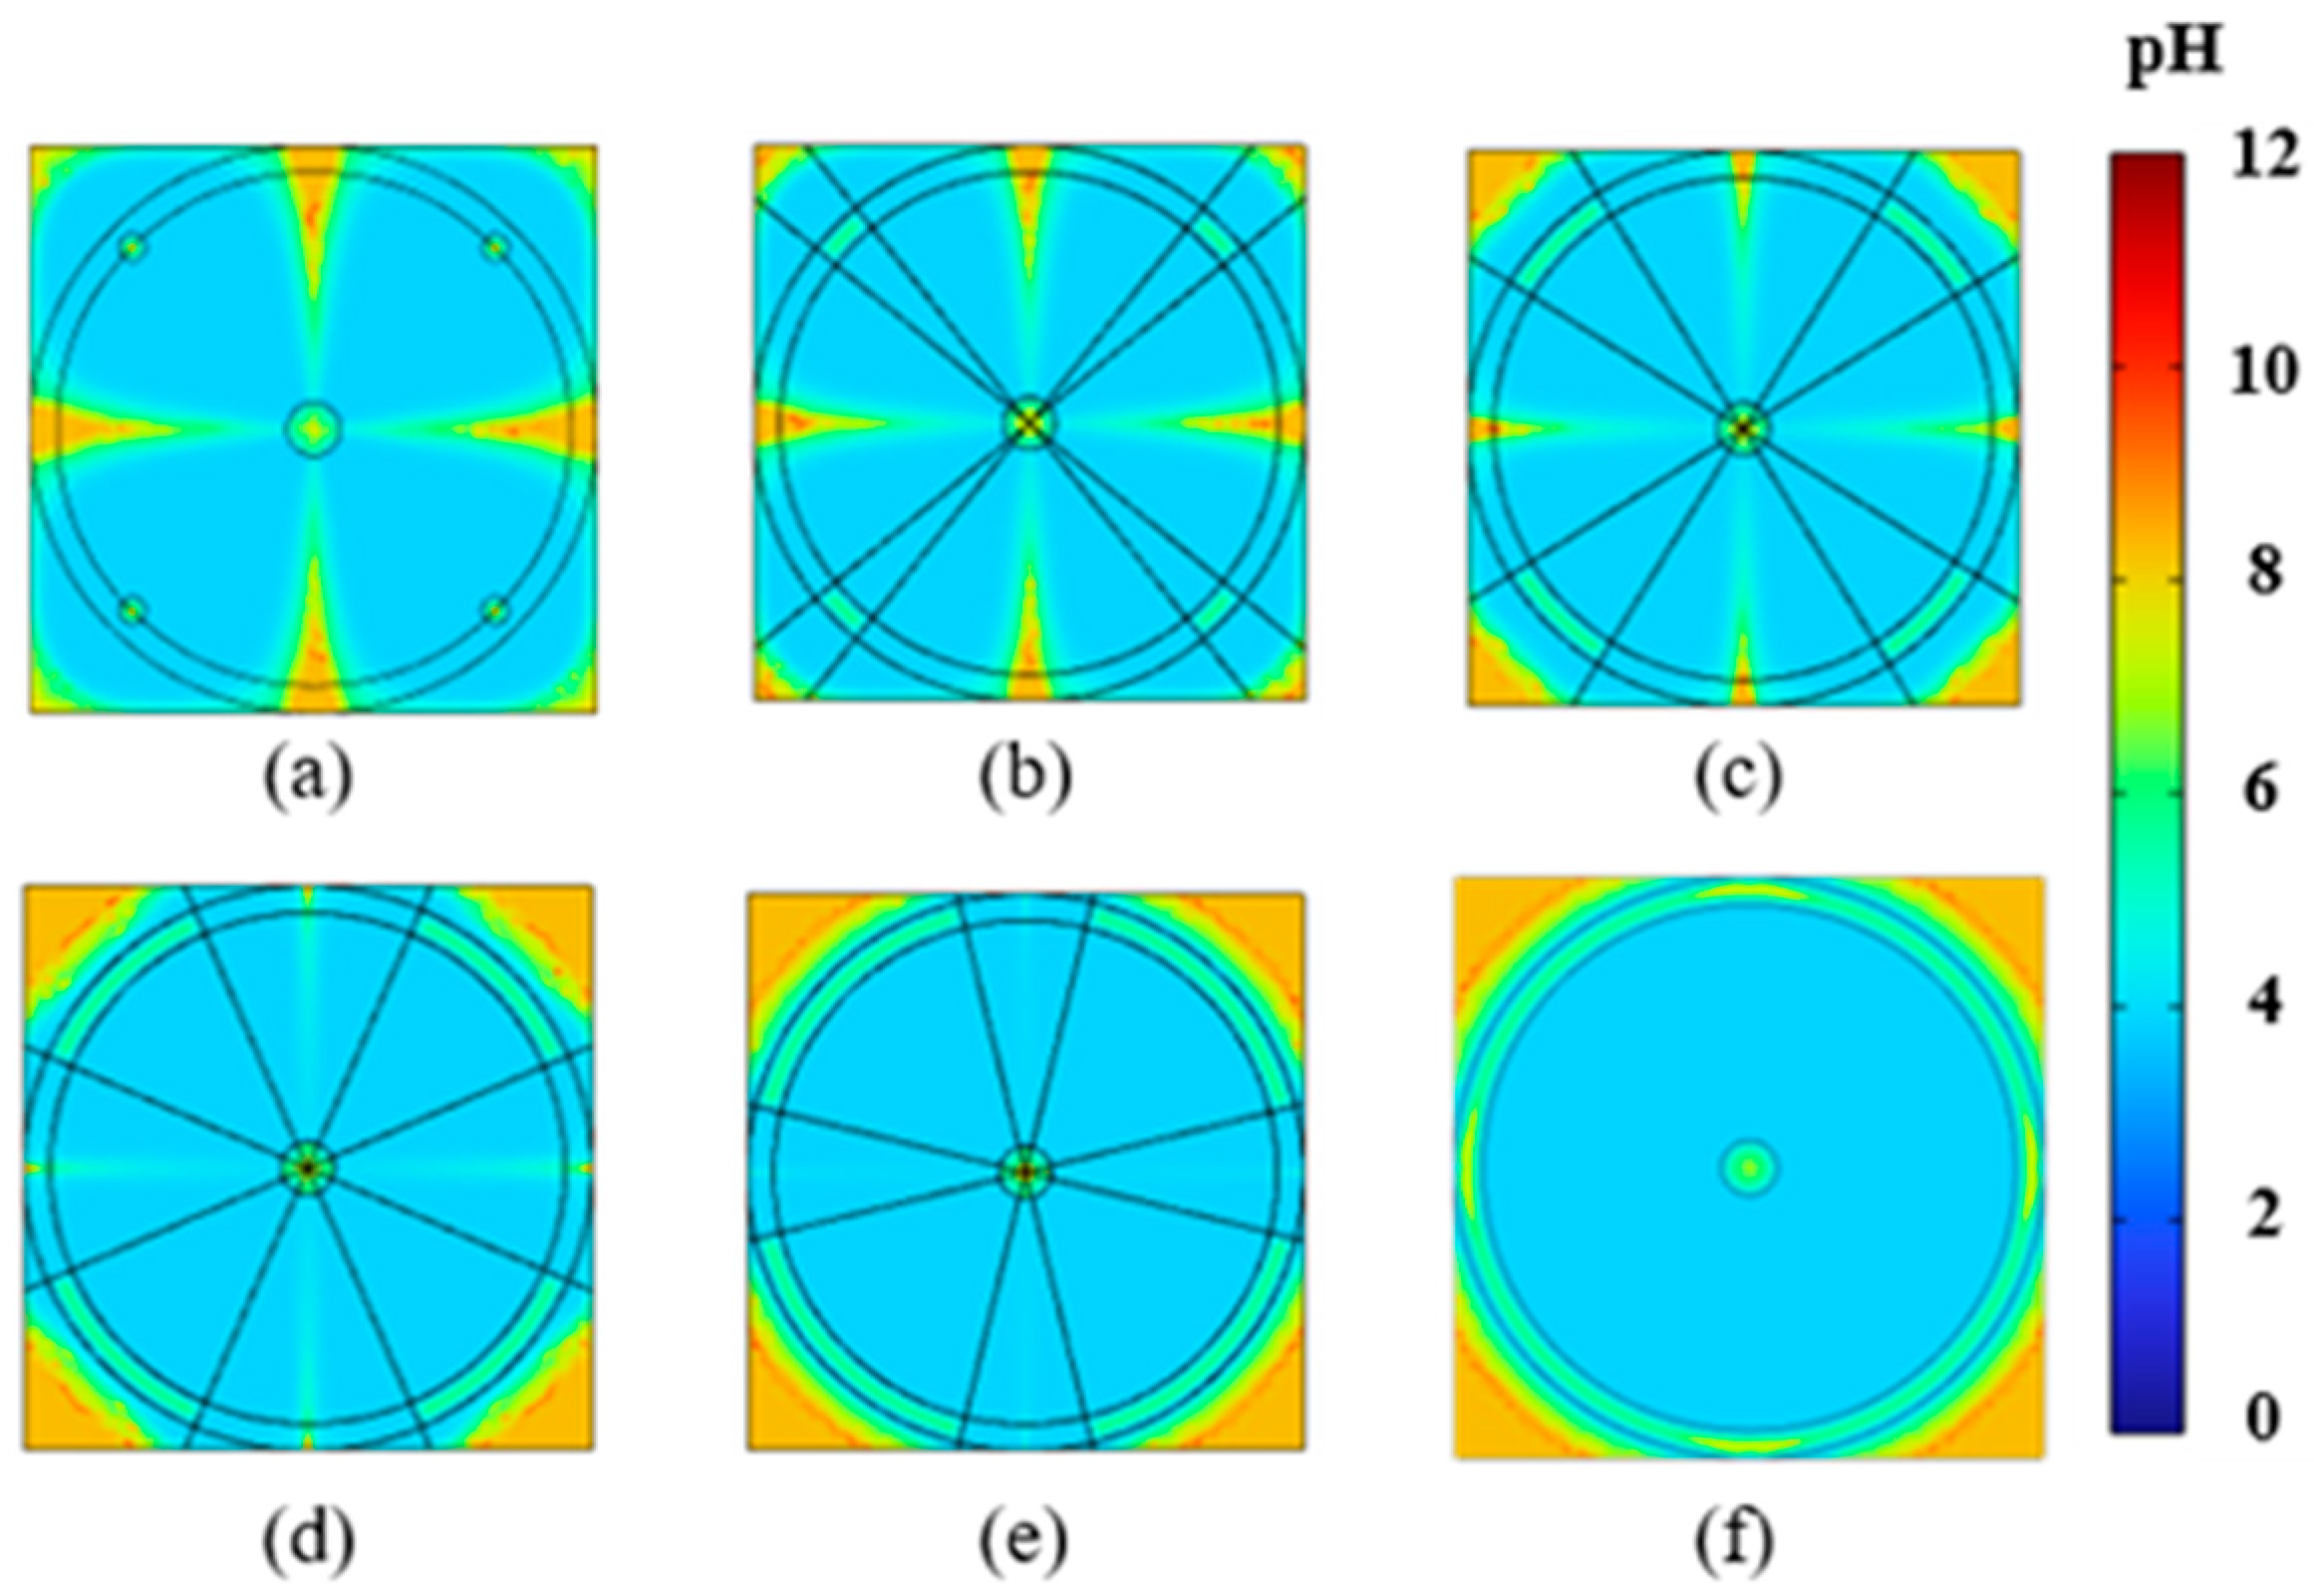
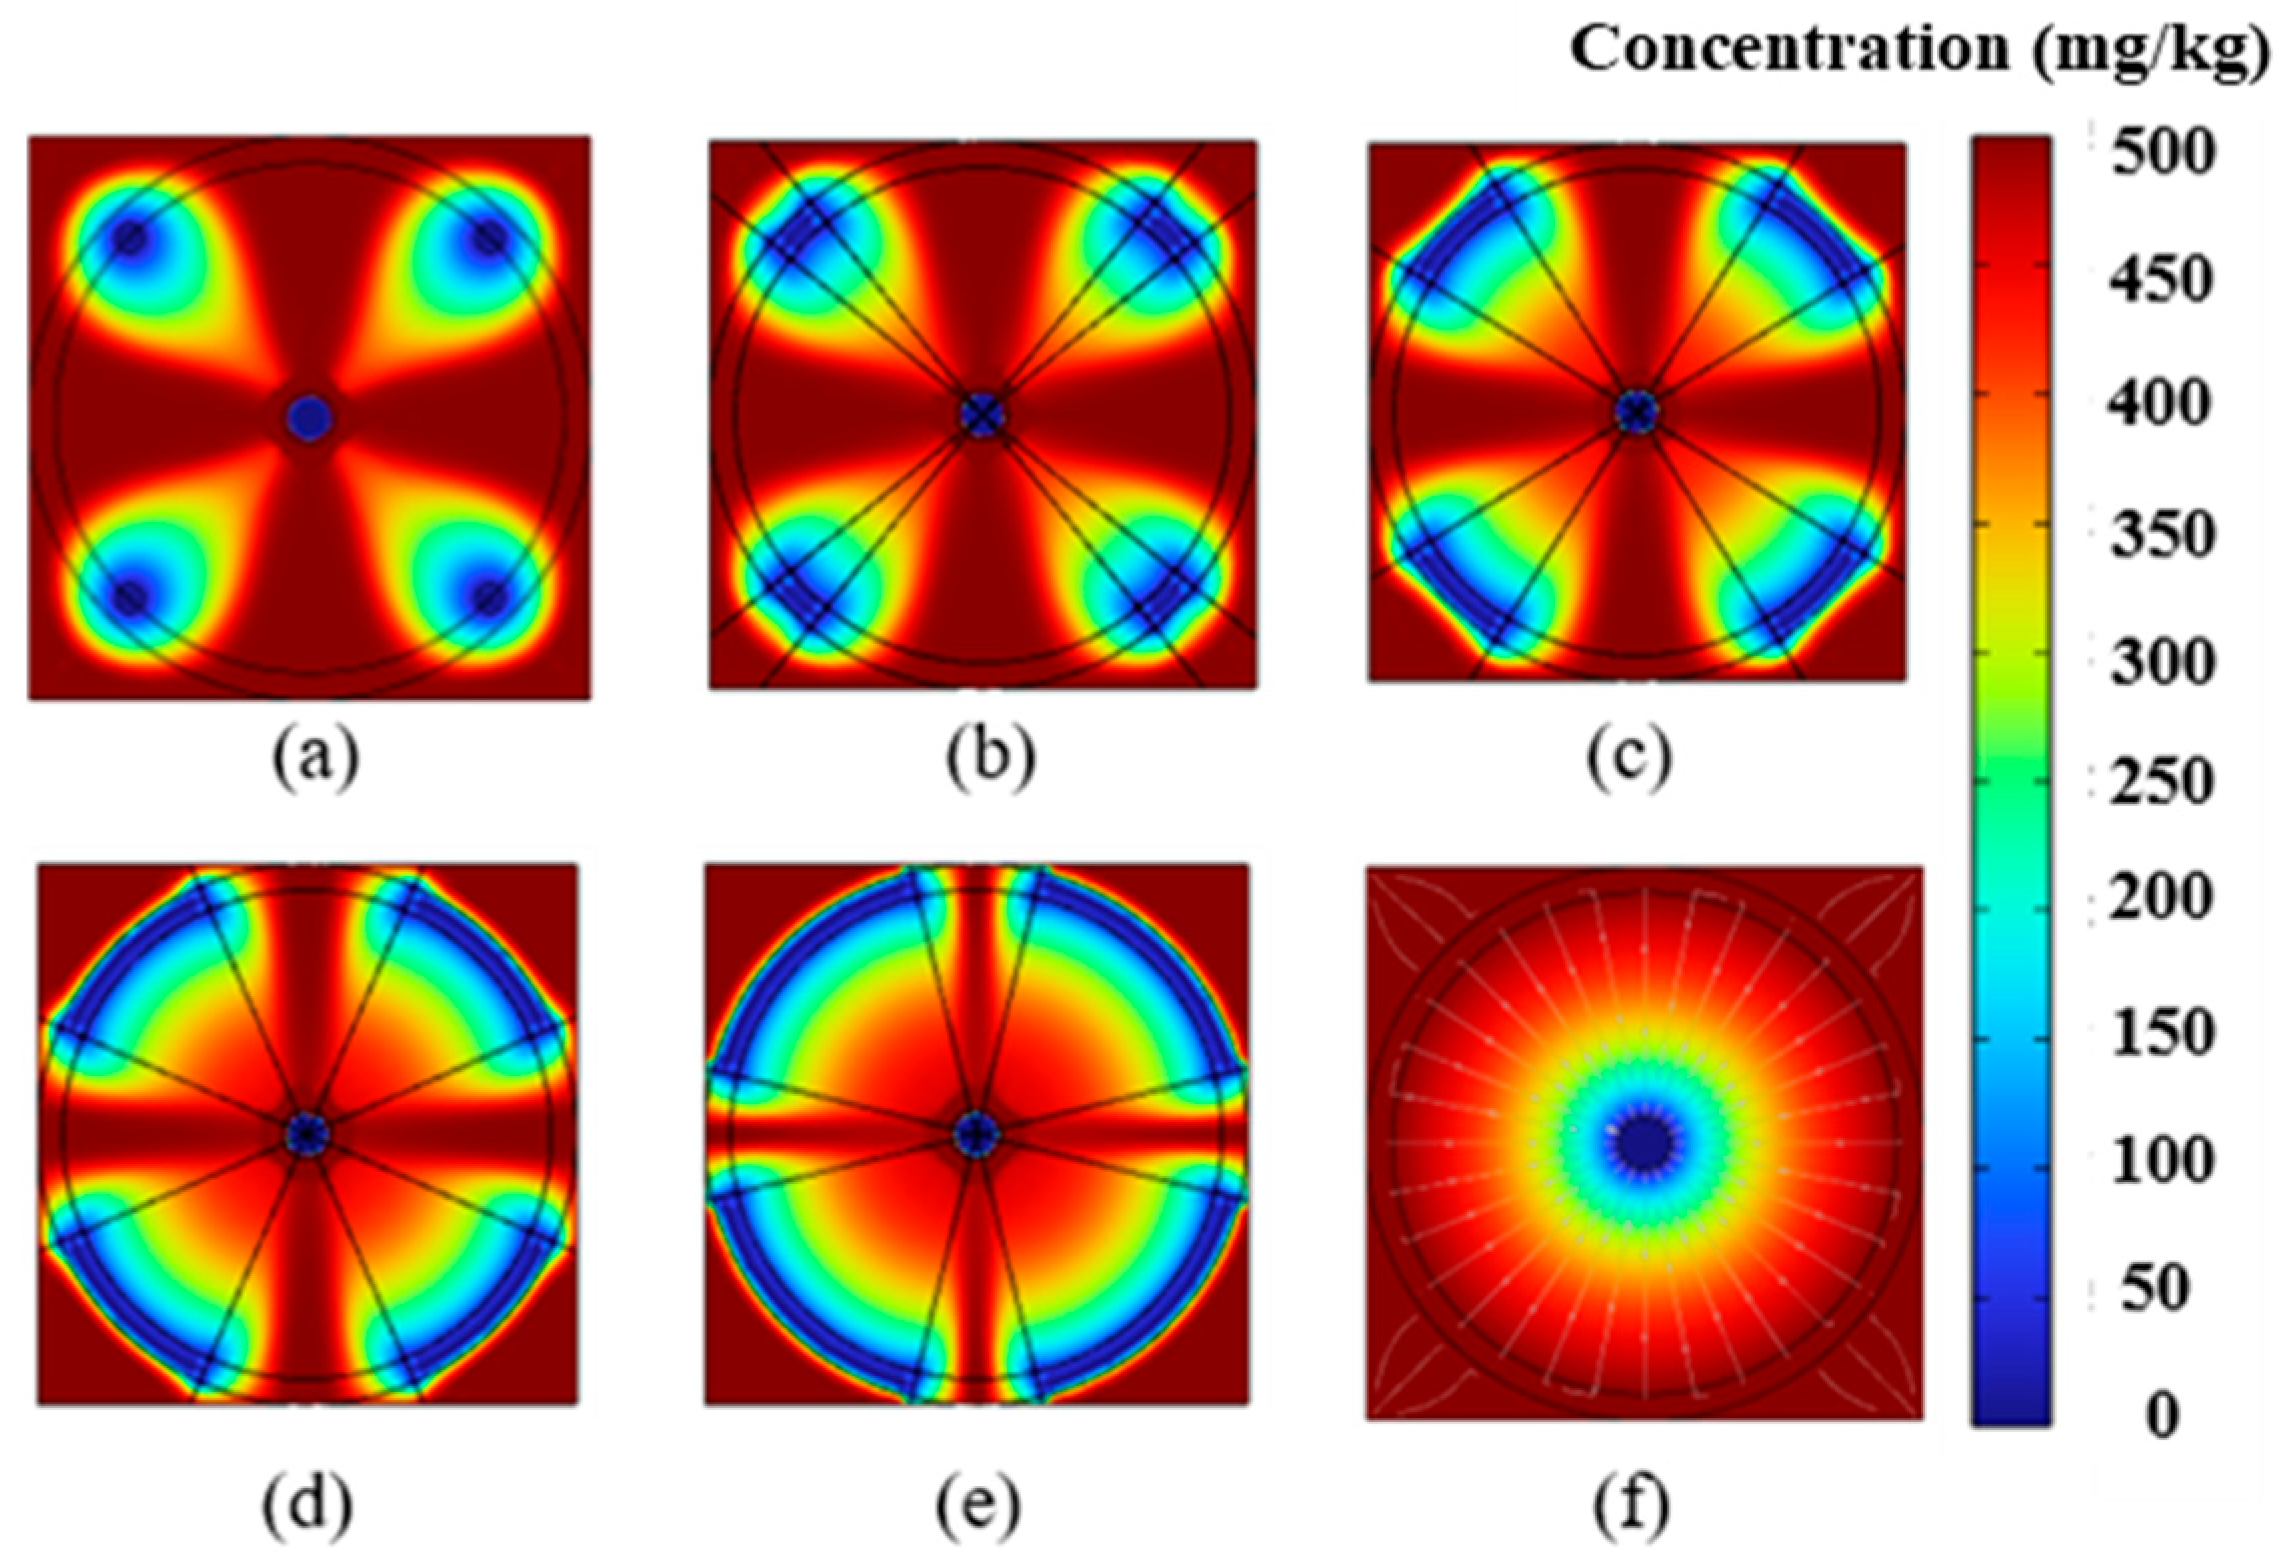
4.1. Impact of Electrode Placement on EK Remediation

Based on the correct numerical model, an innovative arc-shaped electrode system was developed. Two electrode configurations were constructed in the model, as shown in Figure S6a,c, to investigate the impact of electrode placement on electrokinetic remediation. The residual copper concentration distribution maps under both electrode configurations (see Figure 1a,b) show that both methods effectively removed copper inside the ring, but there were significant differences in contaminant removal outside the ring. Specifically, the configuration in Figure S6a failed to effectively remove copper ions from the four corner regions. To explain this, an analysis was conducted considering electric potential and pH values. Figure 1e–h show the changes in electric potential and soil pH values after 72 h for both configurations. The results indicate that both configurations did not alter the electric potential distribution inside the ring; however, the diagonally placed arc-shaped electrodes significantly increased the potential difference between the corner regions and the cathode. A larger potential difference accelerates electroosmotic flow, enhancing the electromigration of copper ions. Therefore, the configuration shown in Figure S6c was more effective for removing copper ions from the soil outside the ring. In addition to electrode placement, soil pH value is also a key factor influencing removal efficiency. The pH value distribution maps (see Figure 1g,h) after electrokinetic remediation show that the configuration in Figure S6a did not create an effective acidification zone outside the ring, suppressing the desorption of copper and lead ions. The absence of an acidification zone outside the ring in Figure 1g is primarily due to the ineffective regions created by the configuration in Figure S6a. Due to the repulsive effect between like-polarity electrodes, no current flows near the perpendicular line between the two anodes. In contrast, the configuration in Figure S6c minimizes the size of the ineffective region, allowing most of the area to be effectively acidified, making it a more suitable configuration.
Figure 1c,d show the distribution of residual lead concentration under the two configurations. The figures show that lead removal is negatively correlated with the distance between the anode and cathode, and the anode only affects half of the soil area. Additionally, lead migration can only occur along or near the perpendicular line between the anode and cathode. This is because electromigration dominates in electrokinetic remediation. The current density is higher along the line connecting the cathode and anode, making lead ion migration difficult in regions farther from this line due to lower current density. A comparison of the residual lead concentrations under the two configurations reveals that the concentrations inside the ring are similar, while the configuration in Figure 1c resulted in a higher current density outside the ring, reducing lead concentrations in some areas. Based on the analysis of the residual copper and lead concentrations, the configuration in Figure 1c results in higher current density and a smaller ineffective region.

4.2. Impact of Electrode Size on EK Remediation

Electrode size plays a crucial role in multi-electrode system electrokinetic remediation. Larger electrodes can cover a larger area, accelerating the remediation process; however, indiscriminate increases in electrode size also raise remediation costs. Figure 2a–f show the residual copper concentration distribution after electrokinetic remediation for various electrode sizes, corresponding to Figure S6b–g. A comparison reveals that the residual copper concentration inside the ring gradually decreases with increasing electrode size, ultimately achieving efficient copper removal within the ring. Figure S6a–e show that the placement of arc-shaped electrodes creates four distinct ineffective regions. However, increasing the electrode size reduces the size of the ineffective regions inside the ring. This can be explained by examining Figure 1, which shows the potential distribution for different electrode sizes corresponding to Figure S6a,c. Figure 2a–e clearly show that as the anode electrode increases in size, the potential near the perpendicular line between the two anodes gradually increases. This leads to an increase in current density near the perpendicular line, causing the ineffective region to shrink. Further increasing the anode electrode size until a ring-shaped electrode is formed effectively resolves the issue of ineffective regions in the multi-electrode system (see Figure 2f), allowing for uniform removal of contaminated loess within the ring. A comparison of the copper ion distribution outside the ring after electrokinetic remediation in Figure 2a–f shows that gradually increasing electrode size significantly inhibits electrokinetic removal efficiency outside the ring. This effect is particularly noticeable in Figure 2d–f. This occurs because when the arc-shaped electrode is larger and near the edge, the current tends to flow through the shortest path between the anode and cathode, bypassing the edge region. As a result, the current density in the edge region is relatively low, causing the aforementioned phenomenon.
Figure 3a–f display the distribution of soil pH values for different electrode sizes, corresponding to Figure S6b–g. The results indicate that after 72 h, the soil pH values remain at 4. Increasing electrode size accelerates the soil acidification rate. However, due to the shielding effect of excessively large electrodes on the edge regions, the acidified area outside the ring decreases as the electrode size increases.
Figure 4a–f display the residual lead concentration distribution after EK remediation for different electrode sizes, corresponding to Figure S6b–g. The residual lead concentration distribution shows significant differences under various sizes of the arc-shaped electrode system. As electrode size increases, lead removal efficiency improves. Given the strong adsorption of lead ions (compared to copper ions), increasing electrode size increases the contact area between the anode and soil, creating more migration pathways and improving lead removal. Additionally, Figure 5a,b show the effect of shorter arc-shaped electrode systems on lead-contaminated soil outside the ring. Further increasing electrode size causes the shielding effect in the edge region, reducing lead ion removal efficiency.

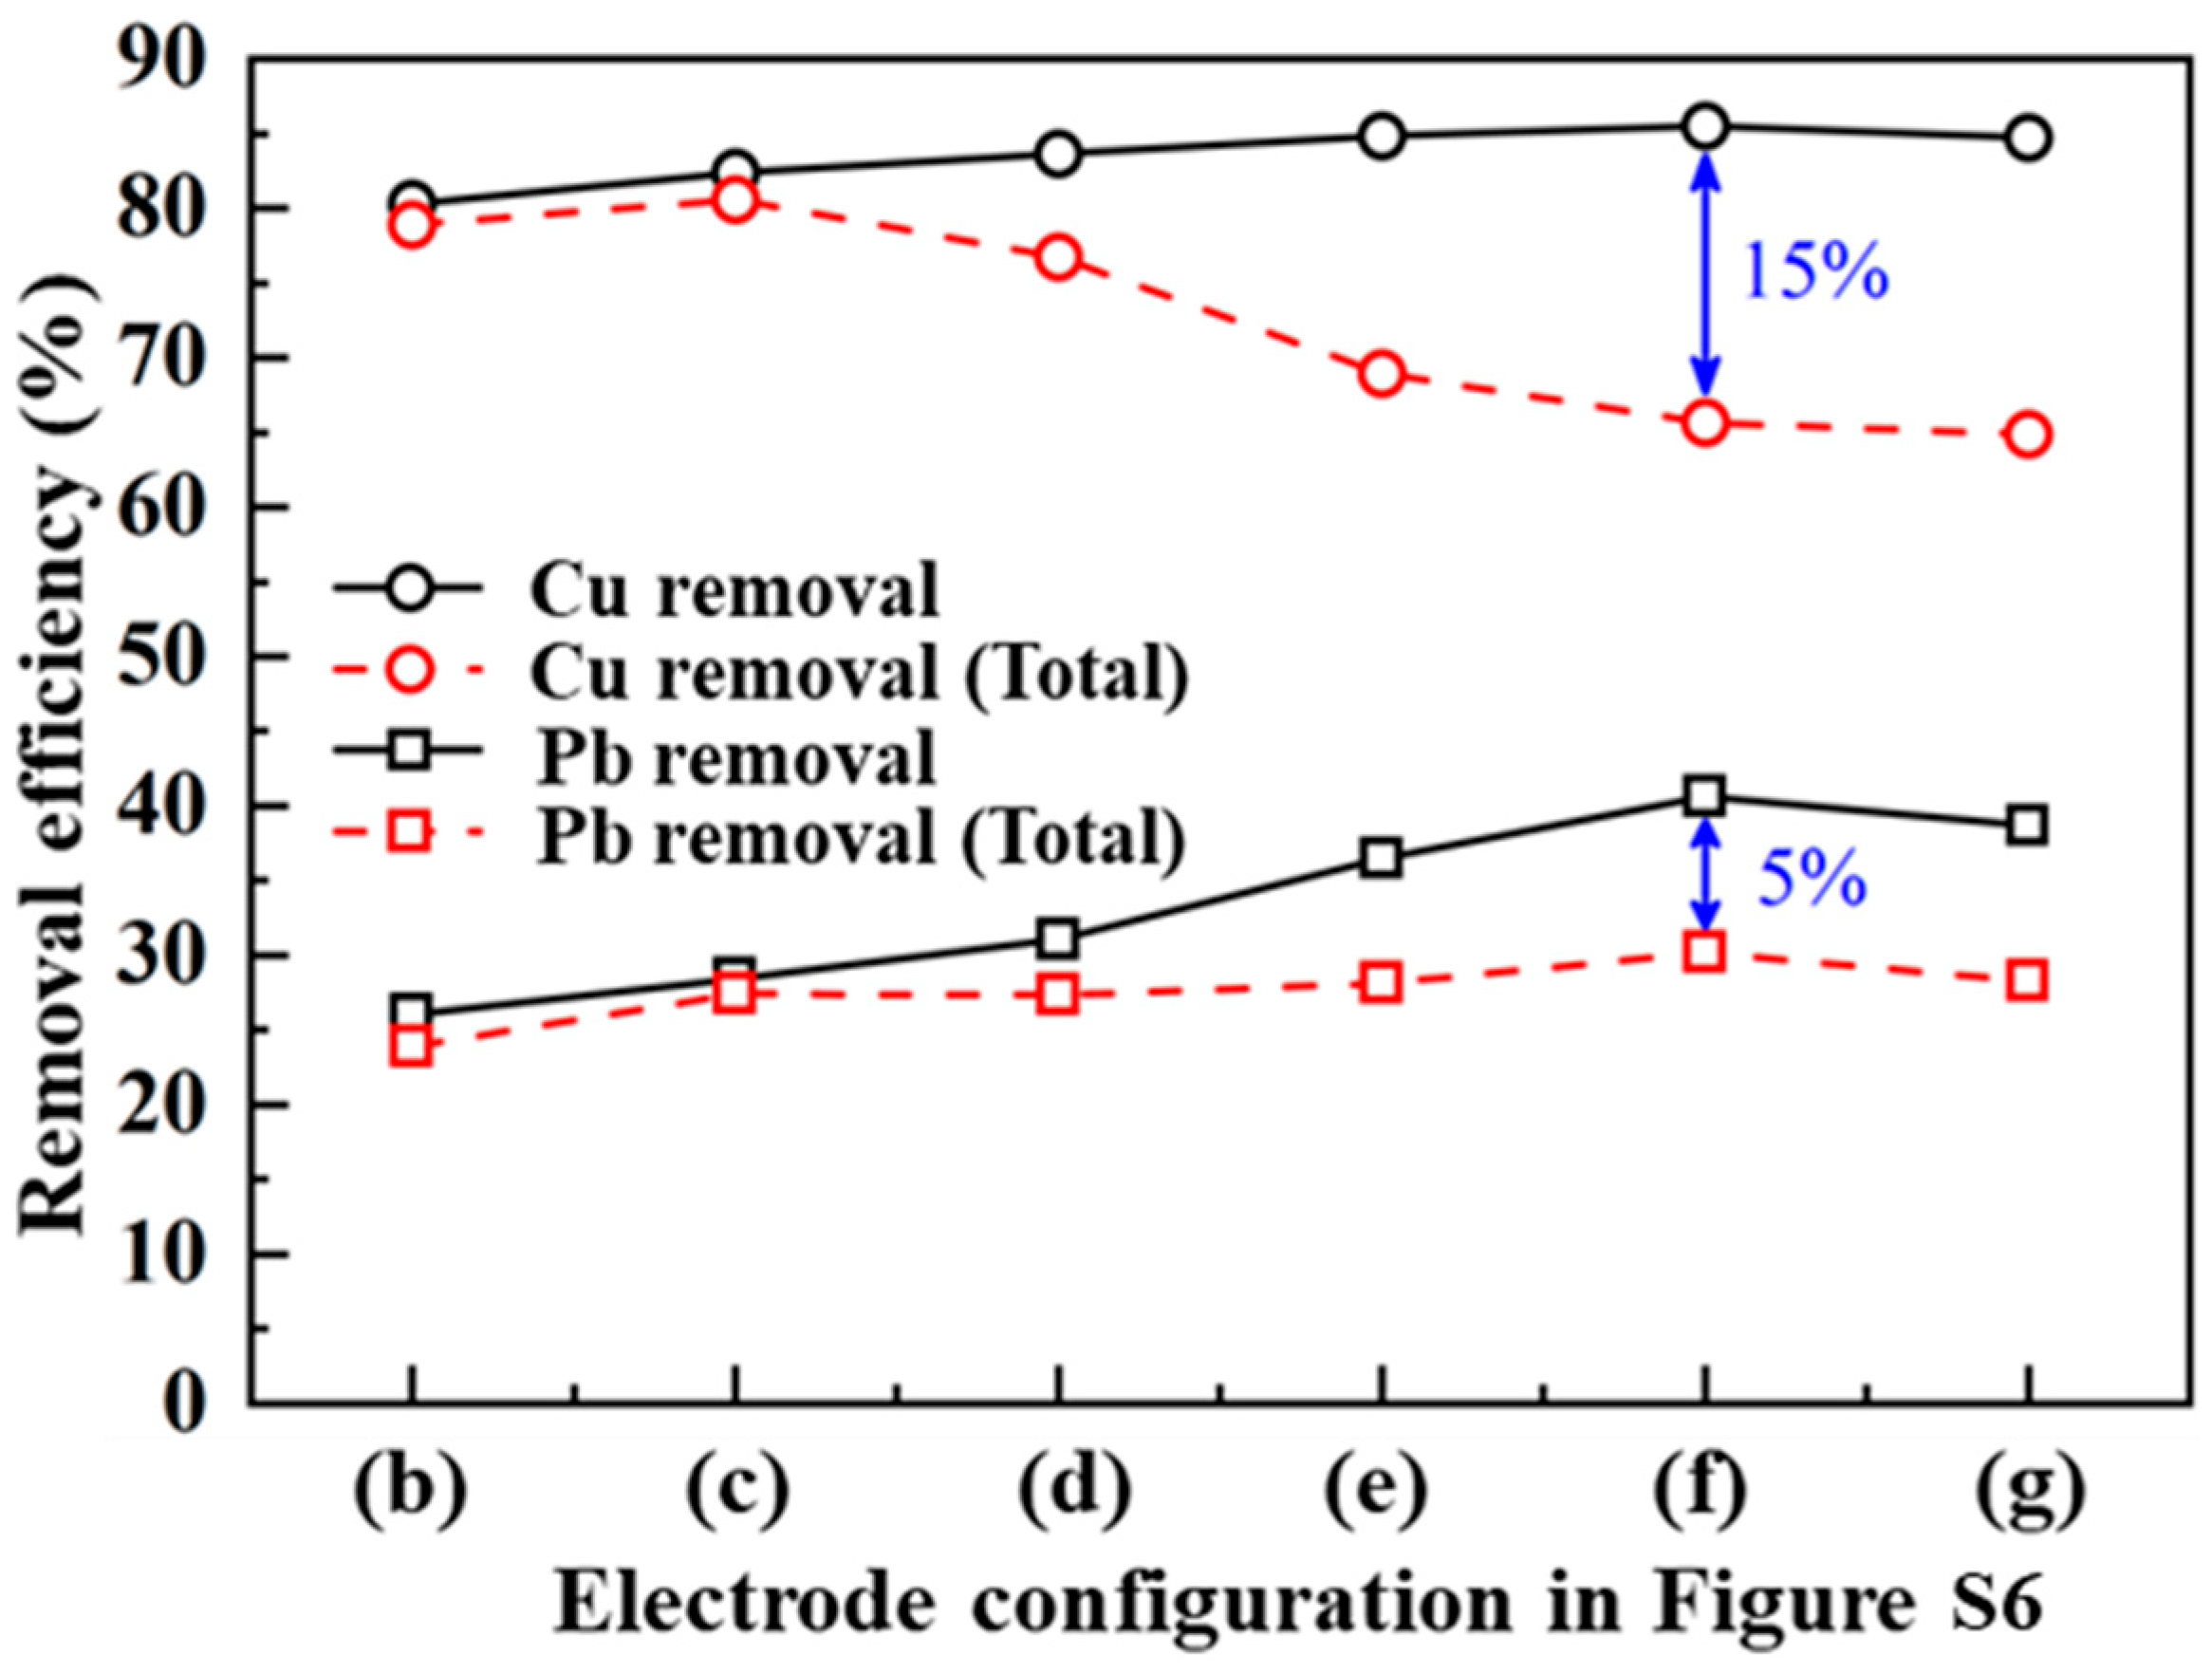
4.3. Removal Efficiency Analysis

Figure 6 illustrates the variation in copper and lead ion removal efficiency for different electrode configurations, as shown in Figure S6b–g. The black curve represents the variation in removal efficiency based on electrode-covered areas (sampling points A, B, C, and D), while the red curve includes both the electrode-covered areas and the edge regions (sampling point E). The removal efficiency of copper ions remains above 80%, and even when considering the shielding effect in the edge regions, the overall removal efficiency stays above 64.9%. Lead removal efficiency gradually increases with electrode arc length, from 23.9% with a shorter arc-length electrode to 40.9% with a longer arc-length electrode. After accounting for the shielding effect in the edge regions, the overall lead removal efficiency remains around 30%.
Longer arc-length arc-shaped electrodes increase the contact area with the soil, expanding the acidification zone and reducing the ineffective region. As the electrode arc length increases, the removal efficiency of copper and lead increases. However, the shielding effect in the edge regions caused by a longer electrode arc length negatively affects copper ion migration (see Figure 2d–f), significantly reducing overall copper removal efficiency. For lead ions, adsorption with loess makes their effective removal through electromigration difficult. As the electrode arc length increases, the shielding effect further suppresses lead ion migration in the edge regions. The shielding effect in the edge regions has a relatively smaller impact on lead ion removal compared to copper ions.
Additionally, as shown in Figure 6, the ring electrode configuration in Figure S6g effectively reduces the ineffective region, resulting in a more uniform electric field. However, the local current density is lower compared to the non-uniform electric field generated by the arc-shaped electrode configuration. As a result, the removal efficiency of the ring electrode system in Figure S6g is lower than that of the arc-shaped electrode system in Figure S6f.

4.4. Discussion

Large spacing between same-polarity electrodes in multi-electrode systems leads to stronger repulsive effects and expanded ineffective regions. To mitigate this, the present study shortens the arc length of arc-shaped electrodes, thereby reducing anode spacing and forming a more compact current path. This enhances current density and minimizes ineffective regions. Notably, the ring electrode configuration—with the longest arc length—proved most effective in eliminating the ineffective zone.
Comparisons with the state-of-the-art research regarding treatment time, electric field intensity, and removal efficiency were conducted (see Table 2). Under the same initial concentration and treatment time, the removal efficiency of Cu using the proposed multi-electrode configuration was significantly higher than that achieved with a combination of a graphene oxide–alginate composite electrode and cathode pH regulation [11]. It was also higher than the removal efficiency achieved with graphite electrodes and EKG electrodes [3,10,11]. Furthermore, the removal efficiency was superior to experiments conducted with lower initial concentrations and longer treatment times [29,38,39,40,41]. Despite the higher initial concentration and longer treatment time in the study by Li et al. [5], the multi-electrode configuration employed in this study demonstrated notably superior removal efficiency. Xie et al. [29] conducted EK remediation of Cu-contaminated clay with lower concentrations for 60 h, but their removal efficiency was only 0.05 times that of this study. In light of the above, the multi-electrode configuration demonstrates superior capabilities in removing Cu and Pb. Although the multi-electrode configuration proposed in this study has potential advantages over state-of-the-art research, the removal efficiency falls short of satisfactory results. Further details on strategies for enhancing removal will be discussed later.
Diagonally arranged arc-shaped electrodes enhance current density in edge regions, reducing ineffective zones and promoting the migration of Cu2⁺ and Pb2⁺ ions, thereby improving overall removal efficiency. However, a comprehensive evaluation is required to fully assess the impact of electrode configuration. Increasing the electrode arc length further raises current density and creates additional ion migration pathways. Nonetheless, the intended meaning is as follows: extending the arc length of curved electrodes can enhance the removal efficiency within the central arc region by improving electric field coverage. However, a longer arc may also intensify the “shielding effect” in the outer regions, where electric field strength and ion migration become significantly weaker due to geometric field distortion. As a result, pollutant removal in these edge areas is adversely affected. Therefore, while increasing arc length benefits the central zone, it may reduce the overall remediation performance in peripheral zones. This trade-off highlights the need to optimize electrode layout to balance both effects. Conversely, the current density in the uniform electric field of the ring electrode configuration is lower than that in the non-uniform electric field of the arc-shaped electrode configuration, which adversely impacts the removal efficiency of the former.
The electrode configuration in Figure S6c reduces the ineffective region area, facilitating the removal of copper ions, with a copper removal efficiency reaching 80%. The electrode configuration in Figure S6f provides more migration paths and higher current density, facilitating the removal of lead ions in the electrode-covered area, with a lead removal efficiency of approximately 30%. The following further weighs the advantages and disadvantages of the two electrode configurations shown in Figure S6c,f, with results that can provide a reference for engineering practice. The copper and lead removal efficiencies for the electrode configuration in Figure S6f range from 65 to 80% and 30 to 40%, respectively, while the copper and lead removal efficiencies for the configuration in Figure 6c are 80% and 30%, respectively. Compared to Figure S6c, the configuration in Figure S6f results in a 5% difference in lead removal efficiency (overall compared to the covered area) due to the shielding effect in the edge regions, and a 15% difference in copper removal efficiency (overall compared to the covered area) due to the shielding effect. In contrast, for the configuration in Figure S6c, the shielding effect in the edge regions does not result in a significant difference in lead removal efficiency (overall compared to the covered area), and a similar observation is made in the analysis of copper removal efficiency, where the difference is almost negligible (overall compared to the covered area). Considering all these results, the cost of selecting the configuration in Figure S6f (a 15% difference) outweighs the benefits. The configuration in Figure 6c not only maintains a copper removal efficiency above 80% but also avoids a sharp decrease in lead removal efficiency due to the shielding effect. As a result, the lead removal efficiency remains above 30%, making the configuration in Figure 6c the most suitable electrode configuration for enhancing electrokinetic remediation removal efficiency when weighing the pros and cons. Considering all these results, the cost associated with selecting the configuration illustrated in Figure S6f, which presents a 15% difference, outweighs the potential benefits. Conversely, the configuration depicted in Figure S6c not only sustains a copper removal efficiency exceeding 80% but also circumvents a significant decline in lead removal efficiency attributed to the shielding effect. Consequently, the lead removal efficiency remains above 30%, rendering the configuration in Figure 6c the most appropriate electrode configuration for optimizing electrokinetic remediation removal efficiency when evaluating the advantages and disadvantages.

5. Conclusions

This study investigates the removal efficiency of electrokinetic remediation utilizing irregular electrodes through a water–electric–chemical coupled numerical model, while examining the relationship between electrode placement and arc length. Based on the comparison of the simulation and the experimental results, some main conclusions can be drawn as follows.
(1) Electrode configuration significantly influences both current density and the extent of the acidification zone. Diagonally placed arc-shaped electrodes increase the potential gradient between the edge and the cathode, thereby enhancing current density, reducing ineffective regions, and expanding the effective acidification zone to facilitate Cu2⁺ and Pb2⁺ migration.
(2) Extending the electrode arc length increases soil–electrode contact and reduces anode spacing, enhancing current density and ion migration pathways. However, in the ring configuration—the longest arc length—this also intensifies edge shielding, which adversely affects removal efficiency.
(3) The ring configuration leads to a 5% reduction in Pb removal and 15% in Cu removal due to shielding effects. In contrast, arc-shaped electrodes exhibit minimal shielding impact while keeping Cu removal above 80% and maintaining stable Pb removal. Thus, the arc-shaped configuration emerges as the optimal design for improving EK remediation efficiency, balancing enhancement and interference effects.

Supplementary Materials

The following supporting information can be downloaded at: https://www.mdpi.com/article/10.3390/pr13071948/s1, Figure S1: Particle-size distribution of the loess [3]; Figure S2: Schematic illustration of the electrokinetic reactor [3]; Figure S3: Scheme of the relationships of reactive-transport model applied to numerical implementation structure; Figure S4: Scheme of the six configurations applied to implement numerical simulations: (a) model SE1, (b) model SE2, (c) model SE3, (d) model SE4, (e) model SE5, and (f) model SE6; Figure S5: Comparisons of experimental results with numerical simulation: (a) electric current, (b) accumulated EOF, (c) pH value, (d) copper concentration, (e) lead concentration, (f) mass balance; Figure S6: (a–g) Schematic illustration of layouts of arc-shaped electrode; (h) plan layout applied for sampling. Table S1: Physicochemical properties of the loess.

Author Contributions

W.H.: data curation, formal analysis, validation, software, writing—original draft. X.W.: data curation, formal analysis, conceptualisation, methodology, writing—review and editing, supervision, funding acquisition. All authors have read and agreed to the published version of the manuscript.

Funding

This research received no external founding.

Data Availability Statement

The original contributions presented in this study are included in the article/supplementary material. Further inquiries can be directed to the corresponding author.

Conflicts of Interest

The authors declare that they have no known competing financial interests or personal relationships that could have appeared to influence the work reported in this paper.

References

  1. Alshawabkeh, A.N.; Acar, Y.B. Removal of contaminants from soils by electrokinetics: A theoretical treatise. J. Environ. Sci. Health Part A Environ. Sci. Eng. Toxicol. 1992, 27, 1835–1861. [Google Scholar] [CrossRef]
  2. Bala, R.P.; Srivastava, R.K.; Mohan, D. Electrokinetic removal of mixed heavy metals from a contaminated low permeable soil by surfactant and chelants. Environ. Earth Sci. 2015, 73, 1191–1204. [Google Scholar]
  3. Hu, W.L.; Cheng, W.C.; Wen, S.J. Investigating the effect of degree of compaction, initial water content, and electric field intensity on electrokinetic remediation of an artificially Cu- and Pb-contaminated loess. Acta Geotech. 2023, 18, 937–949. [Google Scholar] [CrossRef]
  4. Hu, W.L.; Cheng, W.C.; Wang, Y.H.; Wen, S.J.; Xue, Z.F. Applying a nanocomposite hydrogel electrode to migrate electrochemical polarization and focusing effect in electrokinetic remediation of a Cu- and Pb-contaminated loess. Environ. Pollut. 2023, 333, 122039. [Google Scholar] [CrossRef]
  5. Li, H.; Tian, Y.; Liu, W.; Long, Y.; Ye, J.; Li, B.; Li, N.; Yan, M.; Zhu, C. Impact of electrokinetic remediation of heavy metal contamination on antibiotic resistance in soil. Chem. Eng. J. 2020, 400, 125866. [Google Scholar] [CrossRef]
  6. Ren, Y.; Li, F.C.; Zhai, L.W.; Dong, D.X.; Han, R.F.; Qi, X.Y.; Zhang, X.; Li, L.; Jiang, W.Q.; Chen, X. Tween 80 assisted washing ciprofloxacin-contaminated soil, and recycled it using active chlorines. Environ. Pollut. 2023, 330, 121735. [Google Scholar] [CrossRef]
  7. Sharma, J.K.; Kumar, N.; Singh, N.P.; Santal, A.R. Phytoremediation technologies and their mechanism for removal of heavy metal from contaminated soil: An approach for a sustainable environment. Front. Plant Sci. 2023, 14, 1076876. [Google Scholar] [CrossRef]
  8. Sarker, A.; Al, M.M.A.; Deepo, D.M.; Das, K.; Nandi, R.; Ansary, M.W.R.; Islam, A.M.T.; Islam, T. Biological and green remediation of heavy metal contaminated water and soils: A state-of-the-art review. Chemosphere 2023, 332, 138861. [Google Scholar] [CrossRef]
  9. Liu, X.; Lan, C.R.; Yang, Z.H.; Zhuang, X.J.; Feng, H.P.; Wang, H.B.; Chen, W.; Wu, Y.F.; Tang, J. Enhanced electrokinetic remediation of cadmium contaminated soil by calcium phosphate-modified zeolite as permeable reactive barriers. Electrochim. Acta 2025, 524, 146057. [Google Scholar] [CrossRef]
  10. Hu, W.L.; Cheng, W.C.; Wen, S.J.; Kang, N.B. Revealing underlying mechanisms affecting electrokinetic remediation of an artificially Cu- and Pb-contaminated loess using the external regulatory system with adsorbent. Front. Mater. 2022, 9, 967871. [Google Scholar] [CrossRef]
  11. Hu, W.L.; Cheng, W.C.; Wang, Y.H.; Wen, S.J. Feasibility study of applying a graphene oxide-alginate composite hydrogel to electrokinetic remediation of Cu(Ⅱ)-contaminated loess as electrodes. Sep. Purif. Technol. 2023, 322, 124361. [Google Scholar] [CrossRef]
  12. Sun, Z.Y.; Zhao, M.M.; Chen, L.; Gong, Z.Y.; Hu, J.J.; Ma, D.G. Electrokinetic remediation for the removal of heavy metals in soil: Limitations, solutions and prospection. Sci. Total Environ. 2023, 903, 165970. [Google Scholar] [CrossRef] [PubMed]
  13. Song, P.P.; Xu, D.; Yue, J.Y.; Ma, Y.C.; Dong, S.J.; Feng, J. Recent advances in soil remediation technology for heavy metal contaminated sites: A critical review. Sci. Total Environ. 2022, 838, 156417. [Google Scholar] [CrossRef]
  14. Wang, Y.C.; Li, A.; Cui, C.W. Remediation of heavy metal-contaminated soils by electrokinetic technology: Mechanisms and applicability. Chemosphere 2021, 265, 129071. [Google Scholar] [CrossRef] [PubMed]
  15. Wang, Y.C.; Han, Z.J.; Li, A.; Cui, C.W. Enhanced electrokinetic remediation of heavy metals contaminated soil by biodegradable complexing agents. Environ. Pollut. 2021, 283, 117111. [Google Scholar] [CrossRef]
  16. Kim, G.H. Modeling study on the electrokinetic extraction of contaminants from soils. J. Korean Soc. Civ. Eng. 1998, 18, 503. [Google Scholar]
  17. Wang, L.; Cheng, W.C.; Xue, Z.F.; Xie, Y.X.; Lv, X.J. Feasibility study of applying electrokinetic technology coupled with enzyme-induced carbonate precipitation treatment to Cu- and Pb-contaminated loess remediation. J. Clean. Prod. 2023, 401, 136734. [Google Scholar] [CrossRef]
  18. Purkis, J.M.; Warwick, P.E.; Graham, J.; Hemming, S.D.; Cundy, A.B. Towards the application of electrokinetic remediation for nuclear site decommissioning. J. Hazard. Mater. 2021, 413, 125274. [Google Scholar] [CrossRef]
  19. Wen, D.D.; Fu, R.B.; Li, Q. Removal of inorganic contaminants in soil by electrokinetic remediation technologies: A review. J. Hazard. Mater. 2021, 401, 123345. [Google Scholar] [CrossRef]
  20. Gallo, A.; Sprocati, R.; Islam, K.T.; Rolle, M. Combined effects of porosity, tortuosity and pore water composition on electrokinetic transport dynamics in porous media. Electrochim. Acta 2025, 524, 145969. [Google Scholar] [CrossRef]
  21. Ferrucci, A.; Vocciante, M.; Bagatin, R.; Ferro, S. Electrokinetic remediation of soils contaminated with potentially toxic metals: Dedicated analytical tools for assessing the contamination baseline in a complex scenario. J. Environ. Manag. 2017, 203, 1163–1168. [Google Scholar] [CrossRef] [PubMed]
  22. Tian, J.; Li, X.Z.; Ding, W.; Shuai, K.W.; Zhen, Q.; She, D. Enhanced removal of cadmium from aqueous environments and soil during electrokinetic remediation using Si-Mg modified sawdust-based biochar as an adsorbent and permeable reactive barrier material. Chem. Eng. J. 2025, 508, 161178. [Google Scholar] [CrossRef]
  23. Peng, C.S.; Almeira, J.O.; Gu, Q.B. Effect of electrode configuration on pH distribution and heavy metal ions migration during soil electrokinetic remediation. Environ. Earth Sci. 2013, 69, 257–265. [Google Scholar] [CrossRef]
  24. Segall, B.A.; Bruell, C.J. Electroosmotic contaminant-removal processes. J. Environ. Eng. 1992, 118, 84–100. [Google Scholar] [CrossRef]
  25. Penn, M.L.M. Electrokinetic Soil Remediation: Effects of pH, Temperature and Chemical Reactions; University of Cambridge: Cambridge, UK, 1997. [Google Scholar]
  26. Kim, S.O.; Jeong, J.Y.; Lee, W.C.; Yun, S.T.; Jo, H.Y. Electrokinetic remediation of heavy metal-contaminated soils: Performance comparison between one- and two-dimensional electrode configurations. J. Soils Sediments 2021, 21, 2755–2769. [Google Scholar] [CrossRef]
  27. Yan, I.D. HCET: A Finite Element Model for Solute Transport Driven by Hydraulic, Chemical, Electrical, and Thermal Gradients; Colorado State University: Fort Collins, CO, USA, 2000. [Google Scholar]
  28. Mattson, B.; Robert, S. Electrokinetic ion transport through unsaturated soil: 2. Application to a heterogeneous field site. J. Contam. Hydrol. 2002, 54, 99–120. [Google Scholar] [CrossRef]
  29. Xie, N.; Chen, Z.; Wang, H.M.; You, C.F. Activated carbon coupled with citric acid in enhancing the remediation of Pb-Contaminated soil by electrokinetic method. J. Clean. Prod. 2021, 308, 127433. [Google Scholar] [CrossRef]
  30. GB/T 50123-2019; Ministry of Water Resources of the People’s Republic of China, 2019. Standard for Geotechnical Test Methods. China Planning Press: Beijing, China, 2019.
  31. ASTM. Standard Classification of Soils for Engineering Purposes (Unified Soil Classification System); ASTM: West Conshohocken, PA, USA, 2006. [Google Scholar]
  32. Tessier, A.P.; Campbell, P.G.C.; Bisson, M.X. Sequential extraction procedure for the speciation of particulate trace metals. Anal. Chem. 1979, 51, 844–851. [Google Scholar] [CrossRef]
  33. Masi, M.; Ceccarini, A.; Iannelli, R. Multispecies reactive transport modelling of electrokinetic remediation of harbour sediments. J. Hazard. Mater. 2017, 326, 187–196. [Google Scholar] [CrossRef]
  34. Masi, M.; Manuel, P.G.J.; Cesar, G.L.; Maria, V.G.; Alessio, C.; Renato, I. Modeling of electrokinetic remediation combining local chemical equilibrium and chemical reaction kinetics. J. Hazard. Mater. 2019, 371, 728–733. [Google Scholar] [CrossRef]
  35. Milad, R.; Gholamreza, A.; Cesar, G.L.; Maria, V.G.; Manuel, P.G.J. Modeling of electrokinetic remediation of Cd- and Pb-contaminated kaolinite. J. Hazard. Mater. 2019, 366, 630–635. [Google Scholar]
  36. Carlos, V.A.; Jose, M.R.M.; Rafael, A.G.D.; Cesar, G.L.; Franciso, G.H. Two-dimensional model for soil electrokinetic remediation of heavy metals: Application to a copper spiked kaolin. Chemosphere 2004, 54, 895–903. [Google Scholar]
  37. Yeung, A.T.; Menon, R.M. Electrokinetic remediation. II: Theoretical model. J. Geotech. Geoenviron. Eng. 1997, 123, 1078. [Google Scholar] [CrossRef]
  38. Muazu, N.D.; Essa, M.H. Comparative performance evaluation of anodic materials for electro-kinetic removal of Lead (II) from contaminated clay soil. Soil Sediment Contam. 2020, 29, 69–95. [Google Scholar] [CrossRef]
  39. Torabi, M.S.; Asadollahfardi, G.; Rezaee, M.; Panah, N.B. Electrokinetic Removal of Cd and Cu from Mine Tailing: EDTA Enhancement and Voltage Intensity Effects. J. Hazard. Toxic Radioact. Waste 2021, 25, 05020007. [Google Scholar] [CrossRef]
  40. Xie, N.; Wang, H.M.; You, C.F. On the electrokinetic remediation of Pb-contaminated soil: A coupled electro-transport-reaction modelling study based on chemical reaction kinetics. Chemosphere 2024, 355, 141661. [Google Scholar] [CrossRef]
  41. Zulfiqar, W.; Iabal, M.A.; Butt, M.K. Pb2+ ions mobility perturbation by iron particles during electrokinetic remediation of contaminated soil. Chemosphere 2017, 169, 257–261. [Google Scholar] [CrossRef]
Figure 1. Impact of electrode placement on numerical simulation results: (a,b) residual copper concentration, (c,d) residual lead concentration, (e,f) electric potential, and (g,h) pH value.
Processes 13 01948 g001
Figure 2. Contour maps showing Cu2+ concentration under the effect of arc length: (a) model a; (b) model b; (c) model c; (d) model d; (e) model e and (f) model f.
Processes 13 01948 g002
Figure 3. Contour maps showing electric potential under the effect of arc length: (a) model a; (b) model b; (c) model c; (d) model d; (e) model e and (f) model f.
Processes 13 01948 g003
Figure 4. Contour maps showing surrounding pH under the effect of arc length: (a) model a; (b) model b; (c) model c; (d) model d; (e) model e and (f) model f.
Processes 13 01948 g004
Figure 5. Contour maps showing Pb2+ concentration under the effect of arc length: (a) model a; (b) model b; (c) model c; (d) model d; (e) model e and (f) model f.
Processes 13 01948 g005
Figure 6. Variations of the removal efficiency versus layouts of the arc-shaped electrode: (b) model b; (c) model c; (d) model d; (e) model e; (f) model f and (g) model g.
Processes 13 01948 g006
Table 1. Summary of input parameters.
ParameterCodeValueDescriptionData Source
Loessn0.499PorosityExperimental measurement
Rhob1350 kg/m3Dry densityExperimental measurement
pH8.3Initial pH valueExperimental measurement
KLcu11.52 m3/molLangmuir constant[11]
CPcu1.7 mol/kgLangmuir constant[11]
KLPb12.43 m3/molLangmuir constant[11]
CPPb1.23 mol/kgLangmuir constant[11]
Zeta−10.8 mVZeta potential[3]
τ1.28Tortuosity[1]
R4.57 µmAverage pore diameter[1]
GOCH
electrodes
n20.312PorosityExperimental measurement
σ49.92 mS/cmConductivityExperimental measurement
Ecd0.53–5.3 A/m2Exchange current density
E11.229 VOxidation potential
E20.828 VReduction potential
KL2cu0.608 m3/molLangmuir constant[11]
CP2cu7.06 mol/kgLangmuir constant[11]
KL2Pb2.49 m3/molLangmuir constant[11]
CP2Pb2.22 mol/kgLangmuir constant[11]
Mass transferCcu500 mg/kgCopper Concentration
Cpb500 mg/kgLead Concentration
Dcu7.14 × 10−10Diffusion coefficient of Cu2+
Dpb2.50 × 10−10Diffusion coefficient of Pb+
DH9.31 × 10−10Diffusion coefficient of H+
DOH5.27 × 10−10Diffusion coefficient of OH
Pore fluid and electrolyteµ10−1 Pa·sDynamic viscosity
σ0.3 S/mConductivity
eps78.3 FDielectric constant
Table 2. Comparison of this study with the state-of-the-art research about treatment time, electric field intensity, and remediation efficiency.
ContaminantInitial Concentration (mg/Kg)Treatment Time (h)Electric Field Intensity (V/cm)Soil TypeAverage Remediation EfficiencyReferences
Cu and Pb500 (Cu) and 500 (Pb)481.0Loess0–19% (Cu) and
0–8% (Pb)
Hu et al. [3]
Cu and Pb500 (Cu) and 500 (Pb)721.5Loess24.92% (Cu) and
3.45% (Pb)
Hu et al. [10]
Pb103.51201.0Loam18.49%Zulfiqar et al. [41]
Pb120 ± 5.51681.08Clay14.15%Muazu et al. [38]
Cu and Zn250–1000 (Cu),
1000–3000 (Zn)
24, 48, and 1200.4–0.8/8–18.6% (Cu)
4.3–6.8% (Zn)
Li et al. [5]
Pb8334801.35Clay4.1%Xie et al. [29]
Cu and Pb500 (Cu) and
500 (Pb)
721.5Loess42.87% (Cu) and
5.19% (Pb)
Hu et al. [10]
Cu and Cd248.4 (Cu) and
82 (Pb)
2401.0Mine tailing4.59% (Cu) and
30.65% (Cd)
Torabi et al. [39]
Cu and Pb500 (Cu) and
500 (Pb)
721.5Loess47.25% (Cu) and
16.93% (Pb)
Hu et al. [11]
Cu and Pb500 (Cu) and
500 (Pb)
721.5Loess80% (Cu) and
40% (Pb)
Present study
Disclaimer/Publisher’s Note: The statements, opinions and data contained in all publications are solely those of the individual author(s) and contributor(s) and not of MDPI and/or the editor(s). MDPI and/or the editor(s) disclaim responsibility for any injury to people or property resulting from any ideas, methods, instructions or products referred to in the content.

