
The Incompatibility Pitfall in Refining Opportunity Crude Oils

 ,
,  , ,
, ,  , ,
, , 
 , ,
, ,  and
and
Abstract
1. Introduction
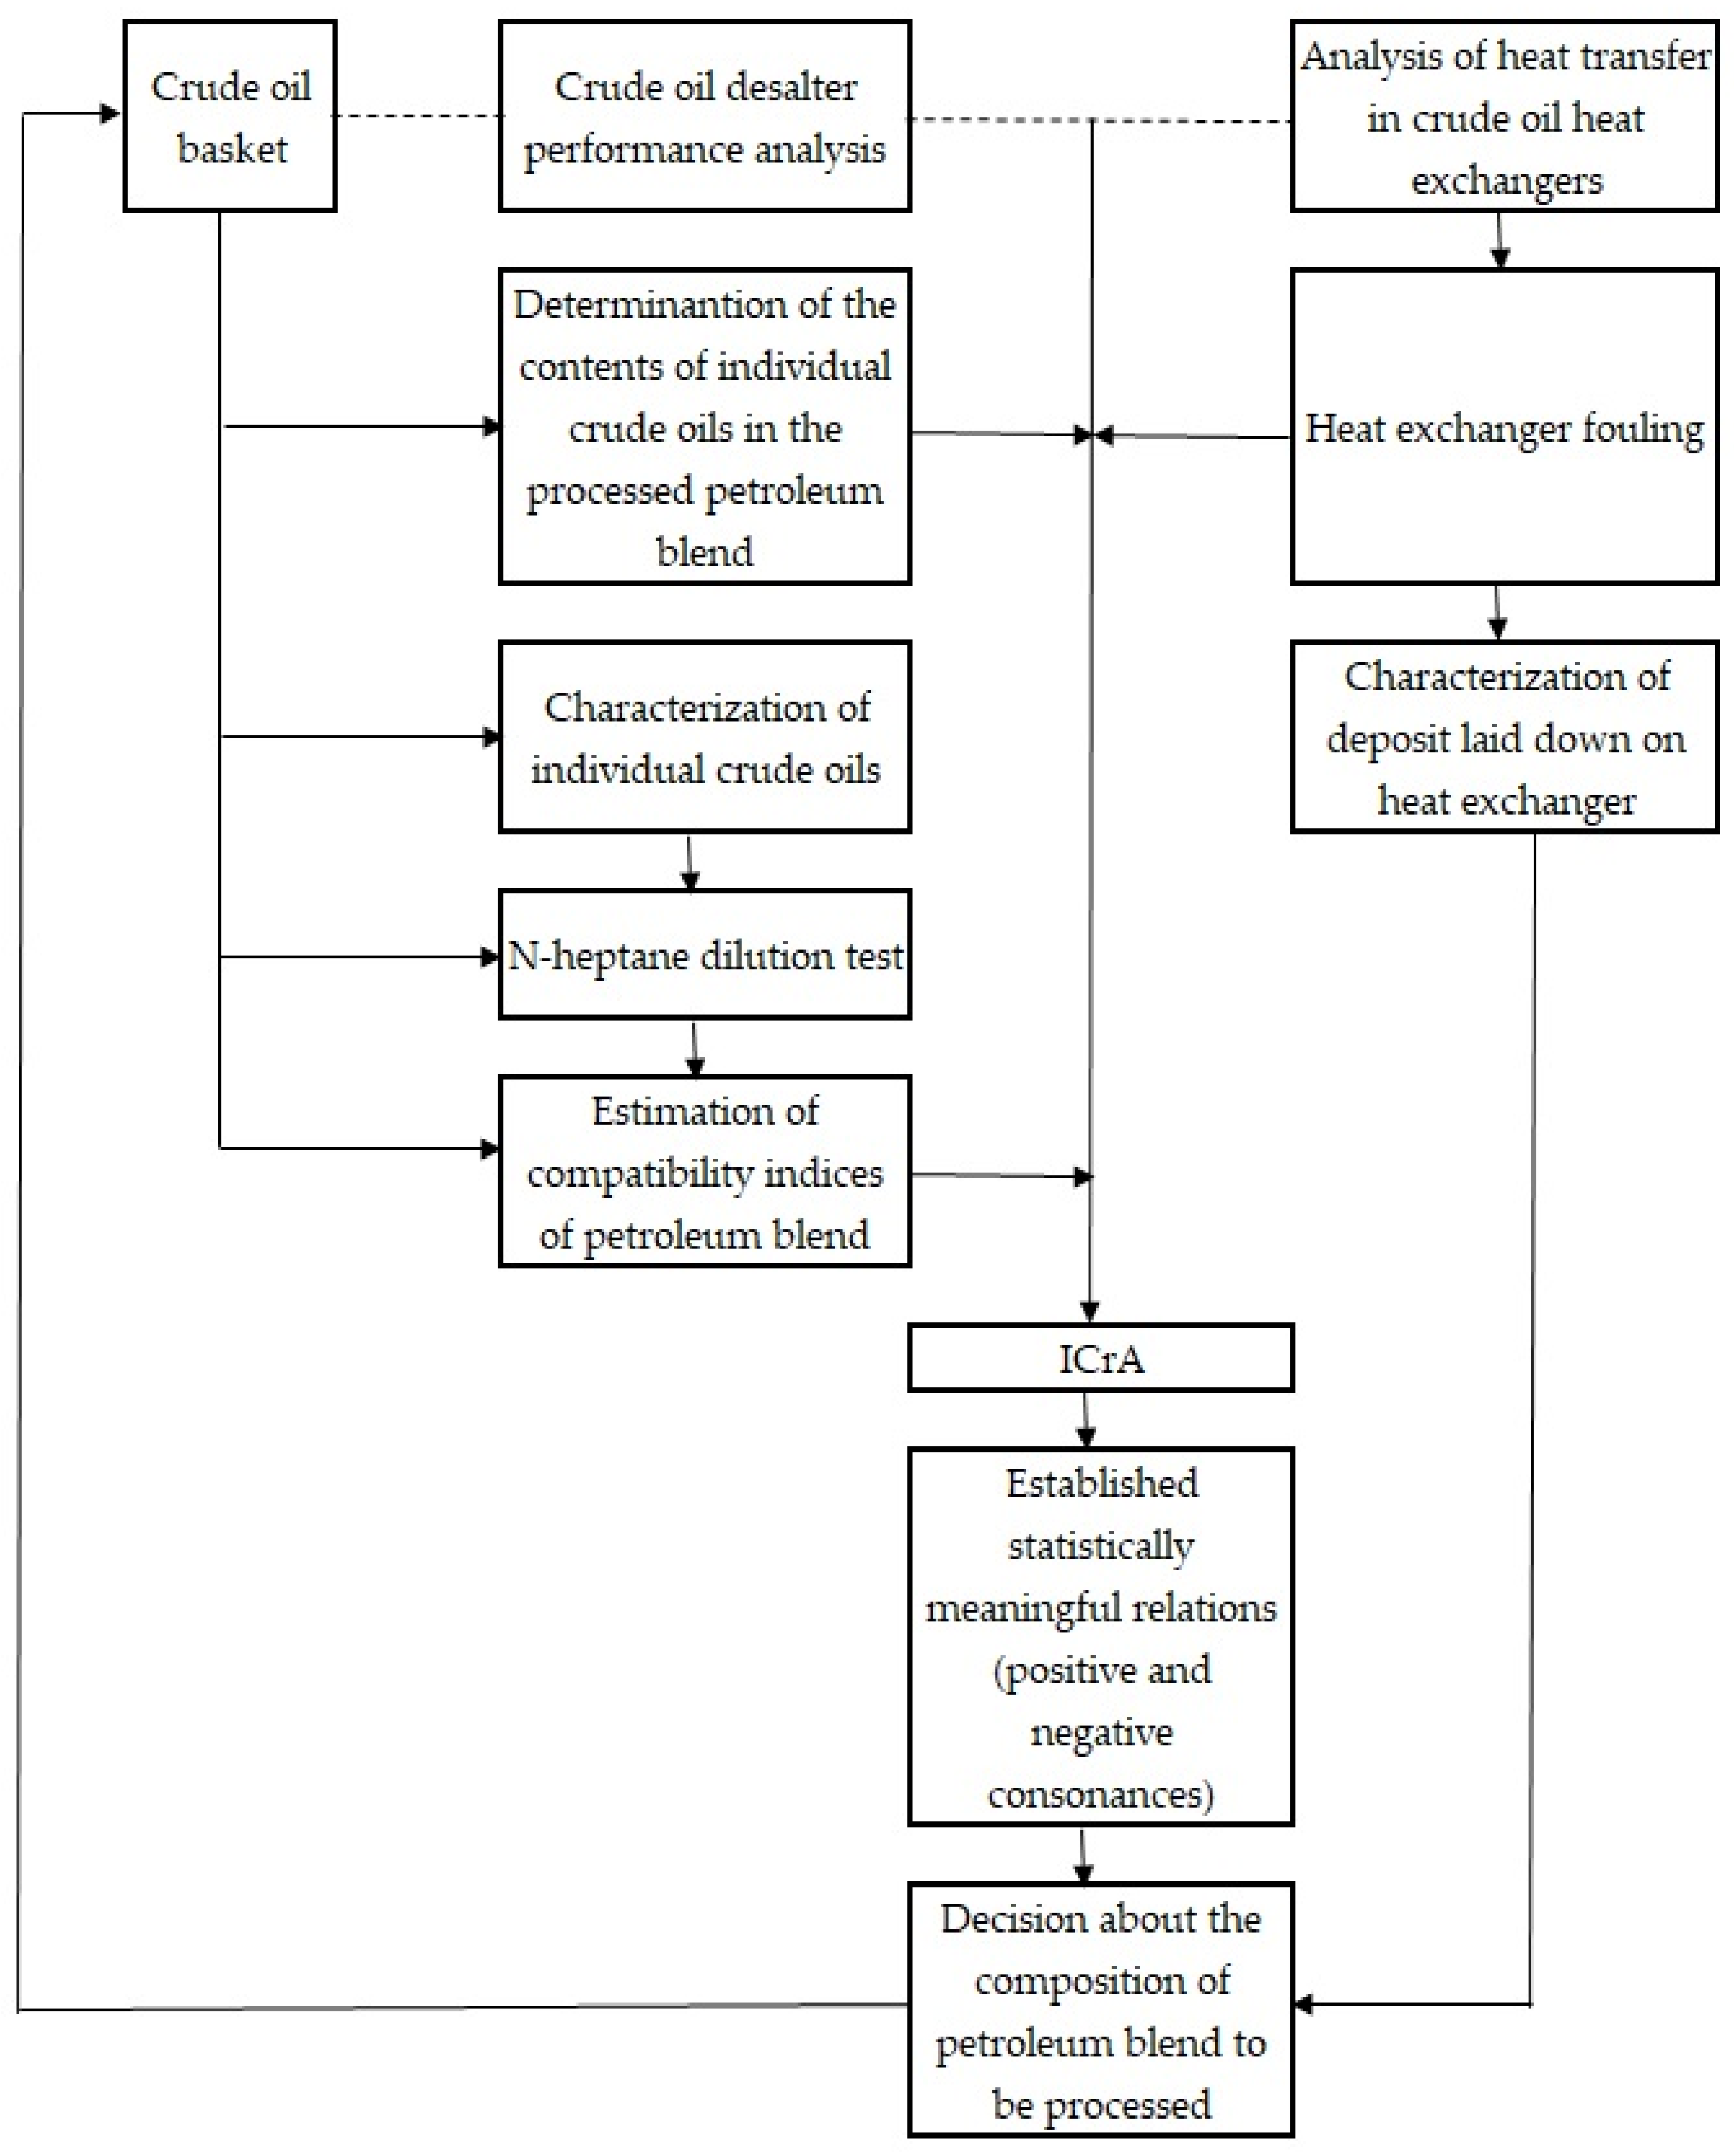
2. Materials and Methods
- SBNblend = Solubility blending number of the crude oil blend;
- SBNi = Solubility blending number of the “i-th” individual crude oil in the blend;
- Vi = Volume fraction of the “i-th” individual crude oil in the blend.
- Mi = Mass percentage of the “i-th” individual crude oil in the blend, wt.%;
- ai = content of C7–asphaltenes in the “i-th” individual crude oil of the blend, wt.%;
- INi = insolubility number of the “i-th” individual crude oil in the blend.
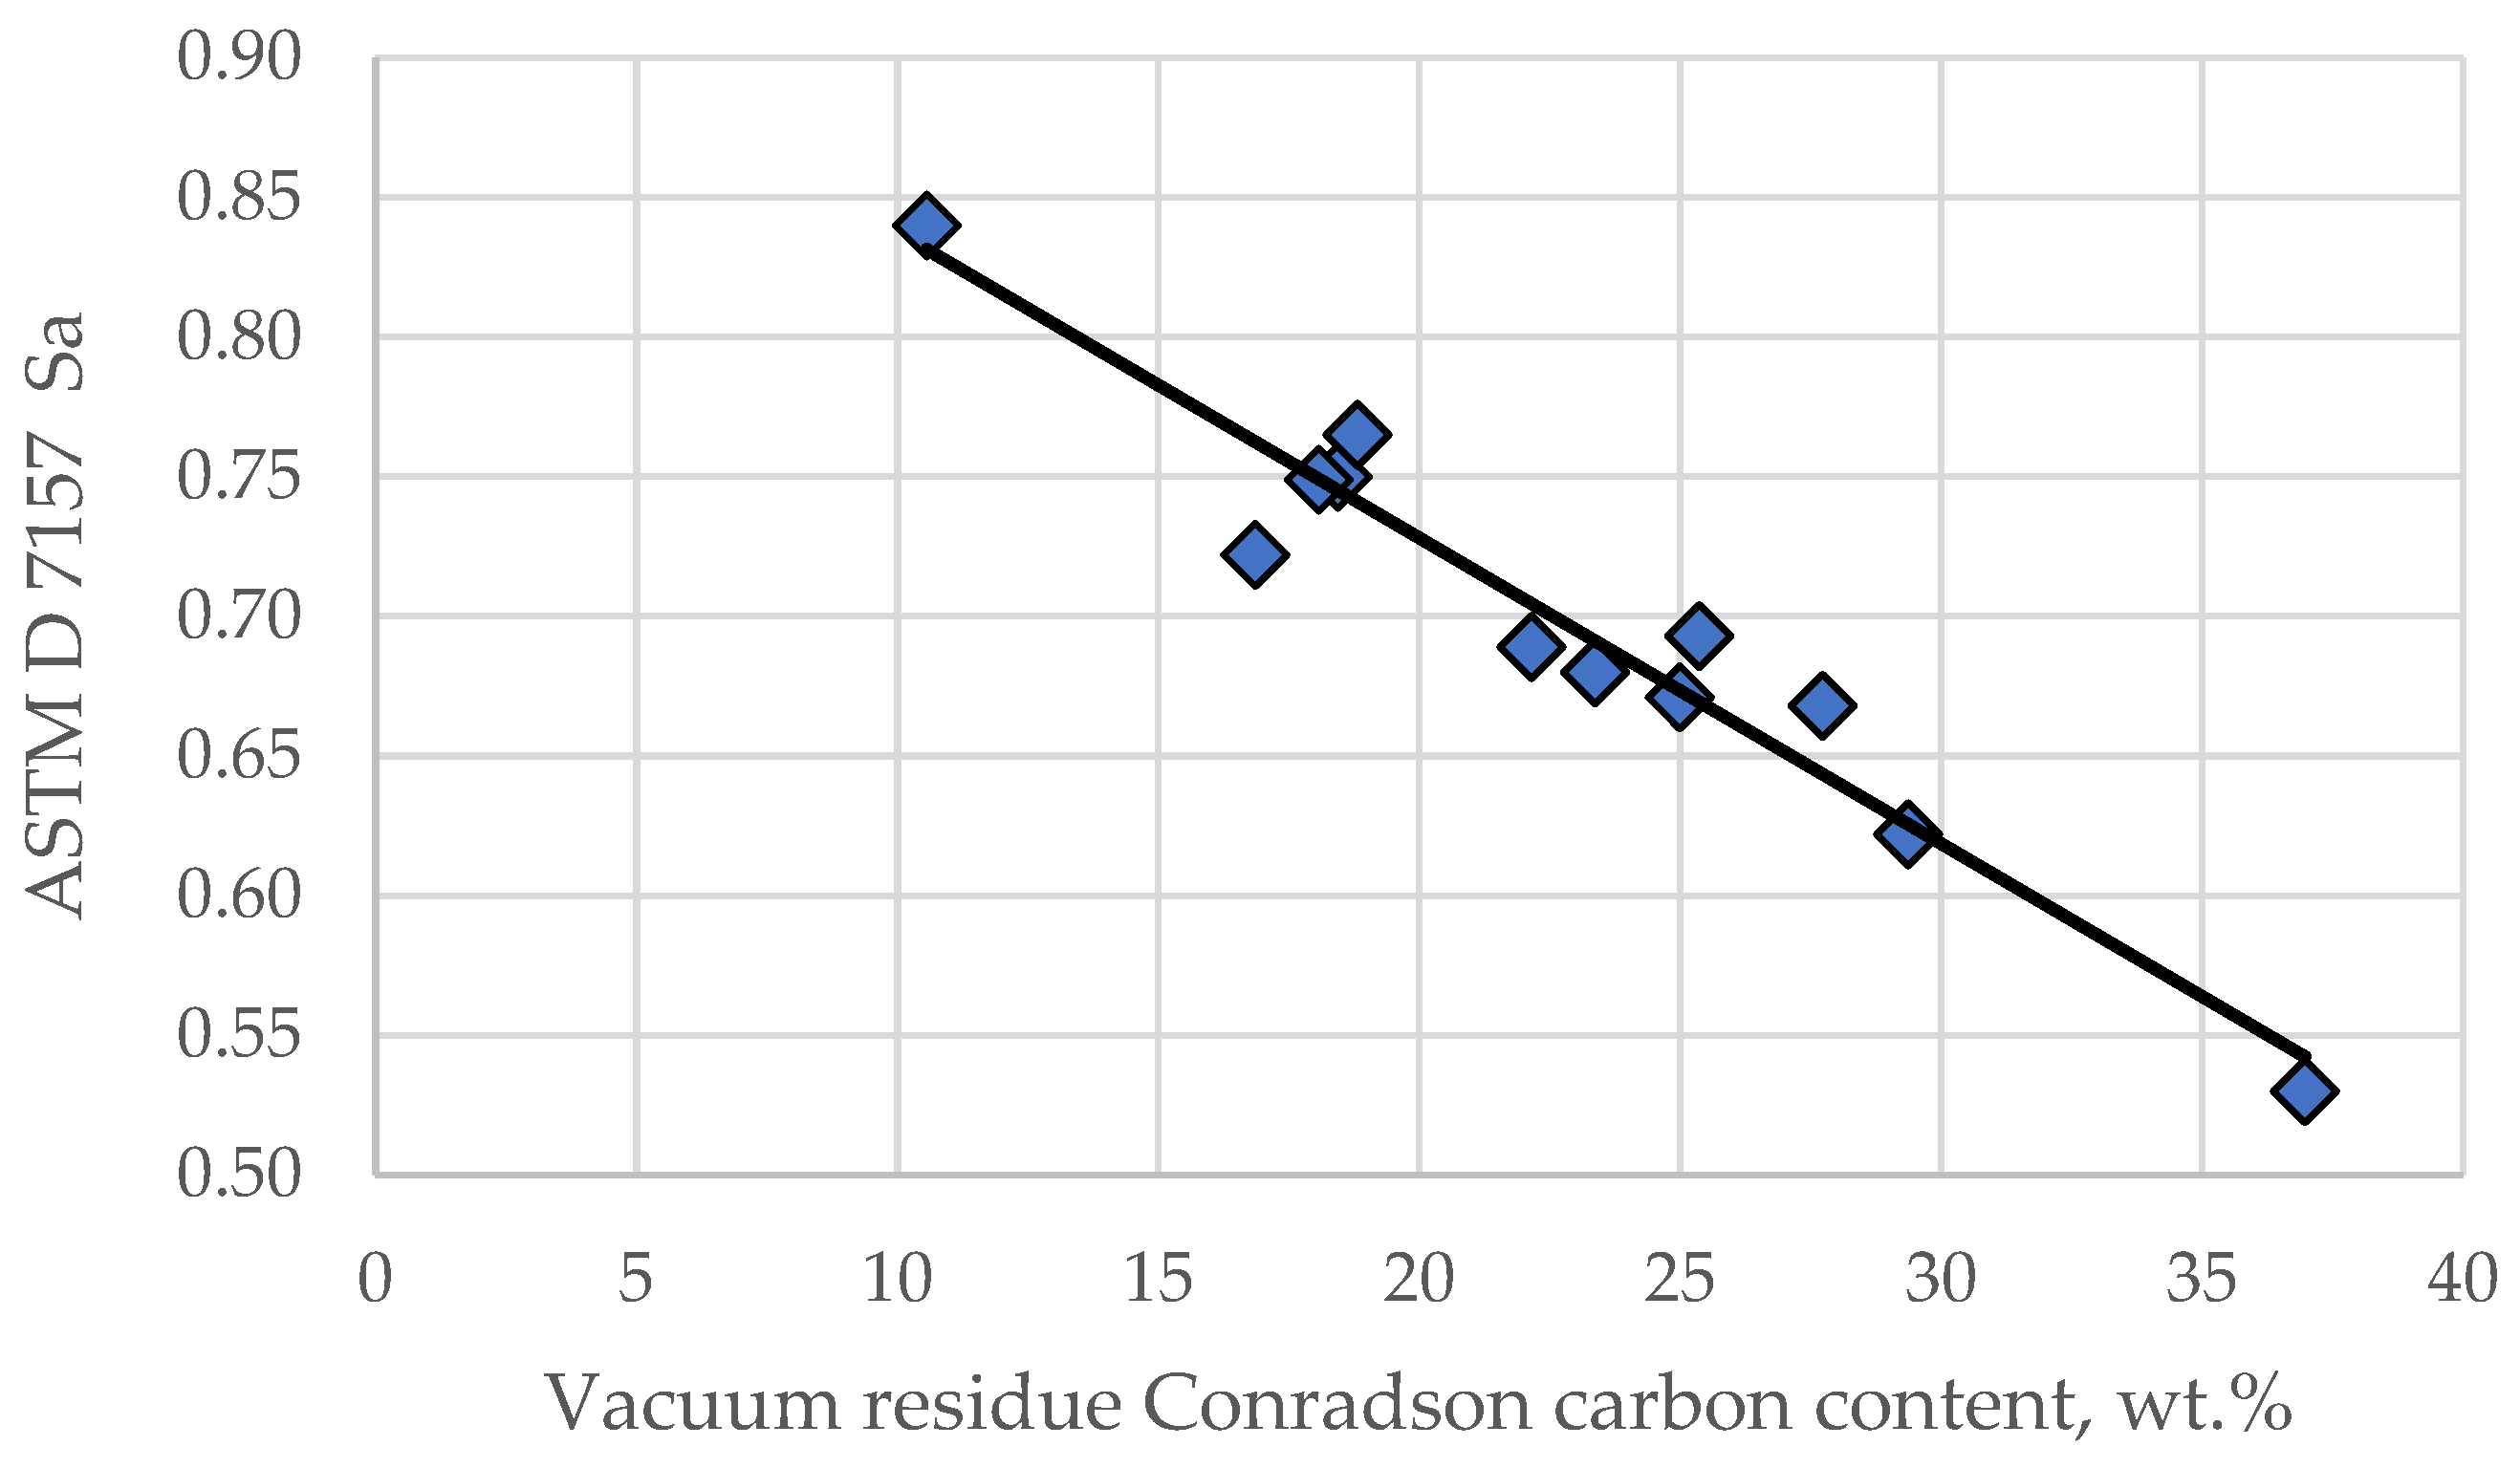
- VR CCR = Concarbon content of petroleum vacuum residue, wt.%;
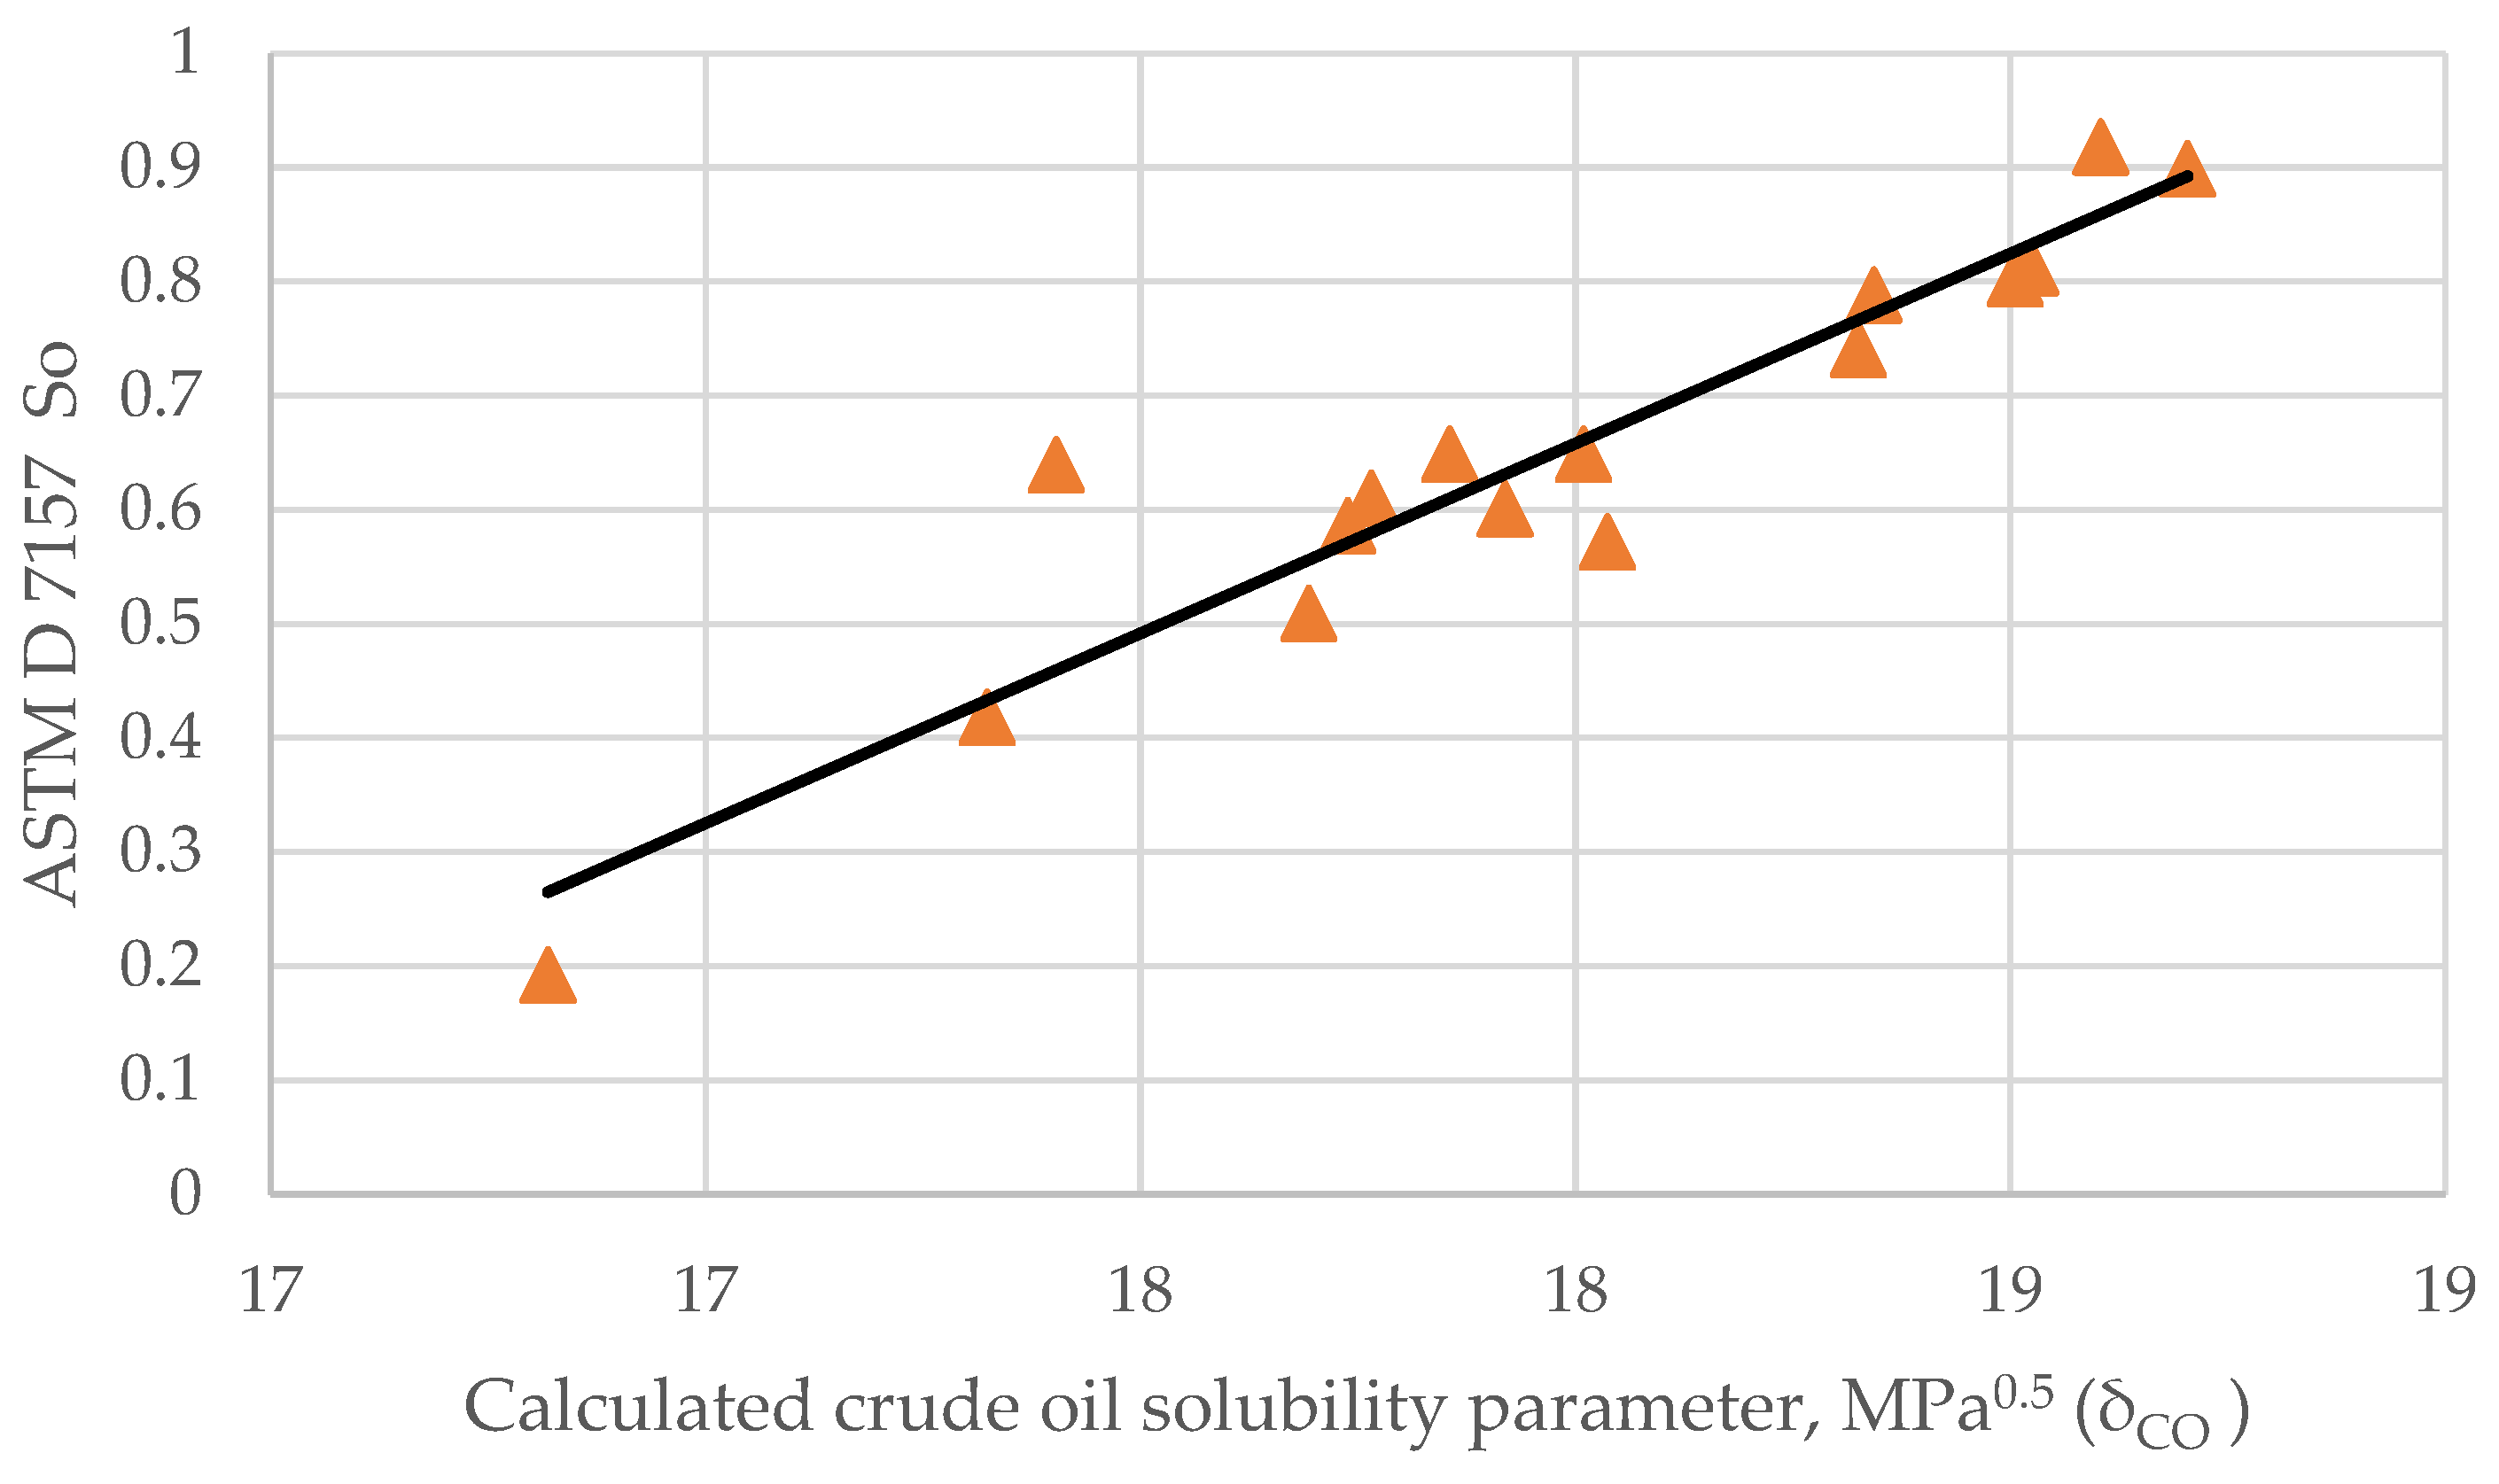
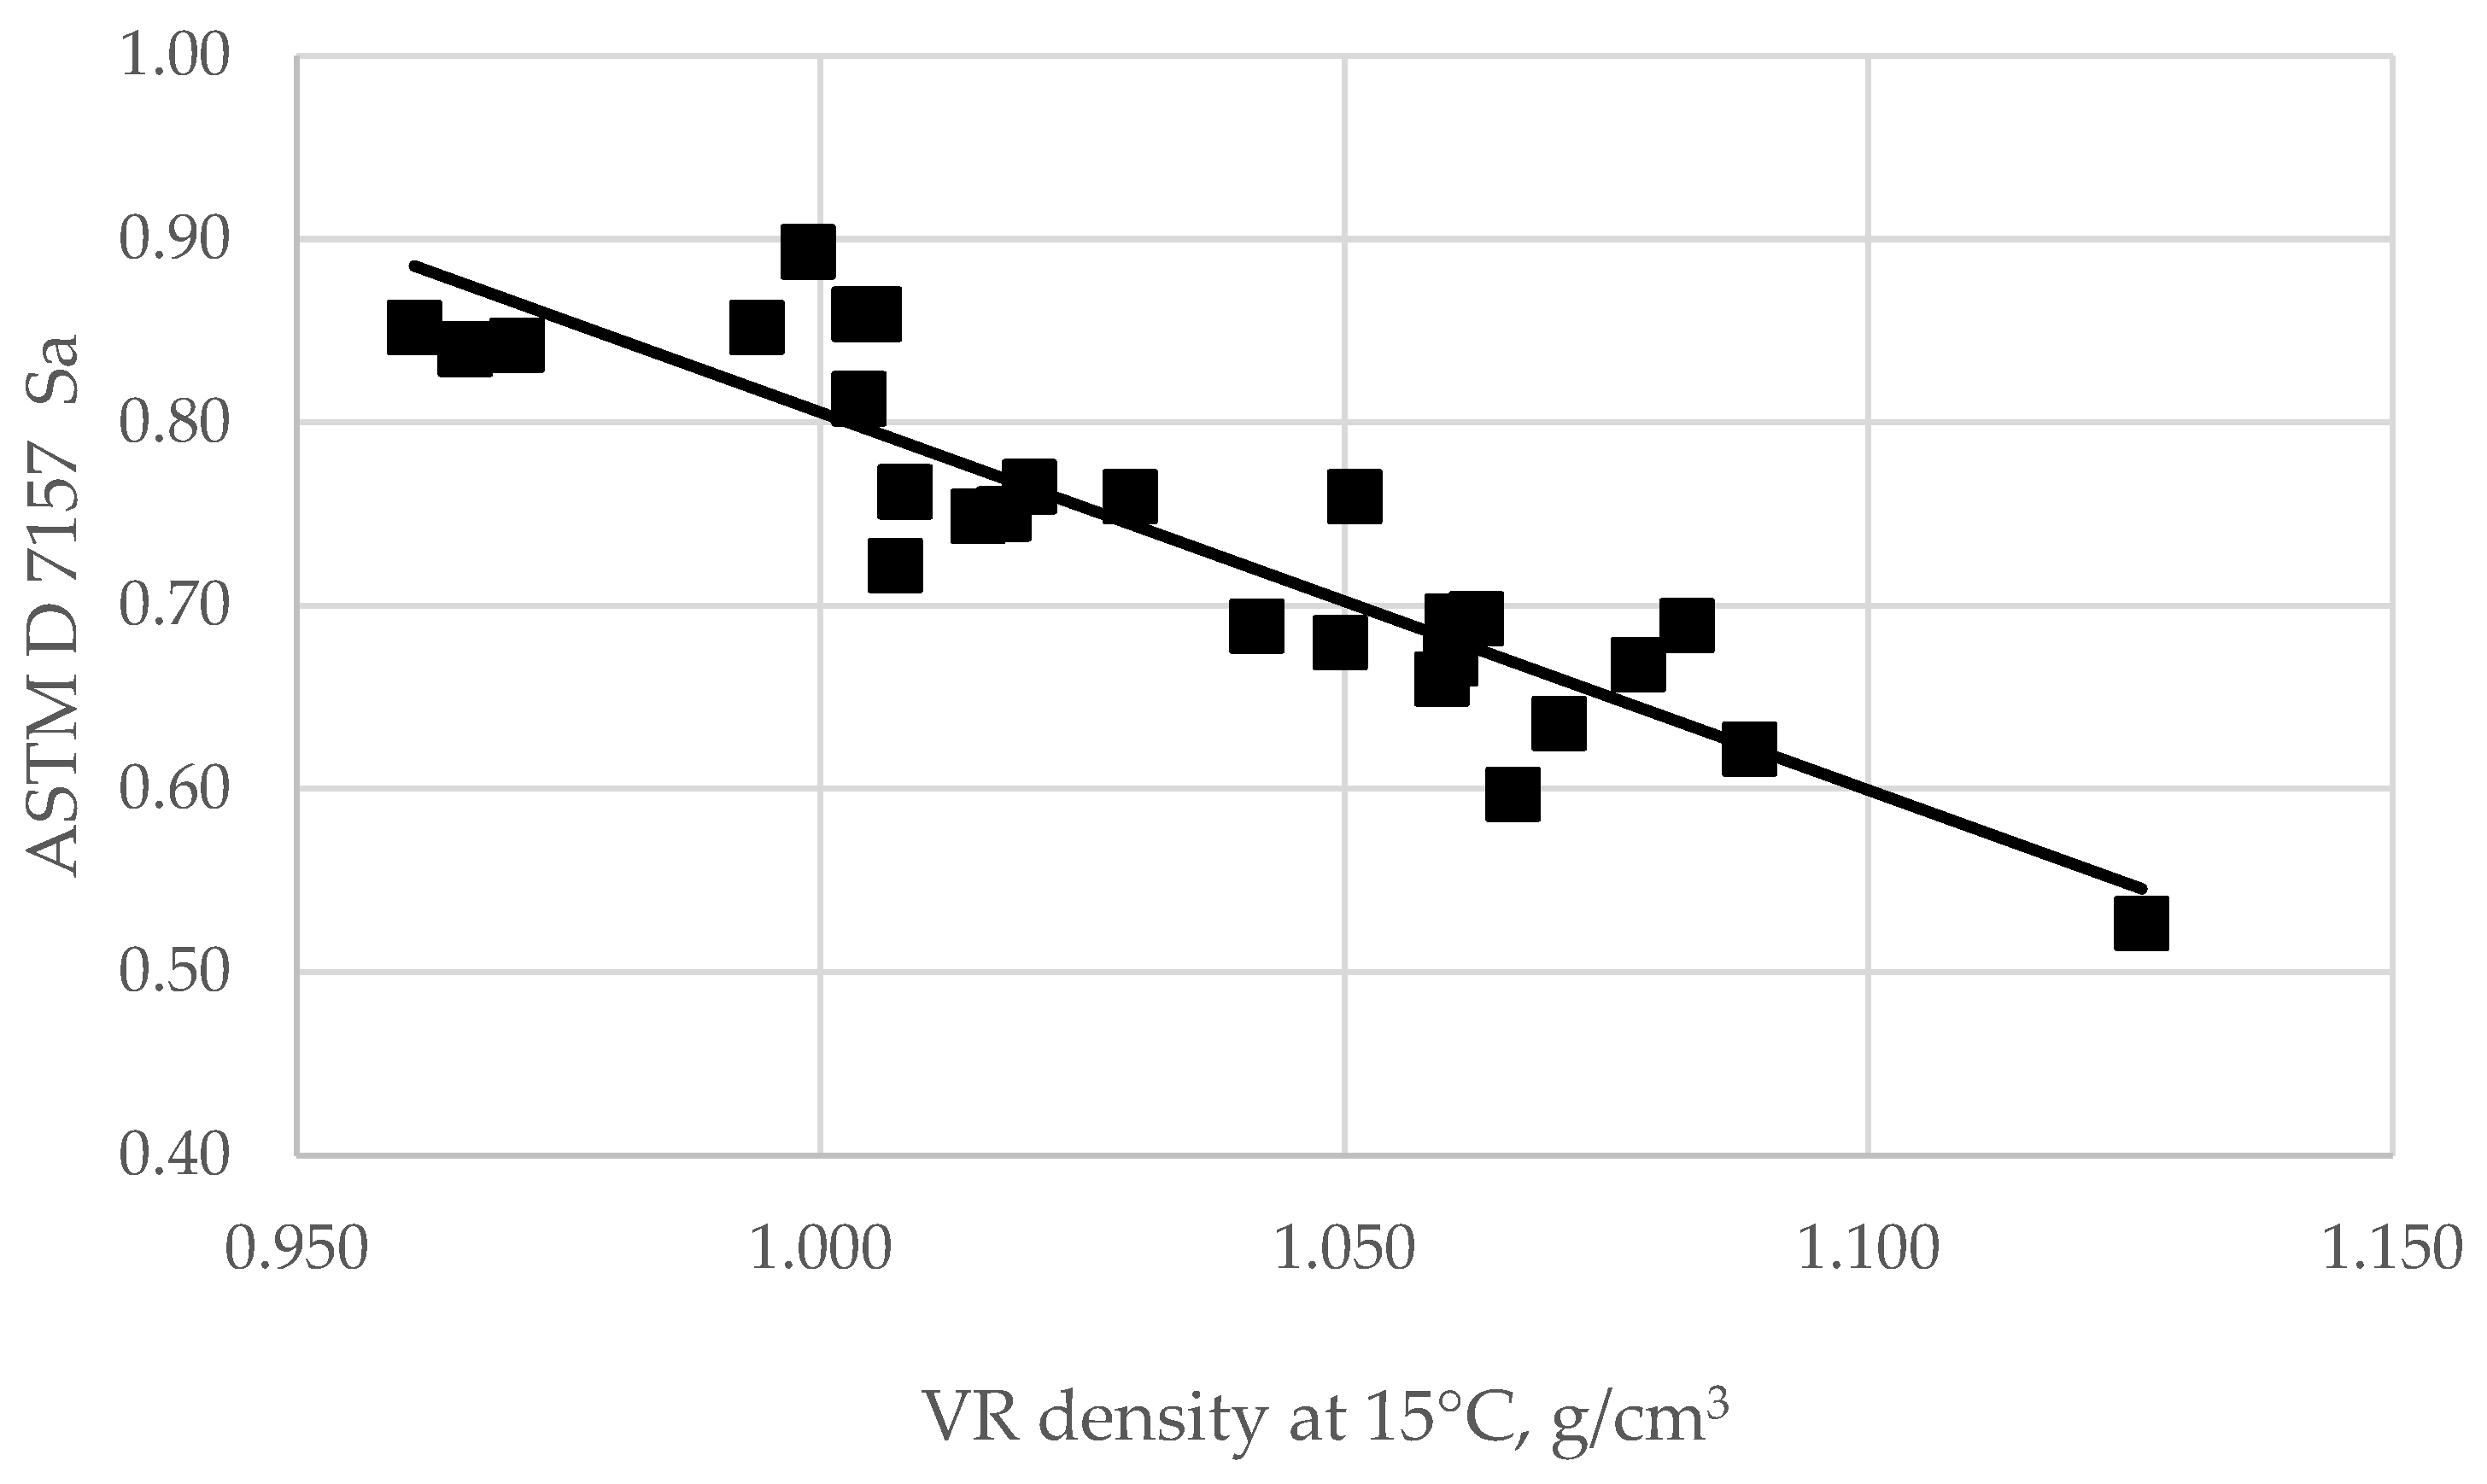
- Sa = the peptizability of an asphaltene according to ASTM D 7157.
- Xnew = Normalized variable (crude desalter amperage, Sa, SBN, IN, IBN, and others);
- X = Actual value of the investigated variable;
- Xmin = The minimal value of the investigated variable;
- Xmax = The maximal value of the investigated variable.
3. Results and Discussion
3.1. Compatibility Indices of Individual Crude Oils and Their Mixtures
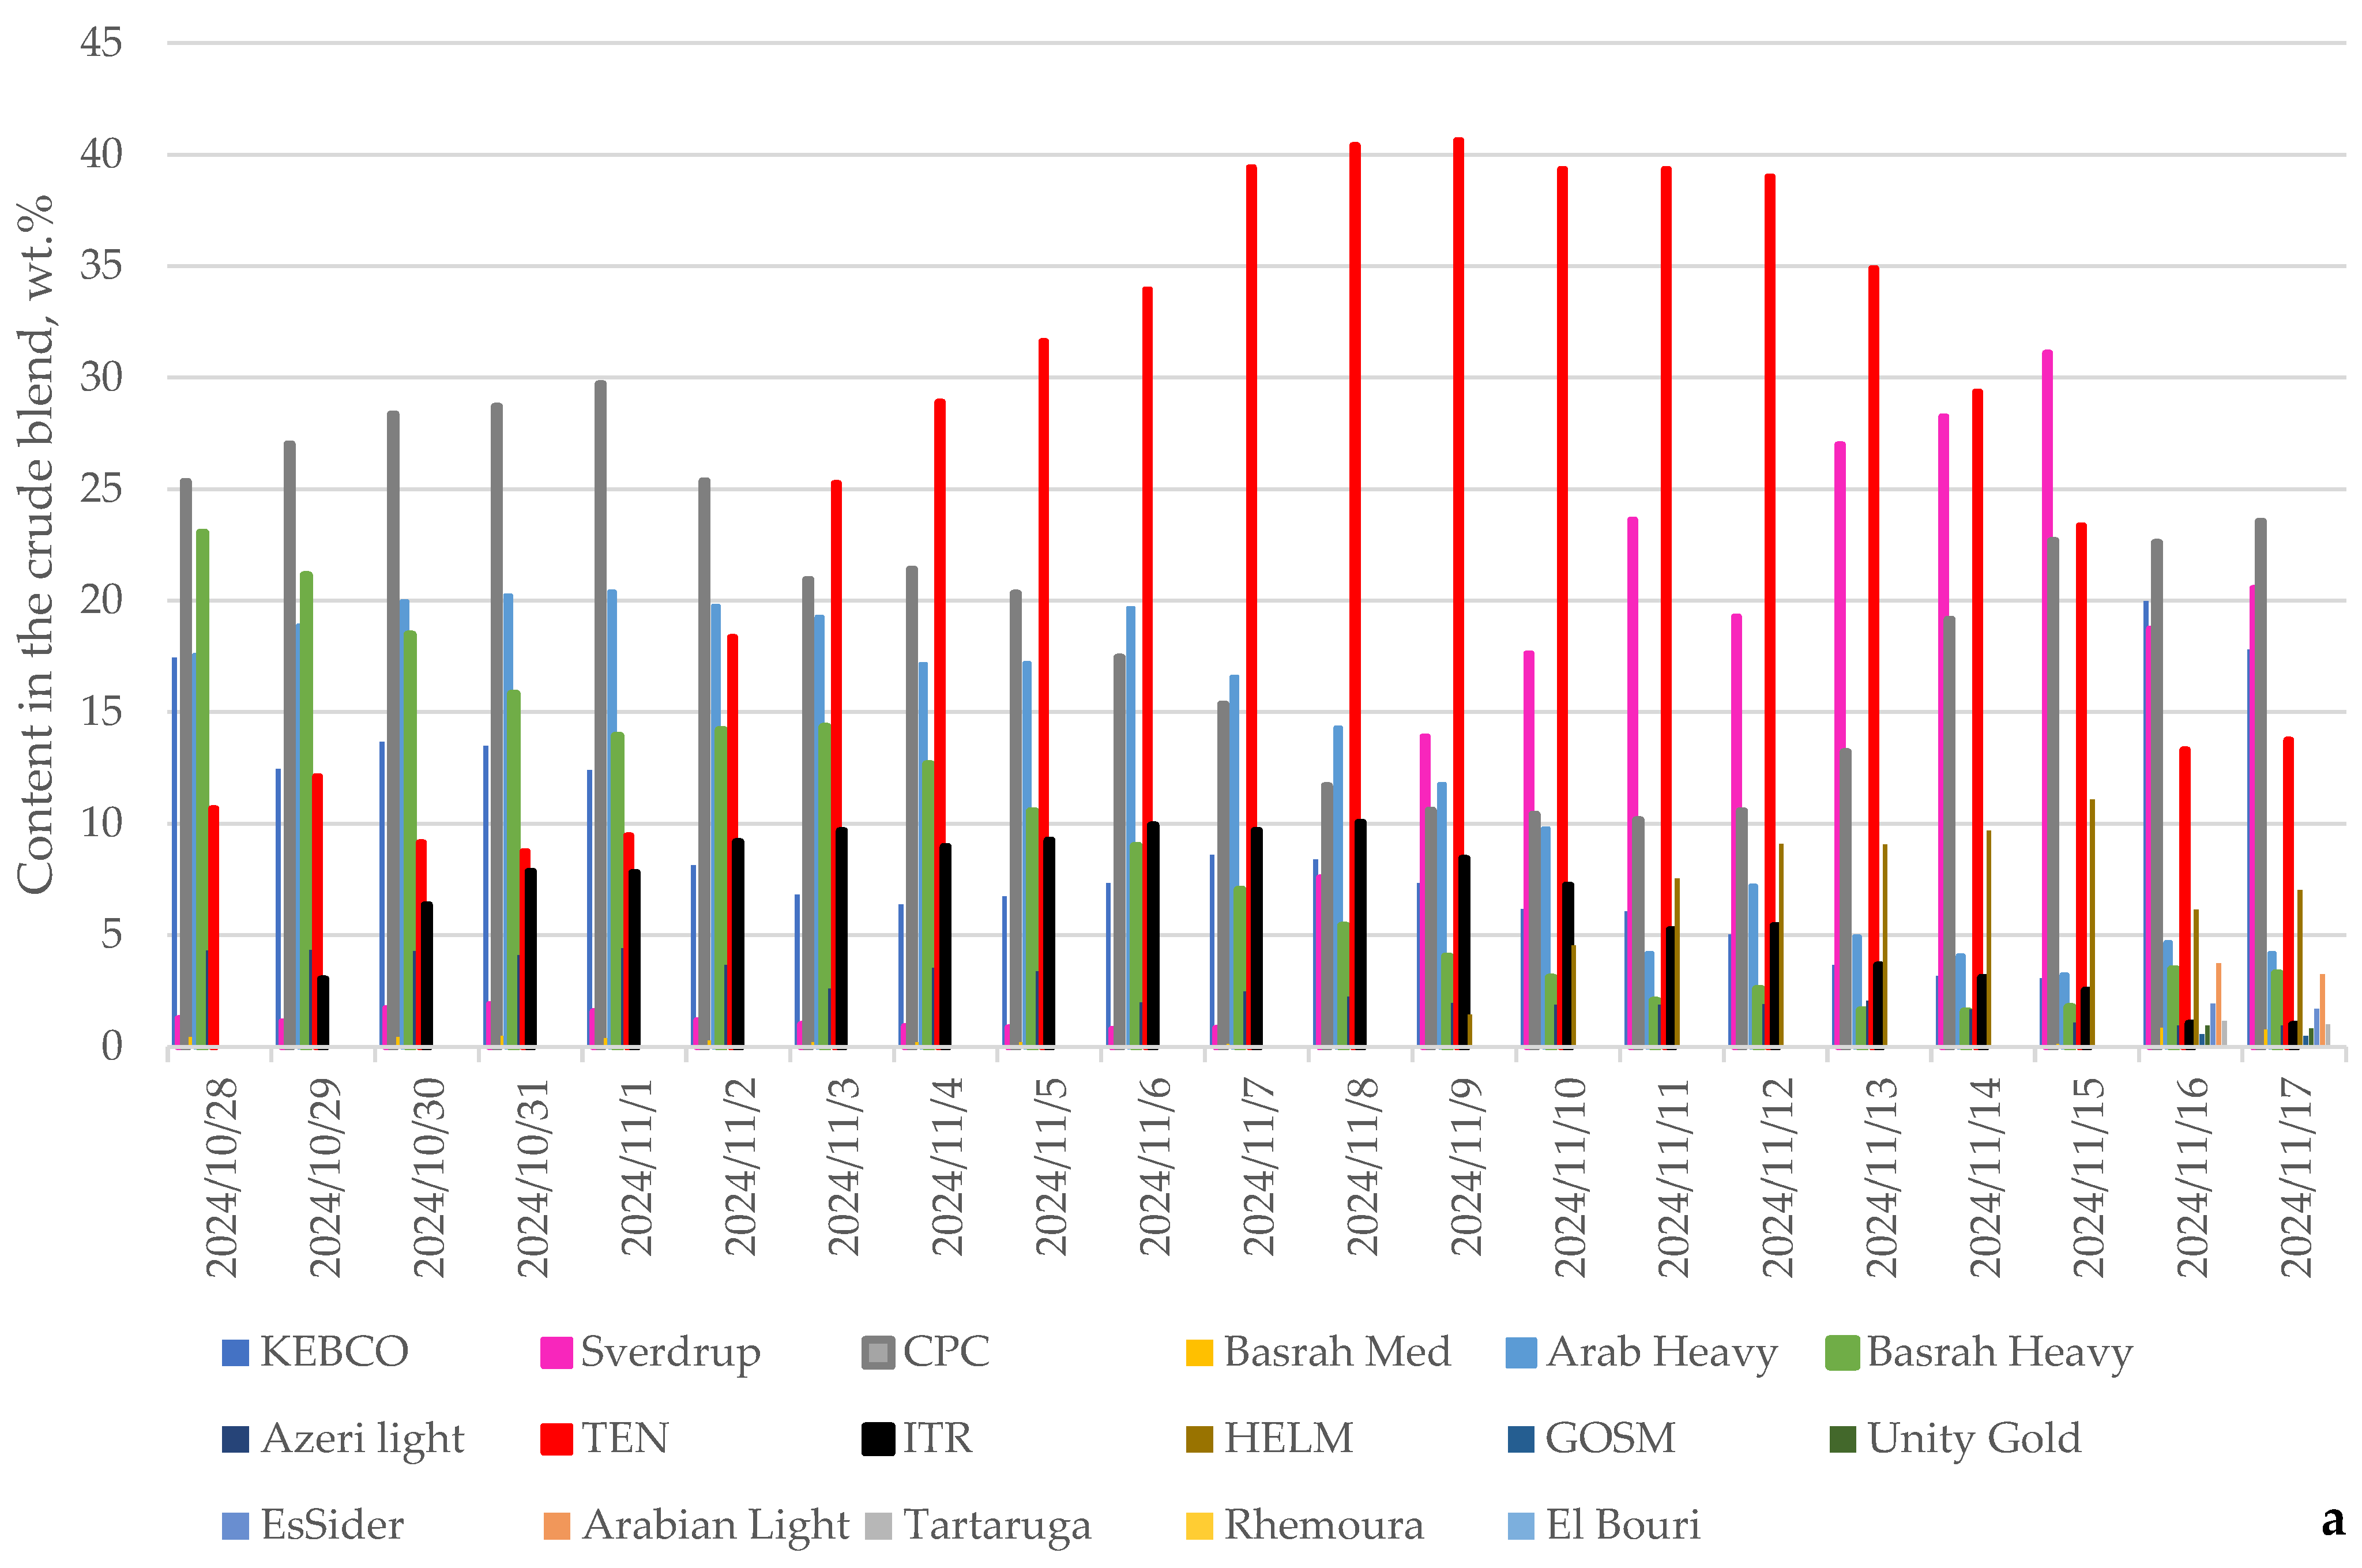
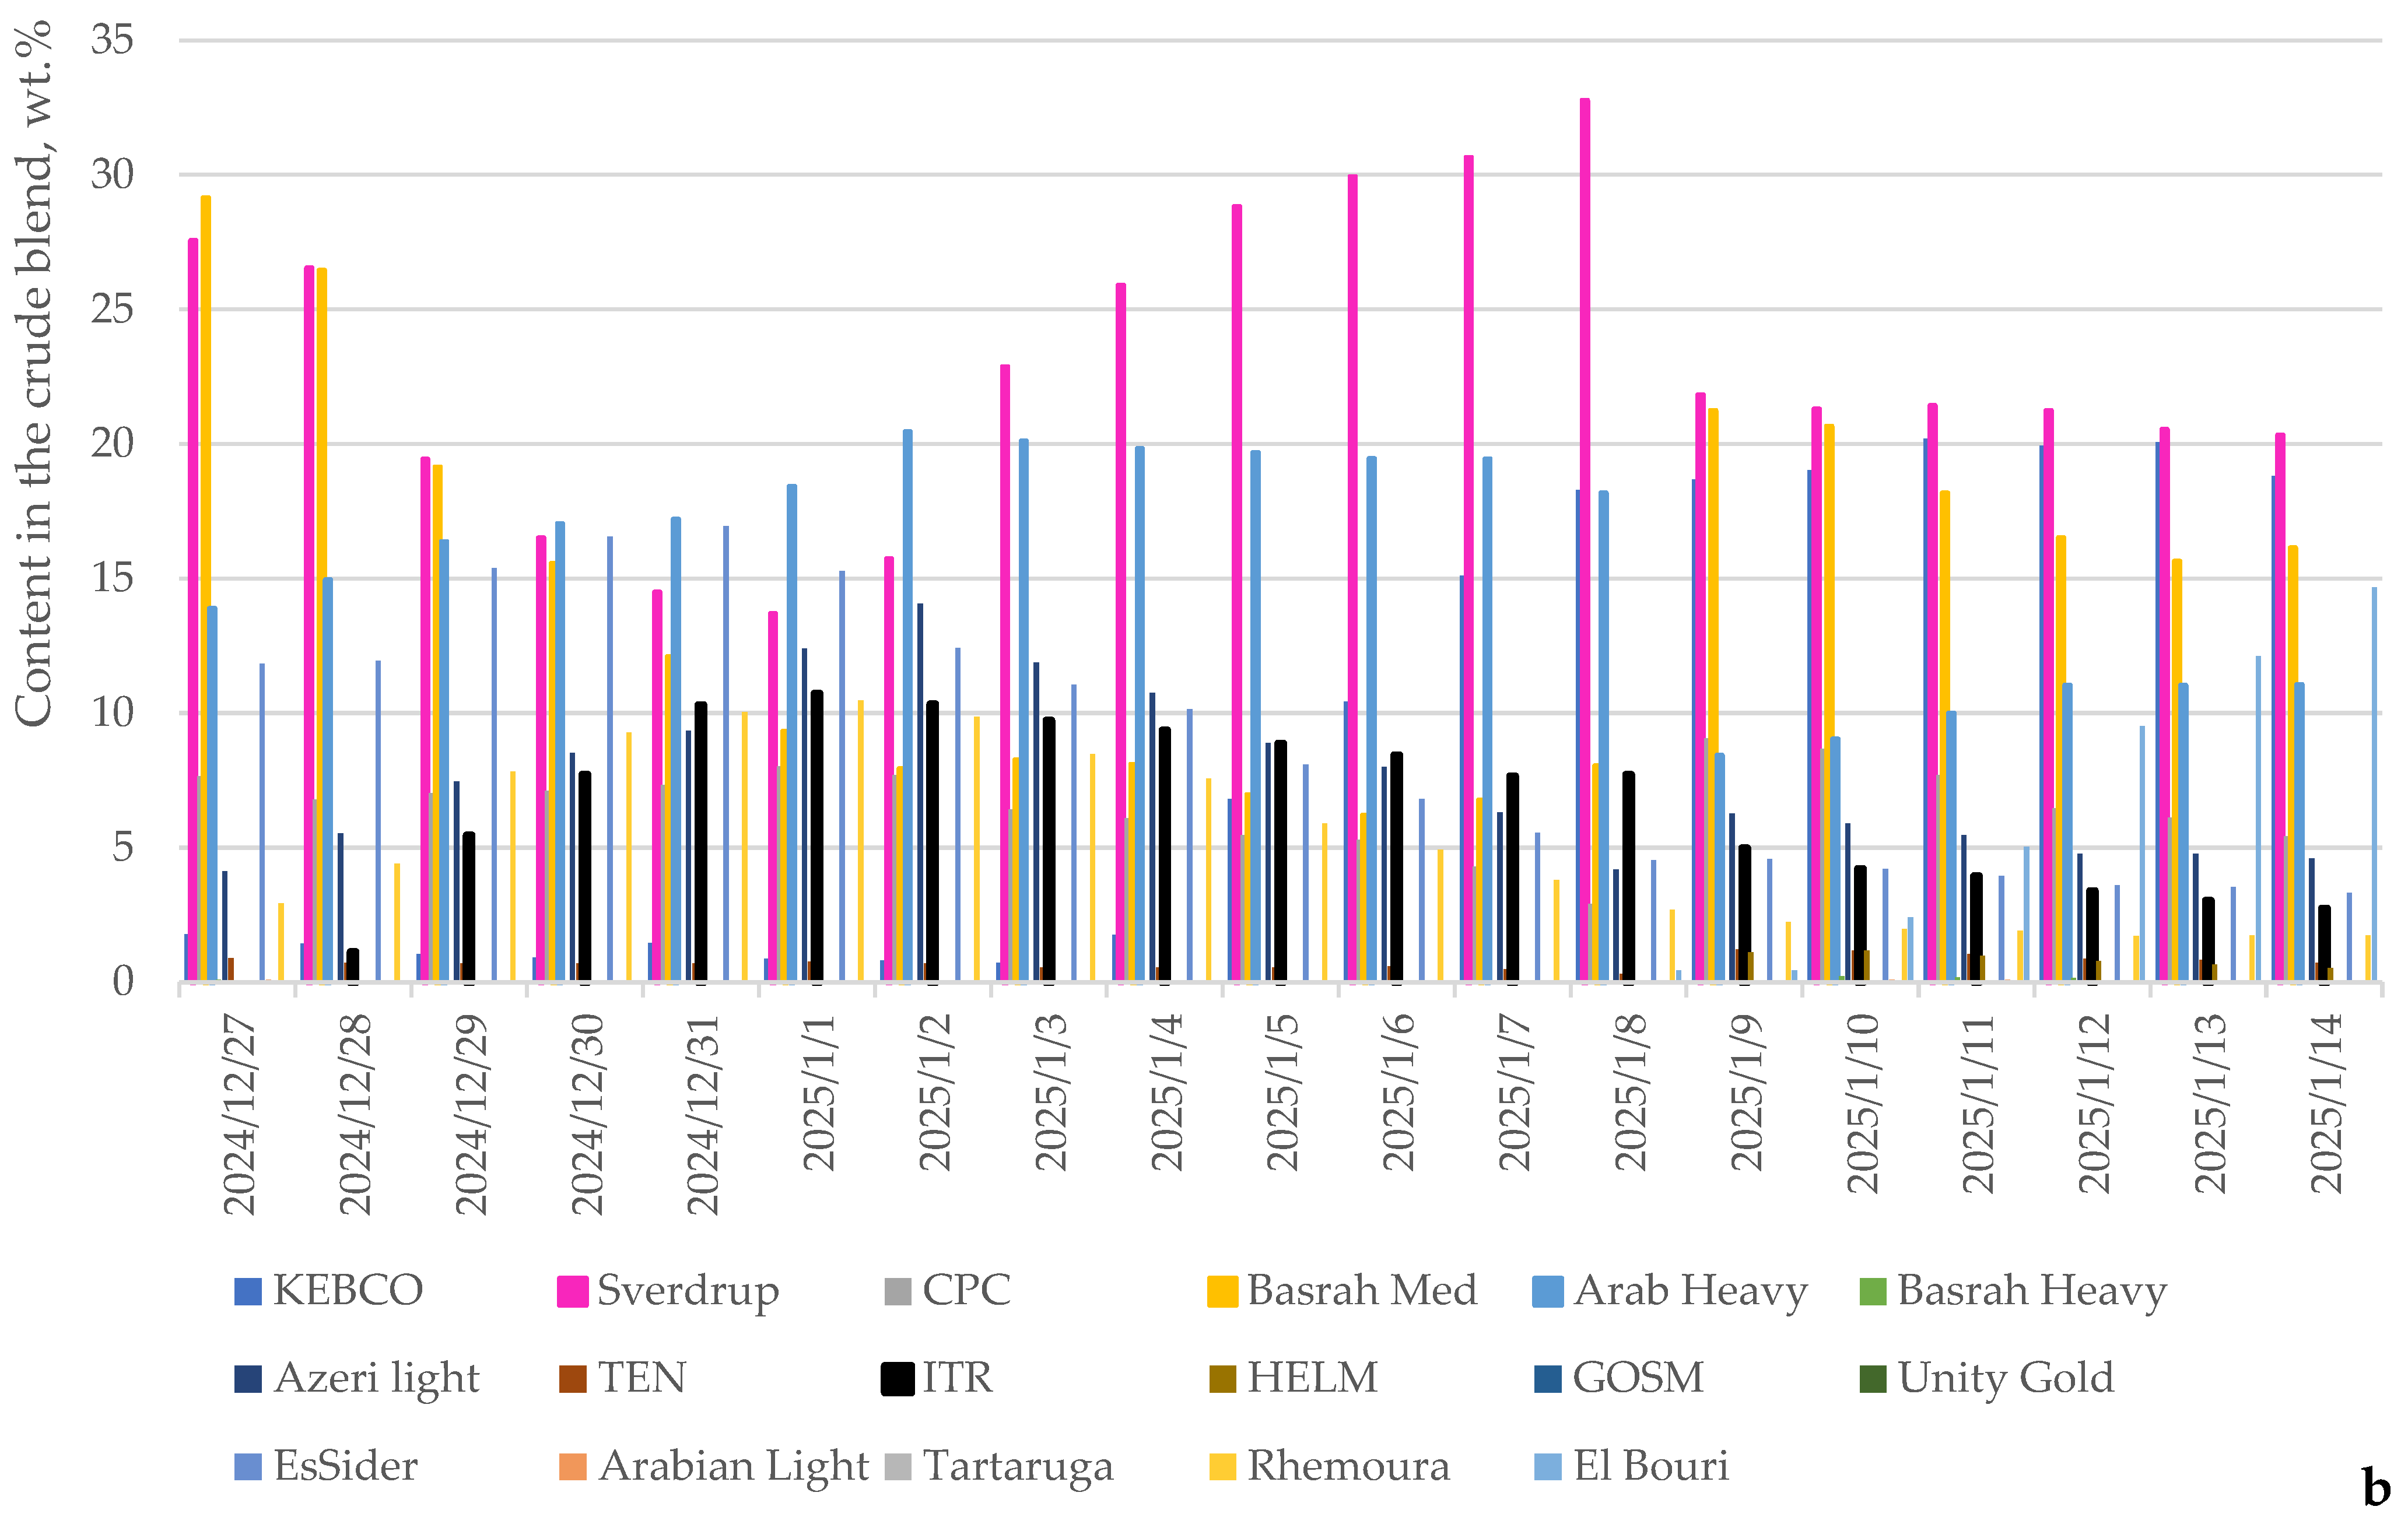
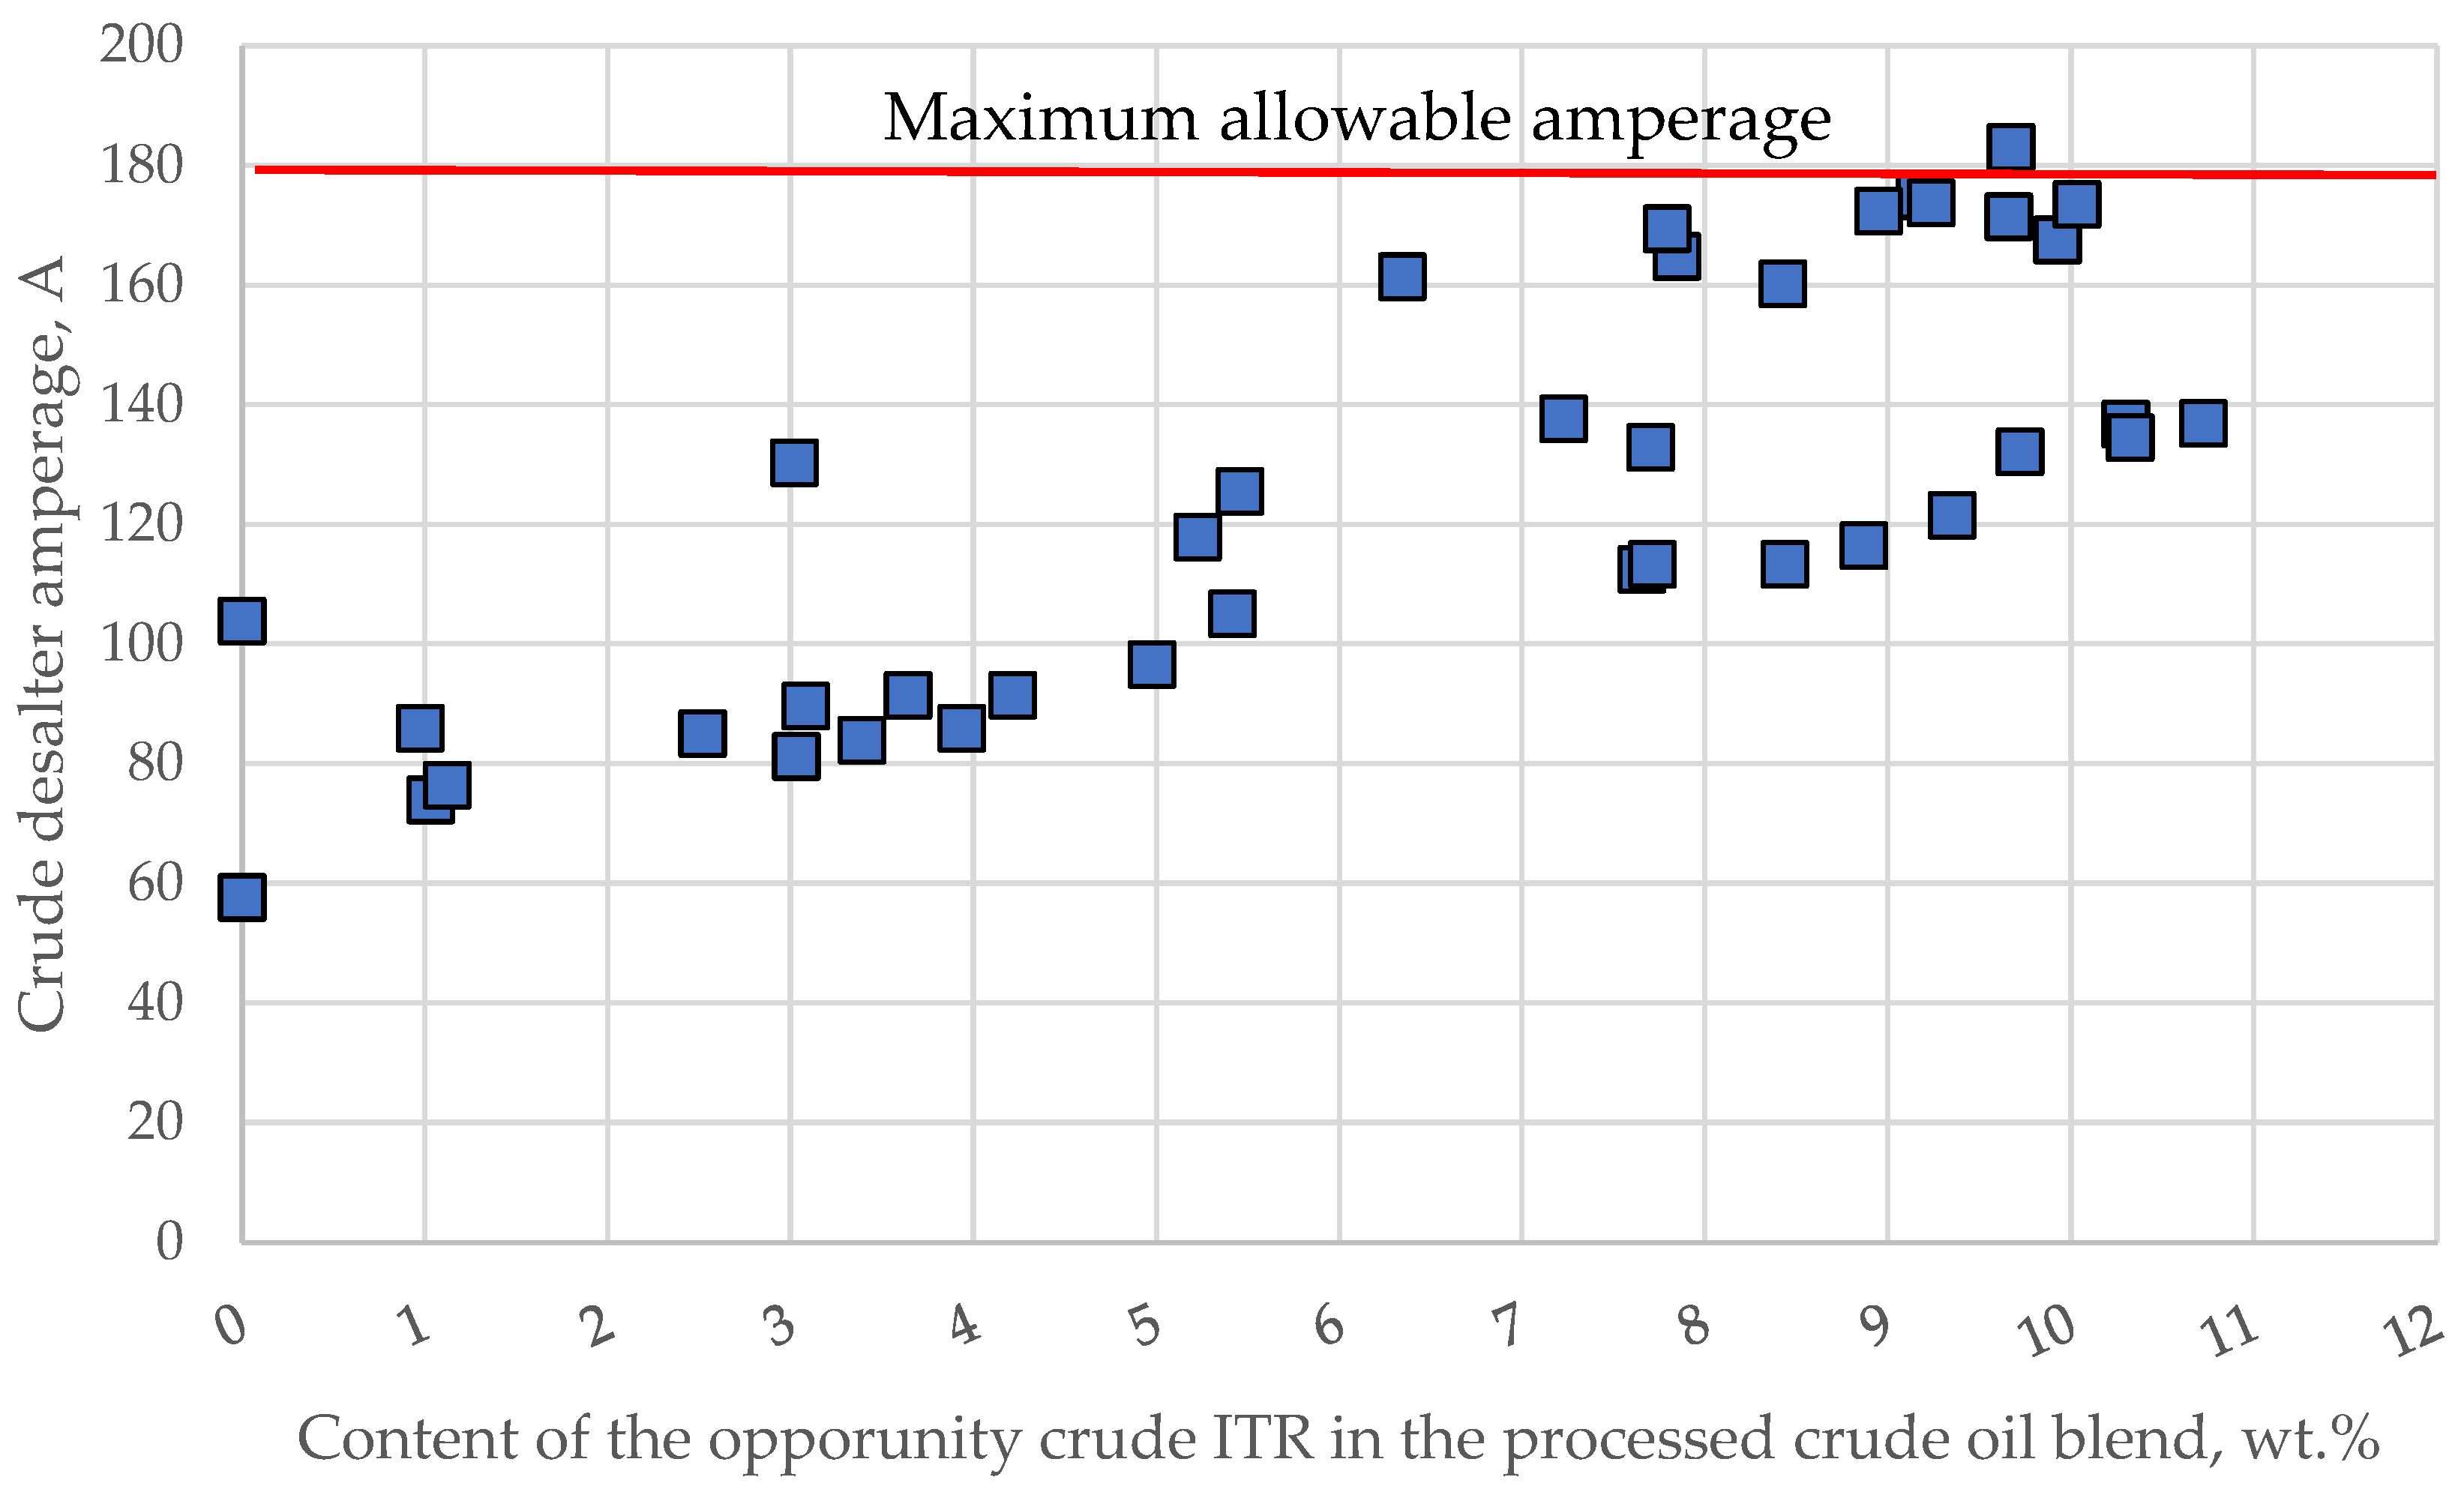
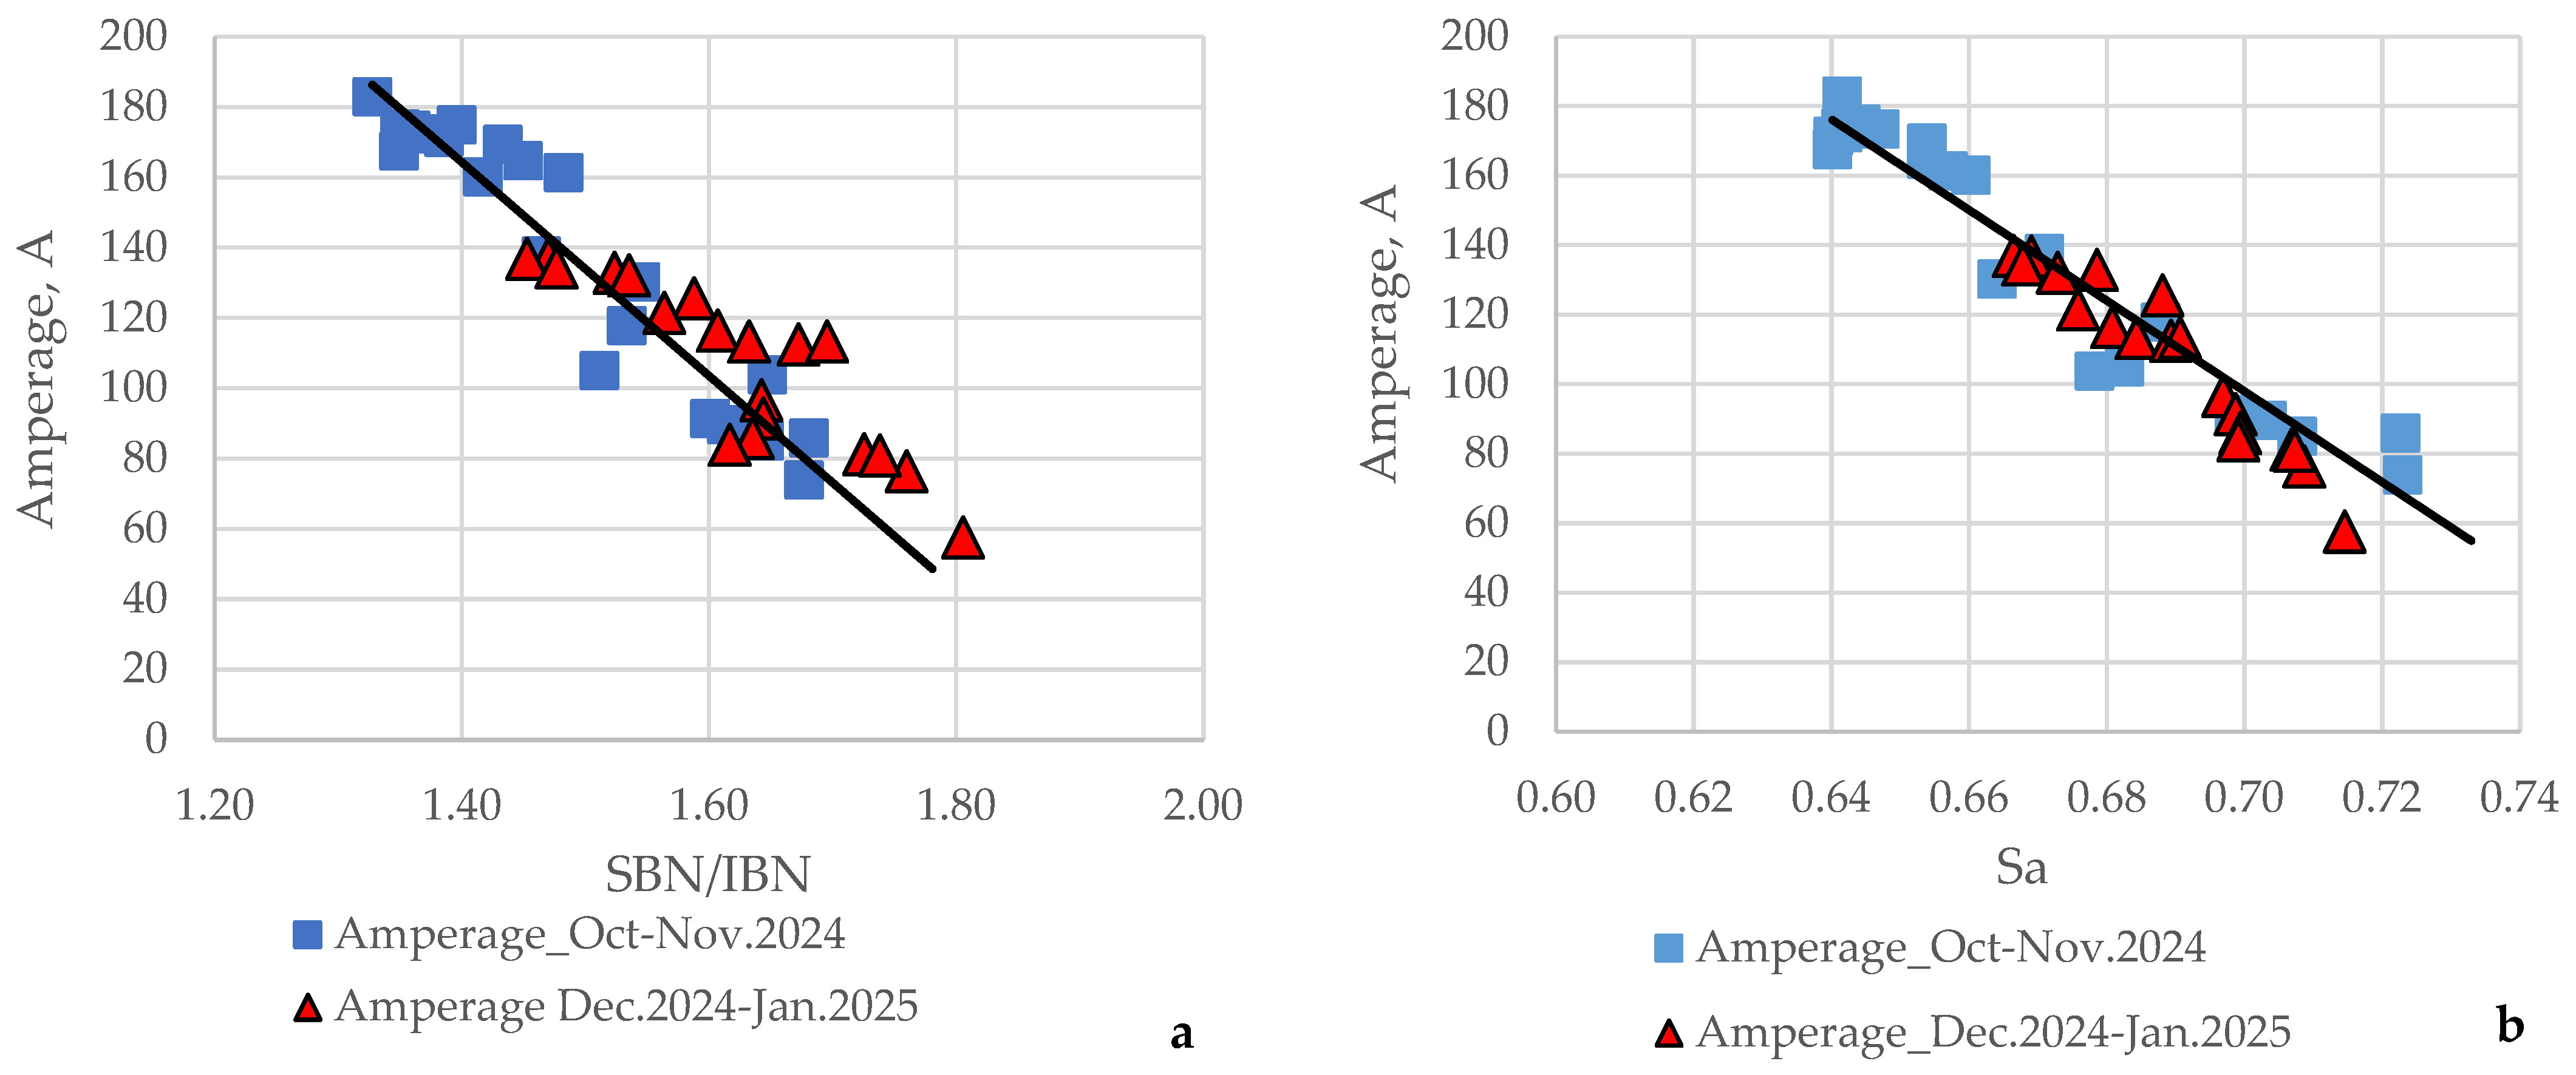
3.2. Commercial Crude Desalting and Dewatering Unit Amperage Varaiation and Its Relation to the Compatibility Indices
- DSA = crude desalter amperage, A;
- = ratio calculated by using Equations (2) and (3), and the data for SBN, and IN of individual crude oils shown in Table 4, and the content of individual crude oils in the processed mixture;
- = asphaltene peptizability calculated by Equation (4);
- = ratio calculated by using Equations (2) and (3), and the data for Sp and Sp critical of the individual crude oils shown in Table 4, and the content of the individual crude oils in the processed mixture.
- = solubility parameter of the crude oil, MPa 0.5;
- d = crude oil density at 15 °C, g/cm3.
- Sa* = asphaltene peptizability calculated by Equation (11).
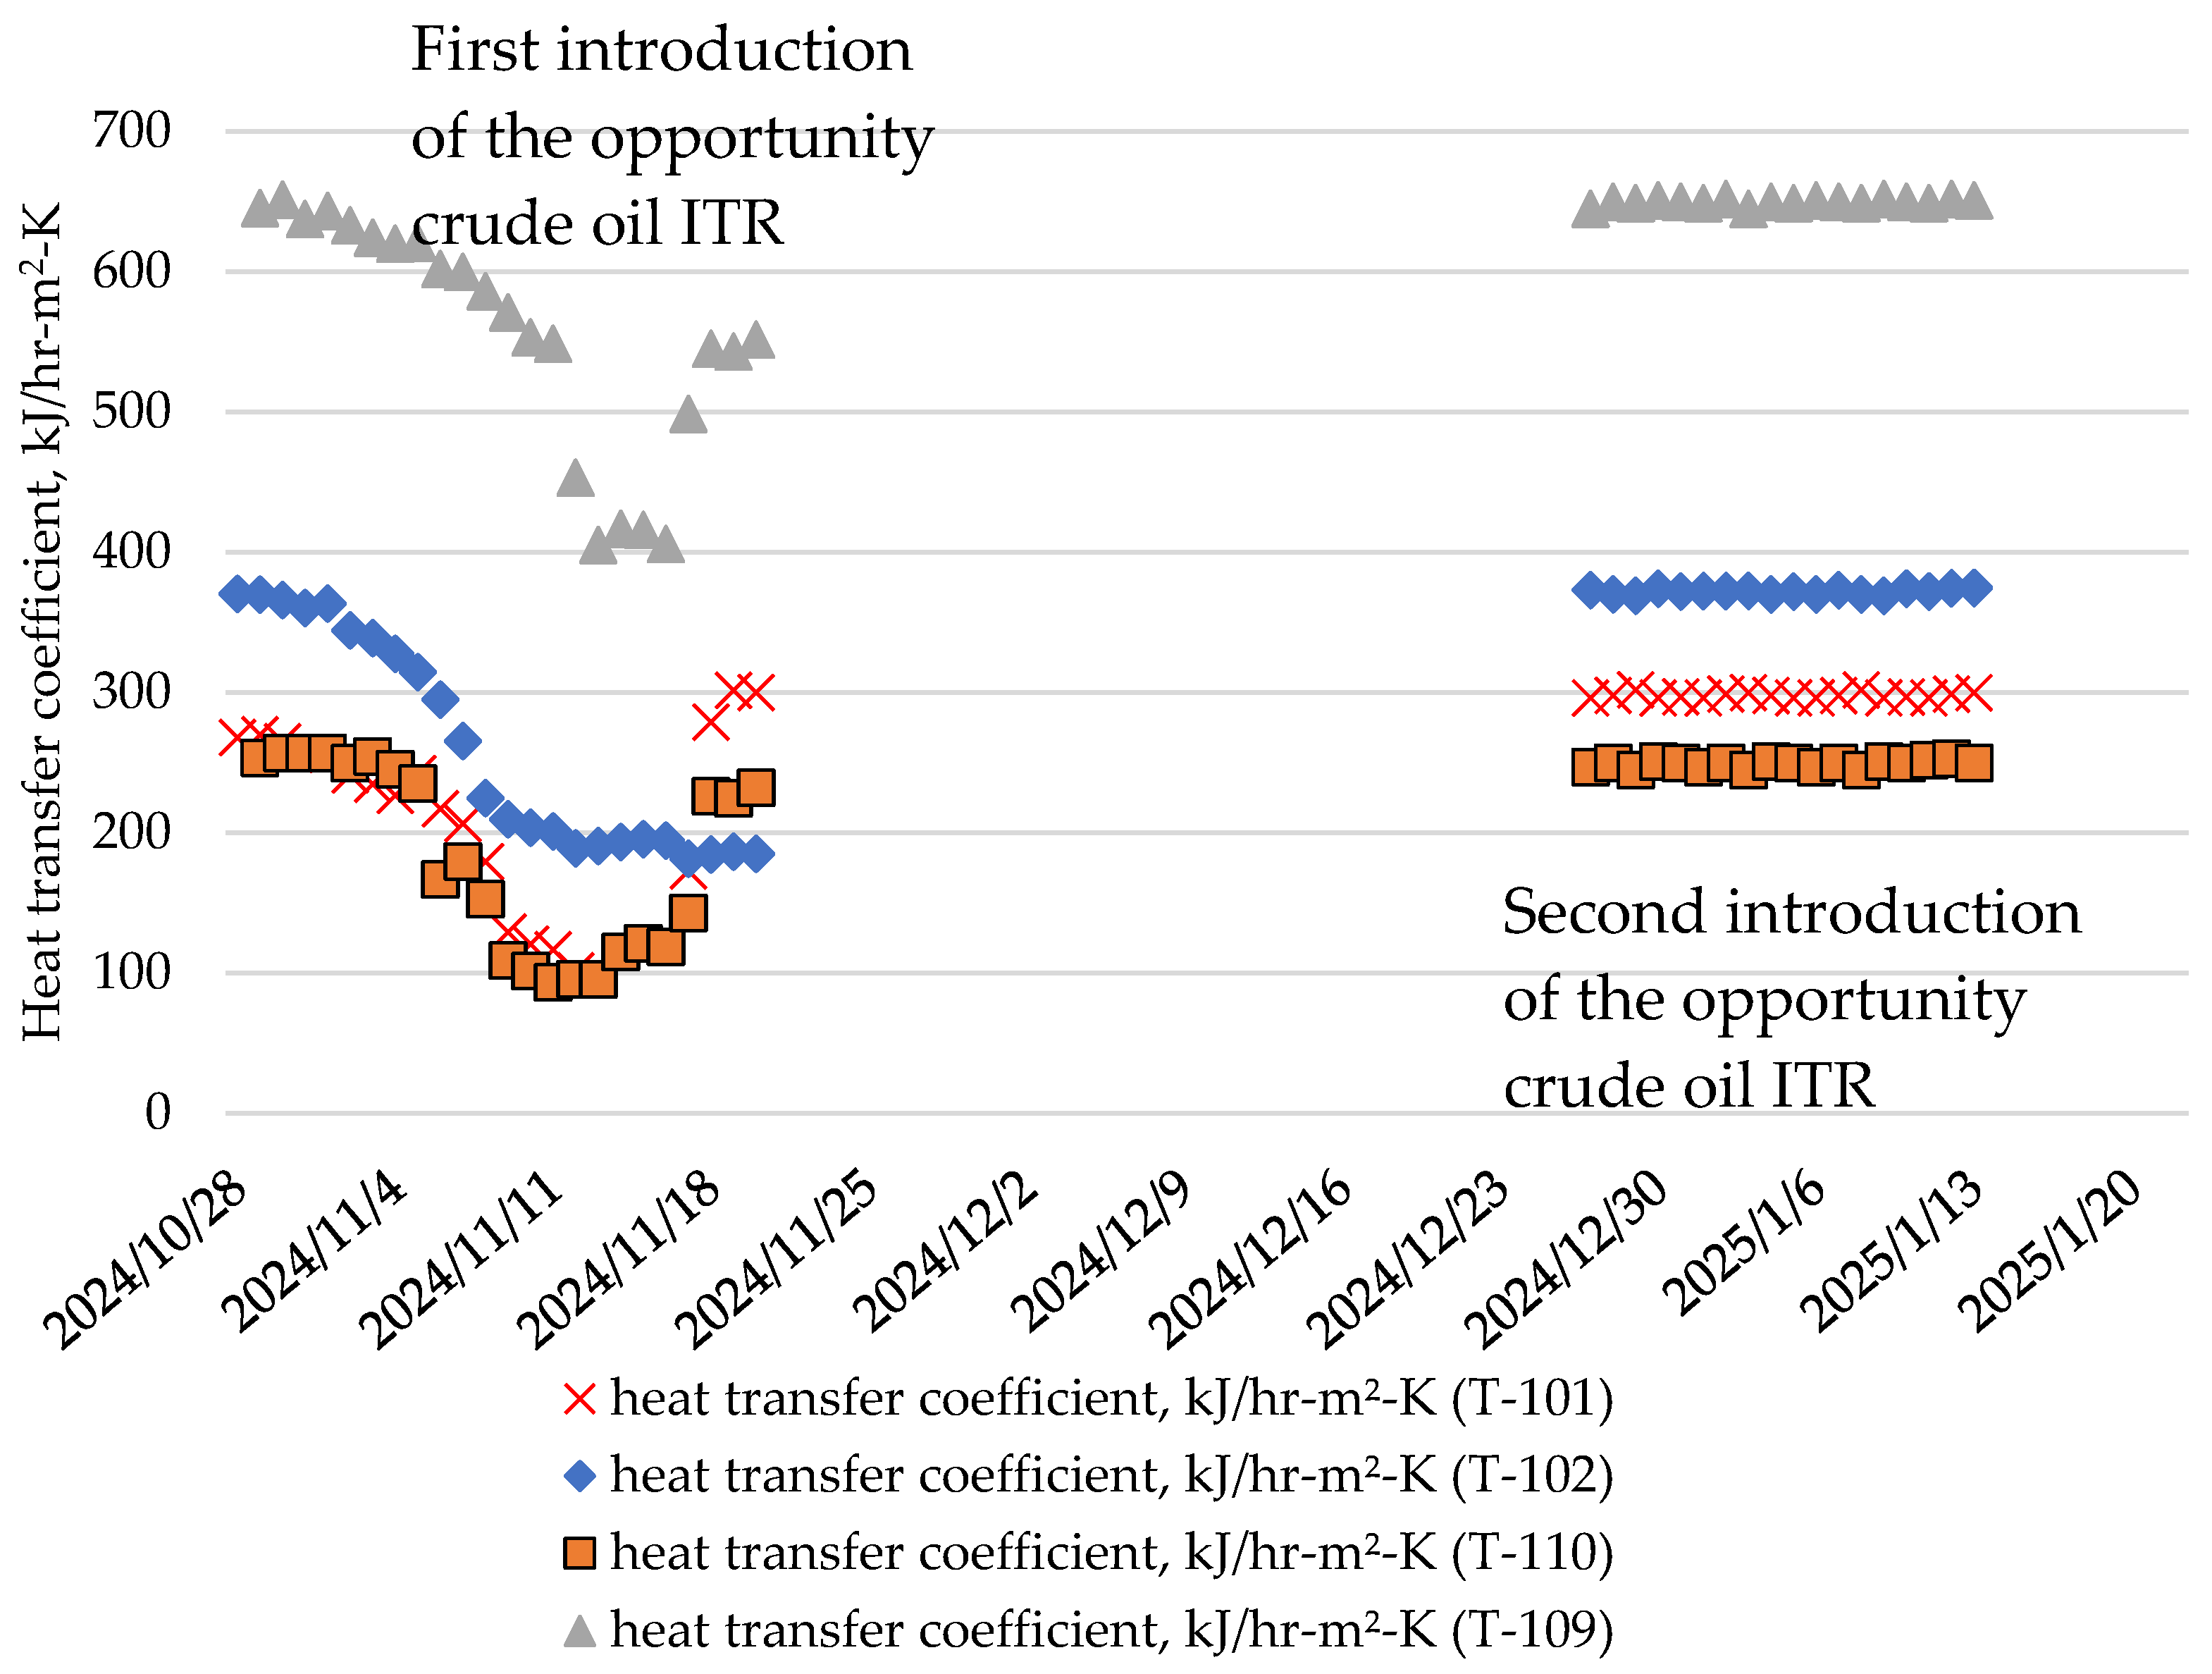
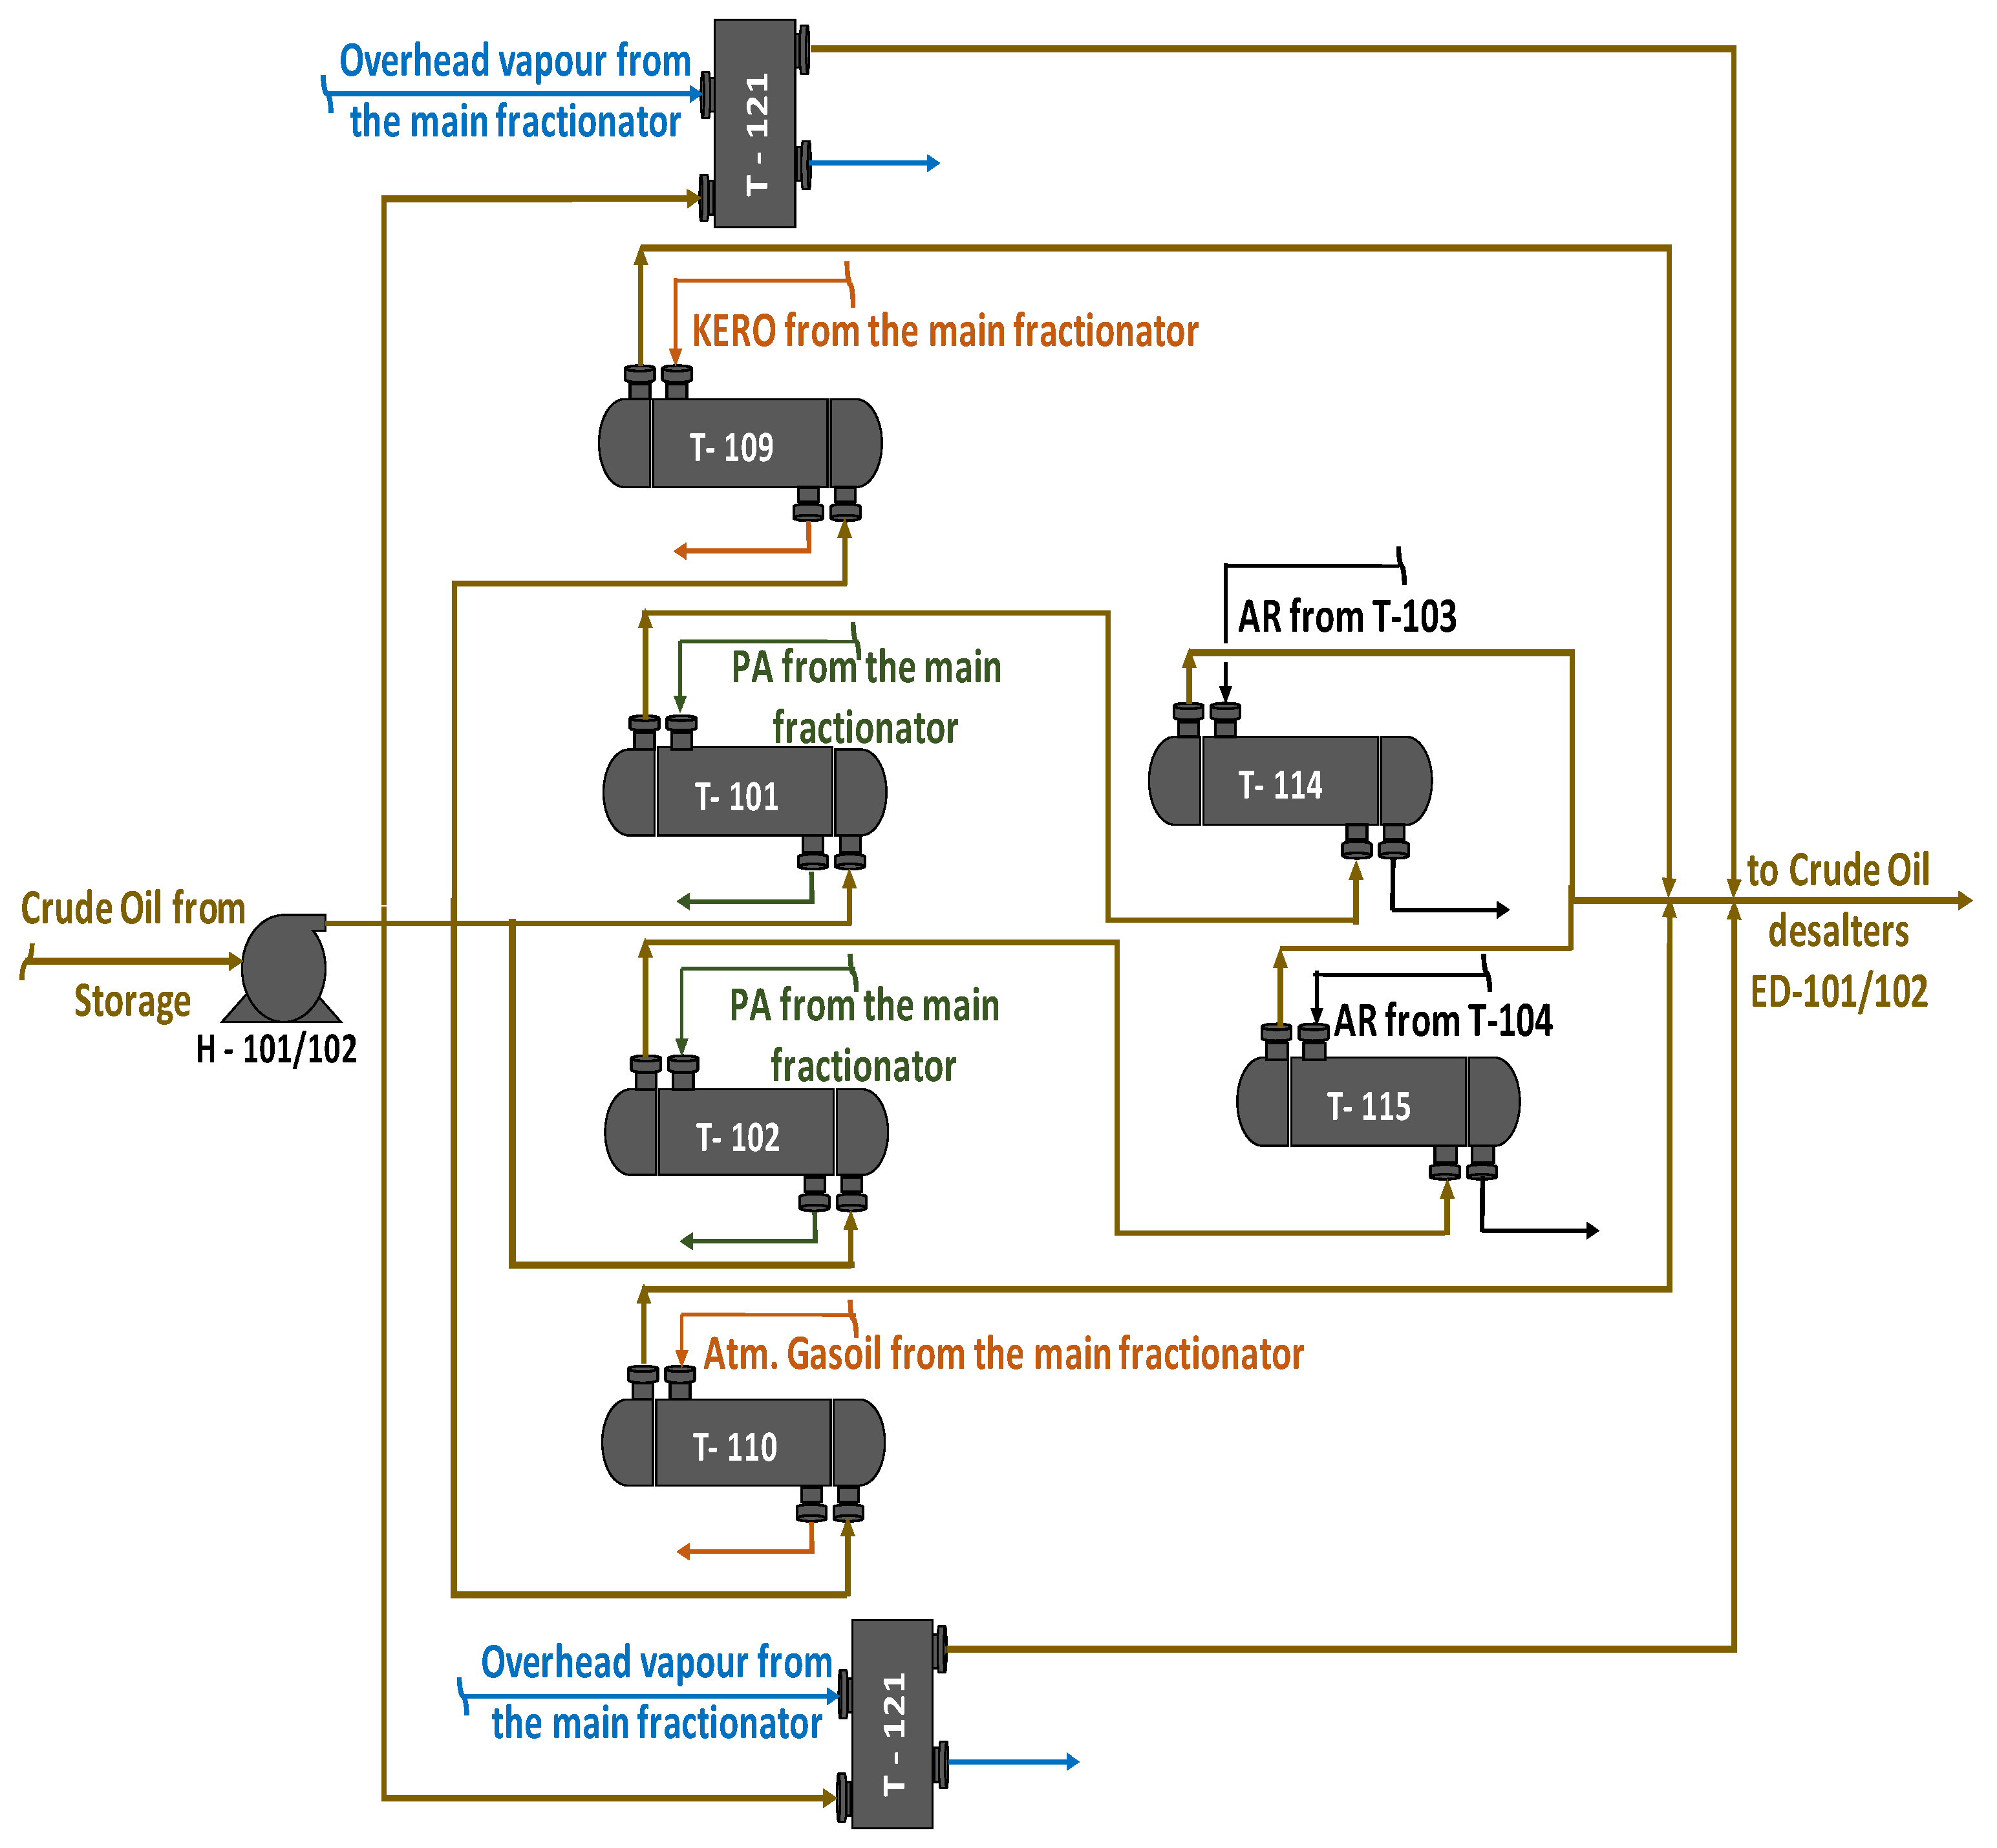
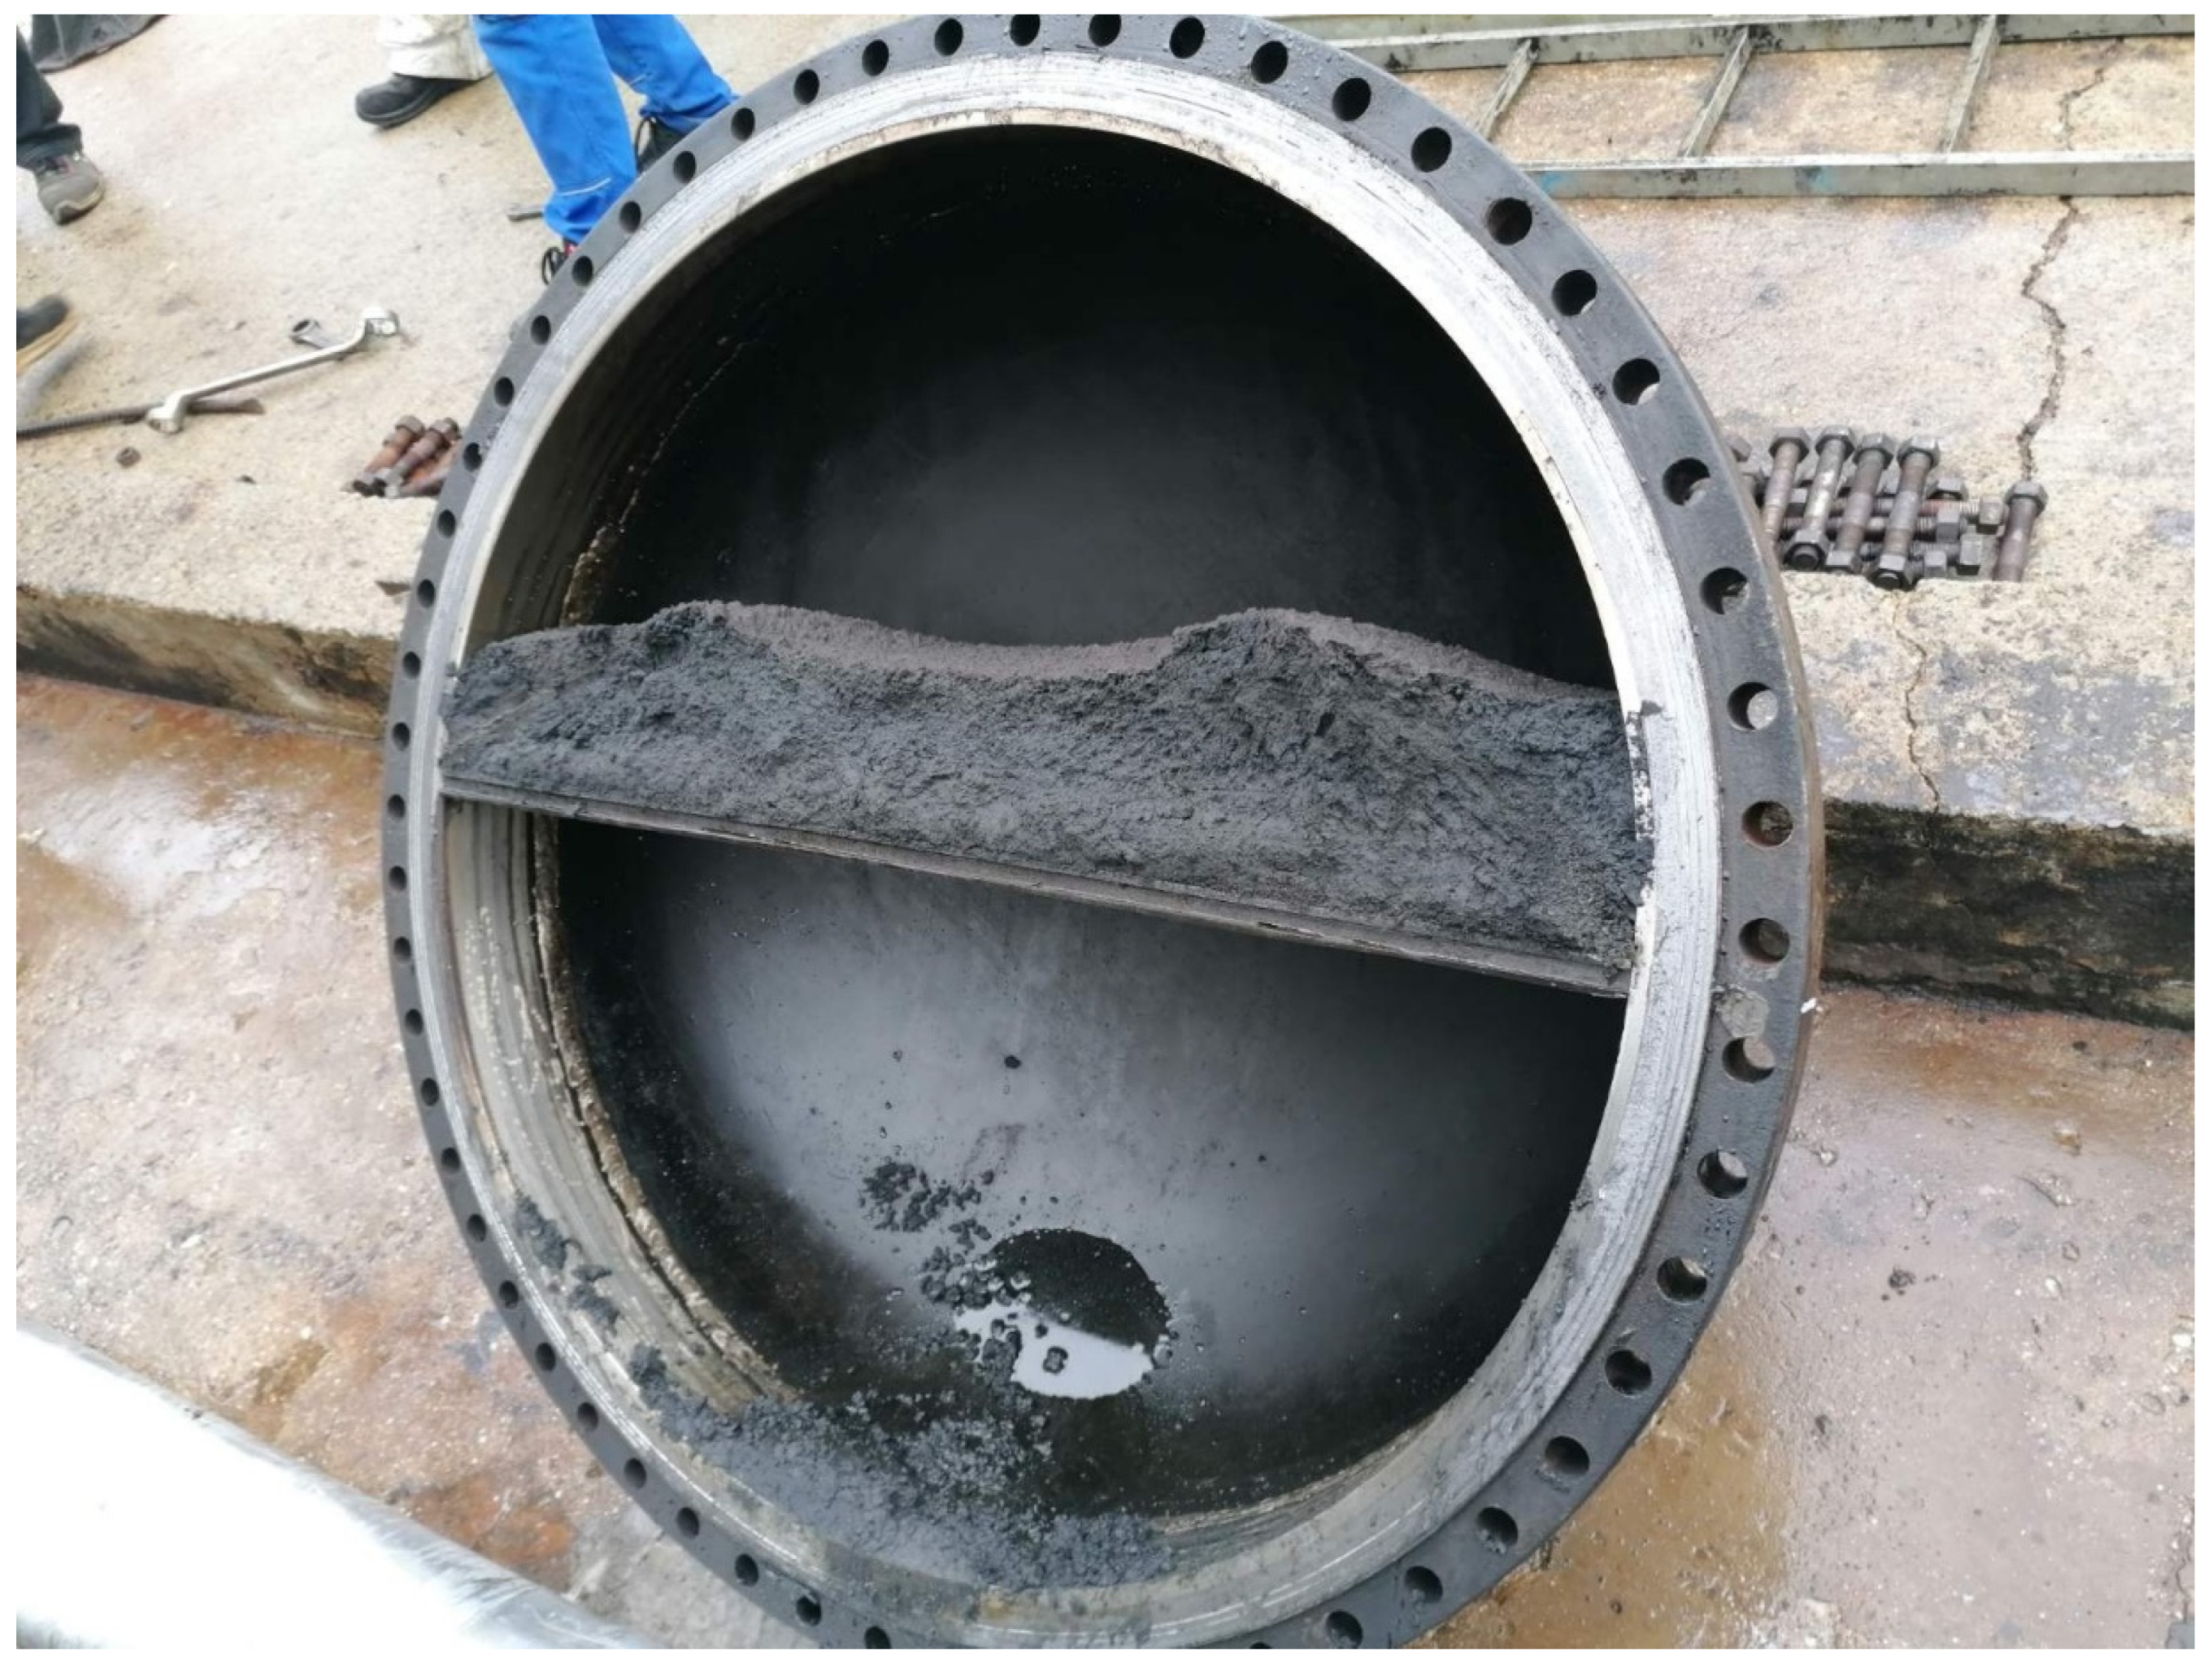
3.3. Commercial Crude Distillation Unit Heat Exchanger Fouling
4. Conclusions
Author Contributions
Funding
Data Availability Statement
Acknowledgments
Conflicts of Interest
References
- Kumar, R.; Voolapallia, R.; Upadhyayulab, S. Prediction of crude oil blends compatibility and blend optimization for increasing heavy oil processing. Fuel Process. Technol. 2018, 177, 309–327. [Google Scholar] [CrossRef]
- Collins, T.; Barletta, T. Desalting heavy Canadian crudes. Sour Heavy 2012, 1–5. Available online: https://www.digitalrefining.com/article/1000566 (accessed on 8 January 2025).
- Stark, J.L.; Nguyen, J.; Kremer, L.N. New method prevents desalter upsets from blending incompatible crudes. Oil Gas J. 2002, 100, 89–91. [Google Scholar]
- Sorathia, P.D.; Baldania, A.D. Problems Occurring in De-Salter plant of Crude oil and its solution. JETIR 2017, 4, 64–69. [Google Scholar]
- Nasehi, S.; Sarraf, M.J.; Ilkhani, A.; Mohammadmirzaie, M.A.; Fazaelipoor, M.H. Study of Crude Oil Desalting Process in Refinery. J. Biochem. Tech. 2018, 9, 29–33. [Google Scholar]
- Khan, M.K.; Riaz, A.; Minhoe, Y.; Kim, J. Removal of naphthenic acids from high acid crude via esterification with methanol. Fuel Process. Technol. 2017, 165, 123–130. [Google Scholar] [CrossRef]
- Al-Moubaraki, A.H.; Obot, I.B. Corrosion challenges in petroleum refinery operations: Sources, mechanisms, mitigation, and future outlook. J. Saudi Chem. Soc. 2021, 25, 101370. [Google Scholar] [CrossRef]
- Meriem-Benziane, M.; Bou-Saïd, B.; Nasser, B.; Boudissa, I. Numerical study of elbow corrosion in the presence of sodium chloride, calcium chloride, naphthenic acids, and sulfur in crude oil. J. Petrol. Sci. Eng. 2021, 198, 108124. [Google Scholar] [CrossRef]
- Patrick, B.N. Understanding Naphthenic Acid Corrosion in Refinery Settings. Ph.D. Thesis, University of California, Berkeley, CA, USA, 2015. [Google Scholar]
- Laredo, G.C.; Lopez, C.R.; Alvarez, R.E.E.; Cano, J.L. Naphthenic acids, total acid number and sulfur content profile characterization in Isthmus and Maya crude oils. Fuel 2004, 83, 1689–1695. [Google Scholar] [CrossRef]
- Huang, B.S.; Yin, W.F.; Sang, D.H.; Jiang, Z.Y. Synergy effect of naphthenic acid corrosion and sulfur corrosion in crude oil distillation unit. Appl. Surf. Sci. 2012, 259, 664–670. [Google Scholar] [CrossRef]
- Flego, C.; Galasso, L.; Montanari, L.; Maria Gennaro, M.E. Evolution of Naphthenic Acids during the Corrosion Process. Energy Fuels 2014, 28, 1701–1708. [Google Scholar] [CrossRef]
- Kondyli, A.; Schrader, W. Understanding “Fouling” in Extremely Complex Petroleum Mixtures. ACS Appl. Energy Mater. 2020, 3, 7251–7256. [Google Scholar] [CrossRef]
- Asomaning, S.; Watkinson, A.P. Petroleum stability and heteroatom species effects in fouling of heat exchangers by asphaltenes. Heat. Tran. Eng. 2000, 21, 10–16. [Google Scholar] [CrossRef]
- Hong, E.; Watkinson, P. Precipitation and fouling in heavy oil–diluent blends. Heat. Transf. Eng. 2009, 30, 786–793. [Google Scholar] [CrossRef]
- Guo, L.; Kuang, J.; Liu, S.; Shen, S.; Liang, L. Failure mechanism of a coil type crude oil heater and optimization method. Case Stud. Therm. Eng. 2022, 39, 102398. [Google Scholar] [CrossRef]
- Li, Q.; Li, Q.; Wu, J.; Li, X.; Li, H.; Cheng, Y. Wellhead Stability During Development Process of Hydrate Reservoir in the Northern South China Sea: Evolution and Mechanism. Processes 2025, 13, 40. [Google Scholar] [CrossRef]
- Li, Q.; Li, Q.; Cao, H.; Wu, J.; Wang, F.; Wang, Y. The Crack Propagation Behaviour of CO2 Fracturing Fluid in Unconventional Low Permeability Reservoirs: Factor Analysis and Mechanism Revelation. Processes 2025, 13, 159. [Google Scholar] [CrossRef]
- Zheng, F.; Shi, Q.; Vallverdu, G.; Giusti, P.; Bouyssiere, B. Fractionation and Characterization of Petroleum Asphaltene: Focus on Metalopetroleomics. Processes 2020, 8, 1504. [Google Scholar] [CrossRef]
- Speight, J.G. Petroleum Asphaltenes. Part 2. The effect of asphaltenes and resin constituents on recovery and refining processes. Oil Gas. Sci. Technol. Rev. IFP. 2004, 59, 479–488. [Google Scholar] [CrossRef]
- Paczuski, M. Modification of Asphaltene Dispersions in Crude Oil. In Physicochemistry of Petroleum Dispersions in Refining Technology; IntechOpen: London, UK. [CrossRef]
- Abdulredha, M.M.; Hussain, S.A.; Abdullah, L.C. Overview on petroleum emulsions, formation, influence and demulsification treatment techniques. Arab. J. Chem. 2020, 13, 3403–3428. [Google Scholar] [CrossRef]
- Peñaloza, I.M.; Chauhan, G.; de Klerk, A. Desalting Behavior of Bitumen. Energy Fuels 2021, 35, 15618–15627. [Google Scholar] [CrossRef]
- Perez, P.L.; Zaragoza, J.N.; Patel, N.K.; Dion, M.A. Impact of Asphaltene Stabilizers on the Elasticity of a Crude Oil–Water Interface and Its Correlation to Demulsification under Desalting Conditions. Energy Fuels 2022, 36, 275–289. [Google Scholar] [CrossRef]
- Patil, P.D.; Kozminski, M.; Peterson, J.; Kumar, S. Fouling Diagnosis of Pennsylvania Grade Crude Blended with Opportunity Crude Oils in a Refinery Crude Unit’s Hot Heat Exchanger Train. Ind. Eng. Chem. Res. 2019, 58, 17918–17927. [Google Scholar] [CrossRef]
- Zhu, H.; Wang, Q.; Yan, Y.; Xu, Y.; Liu, S.; Zhang, S.; Xu, J.; Yang, C. Effect of Naphthenic Acid and Metal Ions on Emulsification of Heavy Oil. Energy Fuels 2022, 36, 2561–2571. [Google Scholar] [CrossRef]
- Alvisi, P.P.; Lins, V.F.C. An overview of naphthenic acid corrosion in a vacuum distillation plant. Eng. Fail. Anal. 2011, 18, 1403–1406. [Google Scholar] [CrossRef]
- Rana, B.S.; Cho, D.W.; Cho, K.; Kim, J.-N. Total Acid Number (TAN) reduction of high acidic crude oil by catalytic esterification of naphthenic acids in fixed-bed continuous flow reactor. Fuel 2018, 231, 271–280. [Google Scholar] [CrossRef]
- Ramirez-Corredores, M.M. The Science and Technology of Unconventional Oils Finding Refining Opportunities; Elsevier: Amsterdam, The Netherlands, 2017; pp. 164–165. [Google Scholar]
- Rogel, E.; Hench, K.; Miao, T.; Lee, E.; Dickakian, G. Evaluation of the compatibility of crude oil blends and its impact on fouling. Energy Fuels 2018, 32, 9233–9242. [Google Scholar] [CrossRef]
- Bambinek, K.; Przyjazny, A.; Boczkaj, G. Compatibility of Crude Oil Blends Processing Issues Related to Asphaltene Precipitation, Methods of Instability Prediction-A Review. Ind. Eng. Chem. Res. 2023, 62, 2–15. [Google Scholar] [CrossRef]
- Van den Berg, F.G.A.; Kapusta, S.D.; Ooms, A.C.; Smith, A.J. Fouling and Compatibility of Crudes as Basis for a New Crude Selection Strategy. Pet. Sci. Technol. 2003, 21, 557–568. [Google Scholar] [CrossRef]
- Wiehe, I.A. Fouling of Nearly Incompatible Oils. Energy Fuels 2001, 15, 1057–1058. [Google Scholar] [CrossRef]
- Wiehe, I.A. Asphaltene Solubility and Fluid Compatibility. Energy Fuels 2012, 26, 4004–4016. [Google Scholar] [CrossRef]
- Schermer, W.E.M.; Melein, P.M.J.; van den Berg, F.G.A. Simple Techniques for Evaluation of Crude Oil Compatibility. Pet. Sci. Technol 2004, 22, 1045–1054. [Google Scholar] [CrossRef]
- Wiehe, I.; Kennedy, R.J. The Oil Compatibility Model and Crude Oil Incompatibility. Energy Fuels 2000, 14, 56–59. [Google Scholar] [CrossRef]
- Wiehe, I.A.; Kennedy, R.J. Application of the Oil Compatibility Model to Refinery Streams. Energy Fuels 2000, 14, 60–63. [Google Scholar] [CrossRef]
- Wiehe, I.A. Self-Incompatible Crude Oils and Converted Petroleum Resids. J. Disper. Sci. Technol. 2004, 3, 333–339. [Google Scholar] [CrossRef]
- Wiehe, I.A. Process Chemistry of Petroleum Macromolecules; Taylor & Francis Group, CRC Press: Boca Raton, FL, USA, 2008; pp. 223–224. [Google Scholar]
- Vermeire, M.; Heyberger, B. Study to Evaluate Test Methods to Assess the Stability and Compatibility of Marine Fuels in View of the IMO MARPOL Annex VI Regulation 14.1.3 for 2020 Sulphur Requirements. Report no.11/19, Concawe 2019. Available online: https://www.concawe.eu/wp-content/uploads/Rpt_19-11.pdf (accessed on 22 January 2025).
- ASTM D7157–18; Standard Test Method for Determination of Intrinsic Stability of Asphaltene-Containing Residues, Heavy Fuel Oils, and Crude Oils (n-Heptane Phase Separation; Optical Detection). ASTM International: West Conshohocken, PA, USA, 2022.
- Nedelchev, A.; Stratiev, D.; Stoilov, G.; Dinkov, R.; Lepidis, K.; Sharpe, R.; Russell, C.A.; Petkova, N.; Petkov, P. Visbreaker performance improvement by optimisation of process conditions and application of chemical additive treatment program. Oil Gas. Eur. Mag. 2013, 3, 147–153. [Google Scholar]
- ASTM D7112-19; Standard Test Method for Determining Stability and Compatibility of Heavy Fuel Oils and Crude Oils by Heavy Fuel Oil Stability Analyzer (Optical Detection). ASTM International: West Conshohocken, PA, USA, 2024.
- Shishkova, I.; Stratiev, D.; Sotirov, S. Petroleum Chemistry and Processing Investigated by the Use of Intercriteria Analysis; Publishing House of Bulgarian Academy of Sciences: Sofia, Bulgaria, 2024; pp. 124–141. [Google Scholar]
- Nemana, S.; Kimbrell, M.R.; Zaluzec, E. Predictive crude oil compatibility model. US patent 7,618,822 B2, 17 November 2009. [Google Scholar]
- ASTM D7060−12; (Reapproved 2014) Standard Test Method for Determination of the Maximum Flocculation Ratio and Peptizing Power in Residual and Heavy Fuel Oils (Optical Detection Method). ASTM International: West Conshohocken, PA, USA, 2014.
- Alonso, F.; Castillo, J.A.; Ancheyta, J.; Torres-Mancera, P. Evaluation of the Effect of Addition Order on the Compatibility of Binary Crude Oil Blending. Energy Fuels 2024, 38, 23358–23366. [Google Scholar] [CrossRef]
- Guzmán, R.; Rodríguez, S.; Torres-Mancera, P.; Ancheyta, J. 550 Evaluation of asphaltene stability of a wide range of Mexican crude oils. Energy Fuels 2021, 35, 408–418. [Google Scholar] [CrossRef]
- Sharma, E.; Shown, B.; Sulakhe, S.; Naik, V.M.; Thaokar, R.M.; Juvekar, V.A. Forecasting the Problem of Excessive Oil Entrainment in a Desalter Using Spinning Drop Method. ACS Omega 2024, 9, 12768–12778. [Google Scholar] [CrossRef]
- Atanassov, K.; Atanassova, V.; Gluhchev, G. Intercriteria analysis: Ideas and problems. Notes Intuitionistic Fuzzy Sets 2015, 21, 81–88. [Google Scholar]
- Shiskova, I.; Stratiev, D.; Tavlieva, M.; Nedelchev, A.; Dinkov, R.; Kolev, I.; van den Berg, F.; Ribagin, S.; Sotirov, S.; Nikolova, R.; et al. Application of Intercriteria and Regression Analyses and Artificial Neural Network to Investigate the Relation of Crude Oil Assay Data to Oil Compatibility. Processes 2024, 12, 780. [Google Scholar] [CrossRef]
- van den Berg, F.G. History and Review of Dual Solvent Titration Methods. Energy Fuels 2022, 36, 8639–8648. [Google Scholar] [CrossRef]
- ASTM D 2892–20; Standard Test Method for Distillation of Crude Petroleum (15-Theoretical Plate Column). ASTM International: West Conshohocken, PA, USA, 2023.
- ASTM D5236–18a; Standard Test Method for Distillation of Heavy Hydrocarbon Mixtures (Vacuum Potstill Method). ASTM International: West Conshohocken, PA, USA, 2023.
- Stratiev, D.; Nikolova, R.; Veli, A.; Shishkova, I.; Toteva, V.; Georgiev, G. Mitigation of Asphaltene Deposit Formation via Chemical Additives: A Review. Processes 2025, 13, 141. [Google Scholar] [CrossRef]
- Atanassov, K.; Mavrov, D.; Atanassova, V. Intercriteria decision making: A new approach for multicriteria decision making, based on index matrices and intuitionistic fuzzy sets. Issues Intuitionistic Fuzzy Sets Gen. Nets 2014, 11, 1–8. [Google Scholar]
- Chorukova, E.; Marinov, P.; Umlenski, I. Survey on Theory and Applications of InterCriteria Analysis Approach. In Research in Computer Science in the Bulgarian Academy of Sciences; Atanassov, K.T., Ed.; Studies in Computational Intelligence; Springer: Cham, Switzerland, 2021; Volume 934. [Google Scholar] [CrossRef]
- Mavrov, D. Software for InterCriteria Analysis: Implementation of the Main Algorithm. Notes Intuitionistic Fuzzy Sets 2015, 21, 77–86. [Google Scholar]
- Mavrov, D. Software for Intercriteria Analysis: Working with the Results. Annu. Inform. Sect. Union Sci. Bulg. 2015, 8, 37–44. [Google Scholar]
- Ikonomov, N.; Vassilev, P.; Roeva, O. ICrAData—Software for InterCriteria Analysis. Int. J. Bioautomation 2018, 22, 1–10. [Google Scholar] [CrossRef]
- Ancheyta, J. Relative compatibility index for evaluation of the compatibility of crude oil blends. Geoenergy Sci. Eng. 2023, 230, 212246. [Google Scholar] [CrossRef]
- Guzmán, R.; Ancheyta, J.; Trejo, F.; Rodríguez, S. Methods for determining asphaltene stability in crude oils. Fuel 2017, 188, 530–548. [Google Scholar] [CrossRef]
- Moura, L.G.M.; Santos, M.F.P.; Zilio, E.L.; Rolemberg, M.P.; Ramos, A.C.S. Evaluation of indices and of models applied to the prediction of the stability of crude oils. J. Pet. Sci. Eng. 2010, 74, 77–87. [Google Scholar] [CrossRef]
- Correra, S.; Merlini, M.; Di Lullo, A.; Merino-Garcia, D. Estimation of the solvent power of crude oil from density and viscosity measurements. Ind. Eng. Chem. Res. 2005, 44, 9307–9315. [Google Scholar] [CrossRef]
- Lemke, H. Fouling in refinery equipment—An overview. In Proceedings of the AIChE Spring Meeting, Houston, TX, USA, 14–18 March 1999. [Google Scholar]


| Processed Crude Oils | Tartaruga | Johan Sverdrup | KEBCO | CPC | Helm | Basra Medium | Basra Heavy | Azeri Light | TEN | ITR | Arab Light | Arab Heavy | Es Sider | Rhemoura | Unity Gold | Gulf of Suez | El Bouri |
|---|---|---|---|---|---|---|---|---|---|---|---|---|---|---|---|---|---|
| Origin | Brazil | Norway | Kazakhstan | Kazakhstan | Netherlands | Iraq | Iraq | Azerbaijan | Ghana | Saudi Arabia | Saudi Arabia | Lybia | Tunisia | Guyana | Egypt | Lybia | |
| Density at 15 °C, g/m3 | 0.893 | 0.8849 | 0.8718 | 0.801 | 0.935 | 0.8831 | 0.9082 | 0.829 | 0.8308 | 0.9453 | 0.858 | 0.891 | 0.840 | 0.848 | 0.855 | 0.873 | 0.888 |
| Sulfur, wt.% | 0.73 | 0.82 | 1.76 | 0.56 | 1.71 | 3.21 | 3.94 | 0.15 | 0.341 | 5.75 | 1.9 | 2.97 | 0.4 | 0.57 | 0.45 | 1.53 | 1.71 |
| Chloride, mg/kg | 262.5 | 153.7 | 33 | 37.5 | 455.4 | 31.1 | 96.8 | 28.6 | 30.4 | 32 | 10.5 | 24 | 85.9 | 41.9 | 38.5 | 65.1 | 26.6 |
| TAN, mg KOH/g | 0.15 | 0.3 | 0.13 | 0.06 | 0.81 | 0.2 | 0.26 | 0.32 | 0.03 | 0.16 | 0.06 | 0.28 | 0.09 | 0.22 | 0.22 | 0.053 | 0.06 |
| Water content, vol.% | 0.446 | 0.416 | 0.166 | 0.04 | 0.683 | 0.159 | 0.3 | 0.041 | 0.04 | 0.127 | 0.034 | 0.062 | 0.084 | 0.025 | 0.077 | 0.061 | 0.062 |
| Pour point, °C | −36 | 0 | −18 | −15 | −30 | −36 | −36 | −36 | −24 | −30 | −36 | −36 | 12 | −18 | −3 | 9 | 0 |
| TBP distillation fraction yields. wt.% | |||||||||||||||||
| IBP *-110 °C | 7.6 | 7.6 | 8.1 | 18.0 | 2.2 | 8.5 | 7.2 | 13.6 | 13.7 | 7.3 | 9.6 | 7.0 | 7.4 | 11.1 | 10.8 | 8.3 | 6.4 |
| 110–180 °C | 8.0 | 7.8 | 9.7 | 18.9 | 5.5 | 9.8 | 8.8 | 15.5 | 15.3 | 8.3 | 11.7 | 9.1 | 13.8 | 12.8 | 12.0 | 10.4 | 9.3 |
| 180–240°C | 7.5 | 8.3 | 9.0 | 13.2 | 6.4 | 8.5 | 8.0 | 12.5 | 11.2 | 6.9 | 10.1 | 8.0 | 10.4 | 10.6 | 9.7 | 8.8 | 8.6 |
| 240–360°C | 18.9 | 23.2 | 21.9 | 23.4 | 20.6 | 18.6 | 17.9 | 25.2 | 22.4 | 15.3 | 21.3 | 19.0 | 22.0 | 23.2 | 22.2 | 20.8 | 20.7 |
| IBP *-360°C | 42.0 | 46.9 | 48.8 | 73.6 | 34.6 | 45.4 | 41.8 | 66.8 | 62.6 | 37.8 | 52.7 | 43.0 | 53.7 | 57.6 | 54.7 | 48.2 | 45.0 |
| 360–540°C | 28.6 | 27.6 | 26.5 | 17.6 | 28.8 | 24.6 | 24.0 | 20.7 | 21.5 | 22.1 | 24.6 | 24.6 | 26.4 | 23.8 | 25.7 | 25.3 | 28.8 |
| >540 °C | 28.5 | 24.6 | 23.8 | 7.8 | 35.6 | 29.0 | 33.2 | 11.5 | 15.0 | 39.1 | 21.7 | 31.3 | 16.8 | 17.6 | 18.6 | 25.5 | 25.2 |
| Na, mg/kg | 54.9 | 1.3 | 1.1 | 1.5 | 151.4 | 15.6 | 7.4 | 8.0 | 6.5 | 3.9 | 5.2 | 6.0 | 11.9 | 2.4 | 6.7 | 11 | |
| Ni, mg/kg | 20.8 | 20.6 | 8.3 | 4.4 | 14.5 | 18.2 | 19.3 | 18.5 | 12.0 | 31.9 | 11.7 | 15.6 | 14.9 | 14.2 | 10.8 | 23.6 | |
| V, mg/kg | 22.5 | 15.1 | 66.8 | 1.65 | 66.8 | 73.5 | 75.1 | 7.2 | 6.5 | 29.7 | 11.7 | 47.9 | 6.9 | 12.8 | 18.2 | 50 | |
| Fe, mg/kg | 52.0 | 17.9 | 7.6 | 6.0 | 4.0 | 45.9 | 4.8 | 7.5 | 4.5 | 2.3 | 10.0 | 4.1 | 4.8 | 2.7 | 4.2 | 12.3 | |
| As, µg/kg | 68.0 | 98 | 148 | 18.8 | 48.2 | 78.5 | 41.3 | 21.5 | 16.9 | 70.3 | 61.7 | 114.6 | 86.9 | 4.6 | 70.3 | 51.4 | |
| Ca, mg/kg | 12.2 | 7.2 | 2.3 | 1.6 | 20.2 | 4.7 | 4.1 | 6.6 | 5.3 | 3.9 | 4.4 | 3.8 | 6.3 | 42.2 | 3 | 7.4 | |
| C7-asphaltenes, wt.% | 4.3 | 4.2 | 3.4 | 0.5 | 10.2 | 6.3 | 9.7 | 0.7 | 0.2 | 16.2 | 4.7 | 3.3 | 1.9 | 6.2 | 2.0 | 6.2 | 8.2 |
| Vacuum Residues | Density at 15 °C, g/m3 | Concarbon Content, wt.% | Sulfur, wt.% | Nitrogen, wt.% | Saturates, wt.% | Aromatics, wt.% | Resins, wt.% | C7-Asphaltenes, wt.% | C5-Asphaltenes, wt.% |
|---|---|---|---|---|---|---|---|---|---|
| Tartaruga | 1.0081 | 16.3 | 1.354 | 0.922 | 16.2 | 61.4 | 8.1 | 14.3 | 22.4 |
| Johan Sverdrup | 1.0225 | 20 | 1.774 | 1.922 | 12.7 | 59.9 | 11.0 | 16.4 | 27.4 |
| KEBCO | 0.997 | 17.5 | 3 | 0.5 | 19.3 | 61.8 | 4.5 | 14.4 | 18.9 |
| CPC | 0.9477 | 8.38 | 1.361 | 0.311 | 40.6 | 48.4 | 7.6 | 3.4 | 11 |
| Helm | 1.054 | 23.25 | 3.013 | 0.344 | 7.3 | 51.4 | 14.3 | 27.0 | 41.3 |
| Basra Medium | 1.0615 | 27.05 | 6.5 | 0.317 | 6.3 | 63.5 | 7.9 | 22.3 | 30.2 |
| Basra Heavy | 1.071 | 28.9 | 7.1 | 0.415 | 5.2 | 58.0 | 10.0 | 26.9 | 36.9 |
| Azeri Light | 0.967 | 9.5 | 0.5 | 0.444 | 30.6 | 64.0 | 4.0 | 1.4 | 5.4 |
| TEN | 0.9806 | 11.6 | 1.064 | 0.621 | 24.9 | 70.1 | 3.8 | 1.2 | 5.0 |
| ITR | 1.12 | 34.3 | 9.3 | 0.5408 | 1.3 | 51.9 | 10.0 | 36.8 | 46.8 |
| Arab Light | 1.029 | 18.7 | 4.9 | 0.28 | 11.4 | 69.1 | 7.1 | 12.3 | 19.5 |
| Arab Heavy | 1.04 | 23.6 | 5.8 | 0.437 | 9.4 | 57.7 | 11.6 | 21.3 | 32.9 |
| Es Sider | 0.991 | 15.600 | 1.05 | 0.731 | 21.3 | 59.7 | 8.8 | 10.2 | 19.0 |
| Rhemoura | 1.041 | 23.700 | 1.8 | 0.5 | 9.2 | 59.5 | 8.1 | 23.2 | 31.3 |
| Unity Gold | 0.994 | 14.7 | 1.318 | 0.52 | 20.3 | 64.1 | 4.8 | 10.9 | 15.7 |
| Gulf of Suez | 1.024 | 19.671 | 3.358 | 0.38 | 12.5 | 55.5 | 9.9 | 22.1 | 32.0 |
| El Bouri | 1.050 | 25.500 | 3.3 | 0.53 | 7.8 | 64.9 | 9.8 | 17.5 | 27.3 |
| Content of Crudes in Petroleum Mixture | Min | Max |
|---|---|---|
| Tartaruga | 0.0 | 1.1 |
| Johan Sverdrup | 0.8 | 32.8 |
| KEBCO | 0.7 | 20.2 |
| CPC | 2.9 | 29.7 |
| Helm | 0.0 | 11.1 |
| Basrah Medium | 0.0 | 29.1 |
| Basrah Heavy | 0.0 | 23.0 |
| Azeri Light | 1.0 | 14.1 |
| TEN | 0.3 | 40.6 |
| ITR | 0.0 | 10.7 |
| Arab Light | 0.0 | 3.7 |
| Arab Heavy | 3.2 | 20.4 |
| Es Sider | 0.0 | 16.9 |
| Rhemoura | 0.0 | 10.5 |
| Unity Gold | 0.0 | 0.9 |
| Gulf of Suez | 0.0 | 0.5 |
| El Bouri | 0.0 | 14.7 |
| Processed Crude Oils | N-Heptane, wt.% in Crude Blend at the Onset of Asphaltene Precipitation | SBN | IN | SBN/IN | Sa | Sp | Sp critical |
|---|---|---|---|---|---|---|---|
| Tartaruga | 40 | 94 | 59 | 1.60 | 0.762 | 29.0 | 17.4 |
| Johan Sverdrup | 61 | 92 | 38 | 2.39 | 0.724 | 31.5 | 12.3 |
| KEBCO | 50 | 86 | 46 | 1.87 | 0.749 | 28.9 | 14.4 |
| CPC | NPD | NPD | NPD | NPD | 0.845 | 21.4 | NPD |
| Helm | 55 | 111 | 52 | 2.14 | 0.689 | 43.0 | 21.5 |
| Basrah Medium | 45 | 90 | 52 | 1.72 | 0.649 | 30.2 | 16.6 |
| Basrah Heavy | 50 | 102 | 54 | 1.91 | 0.630 | 35.4 | 17.7 |
| Azeri Light | NPD | NPD | NPD | NPD | 0.833 | 27.5 | NPD |
| TEN | NPD | NPD | NPD | NPD | 0.811 | 27.3 | NPD |
| ITR | 35 | 113 | 75 | 1.51 | 0.573 | 43.9 | 28.5 |
| Arab Light | 40 | 80 | 51 | 1.57 | 0.737 | 25.2 | 15.1 |
| Arab Heavy | 55 | 94 | 45 | 2.09 | 0.685 | 29.8 | 13.4 |
| Es Sider | 40 | 71 | 46 | 1.56 | 0.769 | 22.2 | 13.3 |
| Rhemoura | 30 | 83 | 60 | 1.37 | 0.684 | 31.4 | 22.0 |
| Unity Gold | 50 | 79 | 42 | 1.86 | 0.779 | 28.8 | 14.4 |
| Gulf of Suez | 40 | 86 | 54 | 1.58 | 0.726 | 27.3 | 16.4 |
| El Bouri | 30 | 94 | 68 | 1.38 | 0.665 | 30.8 | 21.6 |
| No | Date | SBN | IBN | SBN/IBN | SBN/IN max | Sa | No | Date | SBN | IBN | SBN/IBN | SBN/IN max | Sa |
|---|---|---|---|---|---|---|---|---|---|---|---|---|---|
| 1 | 28.10.2024 | 79.29 | 48.1 | 1.65 | 1.47 | 0.678 | 21 | 17.11.2024 | 78.70 | 46.8 | 1.68 | 1.05 | 0.723 |
| 2 | 29.10.2024 | 79.12 | 51.2 | 1.54 | 1.05 | 0.664 | 22 | 27.12.2024 | 84.20 | 46.6 | 1.81 | 1.59 | 0.714 |
| 3 | 30.10.2024 | 80.00 | 54.0 | 1.48 | 1.07 | 0.657 | 23 | 28.12.2024 | 84.40 | 48.0 | 1.76 | 1.13 | 0.709 |
| 4 | 31.10.2024 | 80.00 | 55.2 | 1.45 | 1.07 | 0.654 | 24 | 29.12.2024 | 83.97 | 52.9 | 1.59 | 1.12 | 0.688 |
| 5 | 1.11.2024 | 79.14 | 55.2 | 1.43 | 1.06 | 0.654 | 25 | 30.12.2024 | 83.90 | 55.1 | 1.52 | 1.12 | 0.679 |
| 6 | 2.11.2024 | 79.43 | 56.9 | 1.40 | 1.06 | 0.644 | 26 | 31.12.2024 | 84.06 | 57.2 | 1.47 | 1.12 | 0.669 |
| 7 | 3.11.2024 | 79.92 | 57.7 | 1.39 | 1.07 | 0.640 | 27 | 1.1.2025 | 83.50 | 57.5 | 1.45 | 1.11 | 0.666 |
| 8 | 4.11.2024 | 78.37 | 57.4 | 1.37 | 1.04 | 0.642 | 28 | 2.1.2025 | 83.80 | 56.8 | 1.48 | 1.12 | 0.668 |
| 9 | 5.11.2024 | 78.05 | 57.8 | 1.35 | 1.04 | 0.641 | 29 | 3.1.2025 | 85.09 | 55.4 | 1.54 | 1.13 | 0.673 |
| 10 | 6.11.2024 | 78.95 | 58.5 | 1.35 | 1.05 | 0.640 | 30 | 4.1.2025 | 85.59 | 54.7 | 1.56 | 1.14 | 0.676 |
| 11 | 7.11.2024 | 78.00 | 58.8 | 1.33 | 1.04 | 0.642 | 31 | 5.1.2025 | 86.45 | 53.8 | 1.61 | 1.15 | 0.681 |
| 12 | 8.11.2024 | 79.07 | 58.2 | 1.36 | 1.05 | 0.647 | 32 | 6.1.2025 | 86.76 | 53.2 | 1.63 | 1.16 | 0.684 |
| 13 | 9.11.2024 | 79.28 | 56.0 | 1.42 | 1.06 | 0.660 | 33 | 7.1.2025 | 87.48 | 52.3 | 1.67 | 1.17 | 0.689 |
| 14 | 10.11.2024 | 79.89 | 54.6 | 1.46 | 1.07 | 0.671 | 34 | 8.1.2025 | 88.66 | 52.3 | 1.70 | 1.18 | 0.691 |
| 15 | 11.11.2024 | 79.87 | 52.1 | 1.53 | 1.06 | 0.688 | 35 | 9.1.2025 | 84.83 | 51.7 | 1.64 | 1.13 | 0.697 |
| 16 | 12.11.2024 | 80.29 | 53.1 | 1.51 | 1.07 | 0.683 | 36 | 10.1.2025 | 84.91 | 51.7 | 1.64 | 1.13 | 0.699 |
| 17 | 13.11.2024 | 79.76 | 49.8 | 1.60 | 1.06 | 0.698 | 37 | 11.1.2025 | 85.21 | 52.1 | 1.64 | 1.14 | 0.699 |
| 18 | 14.11.2024 | 78.92 | 48.9 | 1.61 | 1.05 | 0.703 | 38 | 12.1.2025 | 85.65 | 53.0 | 1.62 | 1.14 | 0.699 |
| 19 | 15.11.2024 | 79.25 | 48.2 | 1.64 | 1.06 | 0.708 | 39 | 13.1.2025 | 85.55 | 49.6 | 1.73 | 1.14 | 0.707 |
| 20 | 16.11.2024 | 78.81 | 47.0 | 1.68 | 1.05 | 0.723 | 40 | 14.1.2025 | 85.80 | 49.4 | 1.74 | 1.14 | 0.707 |
| μ | KEBCO | Sver-Drup | CPC | Basra M | Arab H | Basra H | Azeri L | TEN | ITR | HELM | GOSM | Unity Gold | Es Sider | Arab L | Tarta-Ruga | Rhe-Moura | Bouri | SBN | IBN | SBN/IBN | Sa | Ampe-Rage |
|---|---|---|---|---|---|---|---|---|---|---|---|---|---|---|---|---|---|---|---|---|---|---|
| KEBCO | 1.00 | 0.49 | 0.53 | 0.53 | 0.44 | 0.53 | 0.46 | 0.42 | 0.33 | 0.37 | 0.11 | 0.11 | 0.33 | 0.24 | 0.11 | 0.27 | 0.32 | 0.51 | 0.38 | 0.60 | 0.59 | 0.38 |
| Sverdrup | 0.49 | 1.00 | 0.26 | 0.57 | 0.35 | 0.19 | 0.54 | 0.27 | 0.36 | 0.46 | 0.12 | 0.24 | 0.54 | 0.28 | 0.12 | 0.50 | 0.24 | 0.73 | 0.27 | 0.77 | 0.77 | 0.23 |
| CPC | 0.53 | 0.26 | 1.00 | 0.30 | 0.48 | 0.77 | 0.33 | 0.63 | 0.45 | 0.36 | 0.13 | 0.20 | 0.17 | 0.20 | 0.13 | 0.13 | 0.06 | 0.16 | 0.52 | 0.34 | 0.35 | 0.63 |
| Basra M | 0.53 | 0.57 | 0.30 | 1.00 | 0.46 | 0.20 | 0.71 | 0.12 | 0.41 | 0.27 | 0.13 | 0.35 | 0.75 | 0.40 | 0.13 | 0.69 | 0.38 | 0.67 | 0.35 | 0.63 | 0.60 | 0.31 |
| Arab H | 0.44 | 0.35 | 0.48 | 0.46 | 1.00 | 0.45 | 0.69 | 0.31 | 0.70 | 0.03 | 0.02 | 0.16 | 0.44 | 0.11 | 0.02 | 0.45 | 0.12 | 0.55 | 0.68 | 0.36 | 0.27 | 0.68 |
| Basra H | 0.53 | 0.19 | 0.77 | 0.20 | 0.45 | 1.00 | 0.25 | 0.72 | 0.40 | 0.37 | 0.24 | 0.15 | 0.03 | 0.22 | 0.24 | 0.01 | 0.13 | 0.18 | 0.47 | 0.26 | 0.28 | 0.56 |
| Azeri L | 0.46 | 0.54 | 0.33 | 0.71 | 0.69 | 0.25 | 1.00 | 0.15 | 0.61 | 0.15 | 0.02 | 0.25 | 0.69 | 0.23 | 0.02 | 0.70 | 0.22 | 0.70 | 0.55 | 0.52 | 0.46 | 0.51 |
| TEN | 0.42 | 0.27 | 0.63 | 0.12 | 0.31 | 0.72 | 0.15 | 1.00 | 0.45 | 0.47 | 0.21 | 0.15 | 0.06 | 0.18 | 0.21 | 0.05 | 0.12 | 0.15 | 0.51 | 0.26 | 0.32 | 0.56 |
| ITR | 0.33 | 0.36 | 0.45 | 0.41 | 0.70 | 0.40 | 0.61 | 0.45 | 1.00 | 0.14 | 0.02 | 0.18 | 0.45 | 0.11 | 0.02 | 0.46 | 0.08 | 0.48 | 0.88 | 0.21 | 0.18 | 0.80 |
| HELM | 0.37 | 0.46 | 0.36 | 0.27 | 0.03 | 0.37 | 0.15 | 0.47 | 0.14 | 1.00 | 0.51 | 0.34 | 0.24 | 0.48 | 0.51 | 0.20 | 0.54 | 0.27 | 0.14 | 0.42 | 0.50 | 0.15 |
| GOSM | 0.11 | 0.12 | 0.13 | 0.13 | 0.02 | 0.24 | 0.02 | 0.21 | 0.02 | 0.51 | 1.00 | 0.74 | 0.26 | 0.72 | 1.00 | 0.21 | 0.55 | 0.03 | 0.01 | 0.13 | 0.16 | 0.02 |
| Unity Gold | 0.11 | 0.24 | 0.20 | 0.35 | 0.16 | 0.15 | 0.25 | 0.15 | 0.18 | 0.34 | 0.74 | 1.00 | 0.52 | 0.77 | 0.74 | 0.46 | 0.35 | 0.19 | 0.16 | 0.26 | 0.29 | 0.14 |
| Es Sider | 0.33 | 0.54 | 0.17 | 0.75 | 0.44 | 0.03 | 0.69 | 0.06 | 0.45 | 0.24 | 0.26 | 0.52 | 1.00 | 0.50 | 0.26 | 0.93 | 0.43 | 0.58 | 0.38 | 0.49 | 0.46 | 0.32 |
| Arab L | 0.24 | 0.28 | 0.20 | 0.40 | 0.11 | 0.22 | 0.23 | 0.18 | 0.11 | 0.48 | 0.72 | 0.77 | 0.50 | 1.00 | 0.72 | 0.44 | 0.53 | 0.24 | 0.11 | 0.32 | 0.36 | 0.09 |
| Tartaruga | 0.11 | 0.12 | 0.13 | 0.13 | 0.02 | 0.24 | 0.02 | 0.21 | 0.02 | 0.51 | 1.00 | 0.74 | 0.26 | 0.72 | 1.00 | 0.21 | 0.55 | 0.03 | 0.01 | 0.13 | 0.16 | 0.02 |
| Rhemoura | 0.27 | 0.50 | 0.13 | 0.69 | 0.45 | 0.01 | 0.70 | 0.05 | 0.46 | 0.20 | 0.21 | 0.46 | 0.93 | 0.44 | 0.21 | 1.00 | 0.48 | 0.57 | 0.39 | 0.43 | 0.40 | 0.33 |
| Bouri | 0.32 | 0.24 | 0.06 | 0.38 | 0.12 | 0.13 | 0.22 | 0.12 | 0.08 | 0.54 | 0.55 | 0.35 | 0.43 | 0.53 | 0.55 | 0.48 | 1.00 | 0.30 | 0.09 | 0.28 | 0.29 | 0.04 |
| SBN | 0.51 | 0.73 | 0.16 | 0.67 | 0.55 | 0.18 | 0.70 | 0.15 | 0.48 | 0.27 | 0.03 | 0.19 | 0.58 | 0.24 | 0.03 | 0.57 | 0.30 | 1.00 | 0.41 | 0.69 | 0.65 | 0.32 |
| IBN | 0.38 | 0.27 | 0.52 | 0.35 | 0.68 | 0.47 | 0.55 | 0.51 | 0.88 | 0.14 | 0.01 | 0.16 | 0.38 | 0.11 | 0.01 | 0.39 | 0.09 | 0.41 | 1.00 | 0.12 | 0.11 | 0.85 |
| SBN/IBN | 0.60 | 0.77 | 0.34 | 0.63 | 0.36 | 0.26 | 0.52 | 0.26 | 0.21 | 0.42 | 0.13 | 0.26 | 0.49 | 0.32 | 0.13 | 0.43 | 0.28 | 0.69 | 0.12 | 1.00 | 0.87 | 0.10 |
| Sa | 0.59 | 0.77 | 0.35 | 0.60 | 0.27 | 0.28 | 0.46 | 0.32 | 0.18 | 0.50 | 0.16 | 0.29 | 0.46 | 0.36 | 0.16 | 0.40 | 0.29 | 0.65 | 0.11 | 0.87 | 1.00 | 0.07 |
| Amperage | 0.38 | 0.23 | 0.63 | 0.31 | 0.68 | 0.56 | 0.51 | 0.56 | 0.80 | 0.15 | 0.02 | 0.14 | 0.32 | 0.09 | 0.02 | 0.33 | 0.04 | 0.32 | 0.85 | 0.10 | 0.07 | 1.00 |
| υ | KEBCO | Sver-Drup | CPC | Basra M | Arab H | Basra H | Azeri L | TEN | ITR | HELM | GOSM | Unity Gold | Es Sider | Arab L | Tarta-Ruga | Rhe-Moura | Bouri | SBN | IBN | SBN/IBN | Sa | Ampe-Rage |
|---|---|---|---|---|---|---|---|---|---|---|---|---|---|---|---|---|---|---|---|---|---|---|
| KEBCO | 0.00 | 0.48 | 0.45 | 0.36 | 0.54 | 0.31 | 0.51 | 0.46 | 0.65 | 0.26 | 0.05 | 0.29 | 0.44 | 0.19 | 0.05 | 0.44 | 0.01 | 0.47 | 0.60 | 0.37 | 0.39 | 0.60 |
| Sverdrup | 0.48 | 0.00 | 0.71 | 0.32 | 0.62 | 0.65 | 0.42 | 0.60 | 0.61 | 0.18 | 0.05 | 0.18 | 0.24 | 0.16 | 0.05 | 0.23 | 0.11 | 0.24 | 0.70 | 0.21 | 0.20 | 0.74 |
| CPC | 0.45 | 0.71 | 0.00 | 0.60 | 0.49 | 0.08 | 0.65 | 0.26 | 0.52 | 0.26 | 0.03 | 0.21 | 0.60 | 0.23 | 0.03 | 0.58 | 0.26 | 0.82 | 0.46 | 0.65 | 0.63 | 0.35 |
| Basra M | 0.36 | 0.32 | 0.60 | 0.00 | 0.43 | 0.57 | 0.19 | 0.68 | 0.48 | 0.32 | 0.08 | 0.11 | 0.10 | 0.09 | 0.08 | 0.11 | 0.04 | 0.23 | 0.54 | 0.26 | 0.29 | 0.59 |
| Arab H | 0.54 | 0.62 | 0.49 | 0.43 | 0.00 | 0.39 | 0.29 | 0.56 | 0.28 | 0.60 | 0.14 | 0.24 | 0.32 | 0.32 | 0.14 | 0.26 | 0.22 | 0.42 | 0.29 | 0.62 | 0.71 | 0.30 |
| Basra H | 0.31 | 0.65 | 0.08 | 0.57 | 0.39 | 0.00 | 0.59 | 0.20 | 0.45 | 0.28 | 0.06 | 0.23 | 0.60 | 0.24 | 0.06 | 0.56 | 0.21 | 0.66 | 0.38 | 0.58 | 0.57 | 0.29 |
| Azeri L | 0.51 | 0.42 | 0.65 | 0.19 | 0.29 | 0.59 | 0.00 | 0.72 | 0.36 | 0.47 | 0.15 | 0.17 | 0.09 | 0.20 | 0.15 | 0.03 | 0.12 | 0.27 | 0.42 | 0.45 | 0.51 | 0.47 |
| TEN | 0.46 | 0.60 | 0.26 | 0.68 | 0.56 | 0.20 | 0.72 | 0.00 | 0.43 | 0.17 | 0.06 | 0.23 | 0.60 | 0.24 | 0.06 | 0.57 | 0.22 | 0.72 | 0.37 | 0.62 | 0.56 | 0.32 |
| ITR | 0.65 | 0.61 | 0.52 | 0.48 | 0.28 | 0.45 | 0.36 | 0.43 | 0.00 | 0.49 | 0.14 | 0.23 | 0.31 | 0.32 | 0.14 | 0.25 | 0.25 | 0.50 | 0.10 | 0.77 | 0.80 | 0.18 |
| HELM | 0.26 | 0.18 | 0.26 | 0.32 | 0.60 | 0.28 | 0.47 | 0.17 | 0.49 | 0.00 | 0.01 | 0.12 | 0.33 | 0.10 | 0.01 | 0.32 | 0.10 | 0.35 | 0.49 | 0.20 | 0.13 | 0.48 |
| GOSM | 0.05 | 0.05 | 0.03 | 0.08 | 0.14 | 0.06 | 0.15 | 0.06 | 0.14 | 0.01 | 0.00 | 0.01 | 0.07 | 0.01 | 0.00 | 0.07 | 0.03 | 0.13 | 0.15 | 0.02 | 0.00 | 0.14 |
| Unity Gold | 0.29 | 0.18 | 0.21 | 0.11 | 0.24 | 0.23 | 0.17 | 0.23 | 0.23 | 0.12 | 0.01 | 0.00 | 0.07 | 0.02 | 0.01 | 0.08 | 0.09 | 0.22 | 0.25 | 0.15 | 0.12 | 0.26 |
| Es Sider | 0.44 | 0.24 | 0.60 | 0.10 | 0.32 | 0.60 | 0.09 | 0.60 | 0.31 | 0.33 | 0.07 | 0.07 | 0.00 | 0.10 | 0.07 | 0.01 | 0.13 | 0.20 | 0.38 | 0.27 | 0.31 | 0.44 |
| Arab L | 0.19 | 0.16 | 0.23 | 0.09 | 0.32 | 0.24 | 0.20 | 0.24 | 0.32 | 0.10 | 0.01 | 0.02 | 0.10 | 0.00 | 0.01 | 0.12 | 0.05 | 0.19 | 0.31 | 0.11 | 0.06 | 0.33 |
| Tartaruga | 0.05 | 0.05 | 0.03 | 0.08 | 0.14 | 0.06 | 0.15 | 0.06 | 0.14 | 0.01 | 0.00 | 0.01 | 0.07 | 0.01 | 0.00 | 0.07 | 0.03 | 0.13 | 0.15 | 0.02 | 0.00 | 0.14 |
| Rhemoura | 0.44 | 0.23 | 0.58 | 0.11 | 0.26 | 0.56 | 0.03 | 0.57 | 0.25 | 0.32 | 0.07 | 0.08 | 0.01 | 0.12 | 0.07 | 0.00 | 0.13 | 0.15 | 0.32 | 0.28 | 0.32 | 0.38 |
| Bouri | 0.01 | 0.11 | 0.26 | 0.04 | 0.22 | 0.21 | 0.12 | 0.22 | 0.25 | 0.10 | 0.03 | 0.09 | 0.13 | 0.05 | 0.03 | 0.13 | 0.00 | 0.04 | 0.24 | 0.05 | 0.05 | 0.29 |
| SBN | 0.47 | 0.24 | 0.82 | 0.23 | 0.42 | 0.66 | 0.27 | 0.72 | 0.50 | 0.35 | 0.13 | 0.22 | 0.20 | 0.19 | 0.13 | 0.15 | 0.04 | 0.00 | 0.57 | 0.29 | 0.33 | 0.65 |
| IBN | 0.60 | 0.70 | 0.46 | 0.54 | 0.29 | 0.38 | 0.42 | 0.37 | 0.10 | 0.49 | 0.15 | 0.25 | 0.38 | 0.31 | 0.15 | 0.32 | 0.24 | 0.57 | 0.00 | 0.87 | 0.87 | 0.13 |
| SBN/IBN | 0.37 | 0.21 | 0.65 | 0.26 | 0.62 | 0.58 | 0.45 | 0.62 | 0.77 | 0.20 | 0.02 | 0.15 | 0.27 | 0.11 | 0.02 | 0.28 | 0.05 | 0.29 | 0.87 | 0.00 | 0.11 | 0.88 |
| Amperage | 0.60 | 0.74 | 0.35 | 0.59 | 0.30 | 0.29 | 0.47 | 0.32 | 0.18 | 0.48 | 0.14 | 0.26 | 0.44 | 0.33 | 0.14 | 0.38 | 0.29 | 0.65 | 0.13 | 0.88 | 0.91 | 0.00 |
| μ | KEBCO | Sver-Drup | CPC | Basra M | Arab H | Basra H | Azeri L | TEN | ITR | HELM | SBN | IBN | SBN/IBN | Sa | Ampe-Rage | K-Heat T-101 | K-Heat T-102 | K-Heat T-109 | K-Heat T-110 |
|---|---|---|---|---|---|---|---|---|---|---|---|---|---|---|---|---|---|---|---|
| KEBCO | 1.00 | 0.38 | 0.73 | 0.70 | 0.74 | 0.79 | 0.77 | 0.26 | 0.44 | 0.03 | 0.46 | 0.45 | 0.55 | 0.50 | 0.51 | 0.80 | 0.80 | 0.71 | 0.77 |
| Sverdrup | 0.38 | 1.00 | 0.40 | 0.40 | 0.33 | 0.32 | 0.36 | 0.45 | 0.27 | 0.50 | 0.71 | 0.23 | 0.72 | 0.78 | 0.24 | 0.37 | 0.34 | 0.36 | 0.33 |
| CPC | 0.73 | 0.40 | 1.00 | 0.78 | 0.89 | 0.86 | 0.90 | 0.08 | 0.43 | 0.03 | 0.49 | 0.43 | 0.53 | 0.38 | 0.55 | 0.87 | 0.88 | 0.84 | 0.88 |
| Basra M | 0.70 | 0.40 | 0.78 | 1.00 | 0.79 | 0.77 | 0.75 | 0.18 | 0.47 | 0.05 | 0.53 | 0.46 | 0.49 | 0.39 | 0.57 | 0.77 | 0.78 | 0.71 | 0.79 |
| Arab H | 0.74 | 0.33 | 0.89 | 0.79 | 1.00 | 0.81 | 0.82 | 0.17 | 0.53 | 0.02 | 0.51 | 0.53 | 0.46 | 0.32 | 0.58 | 0.81 | 0.82 | 0.84 | 0.84 |
| Basra H | 0.79 | 0.32 | 0.86 | 0.77 | 0.81 | 1.00 | 0.88 | 0.15 | 0.41 | 0.01 | 0.51 | 0.40 | 0.59 | 0.42 | 0.48 | 0.94 | 0.95 | 0.82 | 0.89 |
| Azeri L | 0.77 | 0.36 | 0.90 | 0.75 | 0.82 | 0.88 | 1.00 | 0.16 | 0.38 | 0.03 | 0.46 | 0.39 | 0.57 | 0.46 | 0.53 | 0.90 | 0.91 | 0.80 | 0.87 |
| TEN | 0.26 | 0.45 | 0.08 | 0.18 | 0.17 | 0.15 | 0.16 | 1.00 | 0.61 | 0.35 | 0.38 | 0.63 | 0.34 | 0.47 | 0.53 | 0.12 | 0.12 | 0.20 | 0.08 |
| ITR | 0.44 | 0.27 | 0.43 | 0.47 | 0.53 | 0.41 | 0.38 | 0.61 | 1.00 | 0.12 | 0.32 | 0.94 | 0.06 | 0.14 | 0.82 | 0.36 | 0.38 | 0.51 | 0.42 |
| HELM | 0.03 | 0.50 | 0.03 | 0.05 | 0.02 | 0.01 | 0.03 | 0.35 | 0.12 | 1.00 | 0.36 | 0.11 | 0.35 | 0.46 | 0.06 | 0.02 | 0.02 | 0.03 | 0.07 |
| SBN | 0.46 | 0.71 | 0.49 | 0.53 | 0.51 | 0.51 | 0.46 | 0.38 | 0.32 | 0.36 | 1.00 | 0.28 | 0.72 | 0.66 | 0.28 | 0.46 | 0.46 | 0.46 | 0.49 |
| IN | 0.45 | 0.23 | 0.43 | 0.46 | 0.53 | 0.40 | 0.39 | 0.63 | 0.94 | 0.11 | 0.28 | 1.00 | 0.02 | 0.13 | 0.84 | 0.35 | 0.37 | 0.51 | 0.42 |
| SBN/IBN | 0.55 | 0.72 | 0.53 | 0.49 | 0.46 | 0.59 | 0.57 | 0.34 | 0.06 | 0.35 | 0.72 | 0.02 | 1.00 | 0.82 | 0.13 | 0.61 | 0.60 | 0.47 | 0.52 |
| Sa | 0.50 | 0.78 | 0.38 | 0.39 | 0.32 | 0.42 | 0.46 | 0.47 | 0.14 | 0.46 | 0.66 | 0.13 | 0.82 | 1.00 | 0.15 | 0.45 | 0.45 | 0.34 | 0.38 |
| Amperage | 0.51 | 0.24 | 0.55 | 0.57 | 0.58 | 0.48 | 0.53 | 0.53 | 0.82 | 0.06 | 0.28 | 0.84 | 0.13 | 0.15 | 1.00 | 0.47 | 0.47 | 0.62 | 0.50 |
| K-heat T-101 | 0.80 | 0.37 | 0.87 | 0.77 | 0.81 | 0.94 | 0.90 | 0.12 | 0.36 | 0.02 | 0.46 | 0.35 | 0.61 | 0.45 | 0.47 | 1.00 | 0.97 | 0.83 | 0.87 |
| K-heat T-102 | 0.80 | 0.34 | 0.88 | 0.78 | 0.82 | 0.95 | 0.91 | 0.12 | 0.38 | 0.02 | 0.46 | 0.37 | 0.60 | 0.45 | 0.47 | 0.97 | 1.00 | 0.84 | 0.89 |
| K-heat T-109 | 0.71 | 0.36 | 0.84 | 0.71 | 0.84 | 0.82 | 0.80 | 0.20 | 0.51 | 0.03 | 0.46 | 0.51 | 0.47 | 0.34 | 0.62 | 0.83 | 0.84 | 1.00 | 0.80 |
| K-heat T-110 | 0.77 | 0.33 | 0.88 | 0.79 | 0.84 | 0.89 | 0.87 | 0.08 | 0.42 | 0.07 | 0.49 | 0.42 | 0.52 | 0.38 | 0.50 | 0.87 | 0.89 | 0.80 | 1.00 |
| ν | KEBCO | Sver-Drup | CPC | Basra M | Arab H | Basra H | Azeri L | TEN | ITR | HELM | SBN | IBN | SBN/IBN | Sa | Ampe-Rage | K-Heat T-101 | K-Heat T-102 | K-Heat T-109 | K-Heat T-110 |
|---|---|---|---|---|---|---|---|---|---|---|---|---|---|---|---|---|---|---|---|
| KEBCO | 0.00 | 0.55 | 0.23 | 0.24 | 0.23 | 0.19 | 0.20 | 0.70 | 0.53 | 0.42 | 0.50 | 0.53 | 0.42 | 0.44 | 0.47 | 0.16 | 0.16 | 0.27 | 0.16 |
| Sverdrup | 0.55 | 0.00 | 0.54 | 0.50 | 0.61 | 0.62 | 0.58 | 0.47 | 0.66 | 0.01 | 0.21 | 0.71 | 0.23 | 0.14 | 0.69 | 0.58 | 0.59 | 0.57 | 0.55 |
| CPC | 0.23 | 0.54 | 0.00 | 0.17 | 0.08 | 0.12 | 0.07 | 0.88 | 0.53 | 0.42 | 0.47 | 0.55 | 0.45 | 0.56 | 0.42 | 0.09 | 0.08 | 0.13 | 0.04 |
| Basra M | 0.24 | 0.50 | 0.17 | 0.00 | 0.17 | 0.19 | 0.19 | 0.75 | 0.47 | 0.38 | 0.41 | 0.50 | 0.46 | 0.54 | 0.38 | 0.17 | 0.17 | 0.24 | 0.11 |
| Arab H | 0.23 | 0.61 | 0.08 | 0.17 | 0.00 | 0.18 | 0.16 | 0.80 | 0.44 | 0.44 | 0.46 | 0.46 | 0.53 | 0.65 | 0.40 | 0.16 | 0.14 | 0.14 | 0.09 |
| Basra H | 0.19 | 0.62 | 0.12 | 0.19 | 0.18 | 0.00 | 0.10 | 0.82 | 0.57 | 0.44 | 0.47 | 0.60 | 0.40 | 0.53 | 0.51 | 0.03 | 0.03 | 0.17 | 0.05 |
| Azeri L | 0.20 | 0.58 | 0.07 | 0.19 | 0.16 | 0.10 | 0.00 | 0.82 | 0.59 | 0.42 | 0.52 | 0.59 | 0.41 | 0.48 | 0.45 | 0.07 | 0.07 | 0.17 | 0.06 |
| TEN | 0.70 | 0.47 | 0.88 | 0.75 | 0.80 | 0.82 | 0.82 | 0.00 | 0.35 | 0.07 | 0.58 | 0.34 | 0.62 | 0.46 | 0.44 | 0.82 | 0.82 | 0.77 | 0.83 |
| ITR | 0.53 | 0.66 | 0.53 | 0.47 | 0.44 | 0.57 | 0.59 | 0.35 | 0.00 | 0.34 | 0.64 | 0.04 | 0.92 | 0.82 | 0.16 | 0.60 | 0.59 | 0.47 | 0.53 |
| HELM | 0.42 | 0.01 | 0.42 | 0.38 | 0.44 | 0.44 | 0.42 | 0.07 | 0.34 | 0.00 | 0.08 | 0.34 | 0.11 | 0.03 | 0.40 | 0.44 | 0.44 | 0.42 | 0.44 |
| SBN | 0.50 | 0.21 | 0.47 | 0.41 | 0.46 | 0.47 | 0.52 | 0.58 | 0.64 | 0.08 | 0.00 | 0.70 | 0.25 | 0.28 | 0.68 | 0.49 | 0.49 | 0.51 | 0.44 |
| IN | 0.53 | 0.71 | 0.55 | 0.50 | 0.46 | 0.60 | 0.59 | 0.34 | 0.04 | 0.34 | 0.70 | 0.00 | 0.97 | 0.82 | 0.15 | 0.62 | 0.61 | 0.48 | 0.53 |
| SBN/IBN | 0.42 | 0.23 | 0.45 | 0.46 | 0.53 | 0.40 | 0.41 | 0.62 | 0.92 | 0.11 | 0.25 | 0.97 | 0.00 | 0.13 | 0.85 | 0.36 | 0.37 | 0.51 | 0.42 |
| Sa | 0.44 | 0.14 | 0.56 | 0.54 | 0.65 | 0.53 | 0.48 | 0.46 | 0.82 | 0.03 | 0.28 | 0.82 | 0.13 | 0.00 | 0.80 | 0.48 | 0.50 | 0.61 | 0.53 |
| Amperage | 0.47 | 0.69 | 0.42 | 0.38 | 0.40 | 0.51 | 0.45 | 0.44 | 0.16 | 0.40 | 0.68 | 0.15 | 0.85 | 0.80 | 0.00 | 0.49 | 0.49 | 0.36 | 0.43 |
| K-heat T-101 | 0.16 | 0.58 | 0.09 | 0.17 | 0.16 | 0.03 | 0.07 | 0.82 | 0.60 | 0.44 | 0.49 | 0.62 | 0.36 | 0.48 | 0.49 | 0.00 | 0.00 | 0.13 | 0.05 |
| K-heat T-102 | 0.16 | 0.59 | 0.08 | 0.17 | 0.14 | 0.03 | 0.07 | 0.82 | 0.59 | 0.44 | 0.49 | 0.61 | 0.37 | 0.50 | 0.49 | 0.00 | 0.00 | 0.12 | 0.04 |
| K-heat T-109 | 0.27 | 0.57 | 0.13 | 0.24 | 0.14 | 0.17 | 0.17 | 0.77 | 0.47 | 0.42 | 0.51 | 0.48 | 0.51 | 0.61 | 0.36 | 0.13 | 0.12 | 0.00 | 0.13 |
| K-heat T-110 | 0.16 | 0.55 | 0.04 | 0.11 | 0.09 | 0.05 | 0.06 | 0.83 | 0.53 | 0.44 | 0.44 | 0.53 | 0.42 | 0.53 | 0.43 | 0.05 | 0.04 | 0.13 | 0.00 |
| Characteristics | Deposit from the Floating Head of T-101, CDU-2, 13.11.2024—Sample Before Ignition of Organics | Deposit from the Floating Head of T-101, CDU-2, 13.11.2024—After Ignition of Organics at 650 °C | Deposit Taken from the Internal Tubes of T-101, CDU-2, 15.11.2024—Before Ignition of Organics | Deposit Taken from the Internal Tubes of T-101, CDU-2, 15.11.2024—After Ignition at 650 °C |
|---|---|---|---|---|
| Loss on ignition at 650 °C (3 h), % | 46.5 | 76.5 | ||
| Soluble in toluene, % | 42.9 | 72.8 | ||
| Soluble in n-heptane, % | 28.6 | 63.6 | ||
| Element composition | 42 | |||
| C, % | 22.3 | 52.0 | ||
| H, % | 3.1 | 6.9 | ||
| N, % | 0.2 | 0.2 | ||
| H/C atomic ratio | 1.7 | 1.6 | ||
| Fe, % | 19.7 | 34.4 | 11.9 | 27.2 |
| S, % | 14.2 | 7.5 | 12.7 | 14.8 |
| Ca, % | 3.2 | 4.7 | 3.7 | 8.7 |
| Si, % | 2.3 | 14.4 | 0.9 | 6.7 |
| Cl, % | 1.6 | 0.1 | 7.0 | 6.3 |
| Al, % | 0.6 | 5.5 | 0.2 | 1.8 |
| La, % | 0.5 | 0.8 | 0.1 | 0.2 |
| Ba, % | 0.5 | 0.7 | 0.8 | 2.0 |
| Zn, % | 0.3 | 0.5 | 0.3 | 0.5 |
| K, % | 0.3 | 0.6 | 0.3 | 0.7 |
| V, % | 0.2 | 0.6 | 0.2 | 0.5 |
| Ti, % | 0.2 | 0.4 | 0.1 | 0.3 |
| Mo, % | 0.2 | 0.1 | 0.2 | 0.1 |
| Mn, % | 0.1 | 0.2 | 0.1 | 0.2 |
| Cr, % | 0.1 | 0.2 | 0.0 | 0.1 |
| Cu, % | 0.1 | 0.2 | 0.1 | 0.2 |
| Ni, % | 0.1 | 0.2 | 0.1 | 0.2 |
| Pb, % | 0.1 | 0.1 | 0.5 | 0.4 |
| Na, % | 0.1 | 1.1 | 0.2 | 6.0 |
| Sr, % | 0.1 | 0.1 | 0.1 | 0.3 |
| Mg, % | 0.1 | 0.5 | 0.1 | 1.1 |
| P, % | 0.0 | 0.1 | 0.0 | 0.2 |
Disclaimer/Publisher’s Note: The statements, opinions and data contained in all publications are solely those of the individual author(s) and contributor(s) and not of MDPI and/or the editor(s). MDPI and/or the editor(s) disclaim responsibility for any injury to people or property resulting from any ideas, methods, instructions or products referred to in the content. |
© 2025 by the authors. Licensee MDPI, Basel, Switzerland. This article is an open access article distributed under the terms and conditions of the Creative Commons Attribution (CC BY) license (https://creativecommons.org/licenses/by/4.0/).
Share and Cite
Stratiev, D.; Shishkova, I.; Georgiev, G.; Dinkov, R.; Nedelchev, A.; Nikolova, R.; Veli, A.; Bureva, V.; Atanassov, K.; Berg, F.v.d.; et al. The Incompatibility Pitfall in Refining Opportunity Crude Oils. Processes 2025, 13, 593. https://doi.org/10.3390/pr13020593
Stratiev D, Shishkova I, Georgiev G, Dinkov R, Nedelchev A, Nikolova R, Veli A, Bureva V, Atanassov K, Berg Fvd, et al. The Incompatibility Pitfall in Refining Opportunity Crude Oils. Processes. 2025; 13(2):593. https://doi.org/10.3390/pr13020593
Chicago/Turabian StyleStratiev, Dicho, Ivelina Shishkova, Georgi Georgiev, Rosen Dinkov, Angel Nedelchev, Radoslava Nikolova, Anife Veli, Veselina Bureva, Krassimir Atanassov, Frans van den Berg, and et al. 2025. "The Incompatibility Pitfall in Refining Opportunity Crude Oils" Processes 13, no. 2: 593. https://doi.org/10.3390/pr13020593
APA StyleStratiev, D., Shishkova, I., Georgiev, G., Dinkov, R., Nedelchev, A., Nikolova, R., Veli, A., Bureva, V., Atanassov, K., Berg, F. v. d., Yordanov, D., & Toteva, V. (2025). The Incompatibility Pitfall in Refining Opportunity Crude Oils. Processes, 13(2), 593. https://doi.org/10.3390/pr13020593