Article

Mechanical Characteristic Analysis of Interphase Spacers in Double-Circuit Lines Under Ice-Shedding Jump Conditions

1
Hubei Key Laboratory of Disaster Prevention and Mitigation, China Three Gorges University, Yichang 443002, China
2
College of Civil Engineering and Architecture, China Three Gorges University, Yichang 443002, China
3
College of Electrical Engineering and New Energy, China Three Gorges University, Yichang 443002, China
4
College of Civil Engineering and Architecture, Wuhan Institute of Technology, Wuhan 430074, China
*
Author to whom correspondence should be addressed.
Processes 2025, 13(2), 591; https://doi.org/10.3390/pr13020591
Submission received: 25 December 2024 / Revised: 7 February 2025 / Accepted: 13 February 2025 / Published: 19 February 2025
(This article belongs to the Special Issue Clean Energy Systems—Current State and Future Perspectives)

Abstract

:
To investigate the force characteristics of phase spacers during ice-shedding galloping of transmission lines, a comprehensive finite element model for double-circuit lines on the same tower was developed. The analysis focused on the spacers’ suppression effect on galloping and the variation in their axial force. A solid finite element model of phase spacers was constructed, incorporating suspension fittings, ball eye links, and composite insulators. By using the axial force time history under galloping as excitation, the deformation and stress distribution of phase spacers, as well as stress changes in their connection fittings, were studied. The results revealed that phase spacers significantly suppress galloping, with a more pronounced effect on middle-phase conductors. Axial force fluctuates sharply due to galloping, but stabilizes over time, approaching a limit value. The ice-shedding galloping phenomenon impacts stress distribution, with the ball eye link being more susceptible to fracture. Although the ball-and-socket connection at the composite insulator stem may experience high bending stress, the overall stress distribution meets safety requirements, ensuring safe and stable transmission line operation.

1. Introduction

In the context of double-circuit overhead transmission lines, interphase spacers are crucial in mitigating the adverse effects of conductor galloping. Extreme weather conditions, particularly ice-shedding-induced conductor jumps, exacerbate dynamic stress loads on interphase spacers and accelerate fatigue accumulation, posing risks to long-term operational stability. Notable incidents include the 2015 galloping event in northern Henan Province, where interphase spacer failures led to conductor wear and compromised line safety, and the 2016 ice-shedding-induced faults in Xinjiang, highlighting the need for enhanced performance monitoring and protection [1,2].
Domestic and international scholars have conducted extensive research on the mechanical response of conductors and interphase spacers under ice-shedding conditions. G. McClure investigated dynamic effects on 110 kV transmission lines [3], while Nilson Barbieri used meteorological statistical methods to simulate ice-shedding events [4]. Hongnan Li analyzed dynamic responses under various span lengths and pulse loads [5], and Tianbao Wu demonstrated the vibration suppression performance of interphase spacers [6]. Zenghao Huang studied interphase distance variations and stress conditions during ice-shedding [7], and Hao Pan examined vibration responses under different ice-shedding scenarios [8]. He Zhu optimized interphase spacer configurations for DC ice-melting processes [9], and Anqi Zhou conducted wind tunnel experiments to investigate anti-galloping effectiveness [10]. Guanjun Fu used a galloping simulation model to analyze interval spacer effectiveness [11], and Fujiang Cui explored the effectiveness of different interval spacer arrangements through aerodynamic elastic model galloping experiments [12].
Recently, the fracture and failure of interphase spacers in complex environments have garnered attention [13,14]. Guochuang Lu analyzed stress distribution characteristics under extreme conditions [15], and Xiaohui Liu found that ball-end fittings and connections with composite insulators were prone to damage [16]. Studies have simulated additional stress generated by conductor vibration under wind load excitation and identified vulnerable components [17,18]. However, despite these advancements, the stress characteristics of interphase spacers during winter ice-shedding-induced conductor jumps remain unclear.
This study establishes finite element models to analyze ice-shedding suppression effects and axial force variations of interphase spacers under various ice-shedding scenarios. Based on these models, the mechanical and safety performance of interphase spacers under different conditions is evaluated, providing theoretical support for the safe operation and maintenance of overhead transmission lines.

2. Mechanical Model of Double-Circuit Transmission Lines on the Same Tower

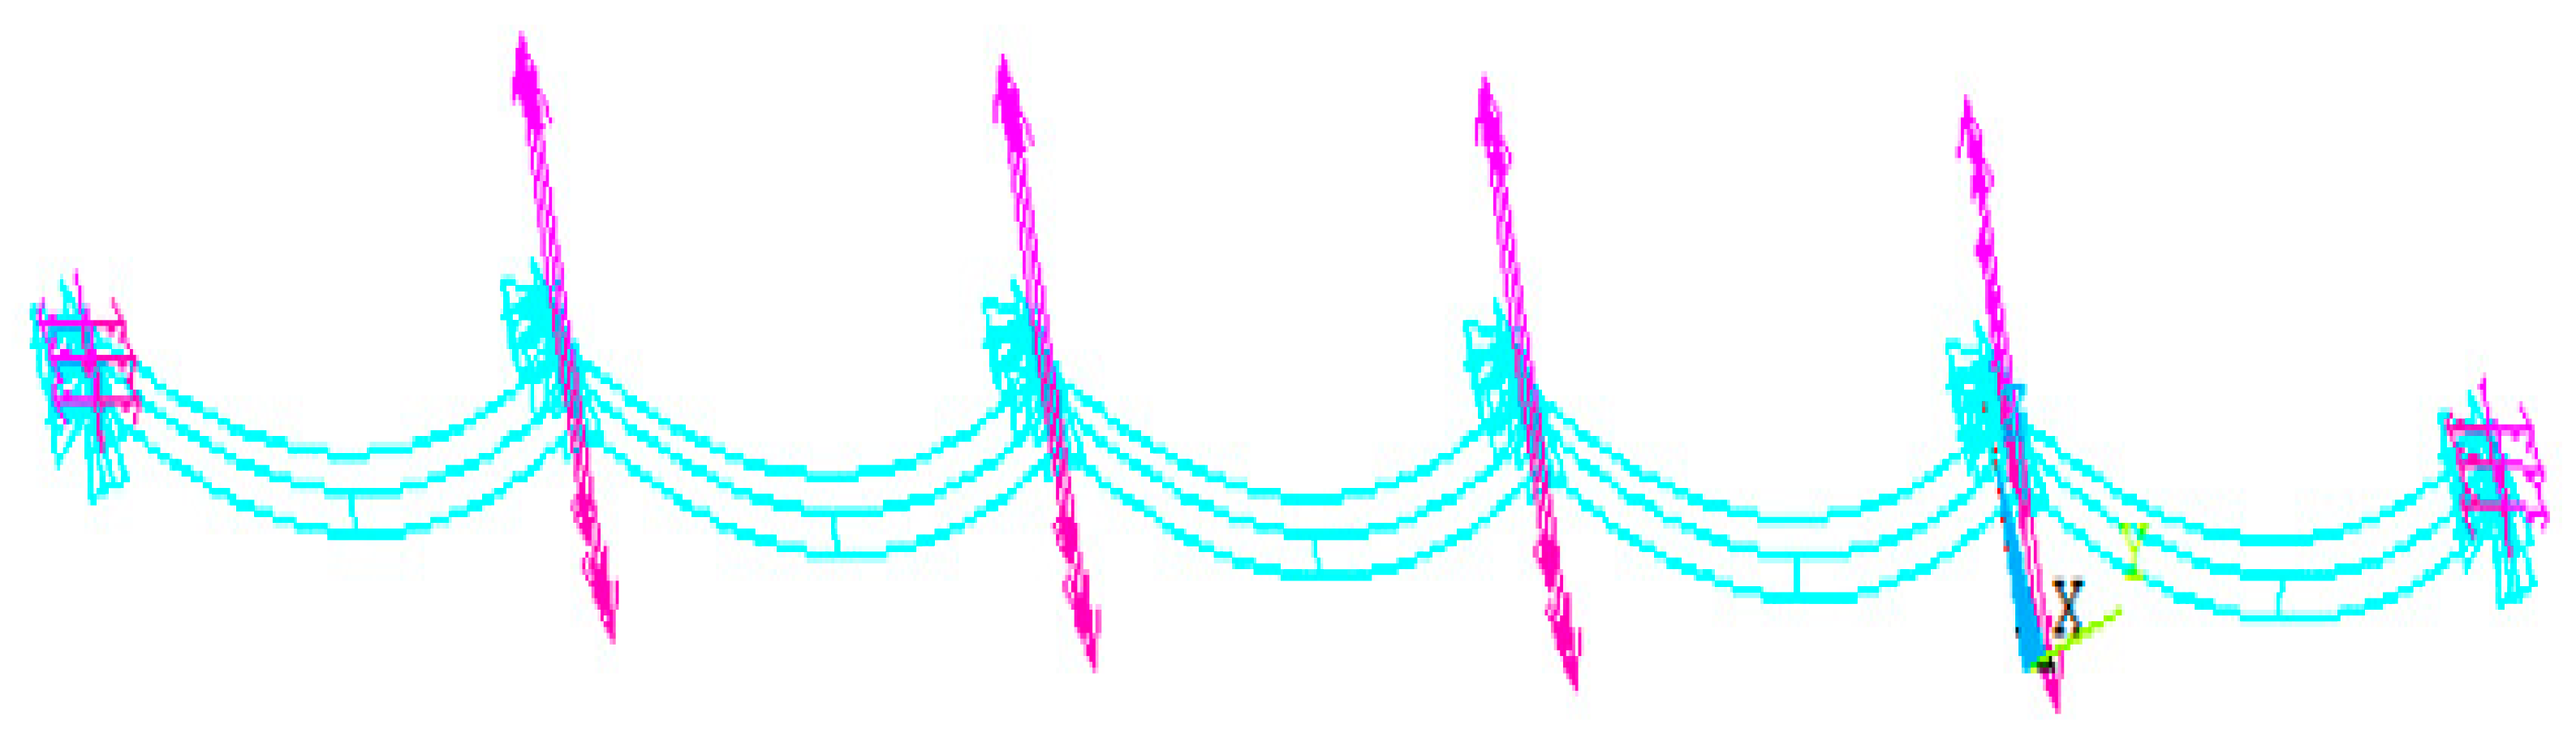
2.1. Finite Element Model of the Overall Transmission Line

A 220 kV double-circuit transmission line on the same tower is selected as the research object. The span length of the line is 500 m, and the conductor type is LGJ-400/50. Detailed parameters of the transmission line are shown in Table 1. The conductors are simulated using Link10 elements in finite element analysis software called ANSYS 2023R1. Based on the transmission line design, the conductor tension is set to 22,000 N. The vertical suspension height differences between the upper, middle, and lower phases are 6 m, with a horizontal offset of 1.0 m in the cross-arm direction. Each span of conductor and ground wire is divided into 100 elements, resulting in a total of 2000 elements for all conductor segments.
During the modeling of conductors in finite element software, initially, command streams are utilized to define global units and essential parameters, encompassing line-span, conductor tension, conductor suspension height difference, and horizontal offset in the cross-arm direction. These parameters provide foundational data for subsequent modeling. Subsequently, material properties are defined for the conductors, which are crucial for simulating their mechanical behavior. Considering that the actual shape of conductors is not a simple straight line but a curve influenced by various factors such as gravity and tension, a form-finding analysis is necessary. The primary objective of this analysis is to determine the equilibrium shape of the conductor under its weight and tension. This is typically achieved through iterative calculations, where self-weight and tension are first applied based on an initial assumed conductor shape, followed by the calculation of conductor deformation and internal force distribution. The conductor shape is then updated based on the calculation results, and this process is repeated until convergence criteria are met. In this case, a catenary model can be adopted as the initial assumption, and the finite element model of the conductor is continuously and automatically updated and corrected through iterative calculations, ultimately yielding a standard initial shape of the conductor after form-finding. To simulate conductor tension, corresponding forces are applied to the form-found conductor shape, with these forces evenly distributed according to the conductor tension and the number of elements. Meanwhile, based on actual conditions, the ends of the conductors are fixed to simulate the restraint conditions in actual lines. When meshing, a principle of dividing each conductor span into 100 elements is followed to ensure that the model can capture detailed stress distributions along the conductor. The total number of conductor elements in the entire model reached 2000, providing sufficient accuracy for analyzing the force conditions of the conductors. Finally, model solving and post-processing are conducted, resulting in the finite element model of the conductors. The finite element model of the conductor is shown in Figure 1.

2.2. Finite Element Theory of Conductor Ice-Shedding

When ice accreted on transmission lines detaches due to sudden temperature changes or external factors such as strong winds, the gravitational potential energy and the elastic potential energy stored in the conductors are instantaneously converted into the kinetic energy of the conductor’s motion. This process causes the conductor to bounce upward in a half-wave shape, forming the phenomenon known as “ice-shedding jump”.
During the model construction process, to simplify calculations and analysis, this study adopted the assumption of uniform ice coating. This assumption not only provides a more easily understandable benchmark scenario for the fundamental mechanisms of ice-shedding vibration, but also aids in revealing key aspects of interphase spacer performance. Indeed, ice distribution in actual environments often exhibits uneven characteristics due to various factors such as meteorological conditions, conductor material, diameter, wind speed, and wind direction. Research findings based on the uniform ice shedding assumption have laid a solid foundation for further exploring wire vibration and interphase spacer performance under uneven ice distribution scenarios, offering valuable references for related design optimizations. Future research can build upon this foundation to further refine the specific impacts of uneven ice distribution, with the aim of continuously enhancing the stability and safety of power systems.
The ice-shedding motion of transmission conductors follows the general form of the vibration differential equation, which is expressed as [19]:
M U + C U 1 + K U 2 = F ( T )
In Equation (1) M, C, K represent the mass matrix, damping matrix, and stiffness matrix, respectively; U, U1, U2 are the displacement, velocity, and acceleration vectors of the conductor during ice-shedding jump, respectively; and F(T) denotes the external force vector.
Before conducting finite element analysis (FEA) of conductor ice-shedding, the initial shape of the conductor under the action of self-weight alone must be established using the static iterative method. The pre-defined horizontal tension of the conductor is used as the convergence criterion to construct the model based on the conductor’s initial position, with the initial stress state also pre-defined. Under specific conditions, the equivalent unit weight of the conductor is applied to the model, and the parameters of the finite element model are iteratively updated to simulate the gradual deformation of the conductor under gravity alone. During this series of calculations, the conductor adjusts its shape under the combined action of gravity and the pre-defined initial stress until it reaches a state of static equilibrium, as described by:
[ K 0 + K 1 + K 2 ] { δ } = { P }
In Equation (2), K0, K1, and K2 represent the structural elastic stiffness matrix, the geometric stiffness matrix for large deformations, and the initial stress stiffness matrix, respectively. P is the equivalent nodal load vector due to self-weight, and δ is the nodal displacement vector.

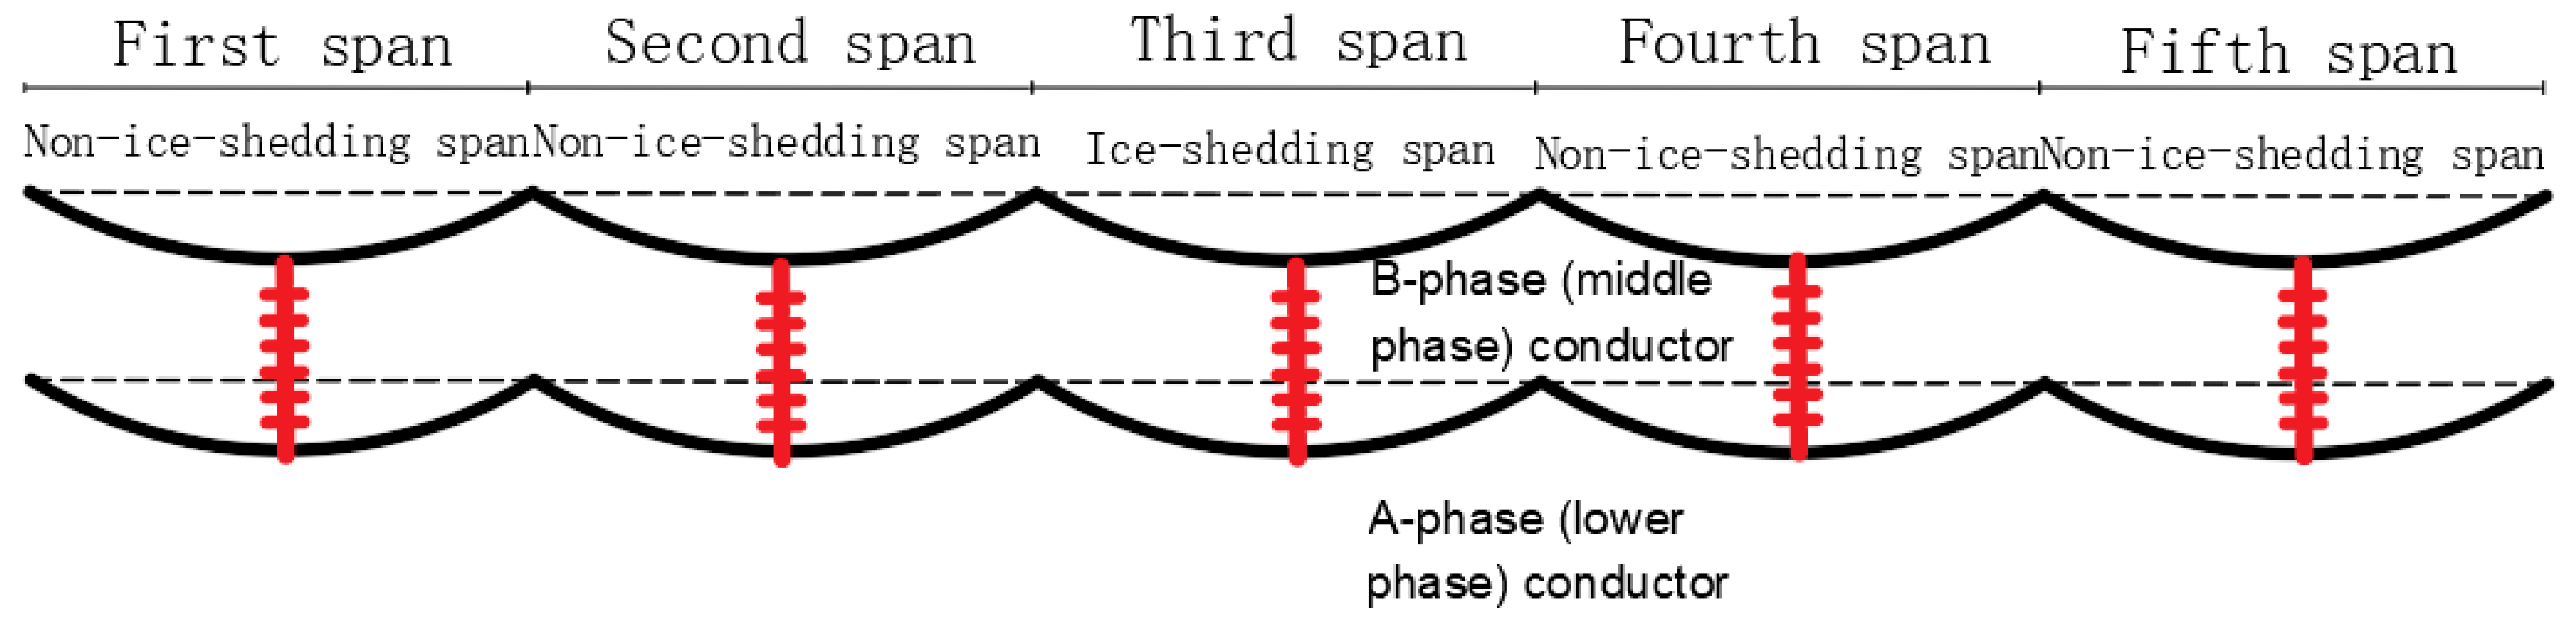
2.3. Icing and Ice-Shedding Configurations

The additional concentrated force method is adopted to simulate the icing elements. The load on the icing elements is calculated as follows [20]:
F = ρ g π b ( D + b ) L × 10 6 / Z
In Equation (3), ρ is the ice density, taken as 900 kg/m³; g is the gravitational acceleration (m/s²); D is the conductor diameter (mm); b is the ice thickness (mm); L is the conductor length (m); F is the load on the icing elements (N); and Z is the number of icing elements.
A 500 m continuous-span transmission line is selected for the calculations, with an ice thickness of 15 mm and 100% uniform ice shedding. Interphase spacer rods are installed in the spans of the Phase A (lower phase) and the Phase B (middle phase) conductors. Two working conditions are defined:
Condition 1: Ice shedding occurs on the Phase A conductor in the third span.
Condition 2: Ice shedding occurs on the Phase B conductor in the third span.
As shown in Figure 2, the jump heights of the conductors and the unbalanced tension at the suspension points under the two working conditions are calculated to analyze the suppression effect of interphase spacer rods during ice-shedding scenarios.

2.4. Mechanical Model of Interphase Spacer Rods

The interphase spacer rod used in this study is made of fiberglass-reinforced plastic (FRP) with a total length of 6000 mm, ensuring an effective insulation distance of 4000 mm. The diameter is designed to be 30 mm to meet specific insulation and support requirements.
Due to the significant slenderness ratio of the interphase spacer rod (typically exceeding 100), the structure is prone to instability under compressive loads given its low critical load. The maximum design compressive load Pmax and the Euler critical load Pcr can be expressed as follows:
P cr = π 2 E I / l 2
P m a x = P c r / n
In Equations (4) and (5), I is the moment of inertia of the interphase spacer rod’s cross-section, and n is the safety factor, typically taken as 2.5.
Within the context of nonlinear stability analysis, the inter-phase spacer maintains a certain load-bearing capacity, even in the post-buckling state. The literature adopts the initial post-buckling theory to deeply explore the load-bearing capacity of the spacer after it exceeds its critical compressive load, revealing that the load-bearing capacity of the composite insulating spacer increases as its lateral deflection grows. Notably, during the large deflection buckling deformation stage, even when the compressive load exceeds the critical value, the spacer still has significant potential for enhancing its load-bearing capacity [21].
When constructing the finite element model for the interphase spacer, the nonlinear spring element COMBIN39 is selected as the core element type due to its robust nonlinear capabilities. This element can flexibly simulate various complex mechanical responses, including the deformation and stress distribution characteristics of the interphase spacer under ice-shedding conditions. By assigning appropriate element stiffness to COMBIN39, it not only more accurately reflects the actual physical behavior of the interphase spacer but also effectively accelerates the convergence of the solution process, thereby enhancing the overall efficiency and accuracy of the simulation in the context of electrical engineering applications. The relationship between the compressive load and the longitudinal compression distance was precisely calibrated based on compression test data from the literature [22,23]. Given the high tensile strength of glass fiber material, typically reaching 240 kN, we assumed that the tensile section remained within the linear elastic range, strictly adhering to Hooke’s Law.

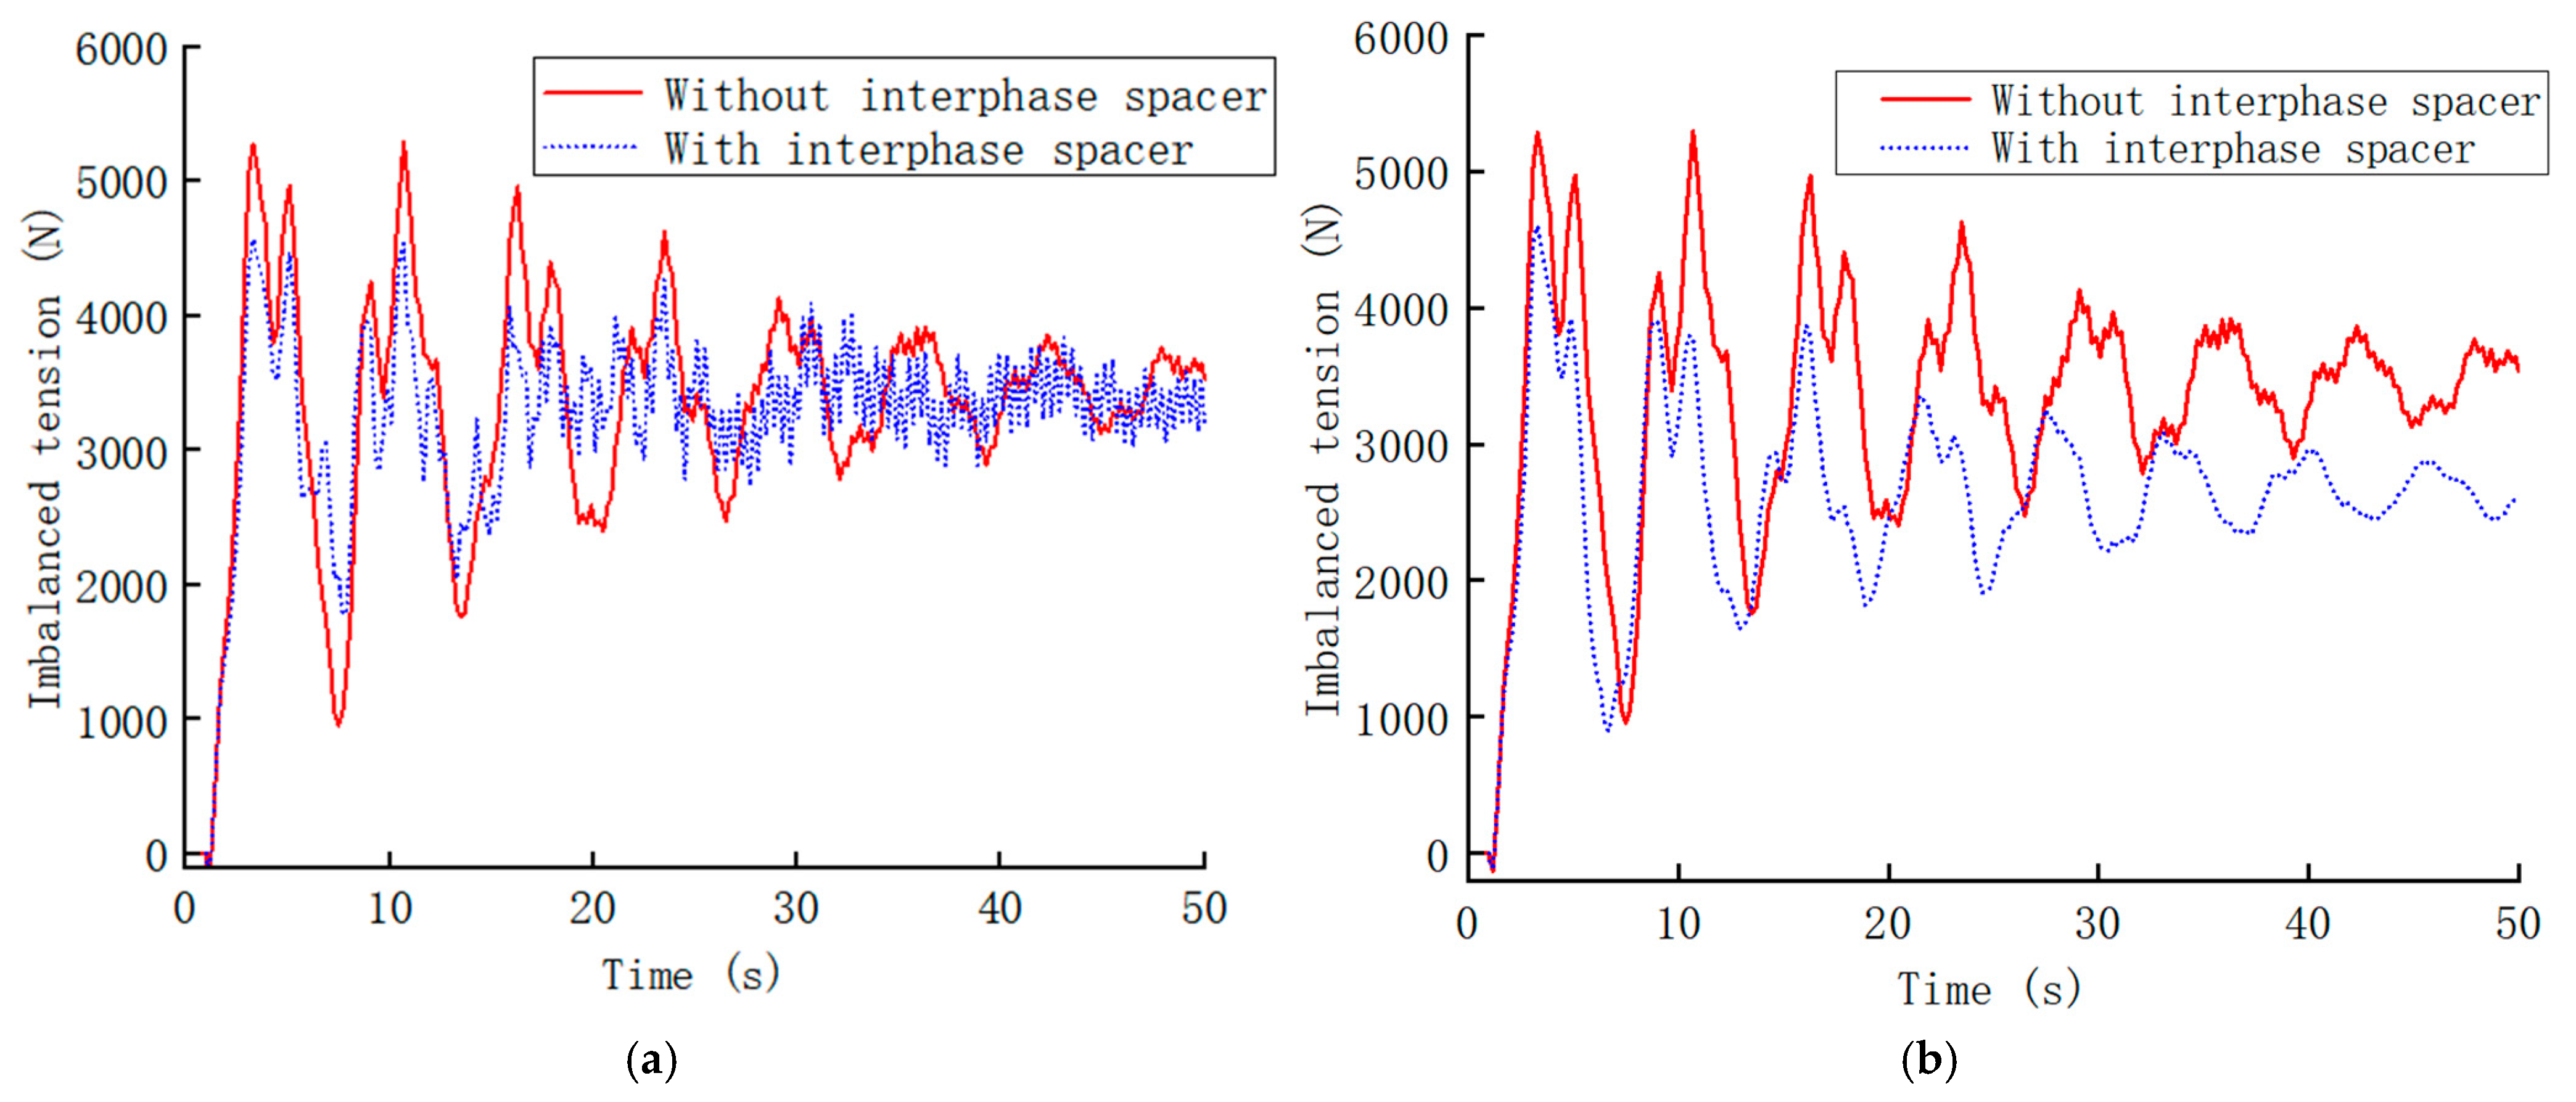
2.5. Analysis of Ice Shedding Suppression Effect by Interphase Spacer Rods

When ice shedding occurs on the Phase A (lower phase) conductor, while the Phase B (middle phase) conductor remains unaffected, the jump height of the Phase A conductor span before and after the installation of interphase spacer rods is shown in Figure 3a. Conversely, when the Phase B conductor undergoes ice-shedding and the Phase A conductor does not, the corresponding jump height changes before and after installation are shown in Figure 3b.
From Figure 3a, it is evident that without the interphase spacer rods, the Phase A conductor exhibits severe oscillations in ice-shedding jump height, gradually decaying. The maximum instantaneous jump height of the conductor reaches 15.20 m, stabilizing at approximately 6.60 m after 50 s. After installing the interphase spacer rods, the jump height is significantly reduced, with the maximum jump height decreasing to 11.84 m, achieving a suppression rate of 22.1%.
Figure 3b shows that without the interphase spacer rods, the Phase B conductor also experiences severe oscillations in ice-shedding jump height, gradually decaying. The maximum instantaneous jump height reaches 15.20 m, stabilizing at approximately 6.60 m after 50 s. With the installation of interphase spacer rods, the maximum jump height is reduced to 9.63 m, achieving a suppression rate of 36.7%. This demonstrates the significant effectiveness of interphase spacer rods in suppressing ice-shedding jumps in double-circuit lines on the same tower.
For the Phase A conductor experiencing ice shedding, with the Phase B conductor not affected, the imbalance tension at the suspension point before and after the installation of interphase spacer rods is shown in Figure 4a. Conversely, for the Phase B conductor experiencing ice shedding, with the Phase A conductor not affected, the imbalance tension at the suspension point is shown in Figure 4b.
From Figure 4a, it can be seen that without the interphase spacer rods, the imbalance tension at the suspension point of the Phase A conductor exhibits significant oscillations, gradually decaying over time. The maximum instantaneous imbalance tension reaches 5291.43 N. After installing the interphase spacer rods, the imbalance tension is significantly reduced, with the maximum tension decreasing to 4574.01 N, a reduction of 13.6%.
Figure 4b indicates that without the interphase spacer rods, the imbalance tension at the Phase B conductor’s suspension point also exhibits severe oscillations, gradually decaying. The maximum instantaneous imbalance tension reaches 5291.43 N. After the installation of interphase spacer rods, the imbalance tension decreases to 4598.53 N, a reduction of 13.1%. This demonstrates that installing interphase spacer rods effectively reduces imbalance tension during conductor ice shedding.
From this comprehensive analysis, it can be observed that the interphase spacer rods exhibit varying suppression effects under different phase conductor ice-shedding conditions. Specifically, the suppression effect on conductor jumps is more pronounced when the Phase B (middle phase) conductor undergoes ice shedding compared to the Phase A (lower phase) conductor. This difference arises because, during the ice shedding of the Phase B conductor, the interphase spacer rod is in a tensioned state. Due to its excellent tensile performance, the spacer rod remains stable under tension and is less prone to failure due to compressive imbalance. This mechanism results in a better suppression effect when the Phase B conductor sheds ice.
The axial forces of the interphase spacer rods under both conditions are extracted, and the time-history curves of axial forces are shown in Figure 5.
The figure presents the trend of axial force variation over time within a specific period for an interphase spacer. The horizontal axis represents time, while the vertical axis signifies the axial force value. Each point on the curve corresponds to the axial force measured at a specific time point for the interphase spacer. The magnitude of these axial force values directly reflects the mechanical stress borne by the interphase spacer, serving as a crucial indicator for assessing its structural safety and durability.
From Figure 5, when the Phase A conductor experiences ice-shedding jumps and the Phase B conductor does not, the axial force of the interphase spacer rod undergoes significant changes, fluctuating back and forth from bottom to top. This phenomenon is due to the ice-shedding jump effect of the Phase A conductor. Over time, after significant initial fluctuations, the axial force gradually stabilizes, with a maximum absolute value of 1029.31 N, indicating that the maximum absolute axial force does not exceed the limit Pmax.
When the Phase B conductor experiences ice-shedding jumps and the Phase A conductor does not, the axial force of the interphase spacer rod surges and then stabilizes over time, with a maximum absolute value of 1273.77 N. When the axial force approaches the limit Pmax, the force growth halts, maintaining near the limit value.

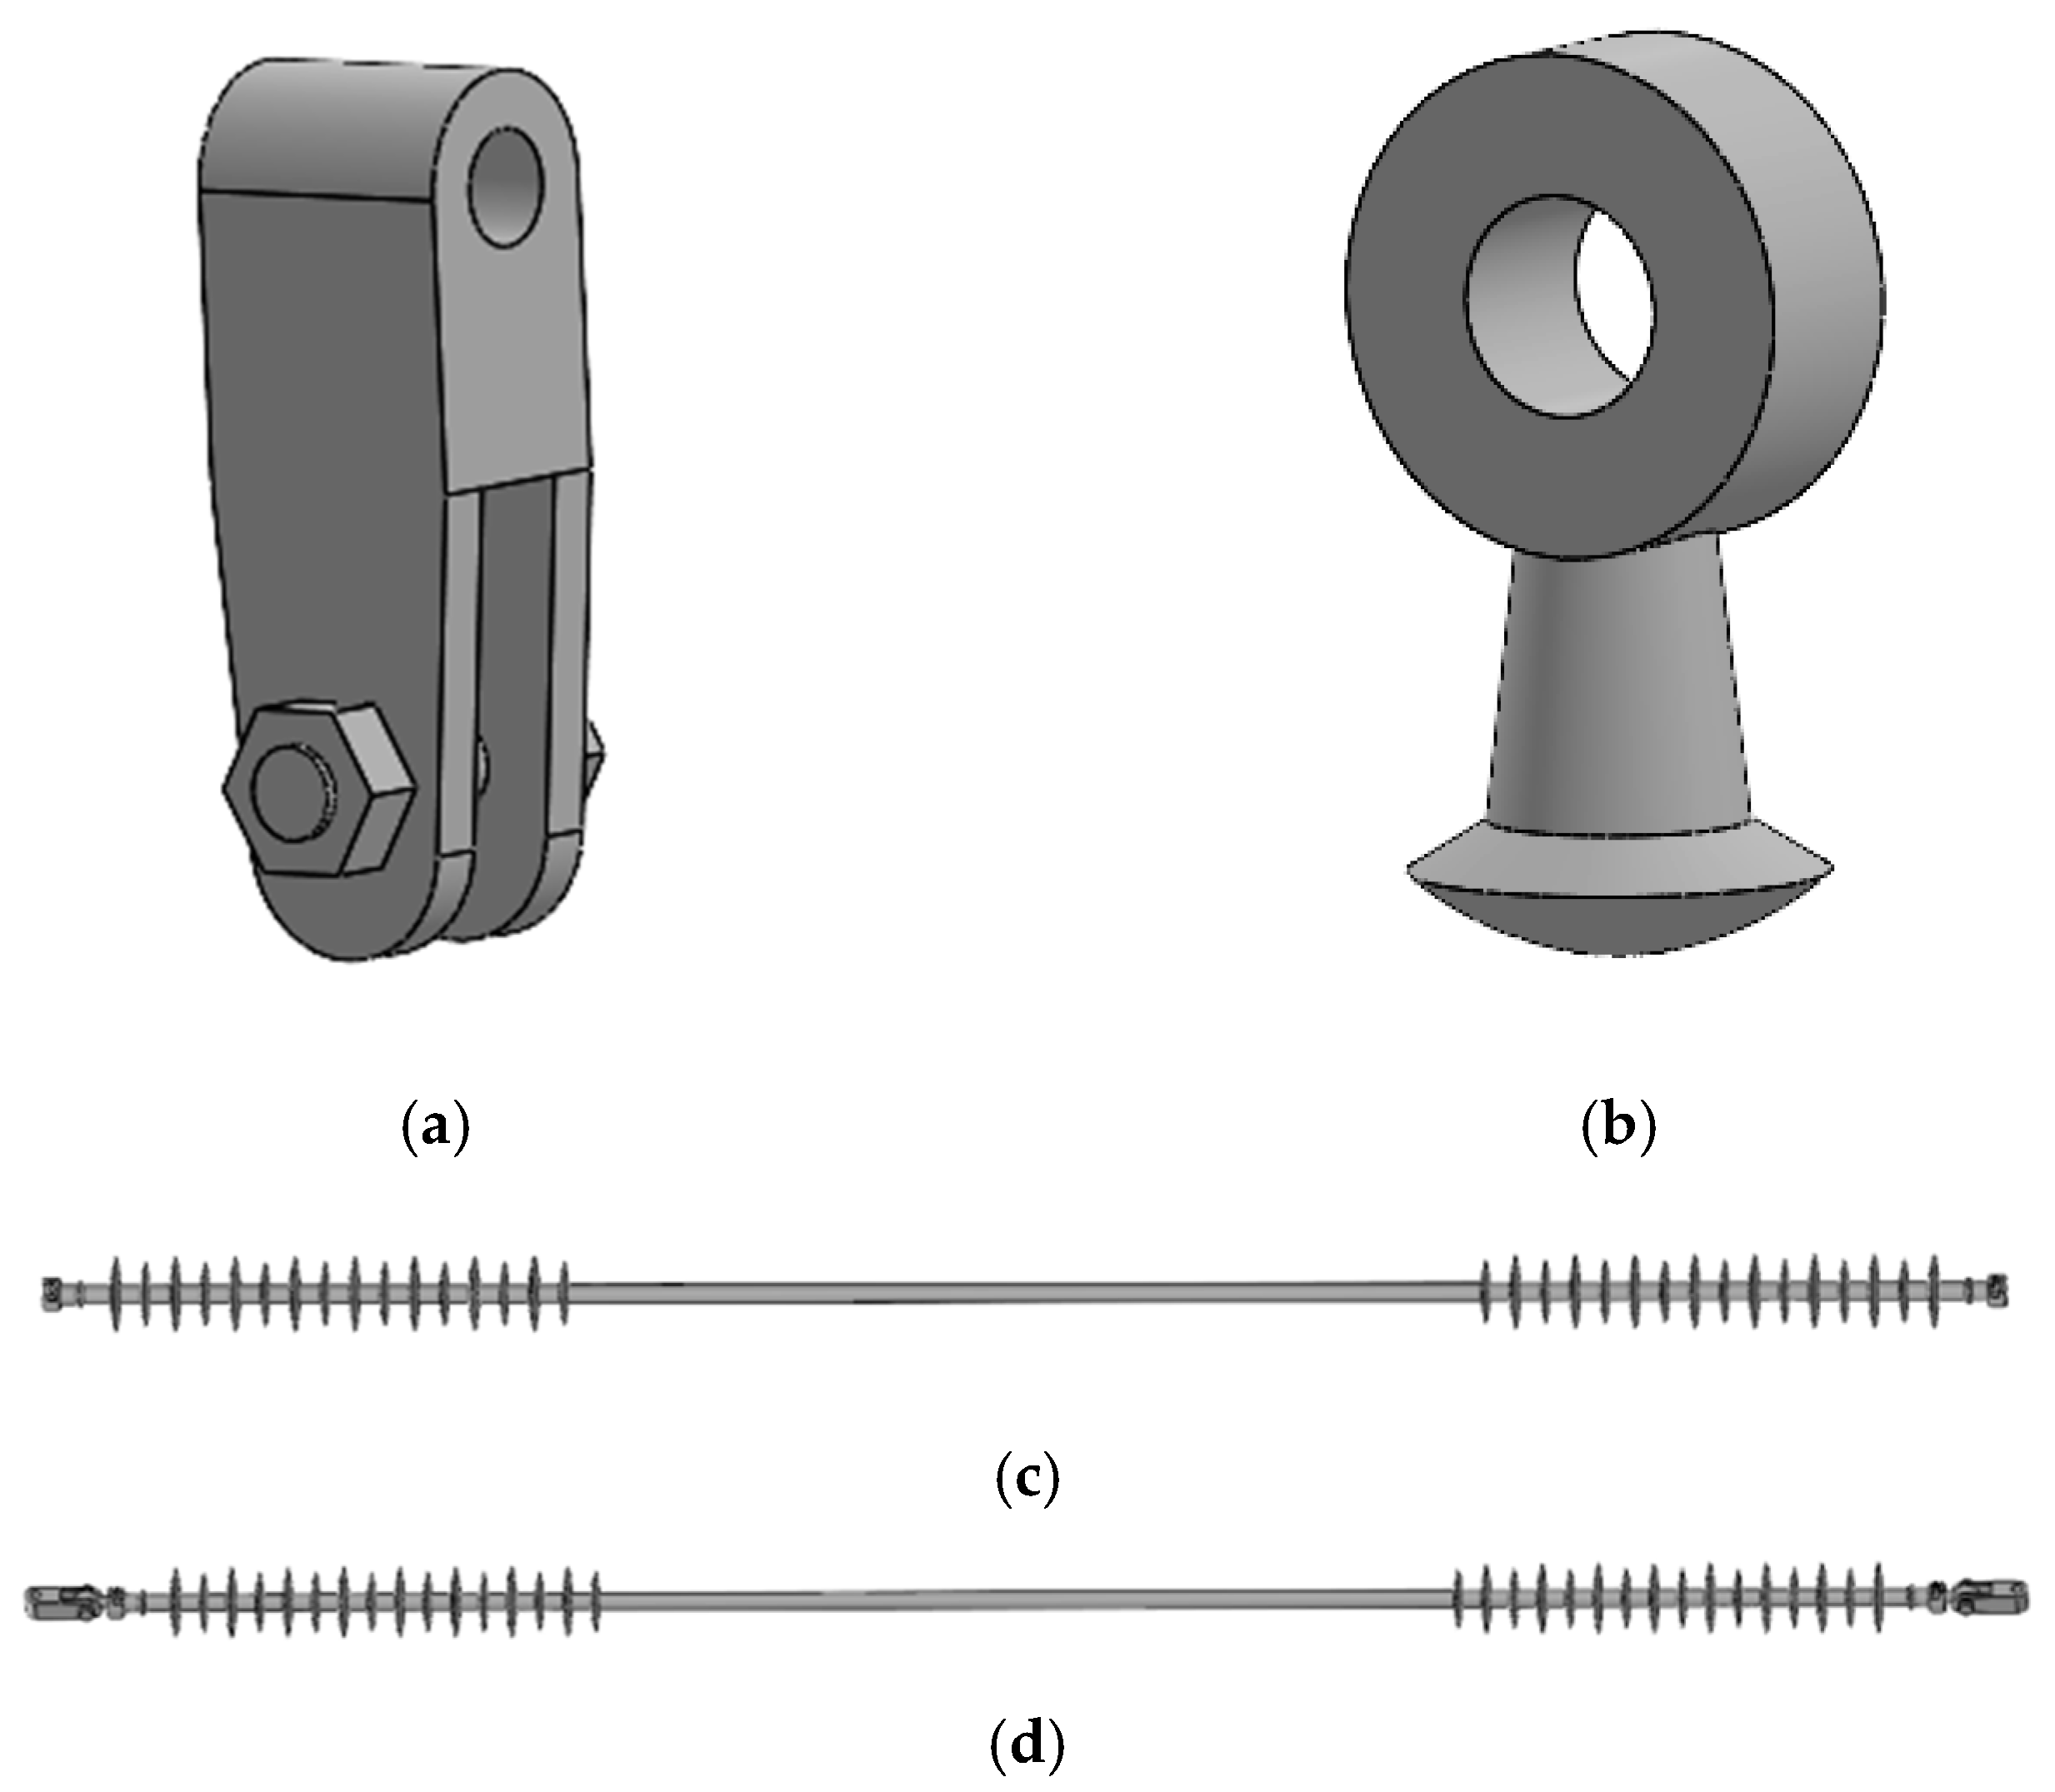
3. Interphase Spacer Model Development

3.1. Hanger Fittings and Bolt Model

The hanger fittings connect the main body of the interphase spacer to the conductor, and their design must account for significant tensile forces. In modeling, Using SOLID WORKS 2022 software, the three-dimensional model of the hanger fittings is constructed based on actual dimensions and shapes, using approximation curves and other techniques. Although bolts and other connecting components are small, they play a crucial role in the assembly and stress distribution of the interphase spacer. The model ensures the bolts’ tightness and reliability in actual assembly, as shown in Figure 6a.

3.2. Ball Head Hanger Model

The ball head hanger connects the hanger fittings to the composite insulator. The modeling focuses on the precision of its spherical head and ring part. In 3D modeling software, the spherical shape is first drawn, followed by rotation and extrusion operations to form the ring part. The dimensions and material of the ball head hanger must meet design requirements to withstand expected loads, as illustrated in Figure 6b.

3.3. Composite Insulator Model

As a key component of the interphase spacer, the composite insulator’s modeling must consider its insulation performance and mechanical strength. The model is based on the actual dimensions and shape of the insulator’s main structure, with particular attention to the shed parts. By controlling the shape, number, and spacing of the sheds, the model simulates the electrical performance under actual conditions. The insulator’s connection points must match the hanger fittings and ball head hanger for accurate assembly, as shown in Figure 6c.

3.4. Interphase Spacer Model

Using positional constraints, the hanger fittings, ball head hanger, composite insulator, and bolts are assembled into the overall interphase spacer model, as depicted in Figure 6d. This ensures that the model accurately reflects the interactions and stress states among the components.

3.5. Constitutive Model

When selecting materials for suspension fittings and ball head hangers, alloy steel was considered due to its high strength, good toughness, and corrosion resistance, making it an ideal choice. Similarly, glass fiber was chosen for the composite insulators because of its excellent insulating properties, mechanical strength, and weather resistance, which met the design requirements and ensured the safety and stability of the power transmission system. Specific material parameters are listed in Table 2.

3.6. Connection Relationships

The model comprises four main components: hanger fittings, bolts, ball head hanger, and composite insulator. The connection mechanisms among these components are complex, making direct simulation of their interactions challenging. To ensure the authenticity of the connections while enhancing model operability and simulation efficiency, the interaction mechanisms among components are reasonably simplified.
The hanger fittings and ball head hanger are connected via bolts, with the bolts bound to the hanger fittings and treated as a single component, simplifying the connection relationship between bolts and fittings. The composite insulator, a crucial part of the interphase spacer, is coupled with the ball head hanger at the connection point to simulate their interaction. During ice-shedding of the Phase A conductor, the connection between the interphase spacer and the Phase B conductor is set as a fixed support, while an axial force is applied to the segment connected to the Phase A conductor. Conversely, when the Phase B conductor experiences ice-shedding, the connection between the interphase spacer and the Phase A conductor is designated as the fixed support, and an axial force is applied to the segment connected to the Phase B conductor.

4. Mechanical Analysis of the Interphase Spacer

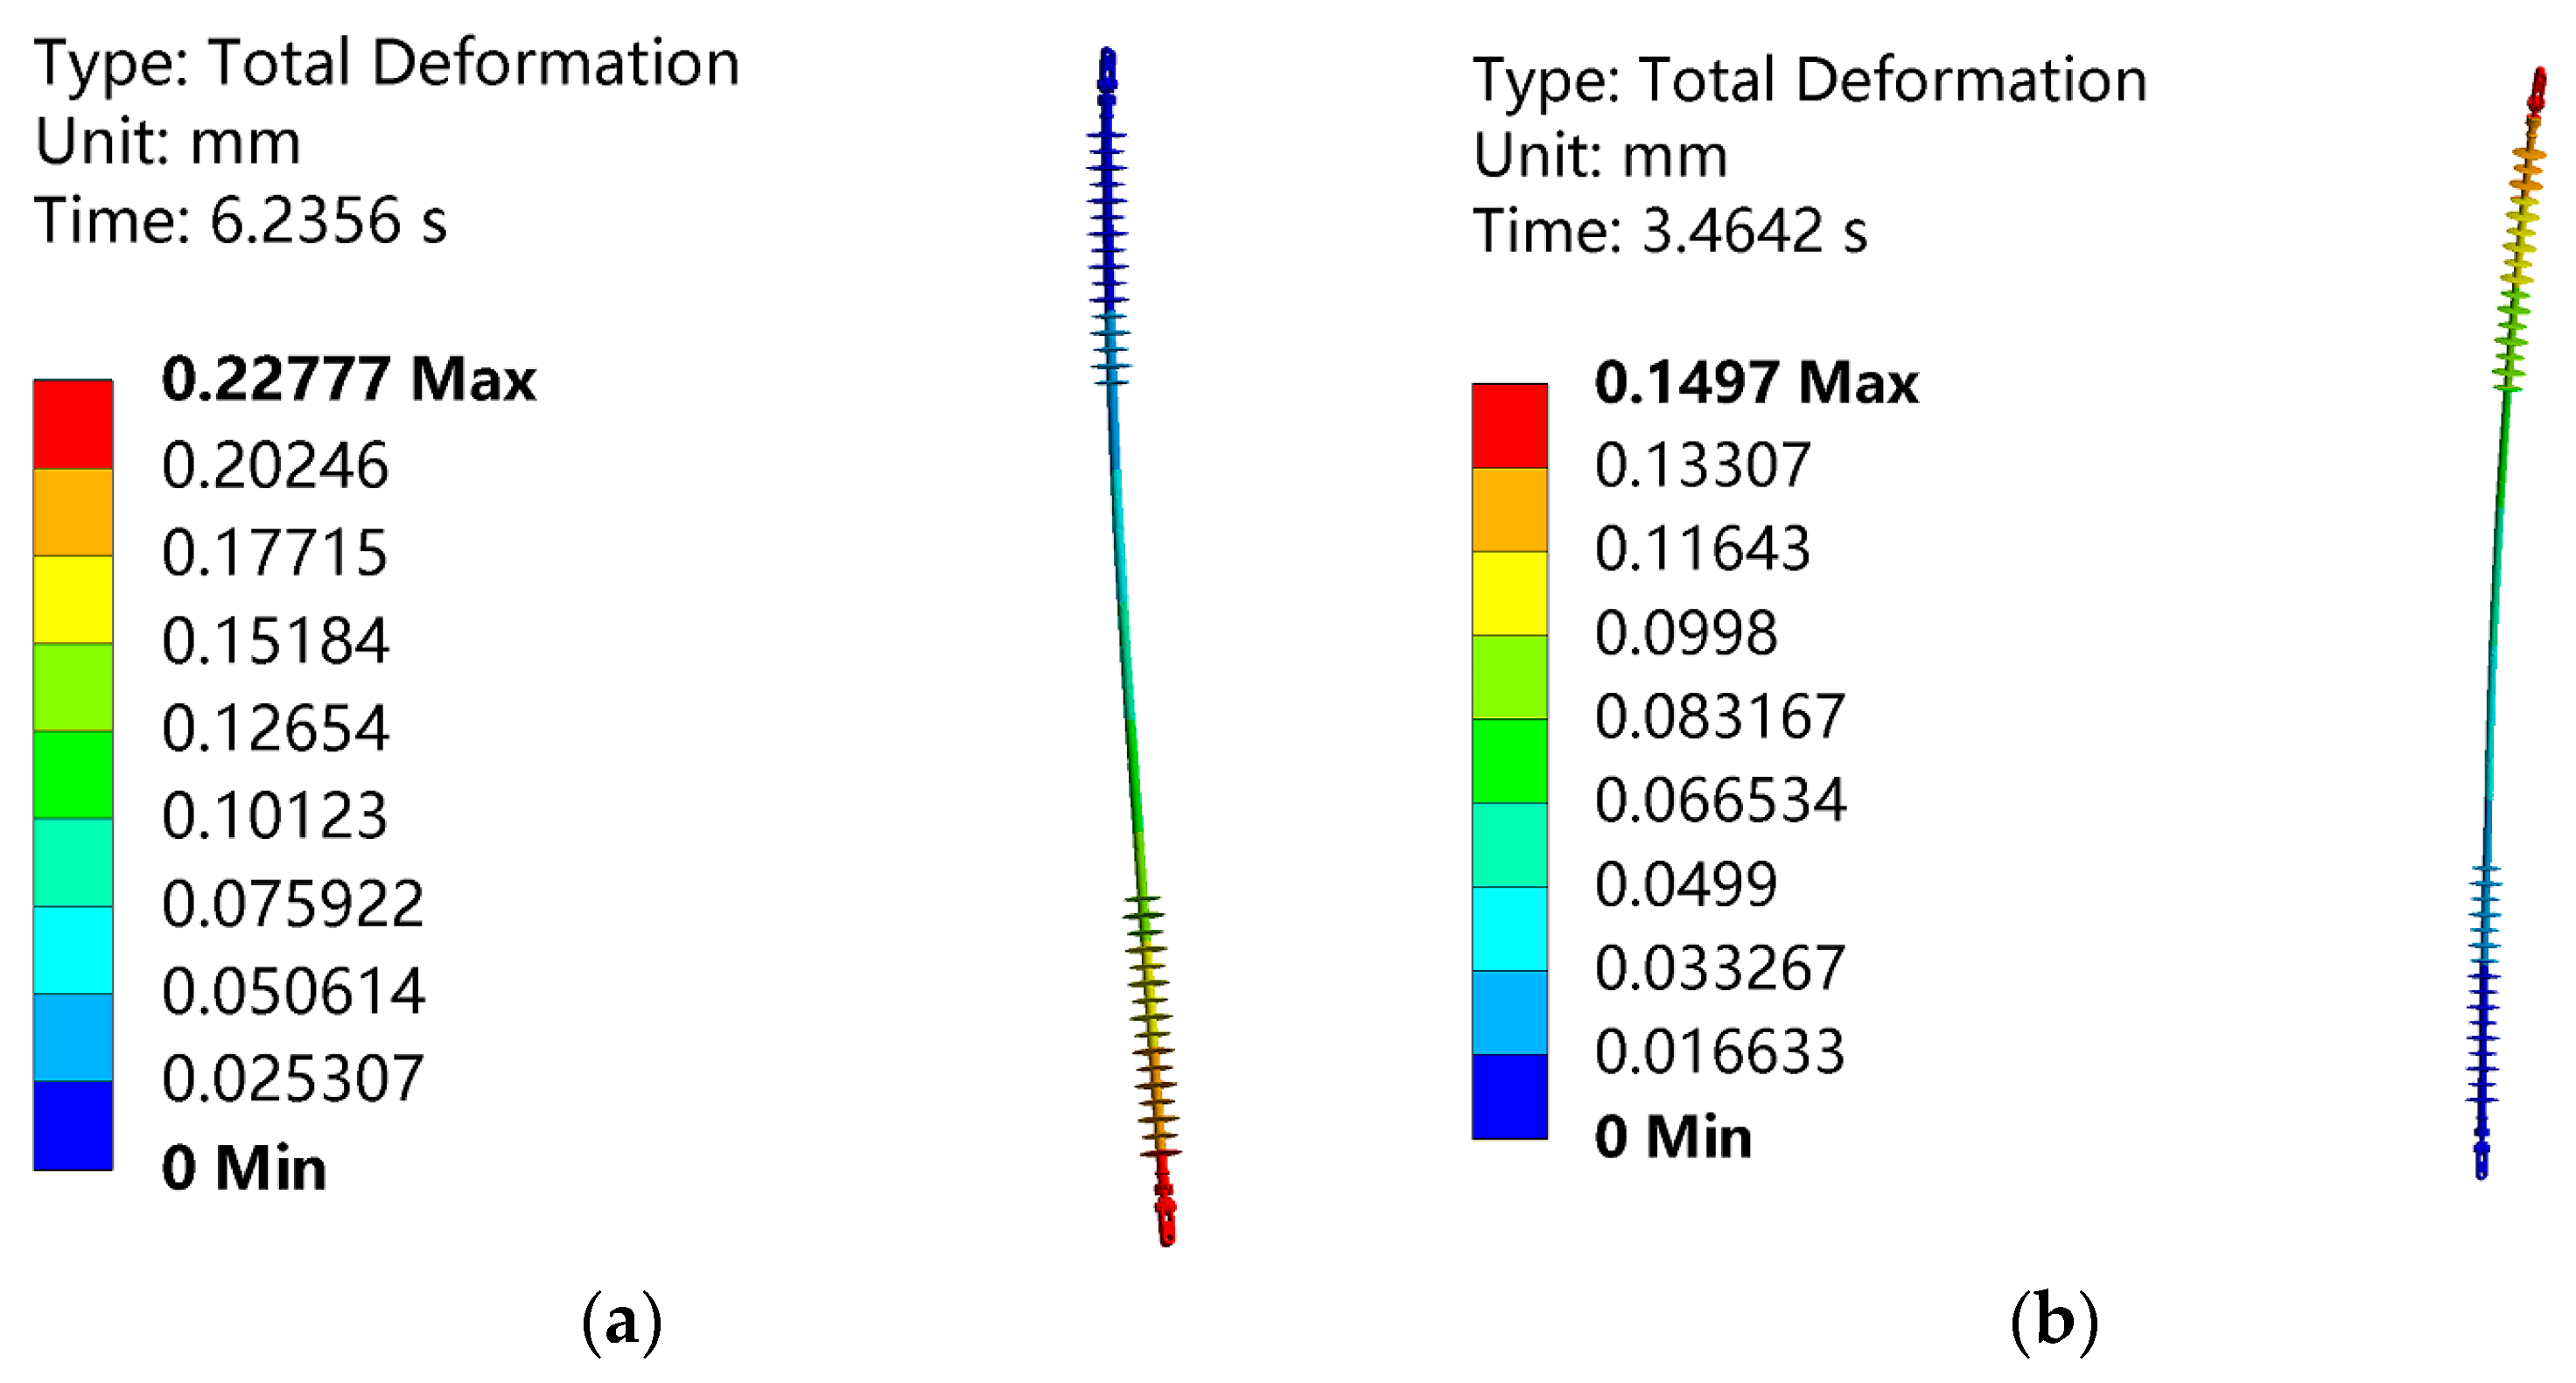
4.1. Total Deformation of the Interphase Spacer Under Ice-Shedding Jump Conditions

The displacement of the interphase spacer after applying axial force during the ice-shedding jump of the Phase A conductor is shown in Figure 7a, while the displacement under the ice-shedding jump of the Phase B conductor is shown in Figure 7b.
As observed in Figure 7a, when the axial force induced by the ice-shedding jump acts on the interphase spacer, the section proximal to the Phase A conductor undergoes slight bending and twisting deformation, resulting in displacement changes. Similarly, as shown in Figure 7b, the section adjacent to the Phase B conductor also experiences slight bending and twisting deformation under the axial force caused by the ice-shedding jump, leading to variations in displacement.

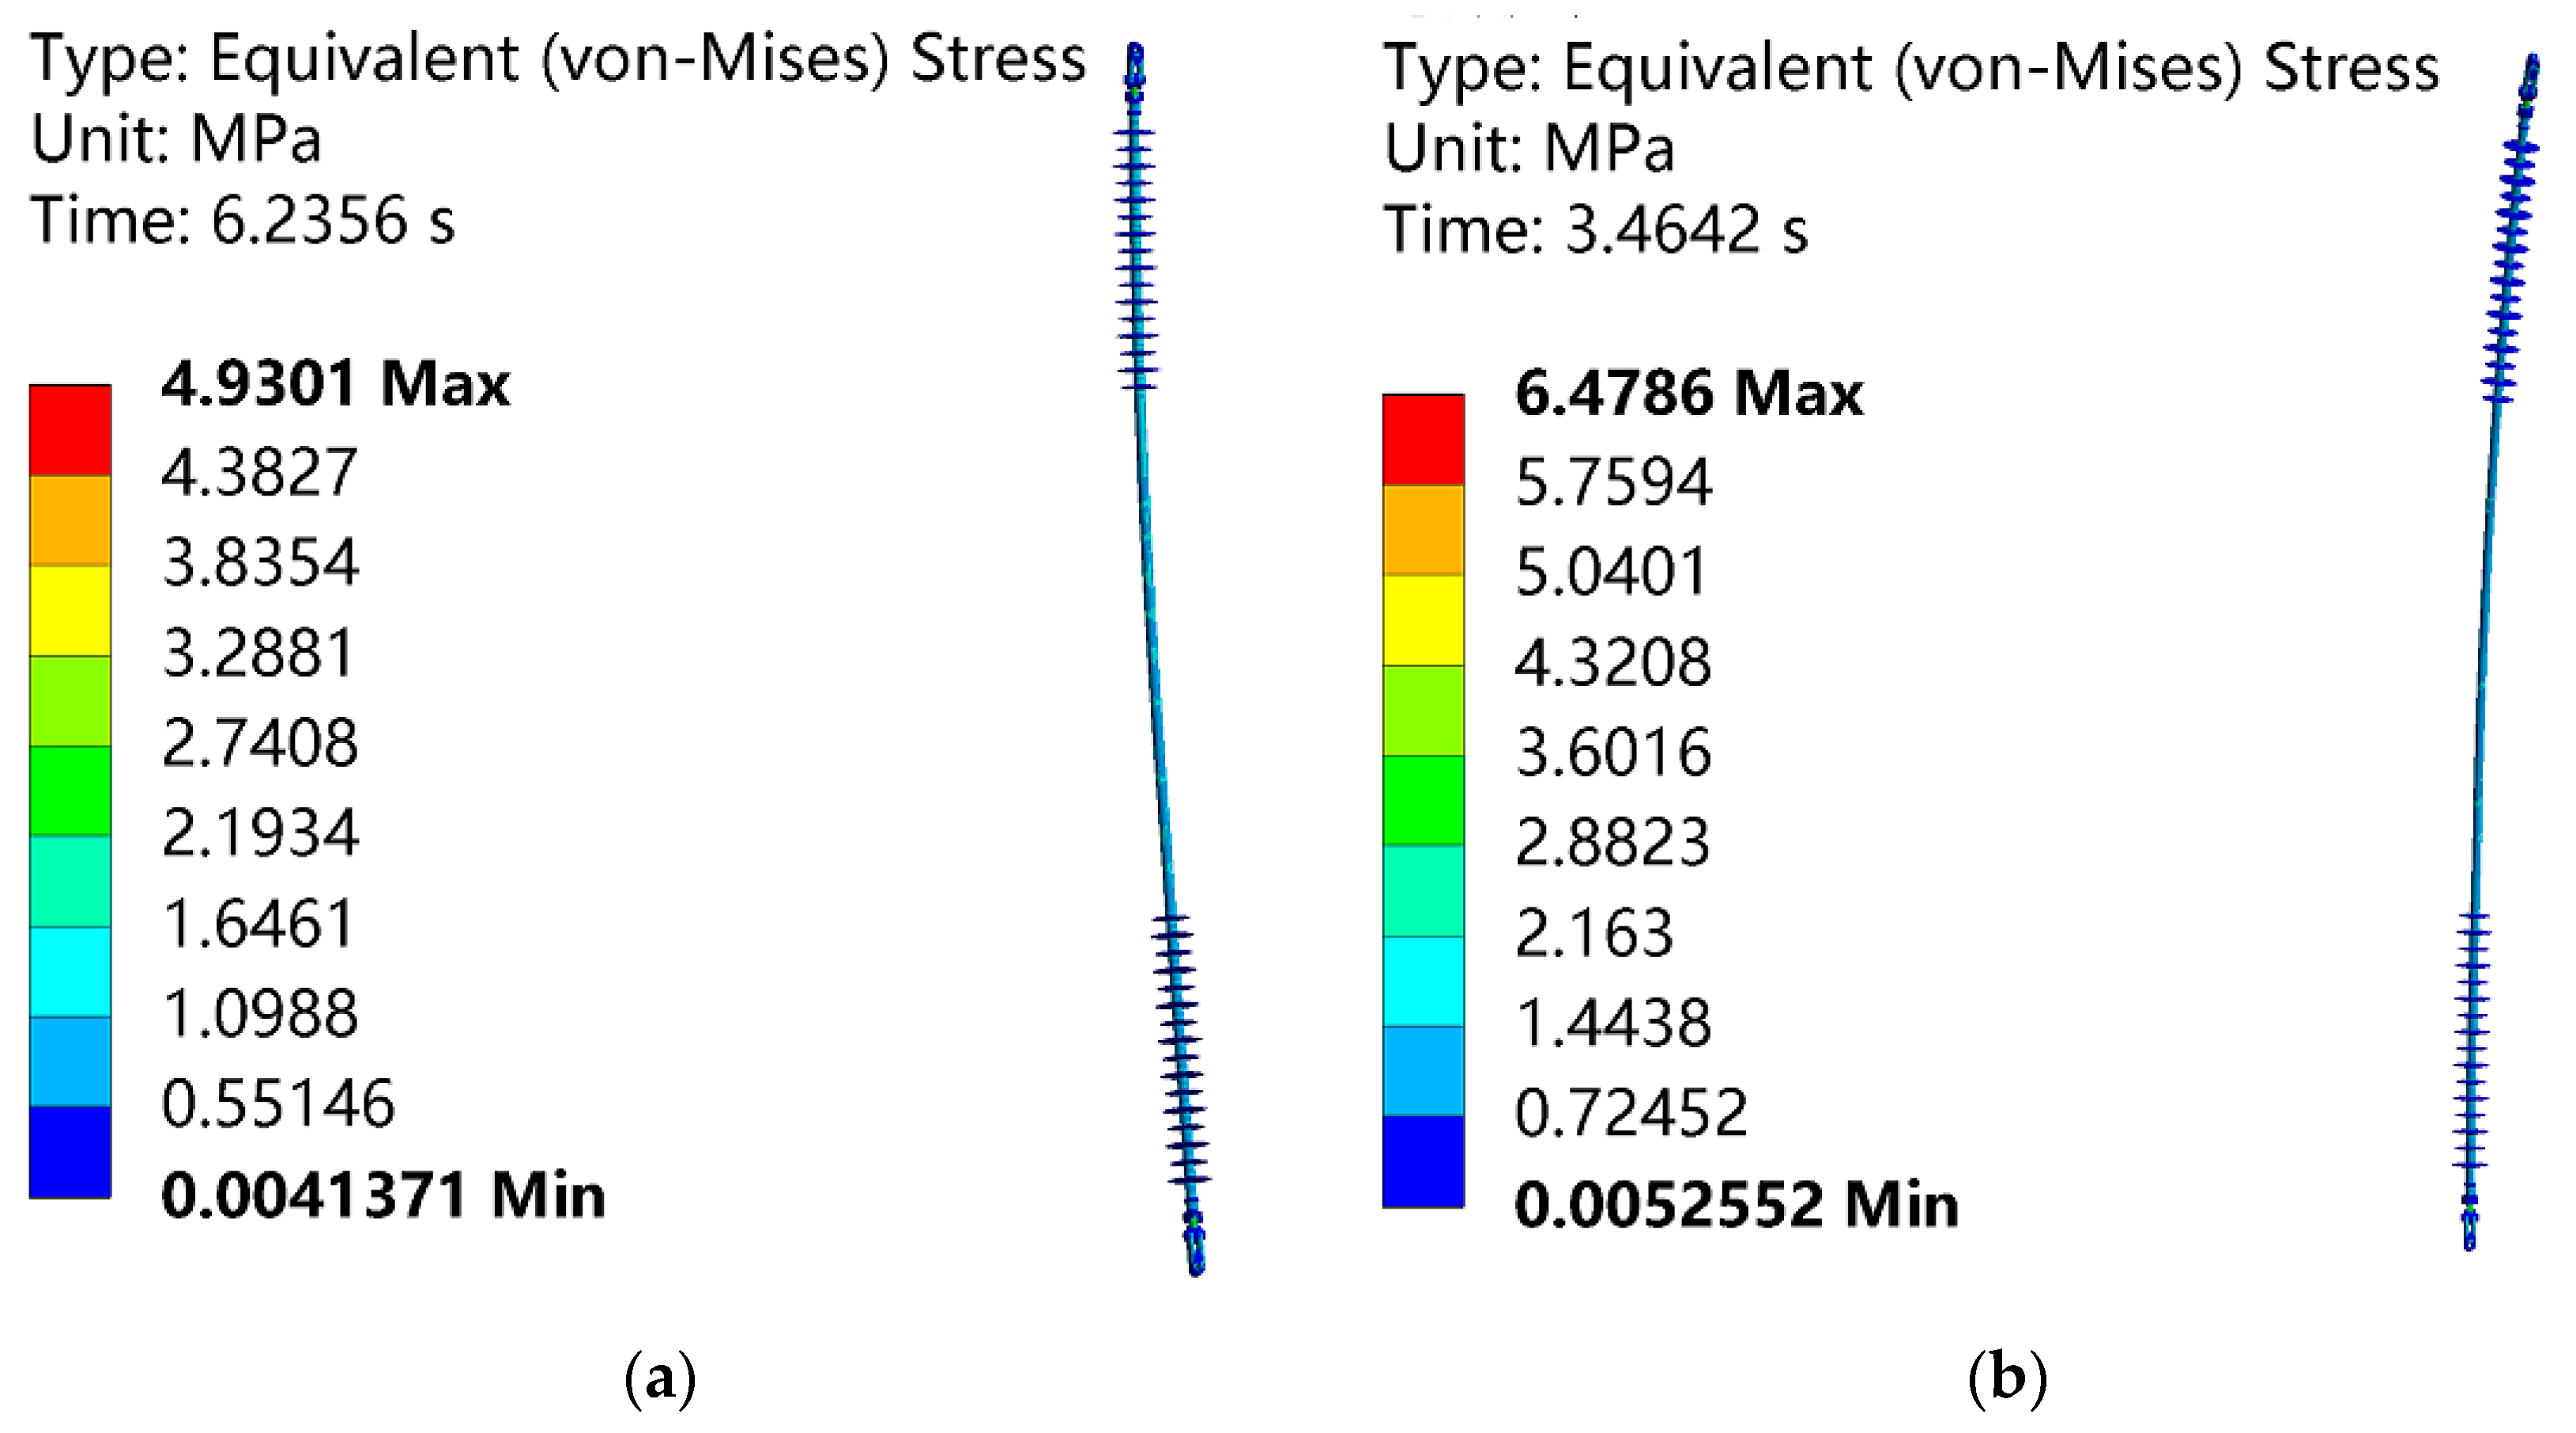
4.2. Stress Distribution of the Interphase Spacer Under Ice-Shedding Jump Conditions

The overall deformation and stress distribution of the interphase spacer under the ice-shedding jump of the Phase A conductor is shown in Figure 8a, while those under the ice-shedding jump of the Phase B conductor are shown in Figure 8b.
As illustrated in Figure 8, the stress distribution of the interphase spacer exhibits a similar overall trend under ice-shedding jump conditions. Due to the complexity of the ice-shedding jump, the stress distribution on the interphase spacer is often uneven. As the ice-shedding jump progresses, the stress fluctuates. However, under these conditions, the overall stress on the interphase spacer complies with engineering safety standards, ensuring the stable operation of the transmission line under extreme conditions.

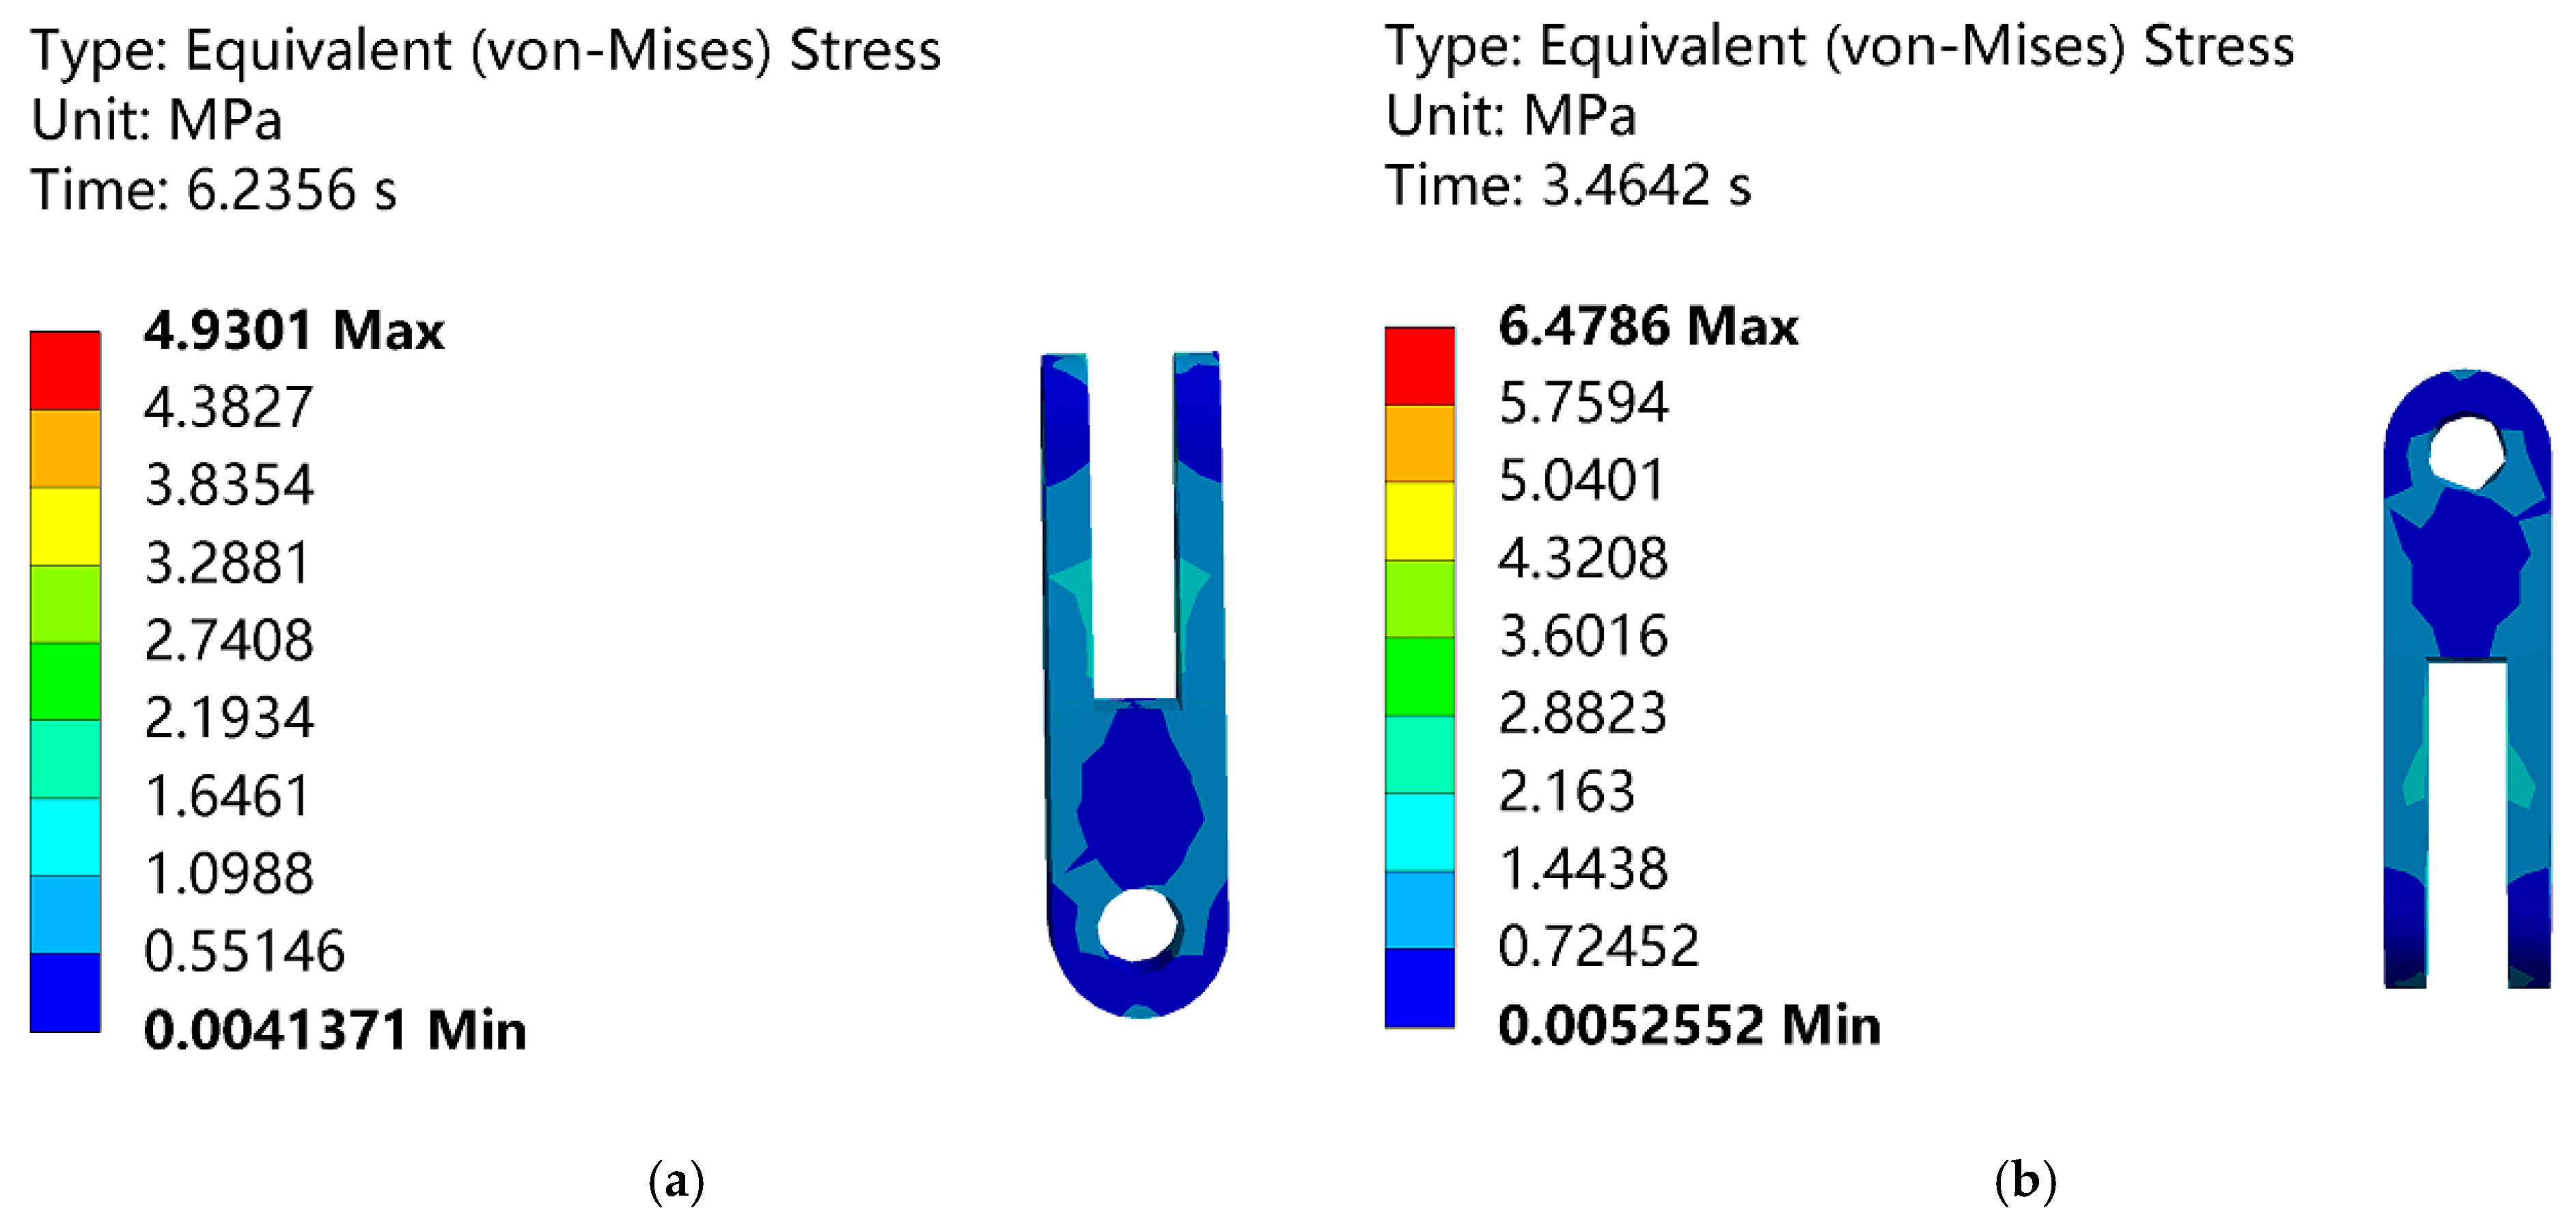
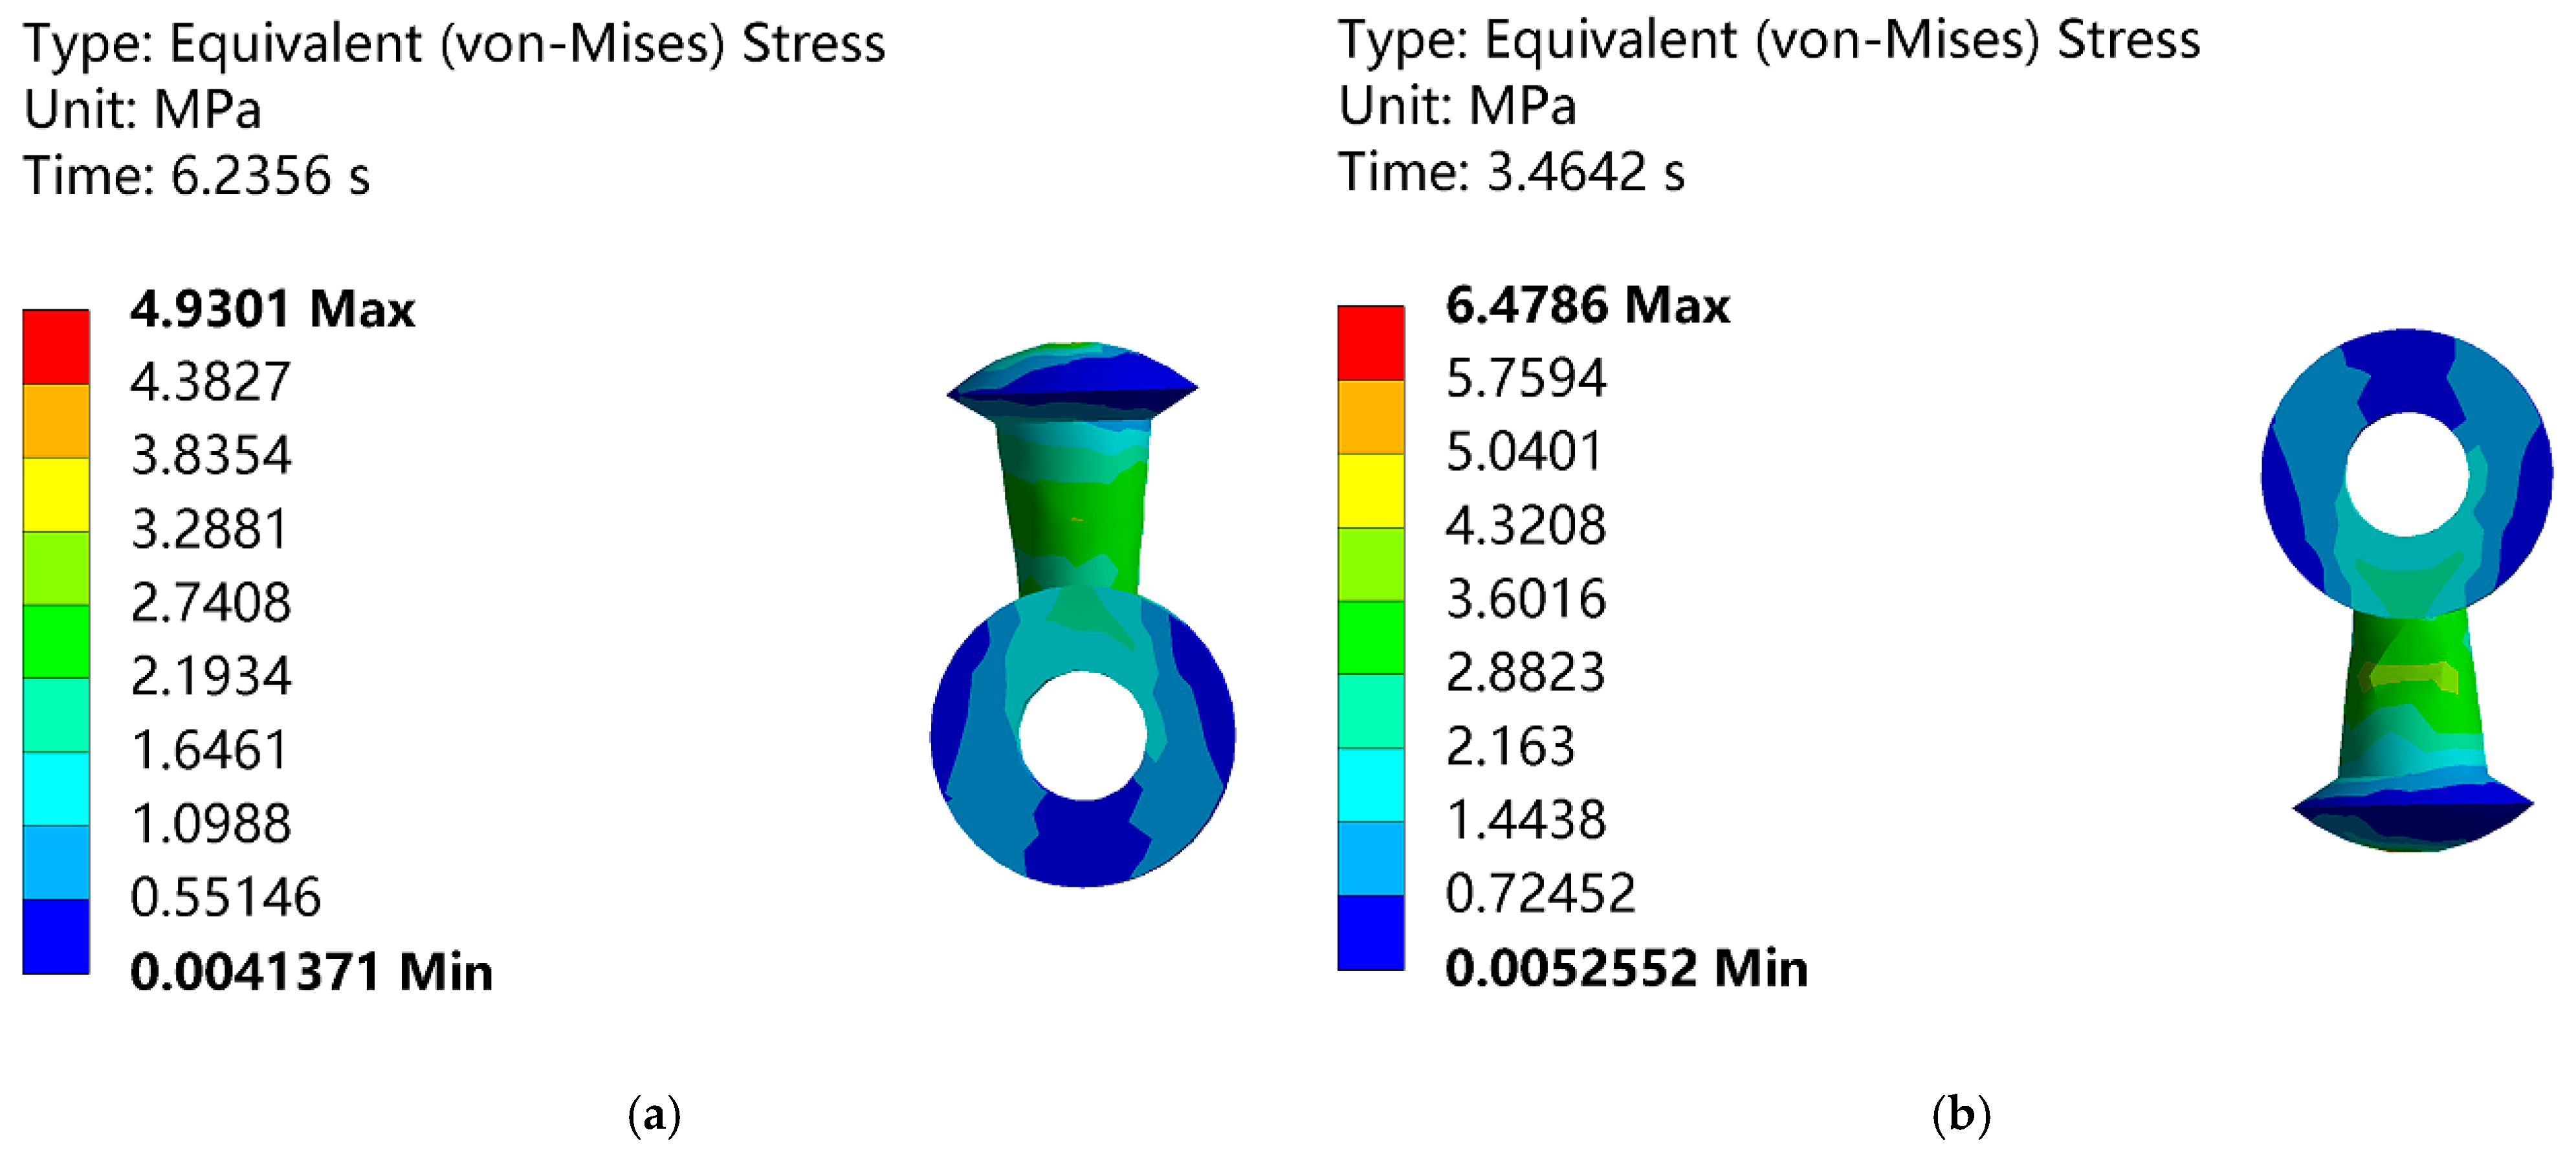
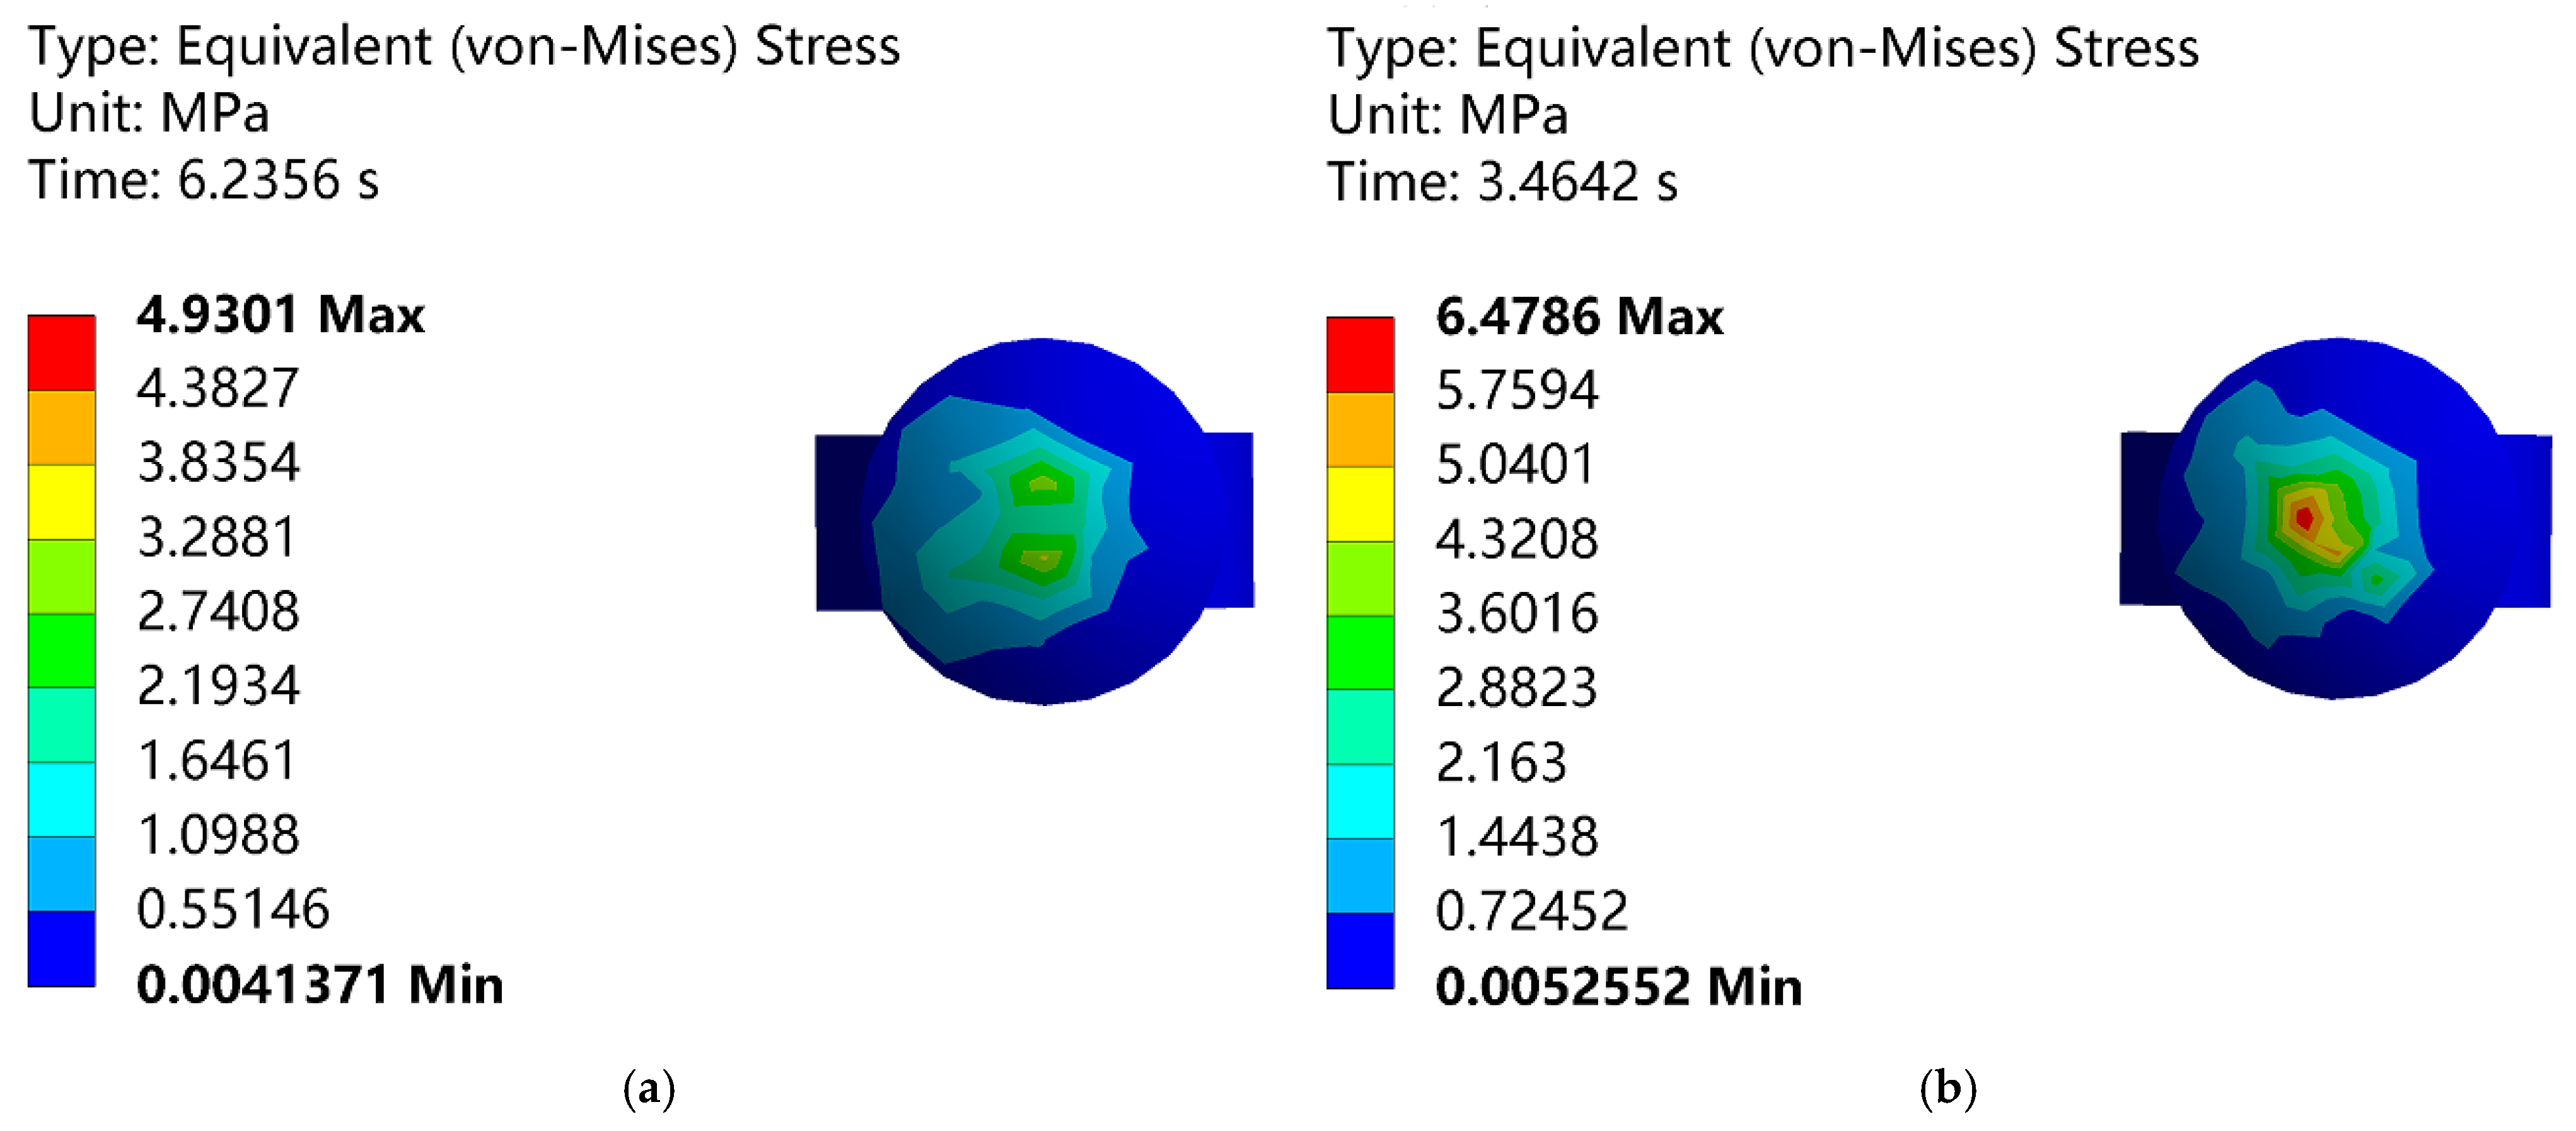
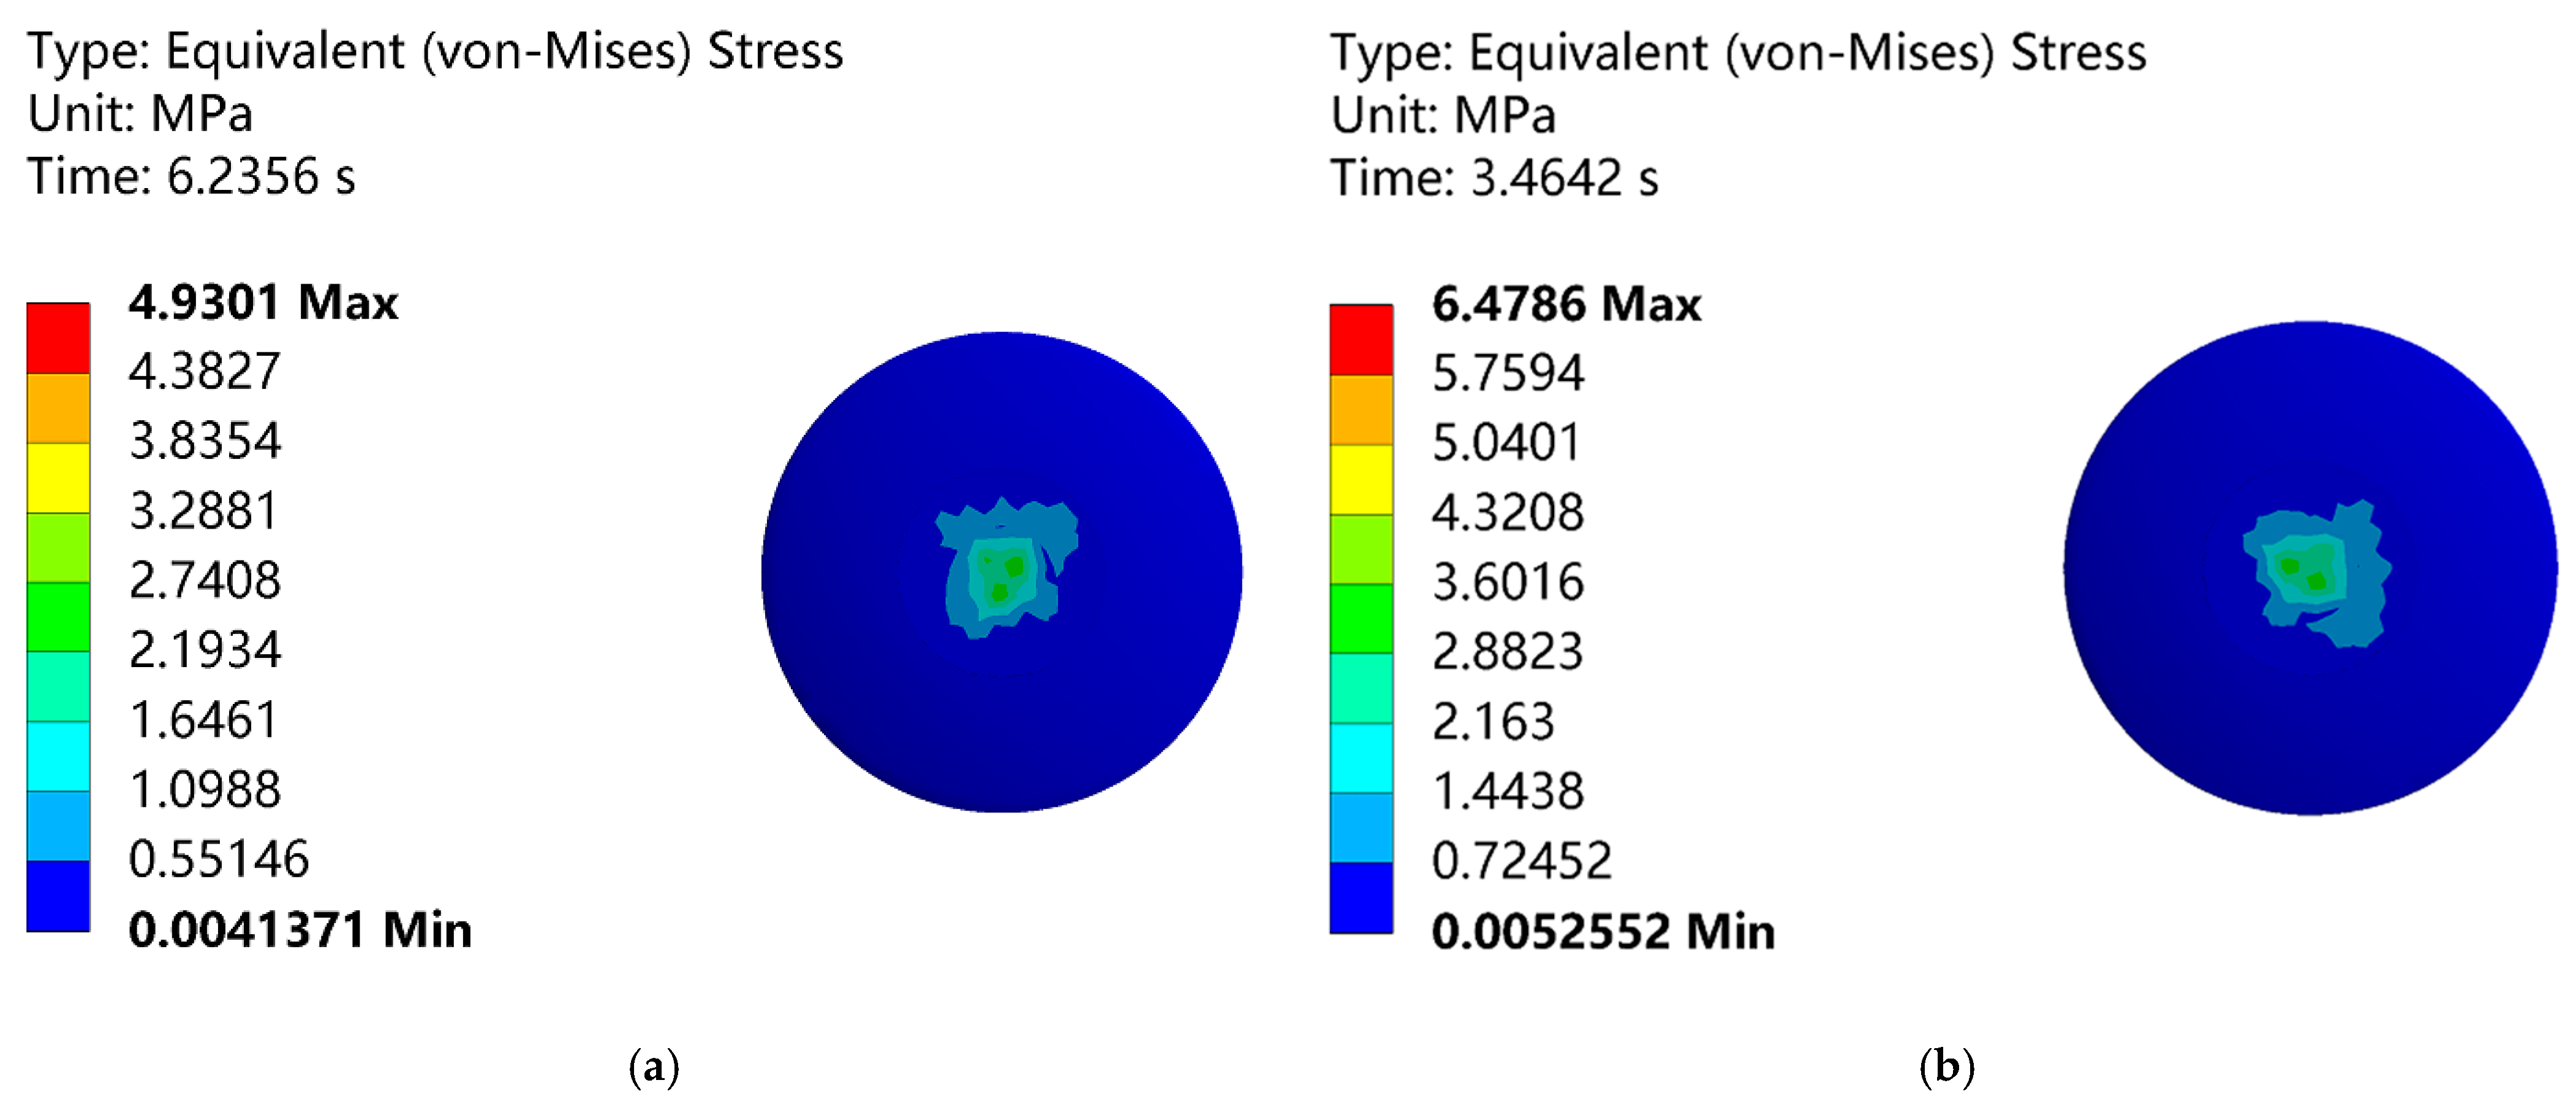
4.3. Stress Analysis of Individual Connecting Components Under Ice-Shedding Jump Conditions

The stress distribution of the hanger fittings under the ice-shedding jump of the Phase A conductor is shown in Figure 9a, while that under the ice-shedding jump of the Phase B conductor is shown in Figure 9b.
As seen in Figure 9, both sides of the hanger fittings in the same model exhibit identical stress distribution patterns. Under both conditions, the hanger fittings show good geometric advantages with low overall stress. However, in the hanging ring region, due to the design characteristics of the openings, significant stress concentration occurs when it comes into close contact and interacts with the bolts. This stress concentration arises from local material deformation surrounding the openings and the tightening force of the bolts, forming a critical zone of stress concentration.
The stress distribution of the ball head hanger under the ice-shedding jump of the Phase A conductor is shown in Figure 10a, while that under the ice-shedding jump of the Phase B conductor is shown in Figure 10b.
As depicted in Figure 10, the stress distribution patterns of the ball head hanger are highly consistent under both conditions. Notably, in the transition area where the ring structure connects to the rod section, the geometric shape induces localized stress concentration.
At the interface of the composite insulator connection, a tight ball-and-socket fit is adopted. This design significantly restricts the axial and lateral displacement freedom of the ball head hanger. During the ice-shedding jump, this restriction causes the connection area to bear additional bending stress, forming a potential stress concentration point. The stress distribution at the ball head hanger connection under the ice-shedding jump of the Phase A conductor is shown in Figure 11a, while that under the ice-shedding jump of the Phase B conductor is shown in Figure 11b.
As shown in Figure 11, significant strain occurs in the stress concentration regions, making these areas more susceptible to fracture and damage compared to other regions. Although these stress concentration areas are relatively more vulnerable, their design and manufacturing adhere to strict engineering standards and safety guidelines, ensuring that the stress levels in these regions remain within the reasonable load-bearing range of the materials or structures under normal operating conditions.
Liu Xiaohui conducted an in-depth analysis of random wind loads and steady wind loads [16]. The results indicated that at the corner positions of the ball-and-rod structure, specifically at the connection area between the ball head and the ball socket, significant stress concentration occurs. This area, as a weak point in the fittings structure, is prone to high stress under wind loads, posing challenges to the long-term stability of the structure. The stress distribution at the composite insulator connection under the ice-shedding jump of the Phase A conductor is shown in Figure 12a, while that under the ice-shedding jump of the Phase B conductor is shown in Figure 12b.
As shown in Figure 12, regardless of the conditions, the ball-and-socket connection is identified as a stress concentration area. However, under ice-covered conditions, this stress concentration does not compromise the safety and stability of the entire transmission line system. Through reasonable structural design, high-quality material selection, and regular inspection and maintenance, it is ensured that the stress concentration areas maintain good performance even after long-term operation and exposure to potential environmental factors, thereby ensuring the safe and reliable operation of the transmission line.

5. Conclusions

In this study, a comprehensive finite element model of ice-shedding jumps for double-circuit transmission lines on the same tower was established. The ice-shedding suppression effect and stress variations of the interphase spacer were analyzed. The conclusions are as follows:
(1)
The interphase spacer demonstrates a significant suppression effect on conductor ice-shedding jumps, with better suppression performance observed for the middle-phase conductor compared to the lower-phase conductor. In practical applications, the deployment of interphase spacers should be optimized for different line configurations and meteorological conditions to achieve the best ice-shedding suppression effect.
(2)
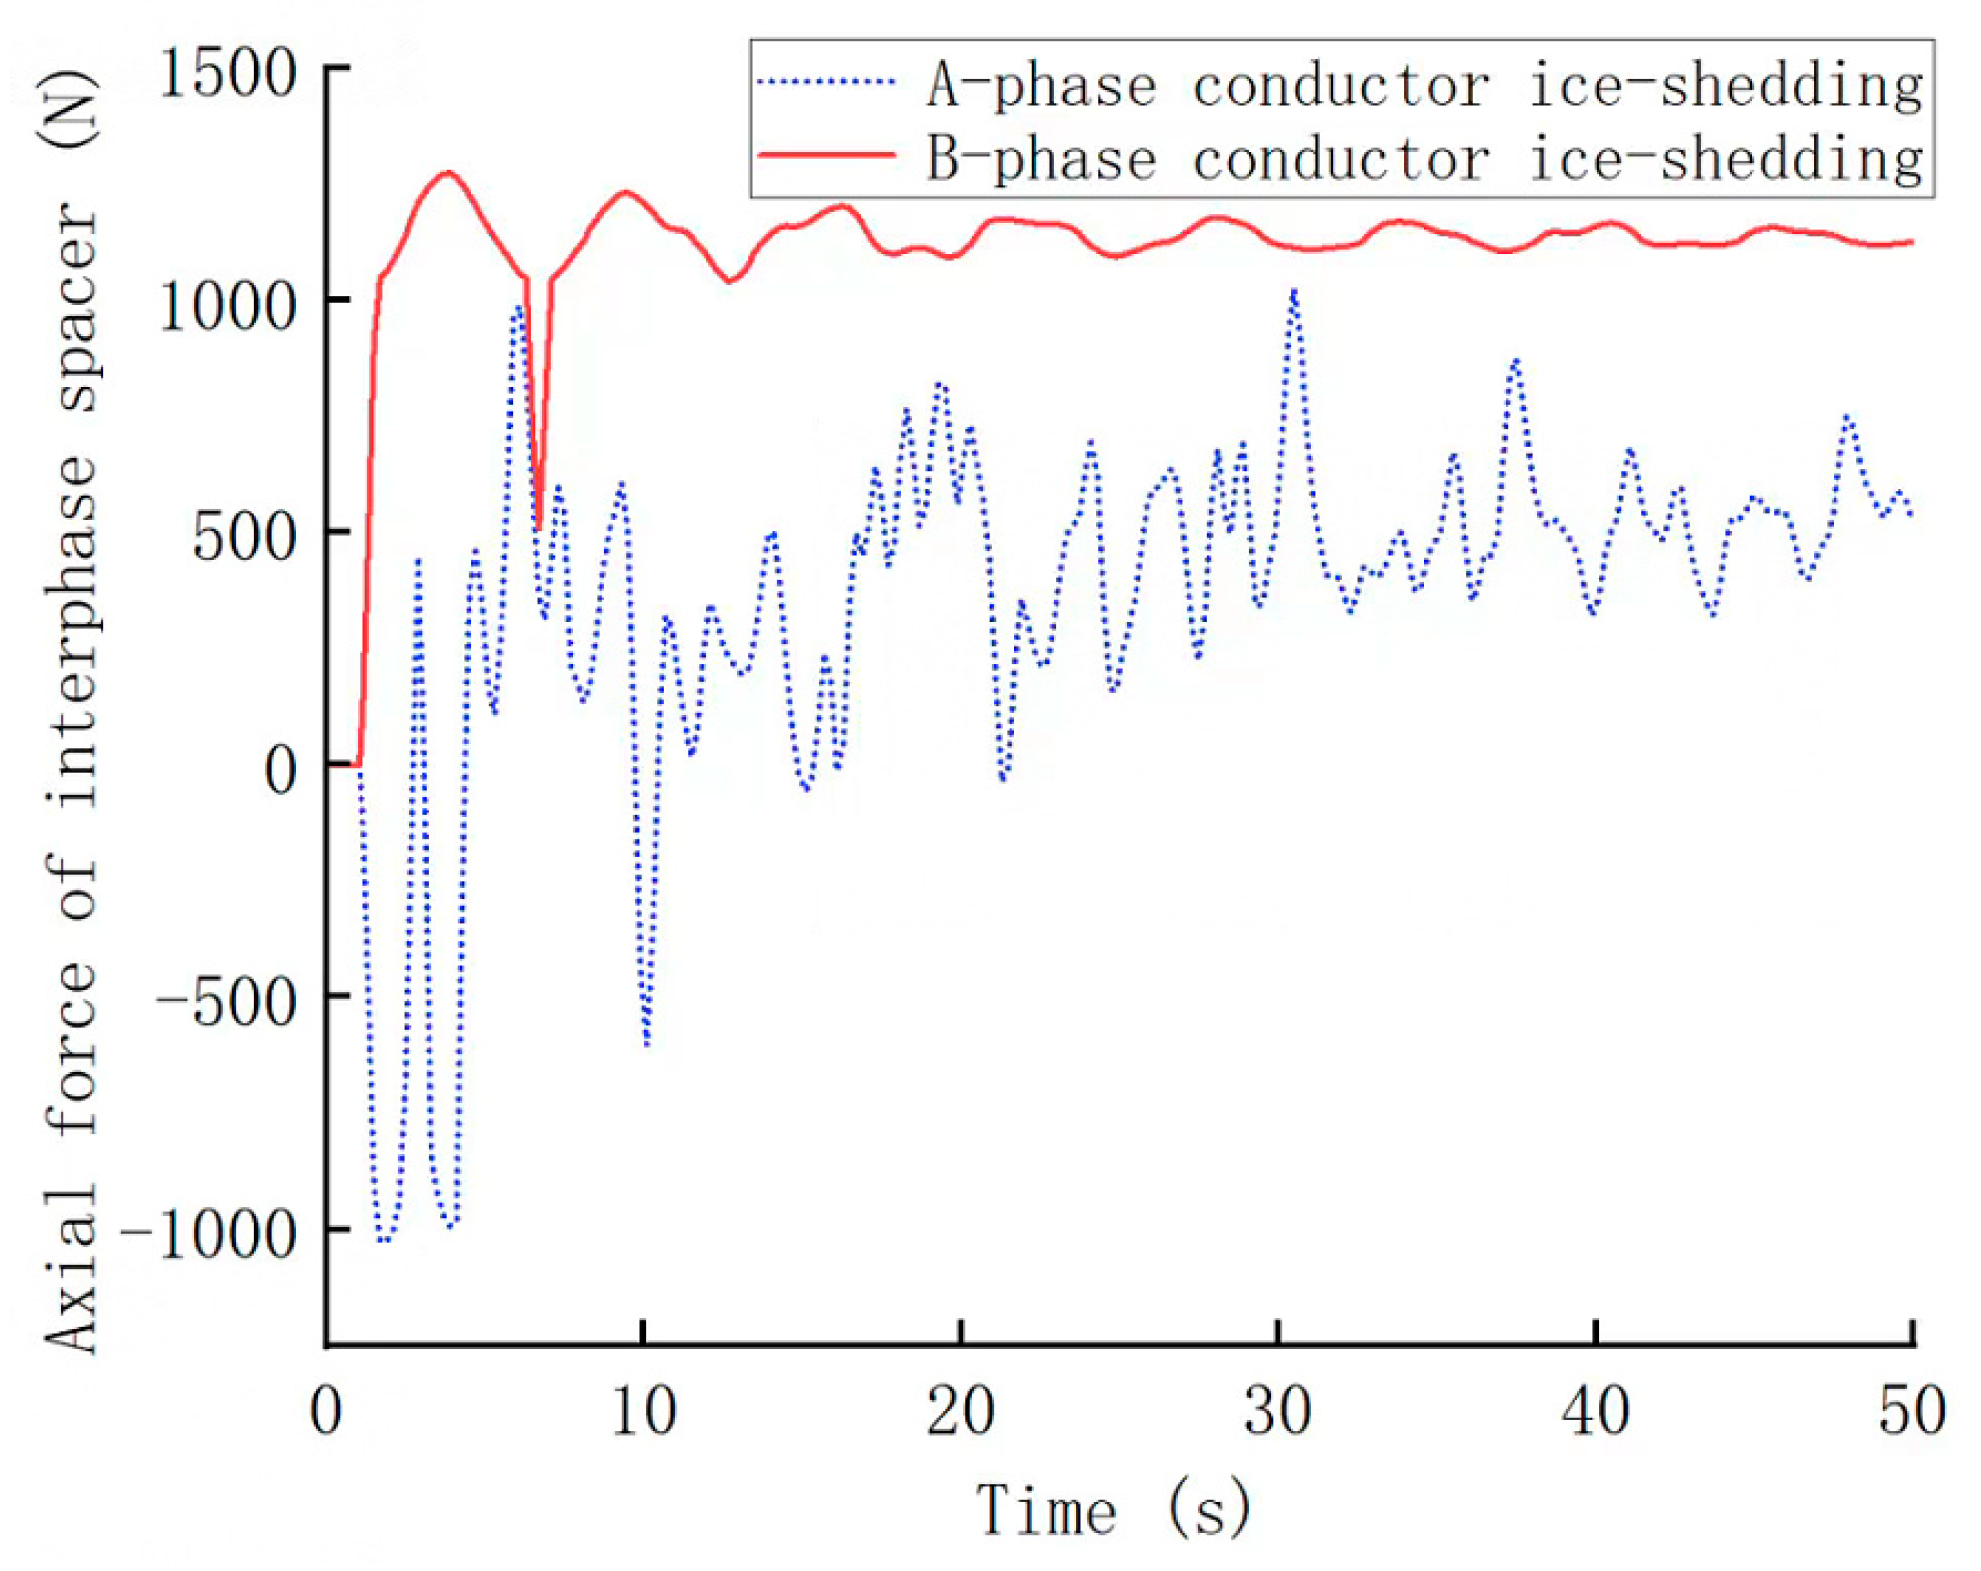
The axial force of the interphase spacer exhibits sharp fluctuations due to the conductor jumping initially, and then gradually stabilizing over time. When the axial force approaches the specified limit, its growth stops and remains near the limit value. This principle provides important guidance for the design and maintenance of phase-to-phase spacers. To ensure the reliability of interphase spacers during long-term use, continuous monitoring of their axial forces should be conducted, and timely adjustments or replacements of the spacers should be made based on the monitoring results.
(3)
Ice-shedding jumps affect the stress distribution of the interphase spacer. Among the structural components of the interphase spacer, the ball head hanger exhibits a higher risk of fracture or failure under ice-shedding conditions compared to other types of fittings. Specifically, at the connection between the composite insulator rod and the ball head/socket system, the design tends to induce significant bending stress under ice-shedding conditions. This stress concentration increases the structural load at the transition area of the rod. However, the overall stress distribution remains within acceptable limits, ensuring the safe and stable operation of the transmission line. In future designs of interphase spacers, emphasis should be placed on the strength design and material selection of these critical components to enhance their resistance to ice-shedding-induced jumping.

Author Contributions

Conceptualization, F.W. and J.Y.; methodology, F.W. and J.Y.; software, J.Y. and T.Z.; validation, T.Z. and Z.L.; formal analysis, J.Y. and Z.L.; investigation, J.Y. and Z.L.; resources, F.W.; data, F.W. and J.Y.; writing—original draft preparation, J.Y.; writing—review and editing, F.W; visualization, J.Y.; project administration, F.W. All authors have read and agreed to the published version of the manuscript.

Funding

This research was funded by the National Natural Science Foundation of China (No. 51778343); The project of Electric Power Research Institute of State Grid Xinjiang Electric Power Co., (No. SGXJDK00GYJS22400038).

Data Availability Statement

All relevant data are within the manuscript.

Conflicts of Interest

The authors declare no conflicts of interest.

References

  1. Wu, X.; Meisner, D. Induced Voltage and Current Simulations, Safety Criterion, and Mitigation for EHV Transmission Lines in Close Proximity. IEEE Trans. Ind. Appl. 2019, 55, 2429–2439. [Google Scholar] [CrossRef]
  2. Ke, H.C.; Sun, H.B. Ice Cover Prediction for Transmission Lines Based on Feature Extraction and an Improved Transformer Scheme. Electronics 2024, 13, 2339. [Google Scholar] [CrossRef]
  3. McClure, G.; Lapointe, M. Modeling the structural dynamic response of overhead transmission lines. Comput. Struct. 2003, 81, 825–834. [Google Scholar] [CrossRef]
  4. Barbieri, N.; de Souza, O. Dynamical Analysis of Transmission Line Cables, Part 2-Damping Estimation. Mech. Syst. Signal Process. 2004, 18, 671–681. [Google Scholar] [CrossRef]
  5. Li, H.N.; Bai, H.F. High-voltage transmission tower-line system subjected to disaster Loads. Prog. Nat. Sci. 2006, 16, 899–911. [Google Scholar]
  6. Wu, T.B.; Hu, Z.Y. Dynamical modeling of ice-shedding on transmission line. Chin. J. Appl. Mech. 2018, 35, 134–140+233. [Google Scholar]
  7. Huang, Z.H.; Yang, Q. Influence of Phase-to-phase Spacers on Ice-shedding Jumping of Compact Transmission Lines. Power Syst. Technol. 2024, 48, 923–932. [Google Scholar]
  8. Pan, H.; Huang, Z.H. Numerical Simulation Analysis of Deicing Trip Faults of Compact Transmission Lines. Power Syst. Clean Energy 2023, 39, 74–80+90. [Google Scholar]
  9. Zhu, H.; Liao, H.L. Finite element analysis of DC ice-melting thermal characteristics and deicing dynamic response in a 3-phase conductor interphase interval system. J. Vib. Shock 2024, 43, 138–144+201. [Google Scholar]
  10. Zhou, A.Q.; Liu, X.J. Wind tunnel test of the influence of an interphase spacer on the galloping control of iced eight-bundled conductors. Cold Reg. Sci. Technol. 2018, 55, 354–366. [Google Scholar] [CrossRef]
  11. Fu, G.J.; Wang, L.M. Simulations of the Controlling Effect of Interphase Spacerson Conductor Galloping. IEEE Trans. Dielectr. Electr. Insul. 2012, 19, 1325–1334. [Google Scholar] [CrossRef]
  12. Cui, F.J.; Liu, X.J. The Impact of Interphase Spacers on Galloping Control of Three-Phase Iced Eight-Bundled Transmission Lines: An Experimental Study. IEEE Trans. Power Deliv. 2021, 36, 371–382. [Google Scholar] [CrossRef]
  13. Li, C.; Liu, X.H. Simulation analysis of stress in power fitting for strain insulator-string following ice shedding from cables. J. Graph. 2021, 42, 279–288. [Google Scholar]
  14. Yang, X.C.; Li, X.M. Simulationof electrical contact wear on the rough surfaces of ultra-high-voltage transmission line fittings. Proc. Inst. Mech. Eng. 2024, 238, 291–302. [Google Scholar] [CrossRef]
  15. Lu, G.C.; Li, X.M. Numerical simulation analysis of connecting fittings under the coupling environment of ice and wind. Sci. Technol. Eng. 2023, 23, 12985–12993. [Google Scholar]
  16. Liu, X.H.; Zhou, X.H. Numerical simulation of transmission line and failure of fittings under wind load. Sci. Technol. Eng. 2020, 20, 8210–8217. [Google Scholar]
  17. Huang, R.; Liu, X.H. Safety analysis of tension string fittings under random wind. Chin. J. Appl. Mech. 2021, 38, 1449–1459. [Google Scholar]
  18. Pang, K.; Lu, M. Analysis of force characteristics of typical connecting metals of cross-over lines. Sci. Technol. Eng. 2020, 20, 7798–7803. [Google Scholar]
  19. Zhang, H.; Lv, J.S. Research on Uneven Ice-shedding Jump of Bundled Conductors in Middle Ice Area Based on Tower-Line System. Water Resour. Power 2021, 39, 204–207+198. [Google Scholar]
  20. Yang, Y.G.; Tang, C.J. Study on Random Deicing Jumping Characteristies of Long Span Conductors of Double Circuit Lines on the Same Tower. Guangdong Electr. Power 2023, 36, 76–84. [Google Scholar]
  21. Song, X.J. Study on Numerical Modelling of the Dynamic Response and Suppressing Schemes of Ice-Shedding on Transmission Lines; Huazhong University of Science and Technology: Wuhan, China, 2021. [Google Scholar]
  22. Wang, L.M.; Sun, B.Q. Mechanical Analysis and Calculation of Phase-to-phase Composite Spacer on 750 kV Compact Transmission Lines. High Volt. Eng. 2009, 35, 2551–2556. [Google Scholar]
  23. Wang, L.M.; Shan, F. Configuration of Phase-to-phase Spacer on 1000 kV Compact Transmission Line. High Volt. Eng. 2012, 38, 266–272. [Google Scholar]
Figure 1. Finite element model for transmission line.
Processes 13 00591 g001
Figure 2. Schematic diagram of ice-shedding jump.
Processes 13 00591 g002
Figure 3. Time-history curve of conductor displacement within a interphase spacer. (a) Time-history curve of displacement for the Phase A conductor within a interphase spacer; (b) Time-history curve of displacement for the Phase B conductor within a interphase spacer.
Processes 13 00591 g003
Figure 4. Time-history curves of unbalanced tension at suspension points. (a) Time-history curve of unbalanced tension at suspension point for the Phase A conductor; (b) Time-history curve of unbalanced tension at suspension point for the Phase B conductor.
Processes 13 00591 g004
Figure 5. Time-history curve of axial force for phase-to-phase spacer bars.
Processes 13 00591 g005
Figure 6. Models of various components of phase-to-phase spacer bars. (a) Model of suspension hardware and bolts; (b) Model of spherical link hanging ring; (c) Model of composite insulator; (d) Overall model.
Processes 13 00591 g006
Figure 7. Displacement contour plots of phase-to-phase spacer bars. (a) Displacement under ice-shedding jump condition for Phase A; (b) Displacement under ice-shedding jump condition for Phase B.
Processes 13 00591 g007
Figure 8. Stress contour plots of phase-to-phase spacer bars. (a) Stress under ice-shedding jump effect for Phase A; (b) Stress under ice-shedding jump effect for Phase B.
Processes 13 00591 g008
Figure 9. Stress contour plots of suspension hardware. (a) Stress distribution of suspension hardware under Phase A; (b) Stress distribution of suspension hardware under Phase B.
Processes 13 00591 g009
Figure 10. Stress contour plots of spherical link hanging rings. (a) Stress distribution of spherical link hanging rings under Phase A; (b) Stress distribution of spherical link hanging rings under Phase B.
Processes 13 00591 g010
Figure 11. Stress contour plots at the connection of spherical link hanging rings. (a) Stress distribution at the spherical link hanging rings under Phase A; (b) Stress distribution at the spherical link hanging rings under Phase B.
Processes 13 00591 g011
Figure 12. Stress contour plots at the connection of composite insulators. (a) Stress distribution at the connection of composite insulators under Phase A; (b) Stress distribution at the connection of composite insulators under Phase B.
Processes 13 00591 g012
Table 1. Conductor parameters.
ParameterValue
ConductorLGJ-400/50
Cross Section Area (mm2)451.55
Diameter (mm)27.63
Unit Quality (kg/km)1.511
Breaking Force (kN)123.40
Elastic Modulus (MPa)69,000
Linear Expansion Coefficient (10−6)19.3
Table 2. Material parameters.
Parts NameSuspension HardwareSpherical Link Hanging RingsComposite Insulator
MaterialGrade 35 Steel35CrMoGlass Fiber
Elastic Modulus(N·mm−2)2.12 × 1052.13 × 1058.5 × 104
Poisson’s Ratio0.2910.2860.22
Density(kg·m−3)7.87 × 1037.87 × 1032.4 × 105
Yield Strength(N·mm−2)3.15 × 1028.35 × 1021.5 × 103
Disclaimer/Publisher’s Note: The statements, opinions and data contained in all publications are solely those of the individual author(s) and contributor(s) and not of MDPI and/or the editor(s). MDPI and/or the editor(s) disclaim responsibility for any injury to people or property resulting from any ideas, methods, instructions or products referred to in the content.

