Article

Combined Solar Air Source Heat Pump and Ground Pipe Heating System for Chinese Assembled Solar Greenhouses in Gobi Desert Region

1
College of Mechanical and Electrical Engineering, Xinjiang Agricultural University, Urumqi 830052, China
2
Institute of Agricultural Machinery, Xinjiang Academy of Agricultural Sciences, Urumqi 830091, China
3
Research Center for Agricultural Engineering Facilities and Equipment Engineering Technology, Urumqi 830091, China
*
Authors to whom correspondence should be addressed.
Processes 2025, 13(2), 334; https://doi.org/10.3390/pr13020334
Submission received: 28 December 2024 / Revised: 22 January 2025 / Accepted: 22 January 2025 / Published: 25 January 2025
(This article belongs to the Section Process Control and Monitoring)

Abstract

:
Chinese Assembled Solar Greenhouses (CASGs) in the Gobi Desert region face significant diurnal temperature variations, with excessively high temperatures during the day and low temperatures at night, which adversely affect crop growth. Traditional temperature regulation technologies are hindered by high energy consumption, high costs, and severe pollutants. To address these issues, this study designed a heating system suitable for CASGs in the Gobi Desert region, integrating solar air source heat pump technology with underground pipe systems. The power consumption and performance of the system were assessed by comparing temperature and humidity in an experimental greenhouse (with the system), a control greenhouse (without the system), and outdoor environments under various typical climate conditions. The results indicated that the system exhibited excellent performance in both daytime heat absorption and nighttime heat release. Specifically, during operation, the maximum daytime temperature in the experimental greenhouse was reduced by up to 5 °C, while the minimum nighttime temperature increased by up to 8 °C, effectively preventing crop frost damage. The system achieved heat absorption rates of 14 to 16 KJ s−1 and heat release rates of 36.5 to 37.5 KJ s−1, with average coefficients of performance (COP) of 4.33 and 4.81. Compared to traditional heating methods using coal, gas, and electricity, the system reduced energy consumption by 84.7%, 81.3%, and 79.1%, respectively, and decreased greenhouse gas emissions by 8.24 t, 6.52 t, and 5.67 t, respectively. This system exhibits outstanding thermal efficiency, energy savings, and environmental benefits, while also showing promising economic benefits with a payback period of four years, providing a reliable heating solution for CASGs in the Gobi Desert region.

1. Introduction

With the global population growing rapidly and geopolitical instability persisting, the demand for food worldwide is increasing at an unprecedented rate. Protected horticulture, which makes use of non-arable land for crop cultivation, provides a dual advantage by addressing food shortages while also enhancing local incomes. As a highly energy-efficient facility, the Chinese solar greenhouse (CSG) enables year-round vegetable production during winter, relying solely on solar energy, thereby enhancing farmers’ incomes. By 2022, the scale of CSG had expanded to 810,000 hectares, accounting for less than 3.0% of the nation’s total cultivated land, yet contributing over 25.0% of agricultural output and creating millions of employment opportunities [1,2,3,4]. To promote green, energy-efficient agriculture and tackle the challenge of sustainable crop production in resource-scarce regions like the Gobi Desert, the development of solar greenhouses in these areas has become a key research point for scholars.
The Gobi Desert is rich in solar radiation and thermal resources, making solar energy a clean and renewable source with significant potential for powering solar greenhouses. However, the region faces a severe shortage of both land and water resources. While the construction and production technologies of solar greenhouses are relatively advanced, their performance in the Gobi Desert has been suboptimal. Traditional solar greenhouses rely on thick walls to ensure structural stability and provide effective thermal insulation and heat retention. However, they are hindered by long construction periods and high labor costs [5]. To overcome these challenges, researchers have developed CASG, which enable faster construction and lower labor costs, replacing traditional designs [6]. However, when applied in the Gobi region, CASGs have insufficient heat storage capacity due to the use of thinner, flexible insulation walls. During winter nights and extreme cold weather, these greenhouses struggle to retain adequate heat, resulting in slow crop growth and, in some cases, cold and frost damage [7,8,9]. Therefore, integrating CASGs with heating systems for active nighttime heating is considered an effective solution to improving their thermal environment.
Currently, most conventional heating systems rely on the combustion of fossil fuels. However, these systems consume substantial amounts of non-renewable energy, contributing to environmental issues and increasing production costs, thereby hindering efforts toward energy conservation. Actively harnessing and storing solar energy—a clean and renewable resource—for nighttime greenhouse heating shows great potential for future applications [10,11]. Previous studies have made significant contributions to the phased development of active solar energy utilization in greenhouses. Solar panels, which directly capture solar radiation, have become the preferred method for most heating systems, demonstrating considerable efficacy. However, solar energy collection systems are typically expensive and require significant maintenance. Additionally, inclement weather and surface cleanliness can directly impact the efficiency of solar radiation capture. Air source heat pumps (ASHPs) have increasingly been integrated into CASGs due to their stability and high efficiency [12]. Studies have shown that ASHP offers significant energy savings and holds strong potential for greenhouse heating applications [13,14,15,16]. Marsh and Singh [17] validated the feasibility of ASHP for greenhouse heating through life cycle cost analysis (LCC), demonstrating that it meets the requirements of greenhouse crop cultivation. TONG [18] demonstrated that the temperature distribution within greenhouses equipped with ASHP was more uniform, with reduced temperature fluctuations. Bot and Amirira [19,20] further highlighted that ASHP offers advantages in energy efficiency compared to traditional electric heating systems. Theoretical energy savings exceed 60%, and actual heating tests indicate an energy savings rate of 46.3%, which decreases to 21.3% under extremely cold climatic conditions. It has also been found that ASHP is significantly less energy efficient in response to extreme weather conditions. To further enhance the performance of ASHP under extreme weather conditions, Yang and Rhee [21] developed a heat storage and release system consisting of an air source heat pump, heat storage tank, and fan, which can collect and store excess heat on sunny days for use during extreme weather. The system’s energy savings can reach up to 50.4% under various weather conditions. However, the high cost of heat storage tanks results in limited initial investment, preventing its widespread use. The residual air heat generated by the greenhouse’s thermal effect is usually lost through ventilation. Some researchers have demonstrated that residual air heat can effectively contribute to active greenhouse heating, offering valuable insights for selecting active heat sources in the Gobi region. Additionally, the limited capacity of heat storage tanks makes it difficult to provide consistent heating within the greenhouse.
As a natural, stable, widely distributed medium with high specific heat capacity, soil holds significant potential as a heat storage reservoir. Simulations conducted by Yu Wei et al. [22,23,24] using ANSYS FLUENT 12.0 software demonstrated that buried pipes can effectively utilize the heat accumulated in the soil during the day, meeting nighttime greenhouse heating demands and preventing crop stunting caused by low ground temperatures. Research by Guo and Zhen [25,26] further confirmed that varying burial depths and bottom insulation significantly impact soil temperature, with pipes buried at a depth of 0.5 m demonstrating the highest heat transfer efficiency. Bao and Cui [27,28] designed a combined air source heat pump and underground pipe (ASHP–UP) heat storage and release system, and simulation results showed that its energy efficiency ratio is 1.0–2.0 points higher than that of a standalone ASHP system. This system also offers significant cost reductions compared to those using heat storage tanks. However, there is still a lack of actual production verification and further research on the thermal storage performance and energy efficiency of this system in practical applications. Thus, efficiently harnessing solar radiation for heating greenhouses in the Gobi region is essential for green, energy-saving development and broader applications of solar greenhouses.
This study explores the use of an assembled solar greenhouse in the Kashgar region of Xinjiang Gobi, incorporating an air source heat pump to recycle surplus air heat. An underground pipe system with circulating water was employed for heat transfer and storage within the greenhouse. Based on the comprehensive data collection on the experimental greenhouses, nighttime heat loss was quantified using the energy balance principle to determine the heating requirements. A detailed test program was developed, with precise settings for the technical parameters of each heating device. The study further evaluated the heat storage and release capacity, and validated its performance through actual production tests. The findings highlight the effectiveness of the system in improving internal air and ground temperatures, reducing humidity and temperature fluctuations, and enhancing energy efficiency and environmental benefits during winter nighttime and various typical meteorological conditions. This research provides a valuable scientific basis and technical reference for the widespread implementation of active heating systems in assembled solar greenhouses in Gobi and desert regions.

2. Materials and Methods

2.1. Experimental Greenhouse

This experiment involves two assembled solar greenhouses: A1, equipped with the ASHP–UP system, and A2, without the ASHP–UP system. Both greenhouses are located in the modern agricultural industrial park (38° N, 77° E) in Kumusaer Township, Maigaiti County, Xinjiang. The greenhouses are oriented in north–south, with a span of 12.0 m and a overall length of 80.0 m from east to west. The back height is 4.2 m, while the ridge height reaches 5.1 m (see Figure 1). Each greenhouse is equipped with an automatic ventilation system, featuring top and bottom vents 0.8 m wide. The back wall, north wall, and north roof are 0.45 m thick, with a mass of ≥3.5 kg m2. The structure is made from high-strength PE composite cloth and advanced insulation materials, employing stitching and welding techniques. These materials are specially treated to provide excellent waterproof and flame-retardant properties. The southern roof is covered with a 0.1 mm polyvinyl chloride film, while the outer layer features a thermal insulation quilt made of two layers of cotton felt and two layers of waterproof fabric. The thermal insulation quilt is rolled up at 11:00 a.m. and deployed at 7:00 p.m.

2.2. Greenhouse Thermal Calculation

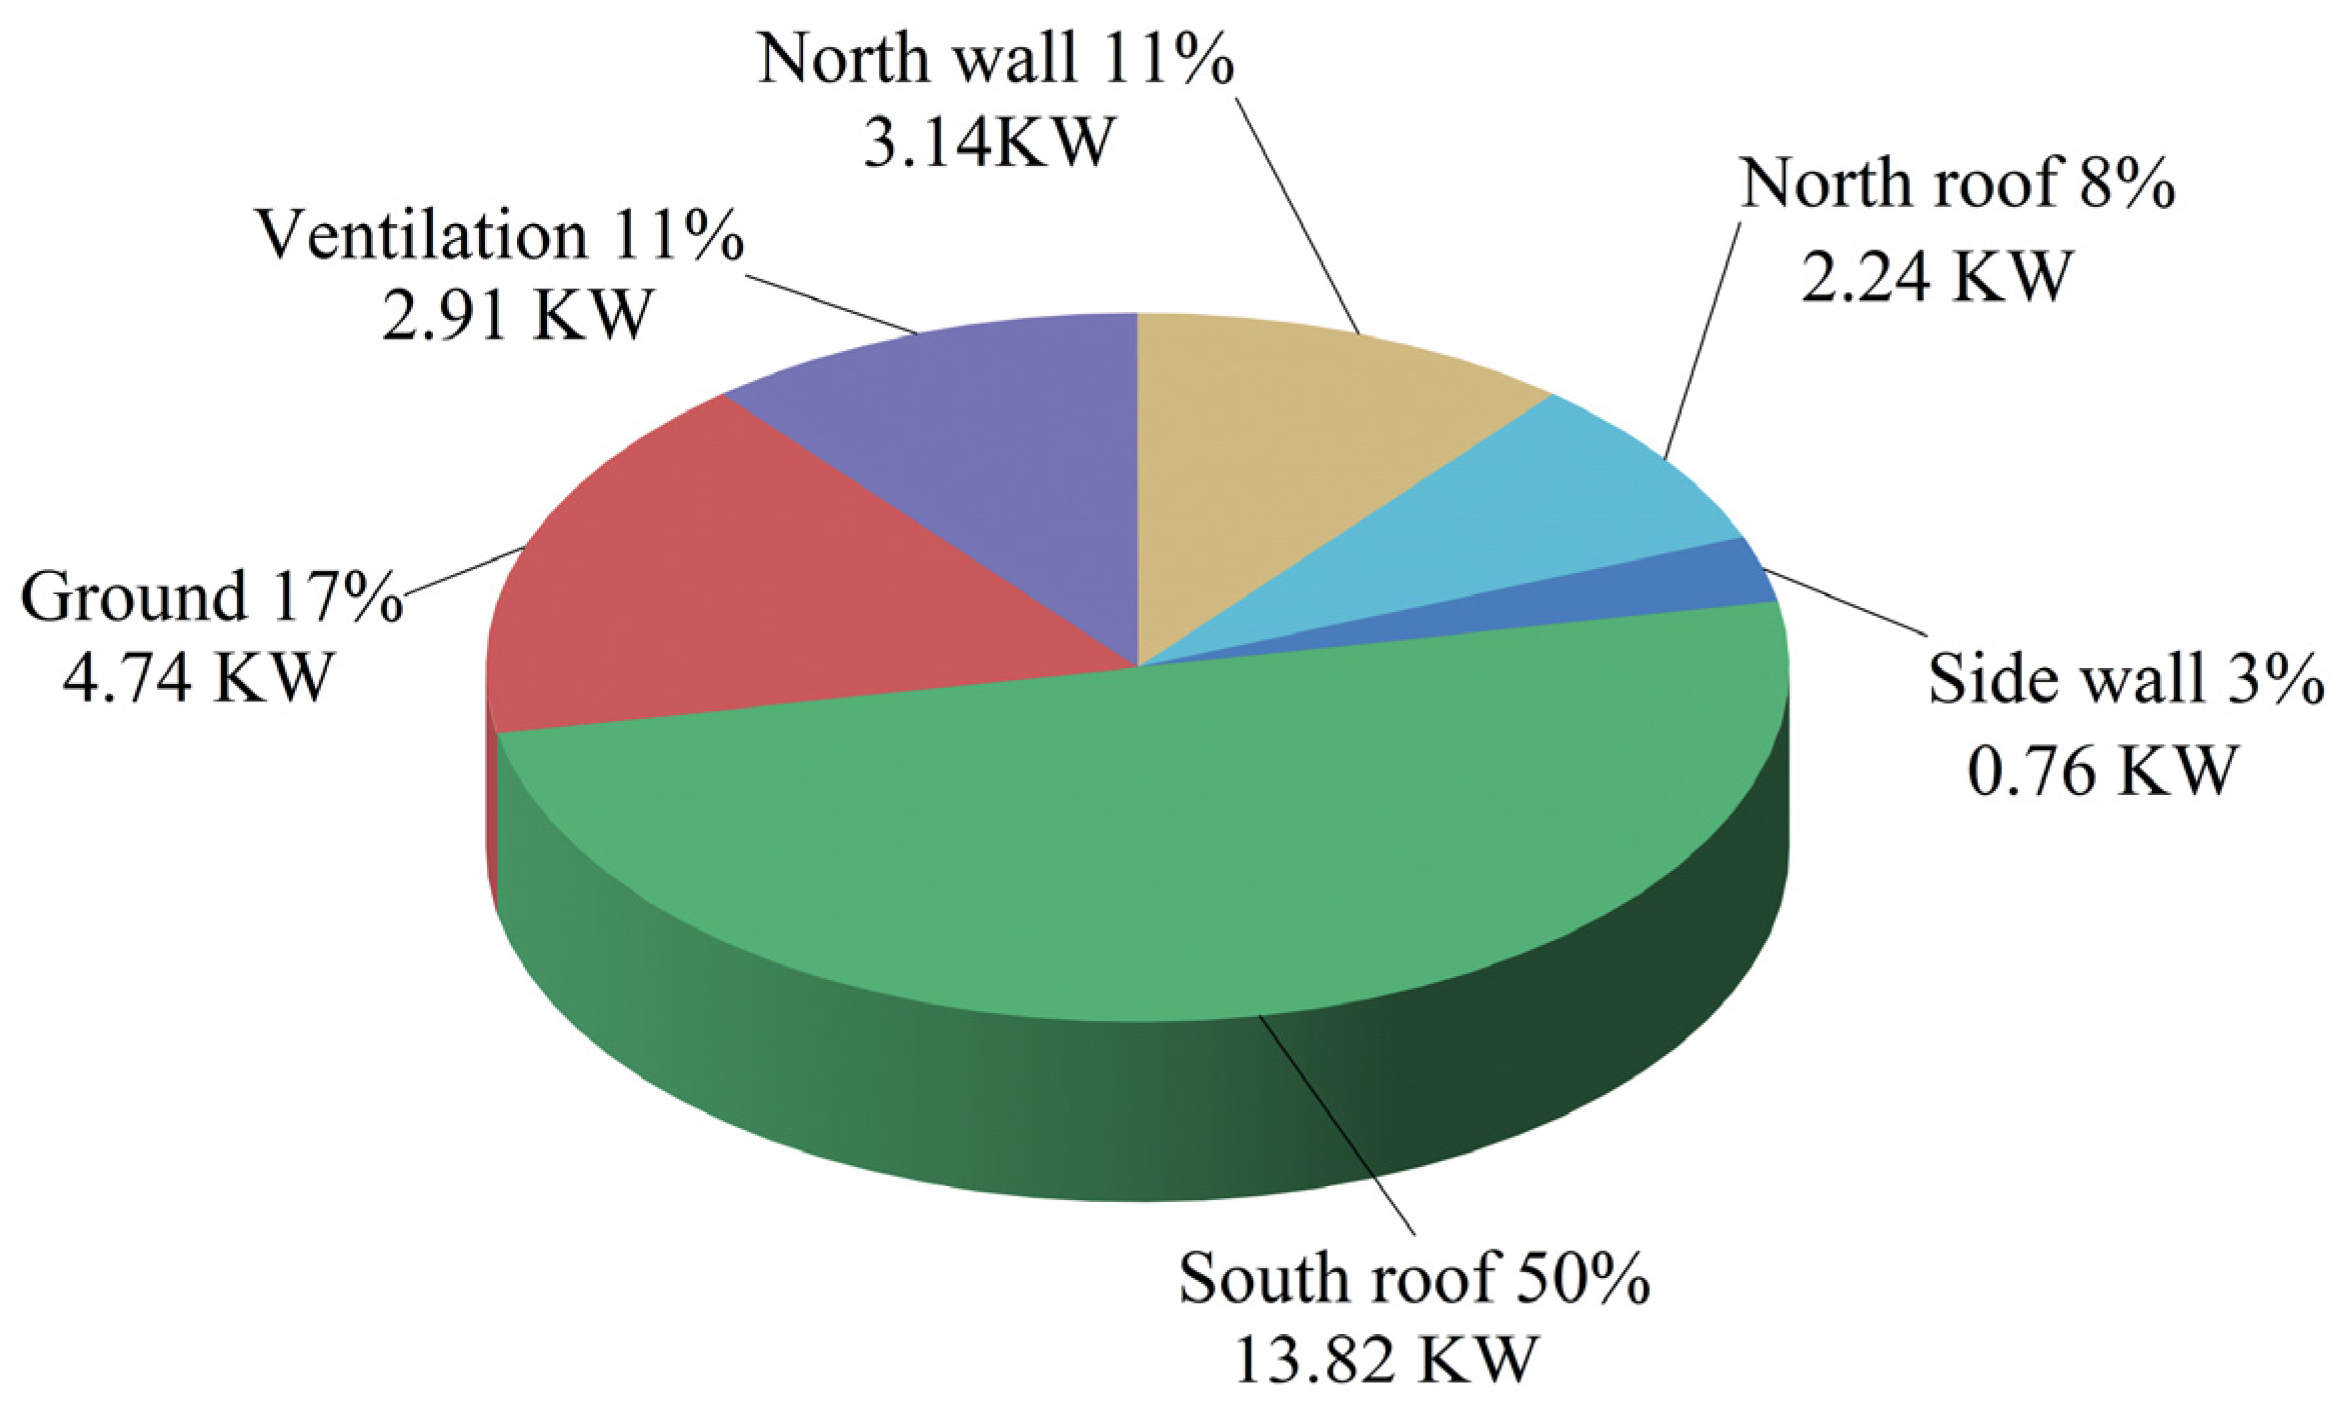
2.2.1. Heat Loss Calculation of Greenhouse at Night

To maintain the heat balance in the greenhouse, nighttime heat loss is calculated as a key indicator of energy utilization efficiency and heat preservation effect of the greenhouse [29]. This study makes the following assumptions to calculate the heat loss [30,31]: (1) the lowest outdoor temperature is used to estimate the maximum heat loss; (2) plant transpiration heat loss is neglected; (3) the influence of indoor equipment on heat transfer is ignored; (4) and temperature and ground temperature within the greenhouse are assumed to be evenly distributed. The heat loss calculation formula of solar greenhouse follows the guidelines outlined in the ’Greenhouse Heating System Design Specification’ [32]. To ensure data accuracy and minimize potential measurement errors, a data validation strategy was implemented. This involved averaging the same type of data measured at multiple locations. The arithmetic mean of these measurements was used as an input parameter in the heat loss calculation formula, thereby improving data consistency and ensuing the reliability of the calculation results.
According to the fundamental principles of heat transfer in greenhouse, heat loss is categorized into three main components: (1) heat loss of envelope structure, (2) heat loss of ground heat transfer, and (3) heat loss of cold air infiltration. Refer to Table 1 for calculation parameters related to the following equations. The heat loss of greenhouse can be calculated by Equation (1):
Q m = Q 1 + Q 2 + Q 3
The greenhouse enclosure structure is composed of south roof, north wall, north roof and side wall. The heat loss of greenhouse enclosure structure can be calculated by Equation (2) as [33]:
Q 1 = i = 1 n K i A m ( T a i T b i )
The heat in the greenhouse will transfer heat to the outdoor through the ground. Only the soil area within 2.0 m from the greenhouse maintenance edge is considered to transfer heat to the outdoor [33,34]. The heat loss of the ground at night can be calculated by Equation (3) [34]:
Q 2 = i = 1 n K b A b ( T c i T d i )
Due to the pressure difference between the indoor and outdoor air caused by wind heat, indoor air flows out through the covering material and the gaps between doors and windows, resulting in loss of heat in the greenhouse. The infiltration heat loss of the greenhouse can be calculated by Equation (4) [35,36,37]:
Q 3 = i = 1 n N W V C a ρ a ( T a i T b i )
Table 1. Various parameter values used for calculations.
System Parameter ConfigurationReference Value and UnitsSystem Parameter ConfigurationReference Value and Units
Total nighttime heat loss from greenhouse ( Q m )WGreenhouse ground thermal conductivity ( K b )0.47 W m−2 °C−1
[31]
Greenhouse nighttime envelope heat loss ( Q 1 )WSouth roof cover area ( A 1 )960.0 m2
Greenhouse nighttime ground heat loss ( Q 2 )WNorth wall area ( A 2 )280.0 m2
Greenhouse nighttime infiltration heat loss ( Q 3 )WNorth roof cover area ( A 3 )200.0 m2
Demand for night-time heating of greenhouses ( E n )MJSide wall area ( A 4 )68.2 m2
Heat released by the system per unit of time ( Q R )MJGreenhouse enclosure edge ground area ( A b )504.0 m2
Heat stored in the system per unit of time ( Q S )MJAir temperature inside the greenhouse ( T a i )20.0 °C
[30]
Running time of air source heat pumps ( t a )hAir temperature outside the greenhouse ( T b i )−15.0 °C
[30]
Running time of water pumps ( t w )hSoil temperature inside the greenhouse ( T c i )15.0 °C
[31]
Inlet water temperature of buried pipes ( T i w )°CSoil temperature outside the greenhouse ( T d i )−5.0 °C
[31]
Outlet water temperature of buried pipes ( T o w )°CGreenhouse ventilation frequency ( N )0.1 h−1
[37]
Heat pump air temperature at air inlet ( T i a )°CWind speed impact factor ( W )1.16
[32]
Heat pump air temperature at the air outlet ( T o a )°CDaylight greenhouse volume ( V )2880.0 m2
Maximum temperature of indoor environment on day ( T ai max )°CSpecific heat capacity of air ( C a )1005.0
Minimum temperature of the indoor environment on a daily basis ( T a i min )°CTheoretical hours of night heating ( t n )14.0
Total system heat storage ( Q A S H P U P 1 )WSpecific heat capacity of water ( C w )4200.0
J kg−1 °C−1
Total system heat release ( Q A S H P U P 2 )WAir source heat pump air inlet air velocity ( V 1 )2.0 m s−1
Air source heat pump operation power consumption ( E e 1 )MJAir source heat pump air inlet area ( S a )0.36 m2
Electricity consumption for pump operation ( E e 2 )MJAir density ( ρ a )1.29 kg m−3
Total power consumption for system operation ( E e )MJwater density ( ρ w )1000.0 kg m−3
Total system running time ( t e )hWater flow inside buried pipes ( ϕ w )4.0 m3 s−1
Standard coal consumption for heating the system ( M 1 )kgAir source heat pump rated input power ( P e 1 )6.3 KW
Quality of standard coal consumed for heating in coal-fired boilers ( M 2 )kgRated input power of water pump ( P e 2 )1.5 KW
Mass of standard coal consumed for heating in gas boilers ( M 3 )kgCombustion value per kg of standard coal ( J h )29,307.6 KJ
[38]
Mass of standard coal consumed for electric heating ( M 4 )kgThermoelectric Conversion Rate ( η c )36%
[39,40]
South roof thermal conductivity ( K 1 )0.72 W m−2 °C−1
[30,31,41]
Thermal efficiency of coal-fired boilers ( η t )70%
[39,40]
Side walls thermal conductivity ( K 2 )0.56 W m−2 °C−1
[30,31,41]
Thermal efficiency of gas boilers ( η w )85%
[39,40]
North wall thermal conductivity ( K 3 )0.56 W m−2 °C−1
[30,31,41]
Electric heating thermal efficiency ( η d )95%
[39,40]
North roof thermal conductivity ( K 4 )0.56 W m−2 °C−1
[30,31,41]
Natural gas discount factor ( τ )1.10
[39,40]

2.2.2. Calculation of Greenhouse Heating Demand at Night

The nighttime heating demand of the greenhouse refers to the heat required to maintain a stable indoor temperature within the suitable range for plant growth, and its value is greater than or equal to the heat loss at night. The calculation method involves summing the heating demand of each time period at night. The heating demand for each time period is equal to the multiplication of heat loss and duration at this time. The heating demand of the greenhouse at night is calculated by Equation (5) [29]:
E n = 3.6 Q m t n 10 3

2.3. System Design of the Air Source Heat Pump Combined with Underground Pipe

2.3.1. Parameter Design

According to Equations (1)–(4), the heat loss of the greenhouse at night is calculated. The rated power of the air source heat pump is at least 30.0 KW, with an input power of 6.3 KW [21,31,34]. Considering the influence of buried depth on the water pressure in the pipeline, the water flow rate of the pump selected in the experimental design is 10.0 m3h−1 [25,26,28]. Additionally, to accommodate the water consumption of the buried pipe, the water storage capacity of the tank must meet the total water consumption, which is approximately 500 L for both the main and branch pipes. The volume of the water tank used in the test is no less than 0.5 m3, and the specific parameters of the equipment are shown in Table 2.
The design parameters of the underground pipe system begin with determining the distribution of the buried pipelines to ensure uniform heating across the entire greenhouse floor. In this study, a central point along the east–west axis of the greenhouse was chosen as a reference, extending to the side walls in both directions (see Figure 2). This design approach combines structural symmetry, promotes uniform heat flow distribution, simplifying the heat transfer model, enhances data representativeness, and optimizes system design. The goal of this layout is to create a balanced thermal environment inside the greenhouse, facilitate theoretical analysis, and maximize the efficiency of thermal energy use, thereby increasing the scientific and practical value of the study. A double-layer pipeline design, consisting of both main and branch pipelines, was implemented. Compared to a single-layer pipeline design, this configuration not only enhances ground heat transfer efficiency but also reduces the number of pipeline bends, which in turn lowers flow resistance and decreases the workload of the circulating water pump.
The burial depth was chosen based on the fact that tomato root systems are primarily distributed within the top 0.5 m of soil, ensuring sufficient heating for the surrounding soil. Previous research has shown that pipes buried at 0.5 m offer optimal heat transfer, further supporting this choice. To balance heat transfer efficiency with material costs, the spacing between adjacent buried pipes was set at 0.9 m [42,43]. This configuration involved using 24 U-shaped branch pipes with a diameter of 32 mm. To ensure sufficient water flow, the diameter of the main pipe was set at more than twice that of the branch pipes [25,26]. There, the main pipe has a diameter of 63 mm and consists of four individual pipes.

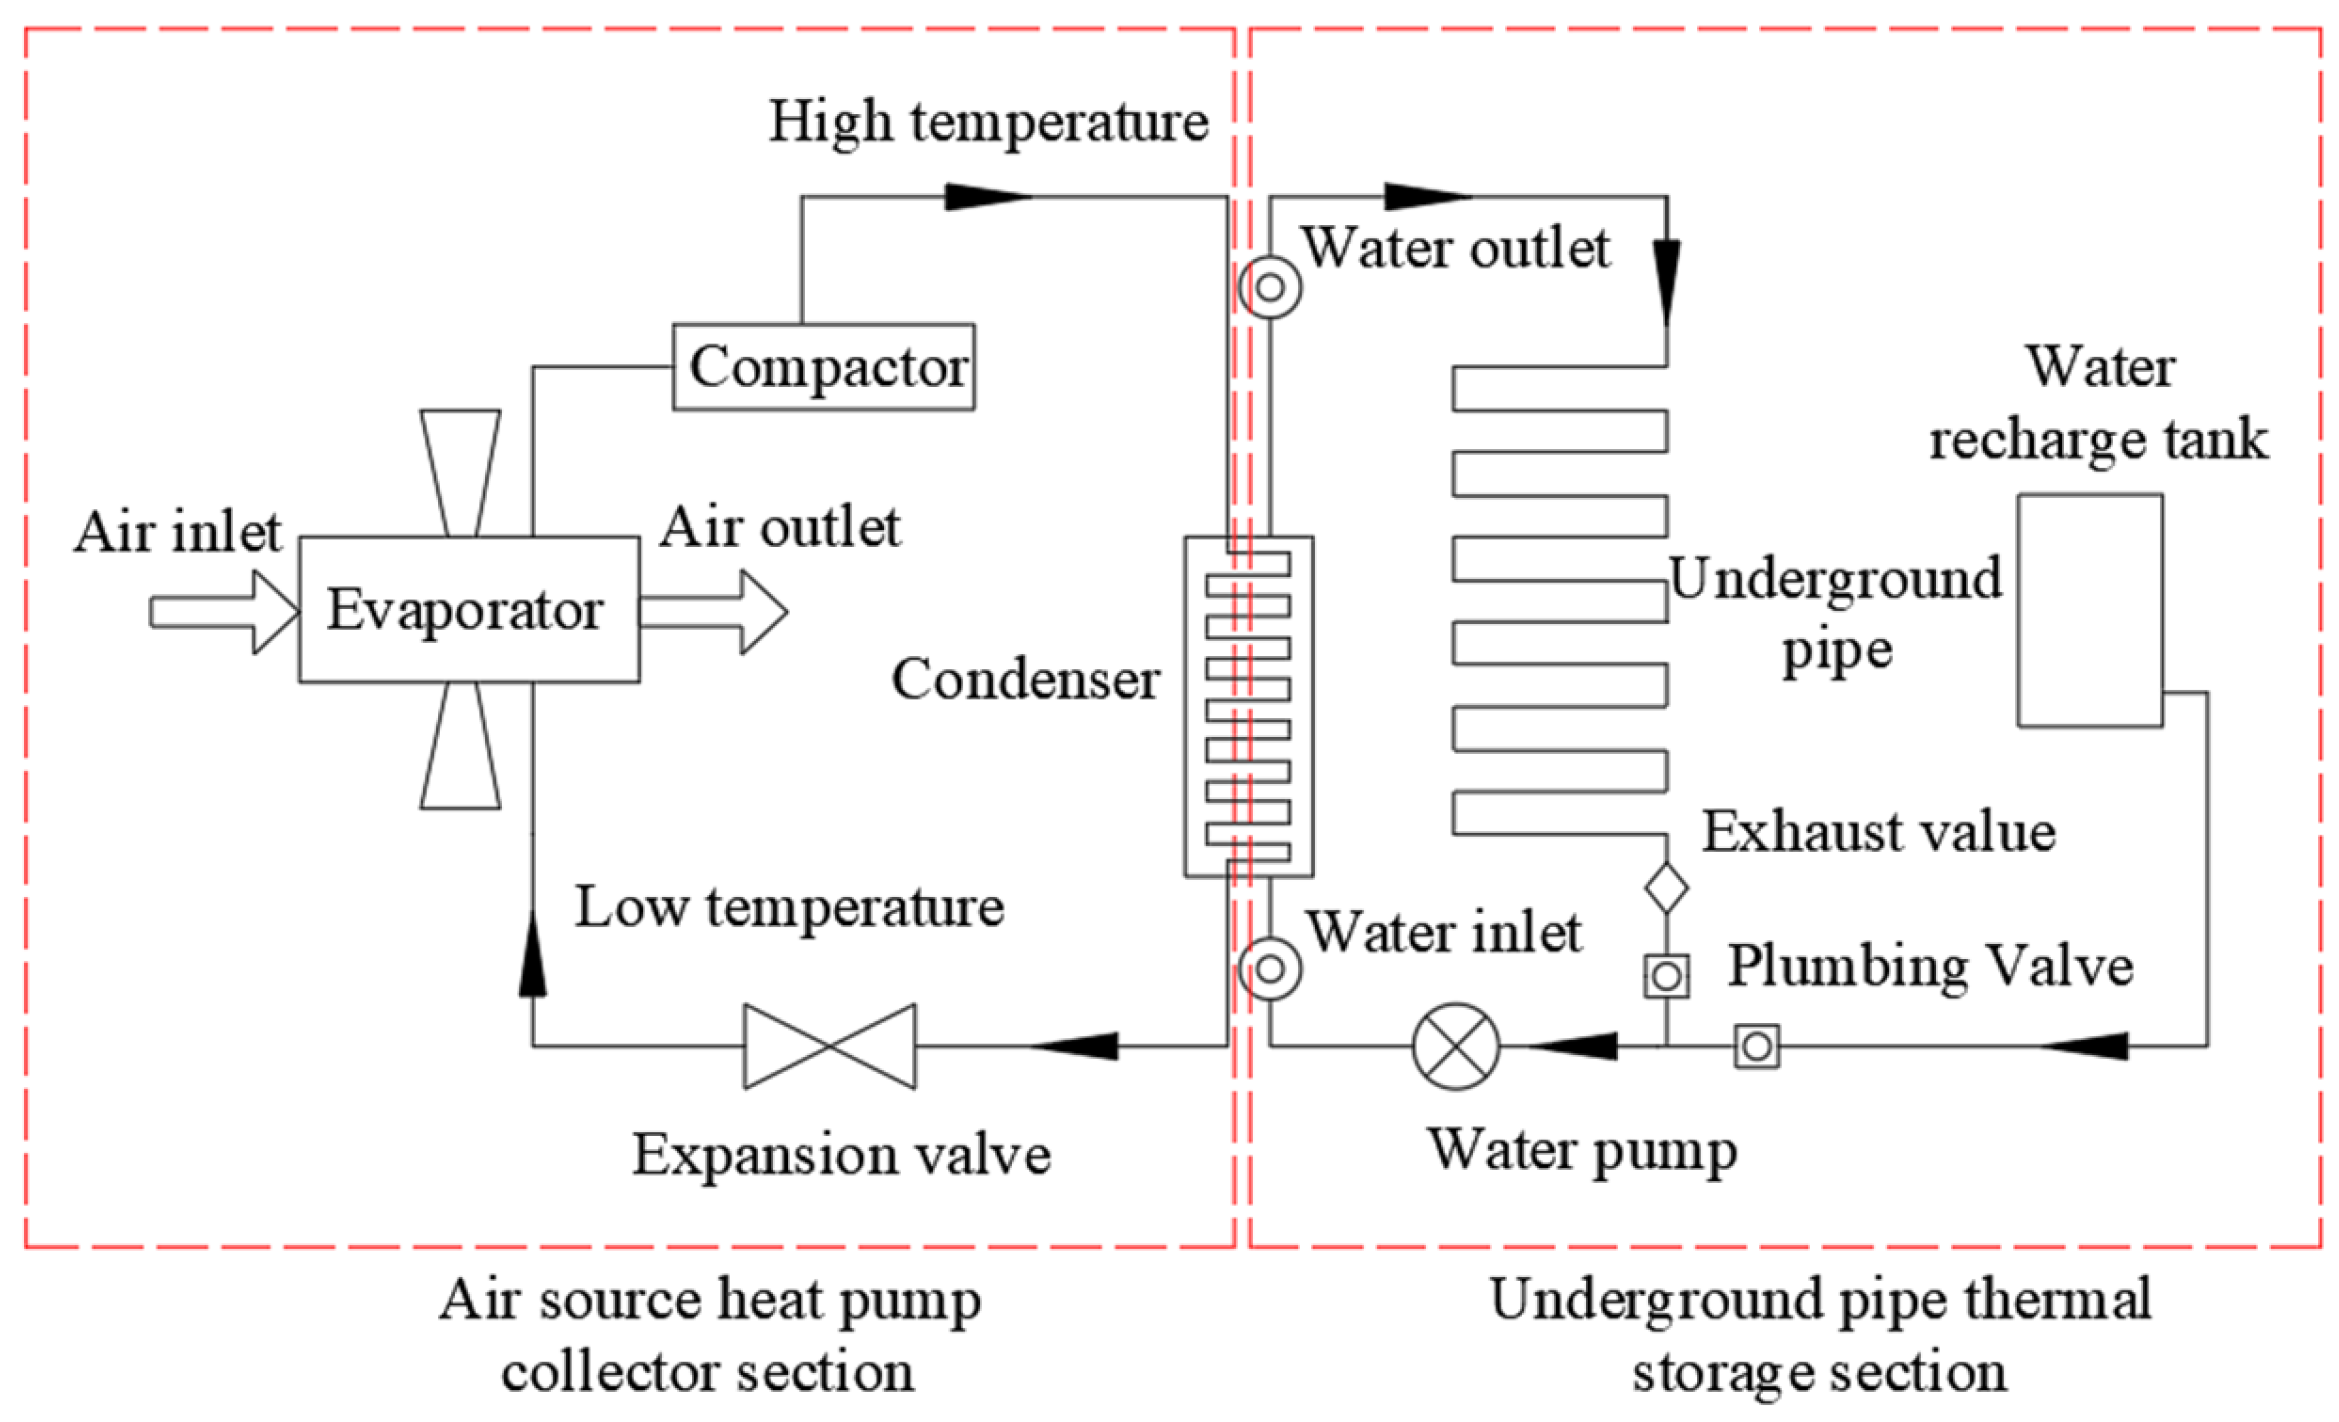
2.3.2. System Principle

Based on the structure and parameter design of the assembled solar greenhouse, along with detailed heat load calculations, an air source heat pump combined with a buried pipe system was developed. The system operates by collecting residual heat from the indoor air during the day through the air source heat pump, transferring it to the soil via the buried pipes for storage. At night, the stored heat is released back into the air to raise the indoor temperature. The operation is monitored in real-time using temperature sensors placed throughout the greenhouse. The transmission module collects and processes the temperature data, then transmits it to the control unit through the wired connection. The control unit receives the temperature data and, based on the preset temperature threshold, controls the circuit, activating or deactivating the air source heat pump and the water pump to manage the soil heat storage and release. (see Figure 3).

2.3.3. System Operational

The ASHP–UP system operates in two modes: Heat Storage (HS) and Heat Release (HR). During the test period, the crops planted in the two greenhouses were tomatoes of Guanqun No.4 (planted in October 2023), and the temperature range suitable for tomato growth was between 15 °C and 25 °C.
Heat storage mode: When the temperature in the greenhouse exceeds the set start temperature of 25 °C, the system starts the heat storage mode. The system collects the surplus air heat energy in the greenhouse air into the heat-carrying medium of the heat pump unit. The heat is then stored in the soil through the ground heat exchanger. When the temperature in the greenhouse drops to 15 °C, the system closes the heat storage mode to avoid excessive cooling.
Heat release mode: When the indoor temperature drops to 10 °C, the system enters the heat release mode. The heat stored in the soil is used as a low-level heat source to heat the indoor air. When the indoor temperature is raised to the set stop temperature of 12 °C, the system shuts down the heat release mode.
The application of the ASHP–UP system in the study follows these key steps: First, the conceptual design and numerical simulation are conducted to determine the optimal parameters for the heat pump and buried pipe configuration. Next, a site investigation and geologic assessment are conducted to decide the location and layout of the buried pipe system. Then, the installation and commissioning of the system are carried out to ensure all components function correctly. Afterward, long-term performance monitoring is undertaken to collect data on the system’s operation. Finally, a comprehensive evaluation of the system’s thermal efficiency, environmental impact, and economic feasibility is performed through data analysis. These steps aim to validate the system’s real-world performance and provide a scientific foundation for replication in similar greenhouse environments.

2.4. System Heat Storage and Release Calculation

The heat storage capacity of the ASHP–UP system is calculated based on the water temperature difference between the inlet pipe and the return pipe of the buried pipe system (Equation (6)). The heat release of the system can be calculated according to the air temperature difference at the outlet of the air source heat pump (Equation (7)) [38,41,44]:
Q R = C w ϕ w t w ρ w ( T i w T o w ) / 10 - 6
Q S = C a V 1 t a S a ρ a ( T o a T i a ) / 10 - 6

2.5. Experimental Method

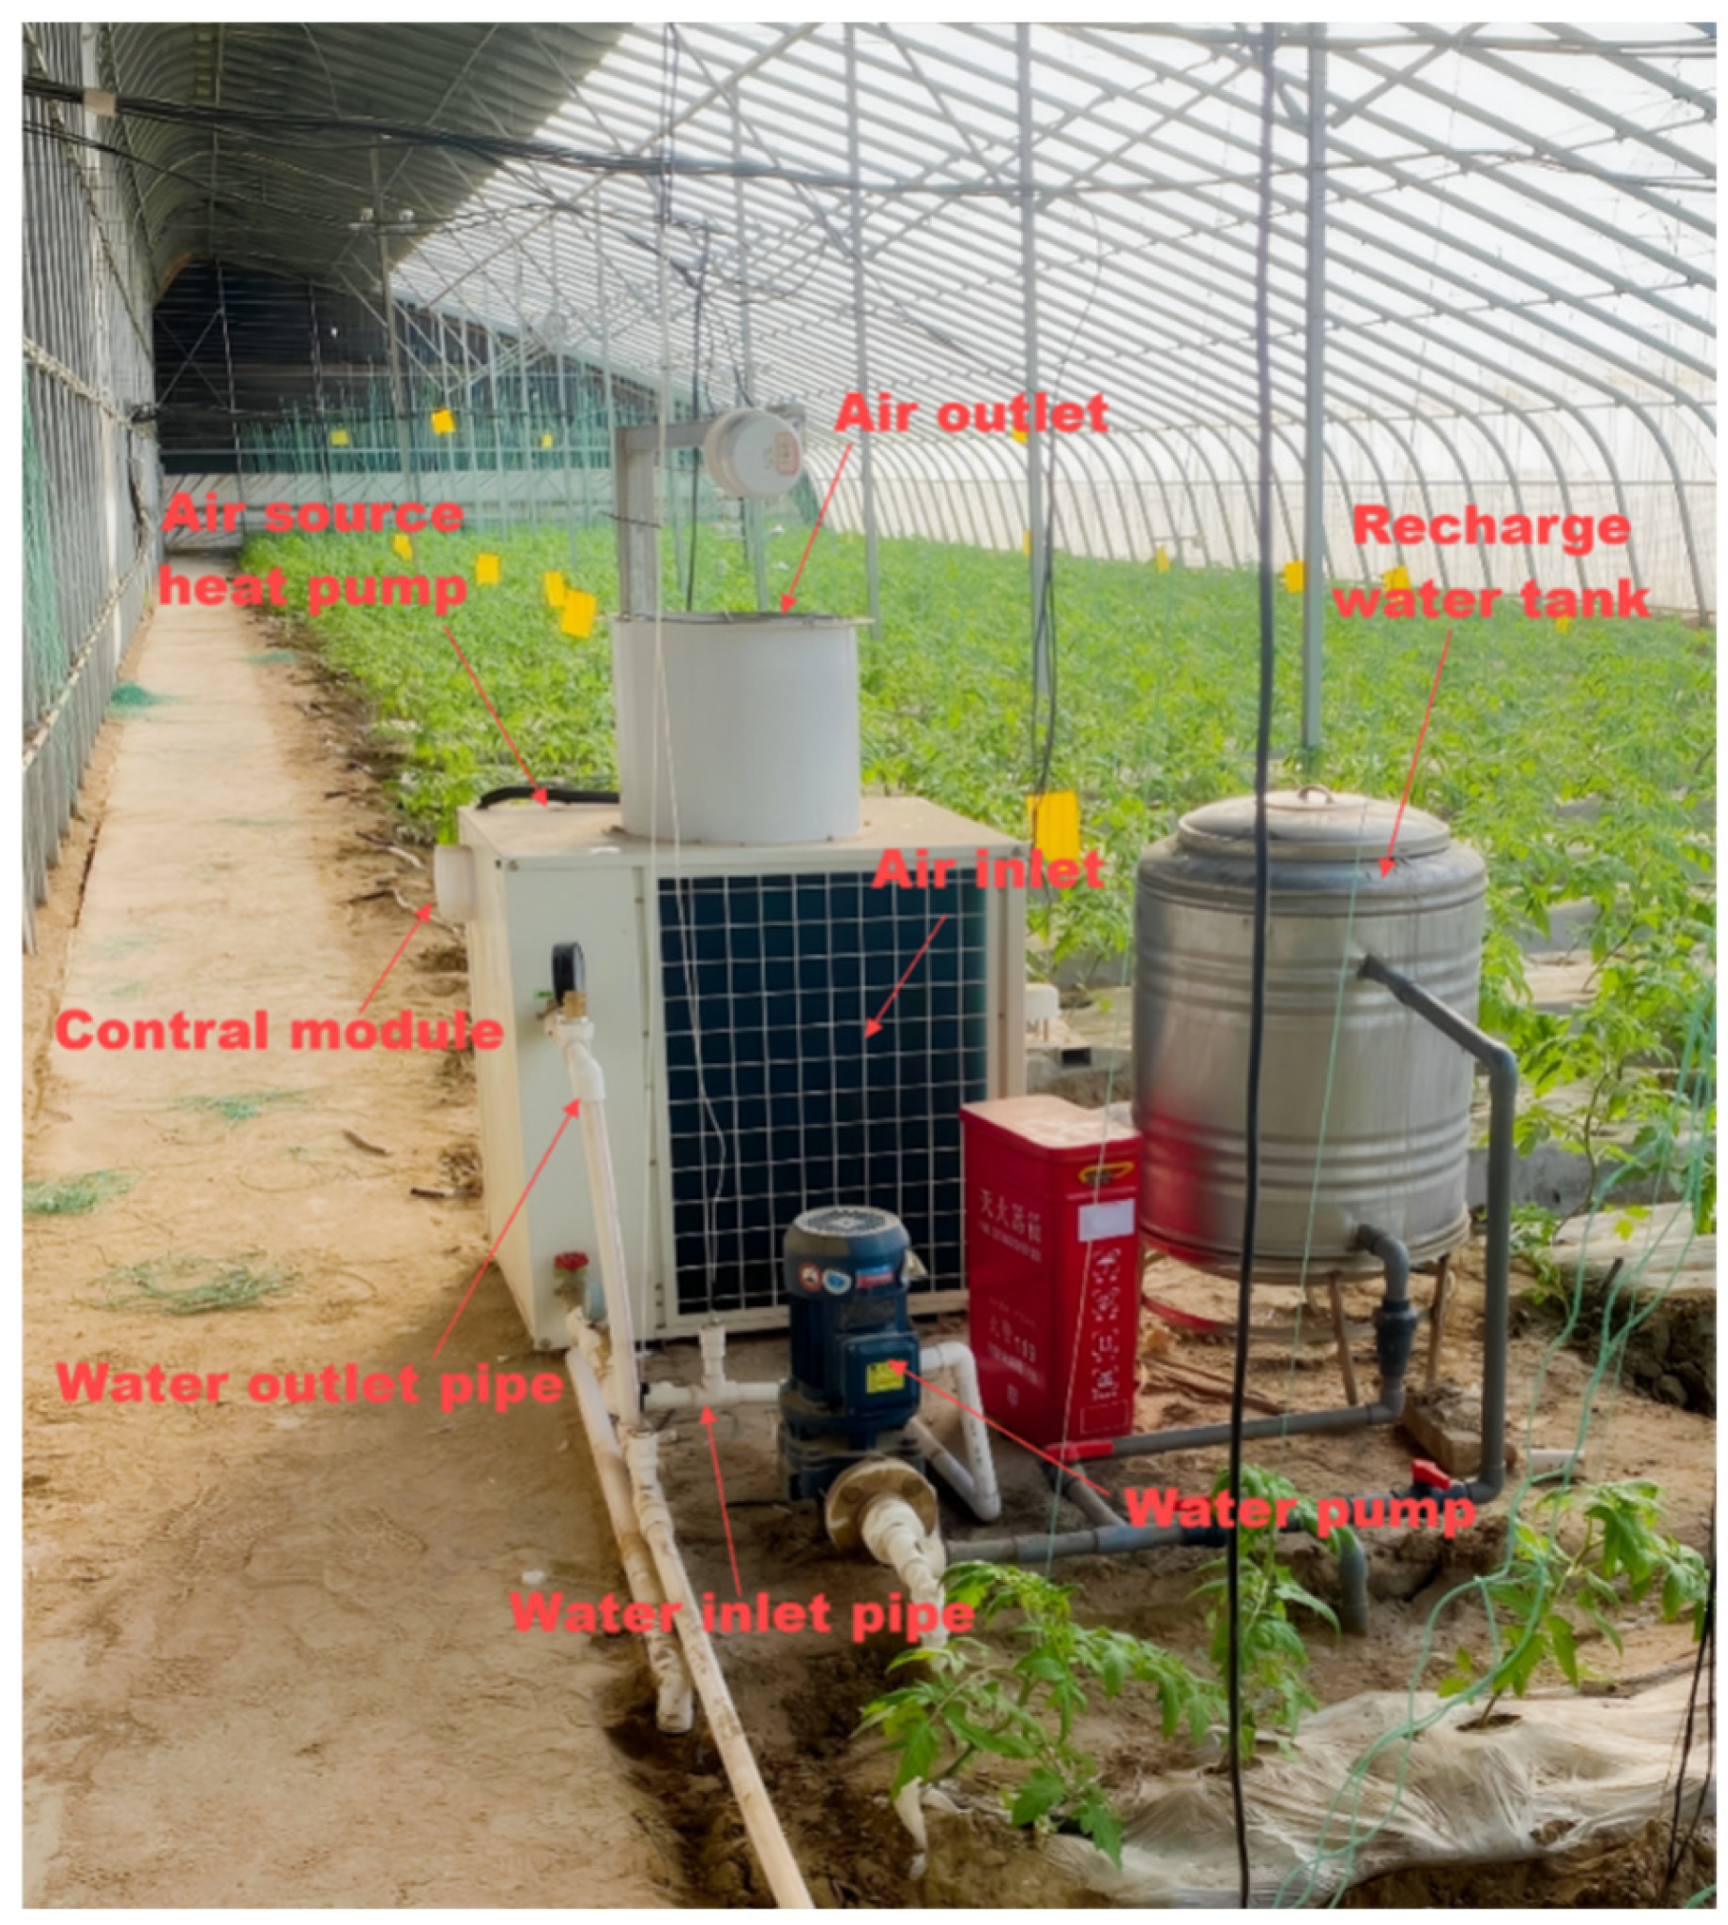
2.5.1. Selection and Arrangement of Test Device

The ASHP–UP system consists of several key components: an air source heat pump, a buried pipe, a water pump, a make-up tank, and a control module. The control module includes a temperature sensor, a transmission module, a control unit, a drive circuit, and a human–computer interaction interface. Specifically, the air source heat pump used is the AW-5CR model (Dunham Bush Industrial Co., Ltd., Yantai, China), and the circulating water pump is of the YE2-90S-2 type (Ningxia Caiyunda Electromechanical Pump Co., Yinchuan, China). The water pipes are made of PVC, while the water tank is a cylindrical, stainless steel insulated tank(Great White Elephant Water Supply Equipment Co., Ltd, Urumqi, Xinjiang Uygur Autonomous Region, China), positioned centrally along the length of the greenhouse, 1.0 m from the north wall (see Figure 4).

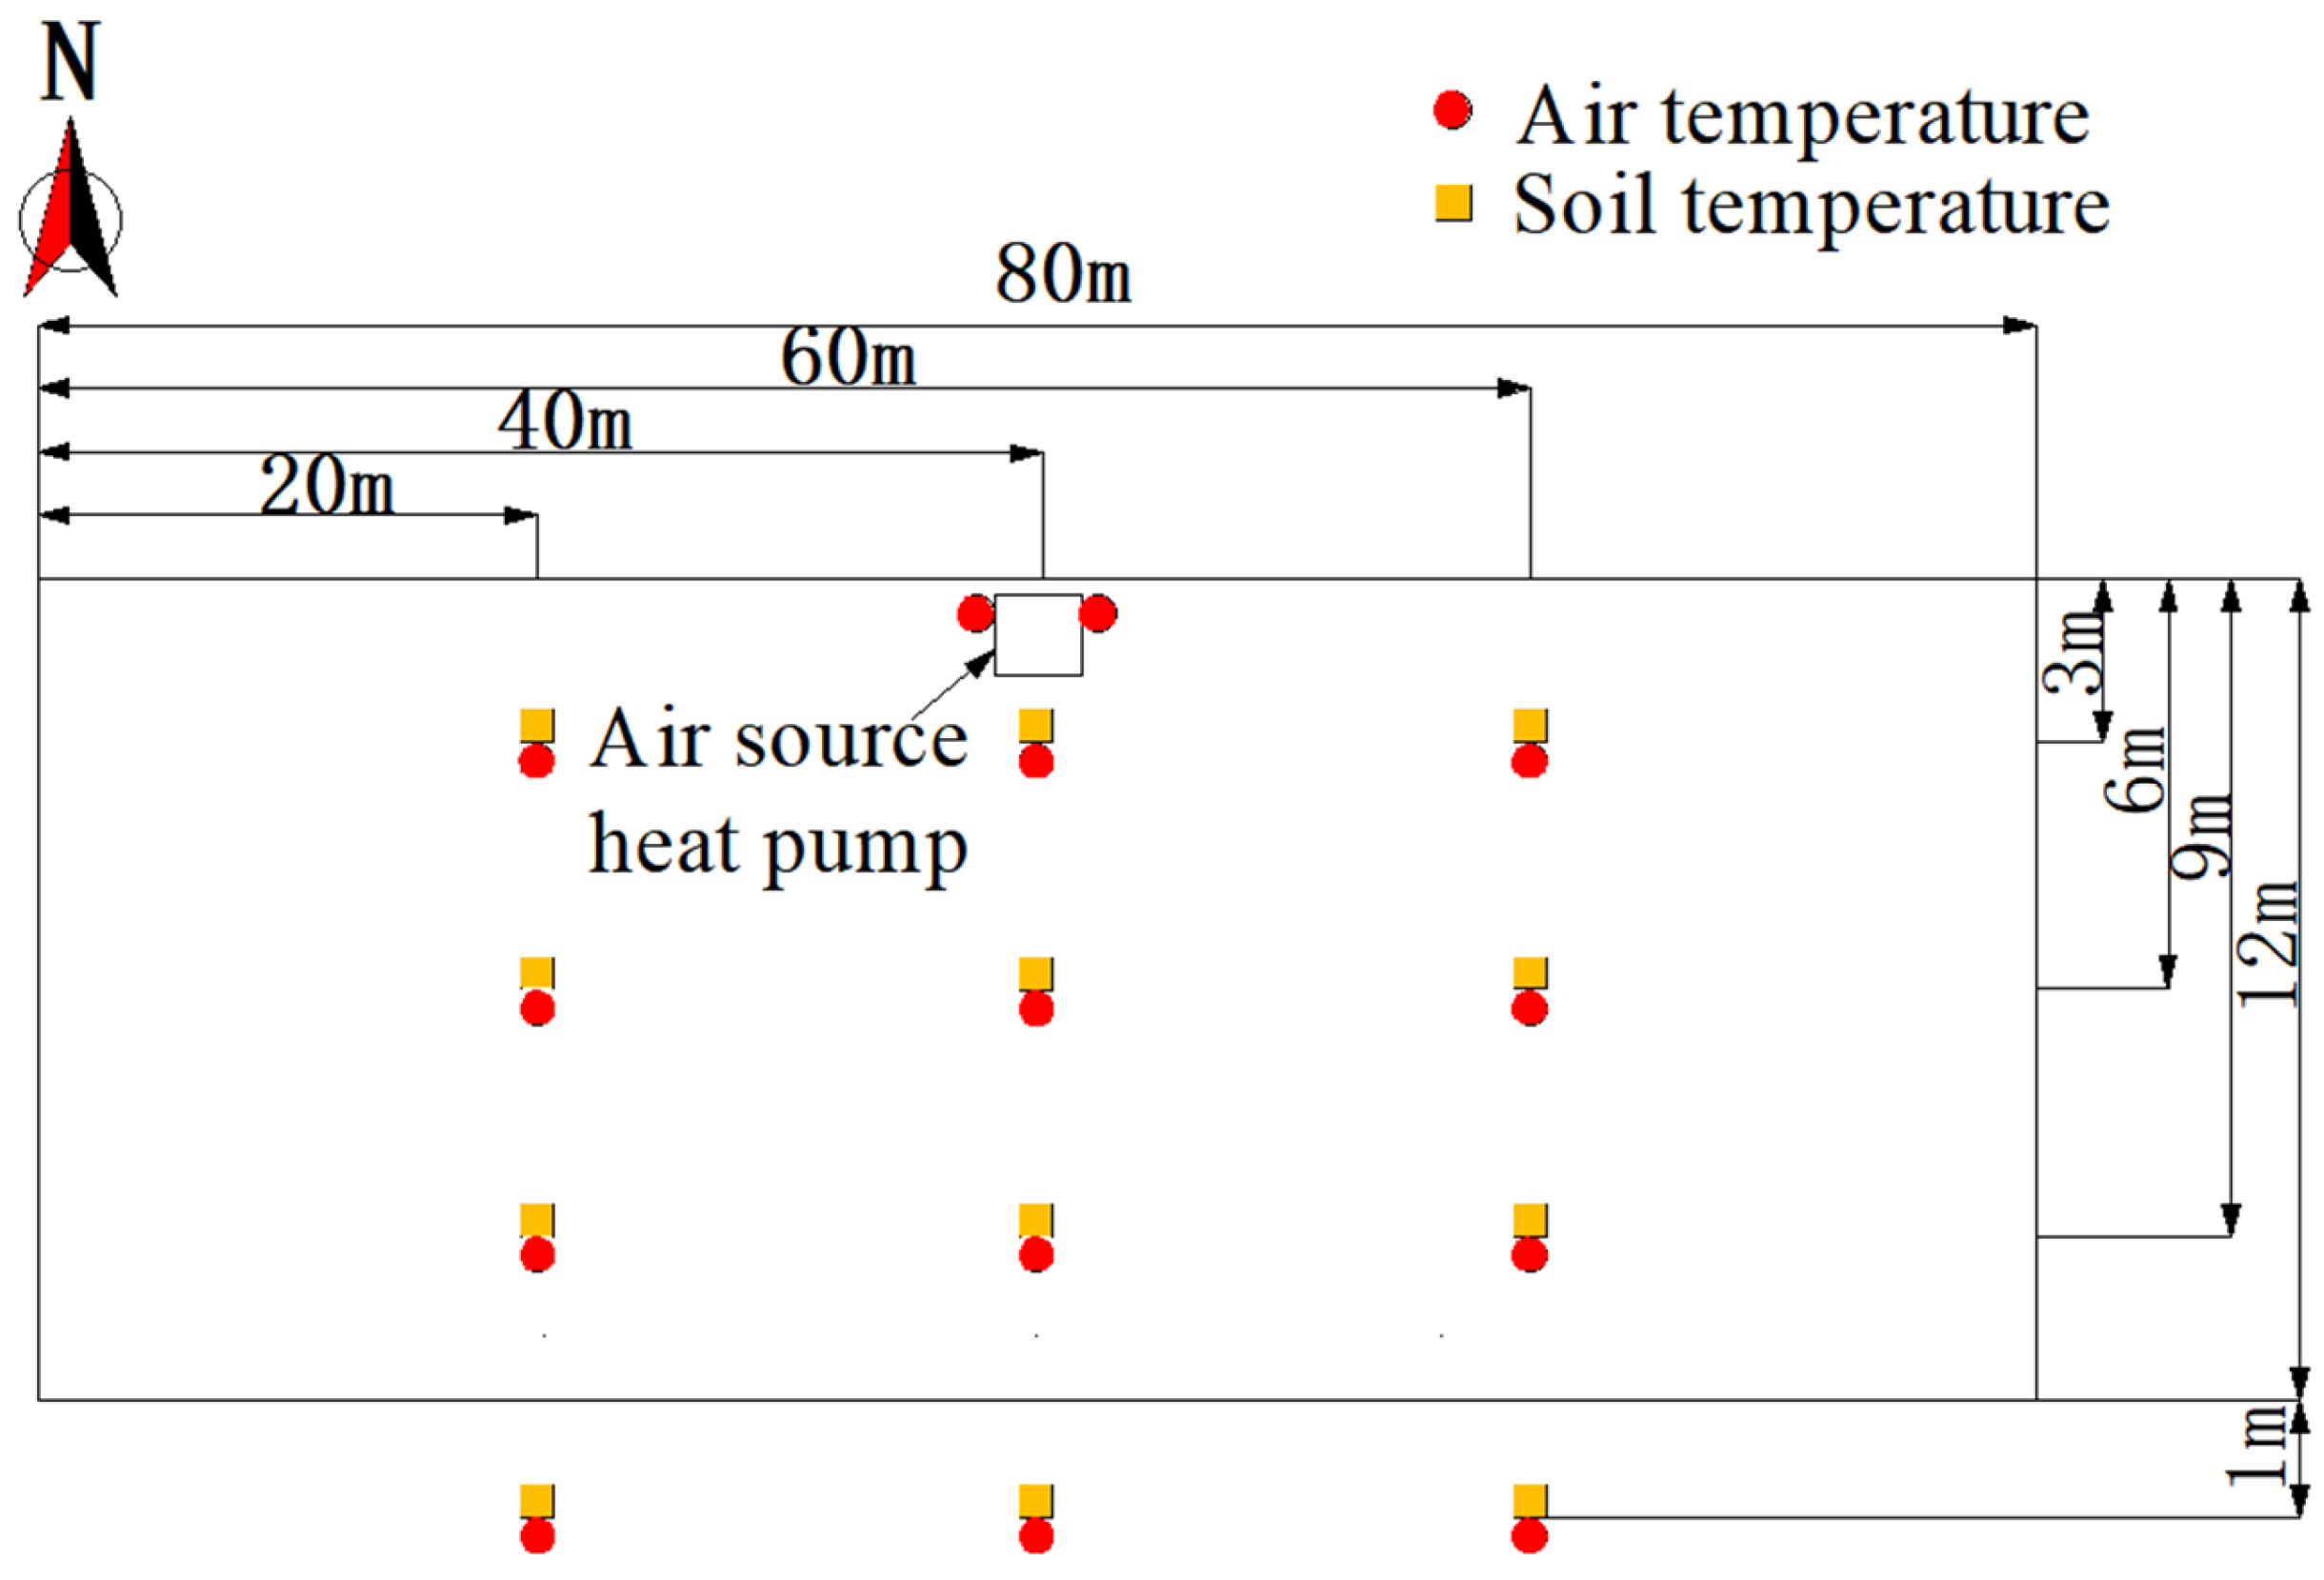
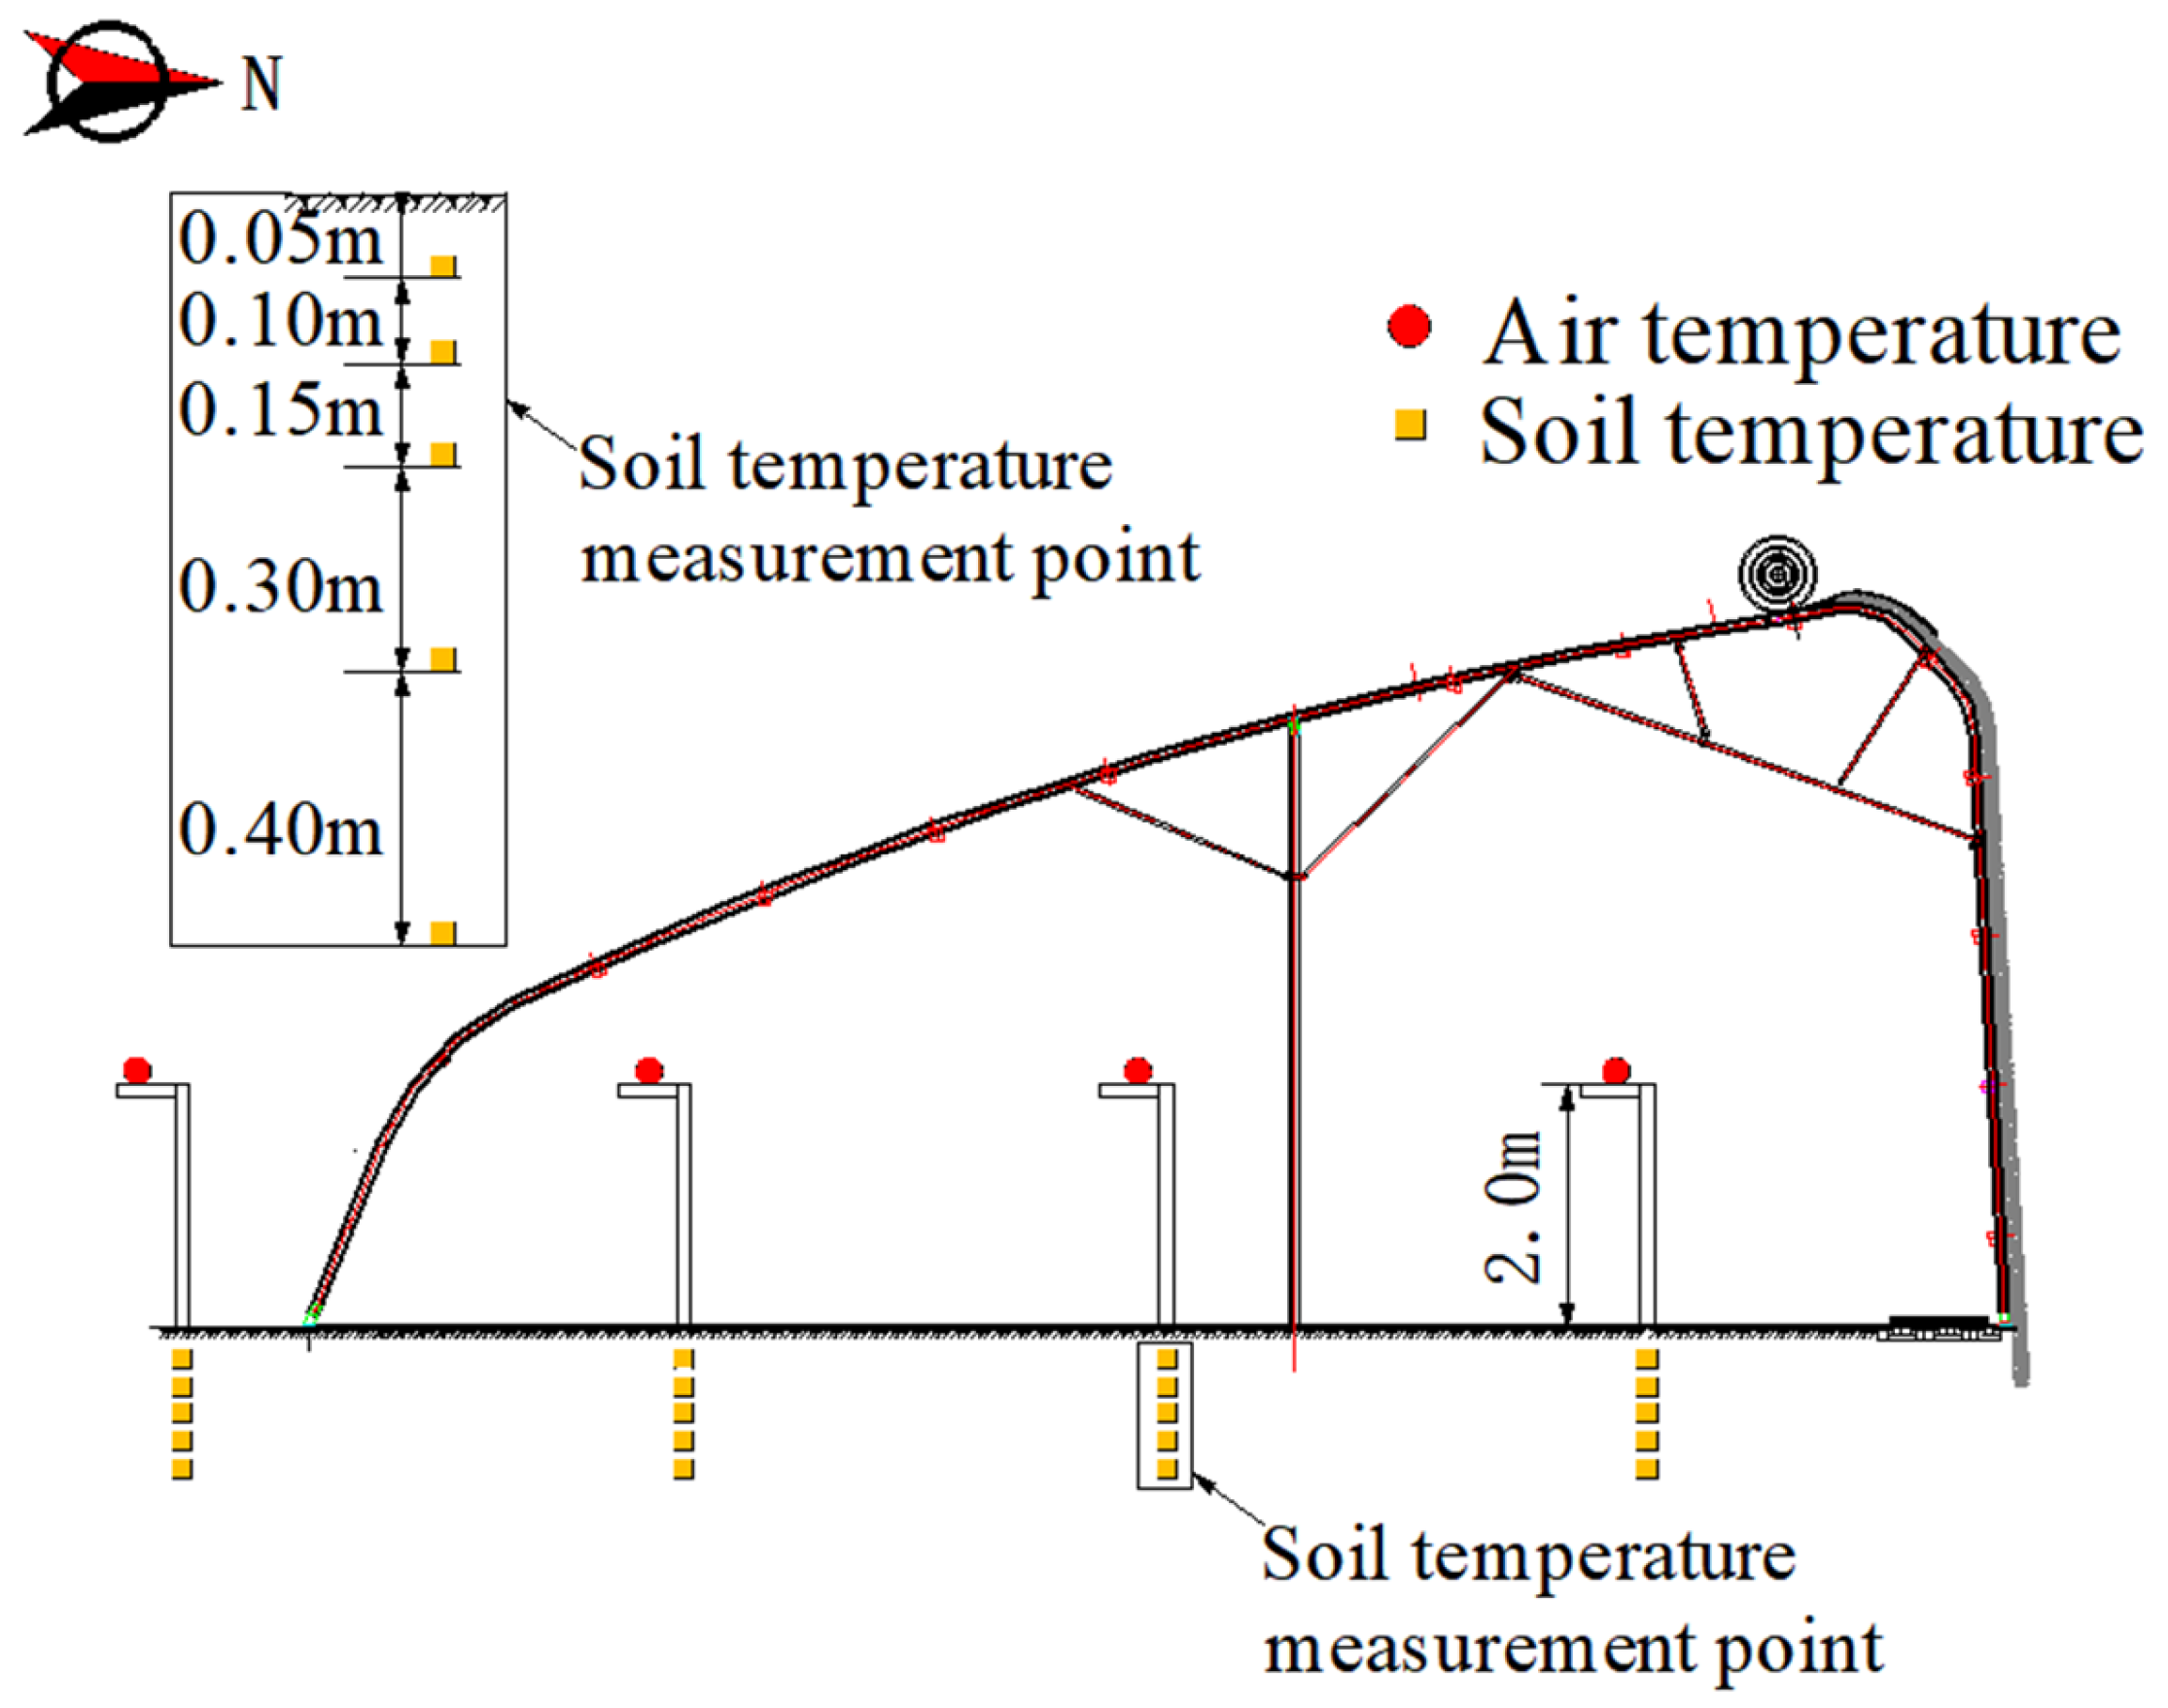
2.5.2. Arrangement of Testing Points

The testing period spans from 1 December 2023 to 29 February 2024. The test parameters include soil temperatures at various depths (both indoors and outdoors), indoor and outdoor air temperatures, as well as the inlet and outlet air temperatures of the air source heat pump and the inlet and outlet water temperatures of the buried pipe. The arrangement of the measurement points is shown in Figure 5 and Figure 6. (1) Indoor Measurements: Soil and air temperatures are recorded at different depths: 20, 40, and 60 m from the side wall along the greenhouse’s longitudinal axis, and 3, 6, and 9 m from the back wall along the span. An air temperature sensor is placed at a height of 2 m above the ground, while soil temperature sensors are installed at depths of 0.05, 0.15, 0.30, 0.60, and 1.00 m below the surface. (2) Outdoor Measurements: The measurement points are aligned horizontally with the indoor ones, with air and soil temperature sensors positioned at the same height and depth as those indoors, located 1 m from the base of the southern roof. (3) Air Temperature Measurement Points: Air temperature sensors are positioned at both the inlet and outlet of the air source heat pump unit. Nine measurement points are set up indoors to monitor air and ground temperatures at different locations within the greenhouse, while three measurement points are designated outdoors to monitor outdoor air and soil temperatures. Average values of indoor and outdoor air and soil temperatures are calculated to minimize data errors and improve accuracy. (4) Water Temperature of Buried Pipes: Water temperature sensors are positioned at both the inlet and outlet of the buried water pipe.
The RS-WS-120-2 air temperature sensor (range: −40–80 °C, accuracy: ±0.1 °C), WZPT-TP-WK-FY3PF water temperature sensor (range: −50 to 200 °C, accuracy: ±0.5 °C), RS-WS-120-TR-1 soil temperature sensor (range: −40–80 °C, accuracy: ±0.5 °C), and RS-TBQ-120-AL solar radiation sensor (range: 0–2000 W m−2, accuracy: ±3%) are all manufactured by Kunlun Zhongda Company, Beijing, China. The KZ101-16 PT100 (Kunlun Zhongda Company, Beijing, China) module collects the sensor data and converts it into digital signals, which are then transmitted to the server for storage via GPRS-4G wireless (Kunlun Zhongda Company, Beijing, China) communication. The data acquisition interval is set to 30 min.

2.6. Calculation of Greenhouse Temperature Fluctuation

Temperature fluctuations in the greenhouse significantly impact crop growth. To ensure a stable environment that supports optimal crop development and increases yield, it is crucial to minimize temperature fluctuations. Quantifying the temperature fluctuation is crucial for evaluating the thermal performance of ASHP–UP system [45,46]. The temperature fluctuation is calculated by Equation (8) [47]:
TLL = T a i max T a i min T a i max + T a i min
TLL is used to evaluate temperature fluctuations and reflect the impact of ASHP–UP system on the greenhouse’s thermal environment. The system absorbs indoor heat during the day for night heating, and as a result, the TLL value should decrease. Smaller temperature fluctuations within the greenhouse result in a more stable thermal environment, which is beneficial for crop growth and improve overall productivity [48,49].

2.7. System Performance Coefficient Calculation

COP is commonly used to evaluate the efficiency of greenhouse heating system [38,50,51]. For the ASHP–UP system, the heat storage COP is equal to the ratio of the system heat storage to its system power consumption, while the heat release COP is equal to the ratio of the system heat release to its power consumption. The power consumption of the system is composed of air source heat pump and water pump. The COP can be calculated by Equations (9) and (10):
C O P = Q A S H P U P i 3.6 ( Q e 1 + Q e 2 )
E e i = P e i t e

2.8. Energy Saving and Environmental Protection Calculation

The energy-saving evaluation standard employed in this study is based on the consumption of standard coal. The heat generated by the combustion of alternative energy sources is represented in terms of standard coal. The power consumption of the system translates into the amount of standard coal required to produce the same amount of heat, and this is compared to the amount of standard coal consumed by coal-fired boilers, gas-fired boilers, and electric heating system. The equivalent standard coal consumption is used as a reference indicator [39,52]. The conversion of power consumption for the ASHP–UP system to equivalent standard coal consumption is computed using Equation (11):
M 1 = E e η c J h
The amount of standard coal required to produce the same heat as a coal-fired boiler is calculated using Equation (12) as follows:
M 2 = E e J h η t
The amount of standard coal consumed to produce the same amount of heat as a gas-fired boiler is calculated by Equation (13) as follows:
M 3 = E e J h η w τ
The amount of standard coal consumed to produce the same amount of heat as electric heating is calculated by Equation (14) as follows:
M 4 = E e η c J h η d

3. Results and Discussion

3.1. Analysis of Night Heating Demand in Greenhouse

The maximum nocturnal heat loss in the greenhouse was calculated to be 27.61 kW using Equations (1)–(4), with 19.96 kW (72.0% of the total) occurring through the greenhouse enclosure structure. This was followed by ground heat loss at 4.74 kW, which constituted about 17.0% of the total, and infiltration heat loss, which measured at least 2.91 kW, accounting for roughly 11.0% of the total heat loss. Within the enclosure, the south roof contributed the most to heat loss with 13.82 kW (50.0% of the total), followed by the north wall at 3.14 kW (11.0%), the north roof at 2.24 kW (8.0%), and the side wall at 0.76 kW (3.0%) (Figure 7). Based on this, a 30 kW air source heat pump was chosen to meet the nighttime heating needs of the greenhouse and maintain temperature stability.
Additionally, the impact of the assumptions made during the calculation of greenhouse heat loss on the study’s results can be summarized as follows: First, by selecting the lowest outdoor temperature moment for heat loss calculations, the results represent the upper limit of heat loss under extreme climatic conditions, providing a conservative safety margin for the design of greenhouse insulation and heating systems. Second, overlooking plant transpiration heat loss and the effect of indoor equipment on heat transfer may lead to underreported heat losses, which could affect the accurate evaluation of greenhouse thermal management strategies. Finally, assuming a uniform distribution of air and ground temperatures simplifies the heat transfer process but may reduce the applicability and accuracy of the results, as it fails to account for the actual non-uniform heat distribution. In conclusion, the results of this study should be regarded as theoretical estimates under specific assumptions, and their application in practical scenarios should consider potential biases introduced by these assumptions.

3.2. Analysis of Heat and Moisture Characteristics of Heating Greenhouse

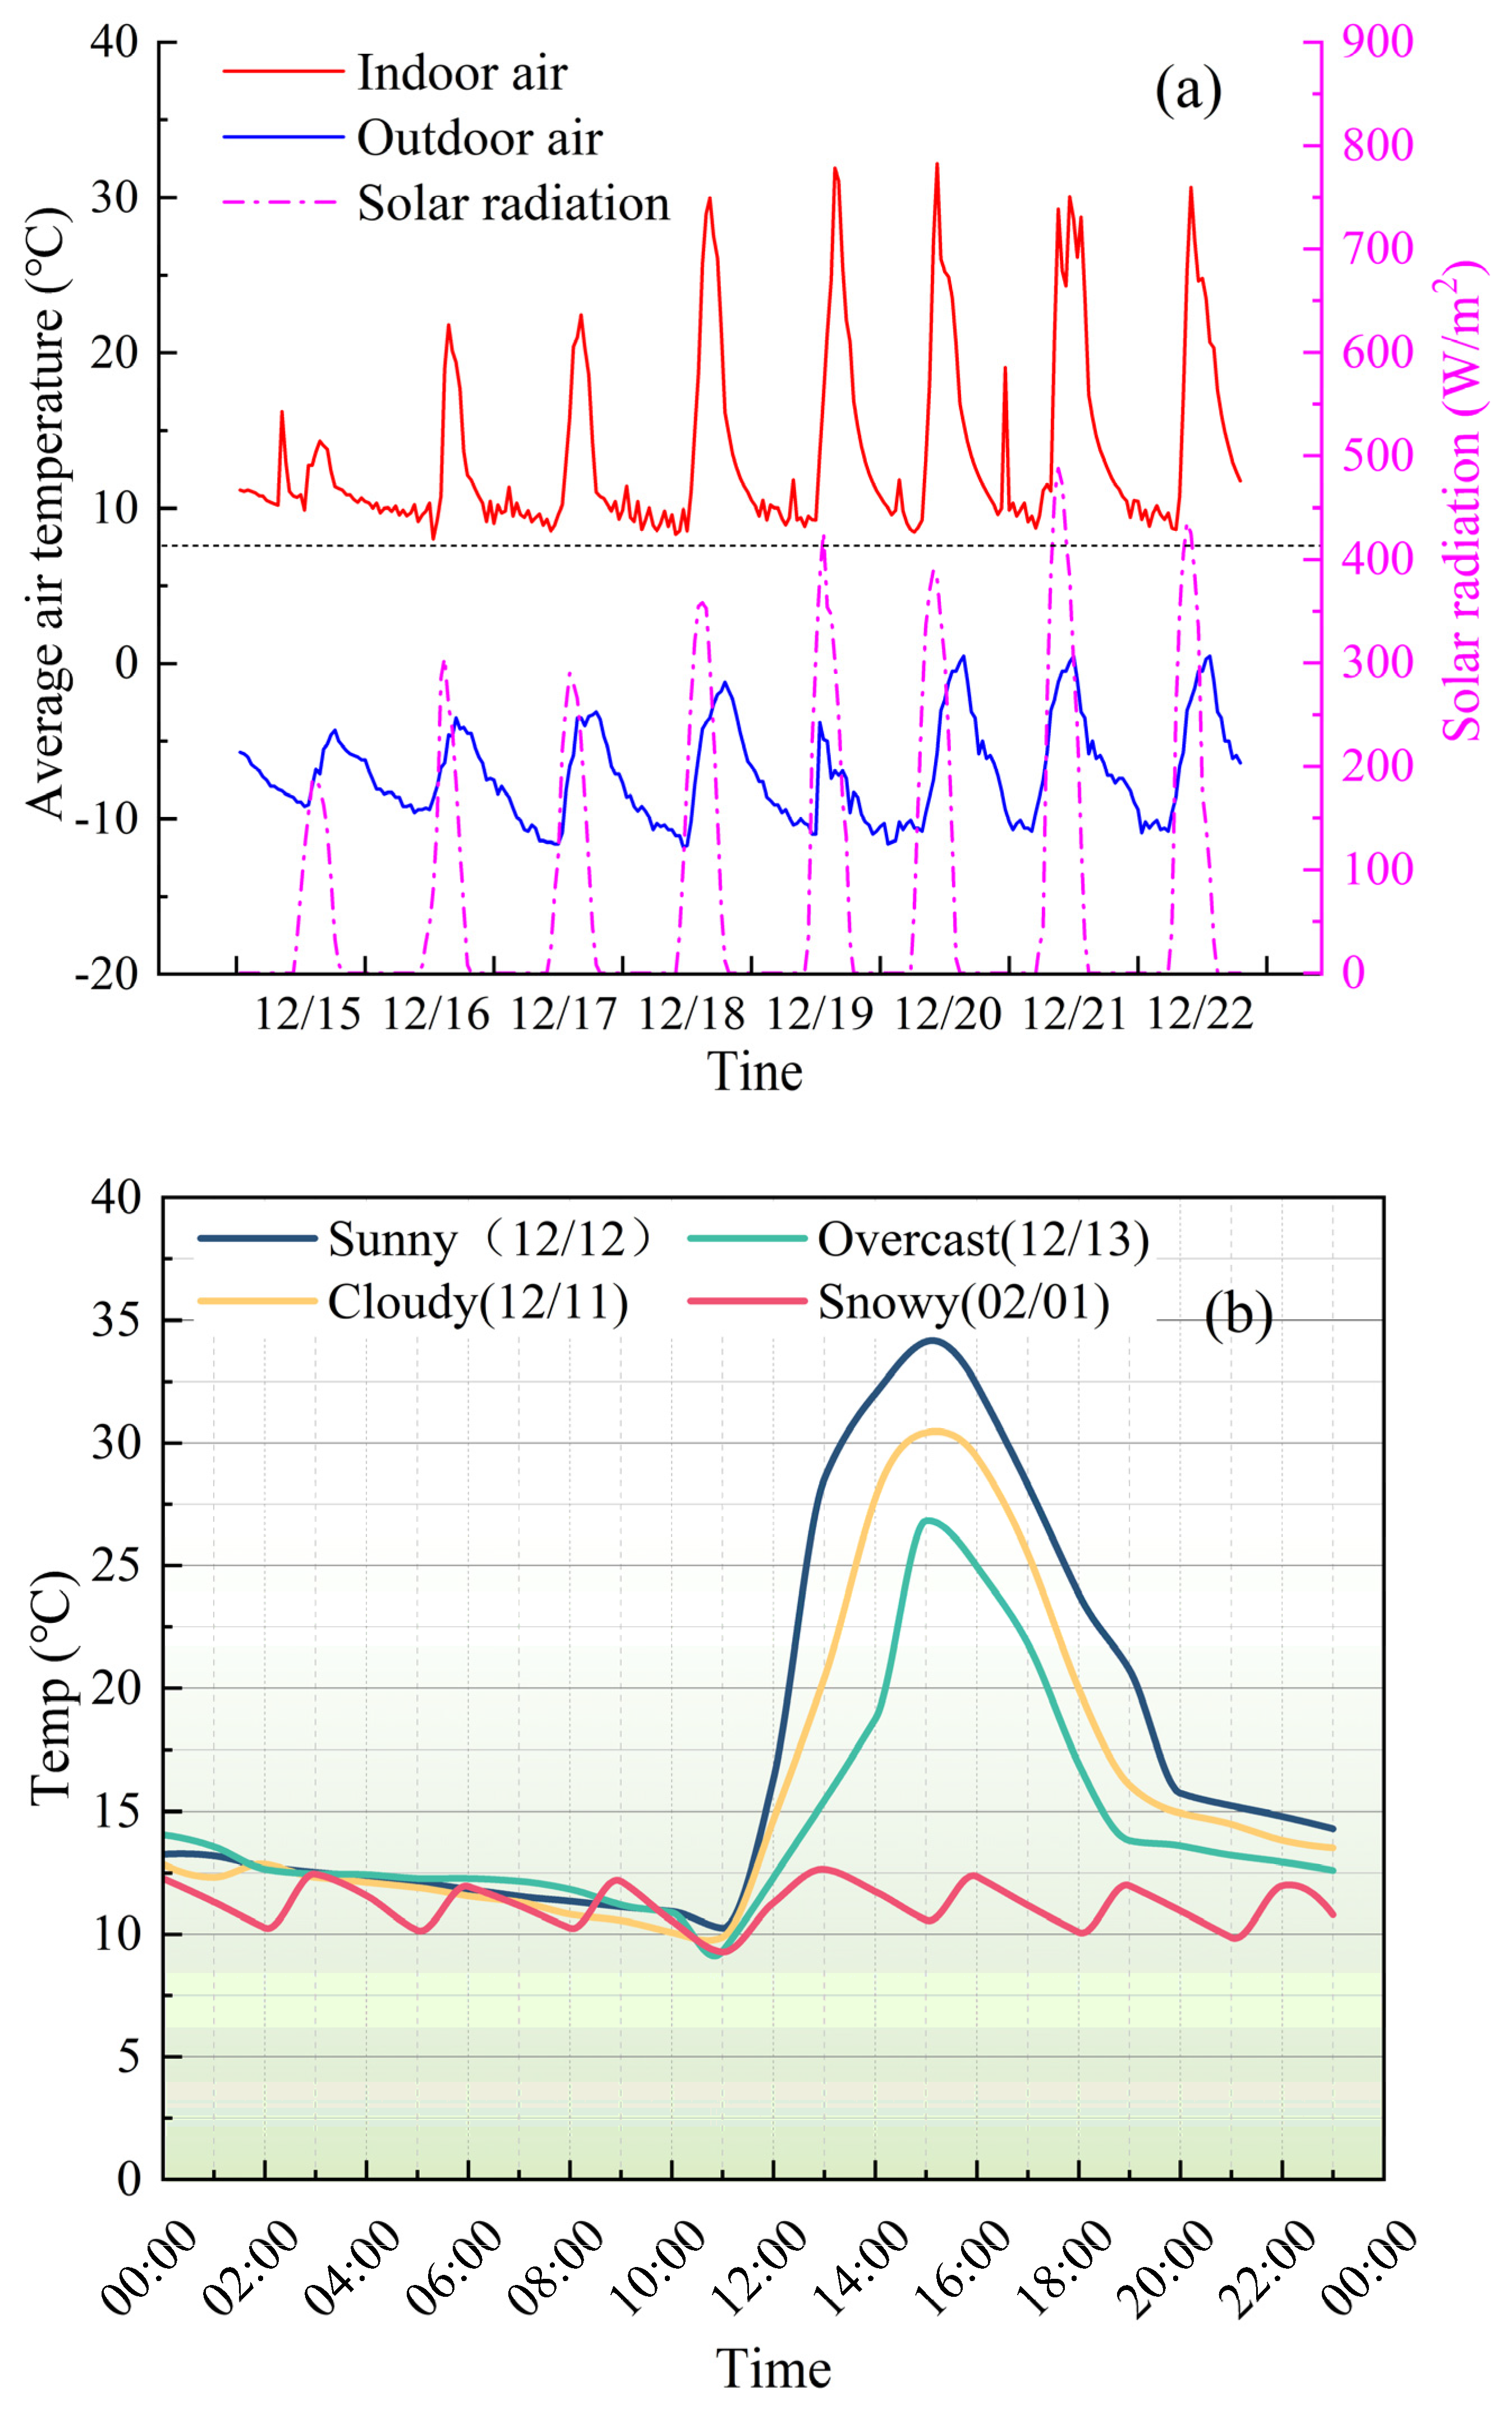
3.2.1. Air Temperature Change

To further assess the heating effect of the air source heat pump combined with the buried water pipe in the experimental greenhouse, Figure 8a shows a comparison of the average air temperatures inside and outside the greenhouse over several consecutive days. The maximum outdoor solar radiation on cloudy days was limited to 200–300 W/m2, while on typical sunny days, it could reach up to 460 W/m2. During the cold winter months in Xinjiang, when the outdoor minimum temperature drops to −12 °C, the air source heat pump system significantly improved greenhouse heating. Regardless of cloud cover, the indoor minimum temperature reached above 8.8 °C, with the temperature difference between indoor and outdoor exceeding 20 °C, ensuring optimal conditions for crop growth. To comprehensively calculate the total heat storage during the daytime in the greenhouse, temperatures under four typical weather conditions—sunny day (December 12), cloudy day (December 11), cloudy day (December 13), and snowy day (February 1)—were selected for analysis. Temperature variations across these weather conditions exhibited notable similarities. From 00:00 a.m. to 10:00 a.m., the temperature decreased gradually. However, from 10:00 a.m. to 11:00 a.m., the rate of decrease accelerated. This rapid drop in indoor temperature can be attributed to the retraction of the heat-preserving material during this period, coupled with the low outdoor temperatures. In contrast, significant differences were also observed in the temperature variations across different weather conditions. On sunny and cloudy days, the temperatures increased rapidly from 11:00 a.m., peaking at 15:00 p.m. to 16:00 p.m. at 34.13 °C and 30.41 °C, respectively. Under cloudy conditions, the temperature began to rise rapidly from 12:00 p.m., reaching a peak of 25.81 °C at 16:00 p.m. Conversely, the temperature on snowy days remained relatively stable, ranging from approximately 9.0 to 12.6 °C throughout the day. During the heat storage phase, the temperature increase was greatest on sunny days at 10.50 °C, followed by 4.51 °C on cloudy days and 2.71 °C on snowy days (Figure 8b). When the indoor temperature exceeded 25.0 °C, the rate of temperature increased slows. At this point, the system entered heat storage mode, transferring heat from the air into the soil via the circulating water system. When the indoor temperature fell below 10.0 °C, the system activated the exothermic mode, releasing the heat stored in the soil to raise the indoor temperature. As the temperature rapidly increased to 12.0 °C, the system deactivated the exothermic mode, halting any further temperature rise. This cycle repeats whenever the temperature drops below 10.0 °C, following the same trend as described above.

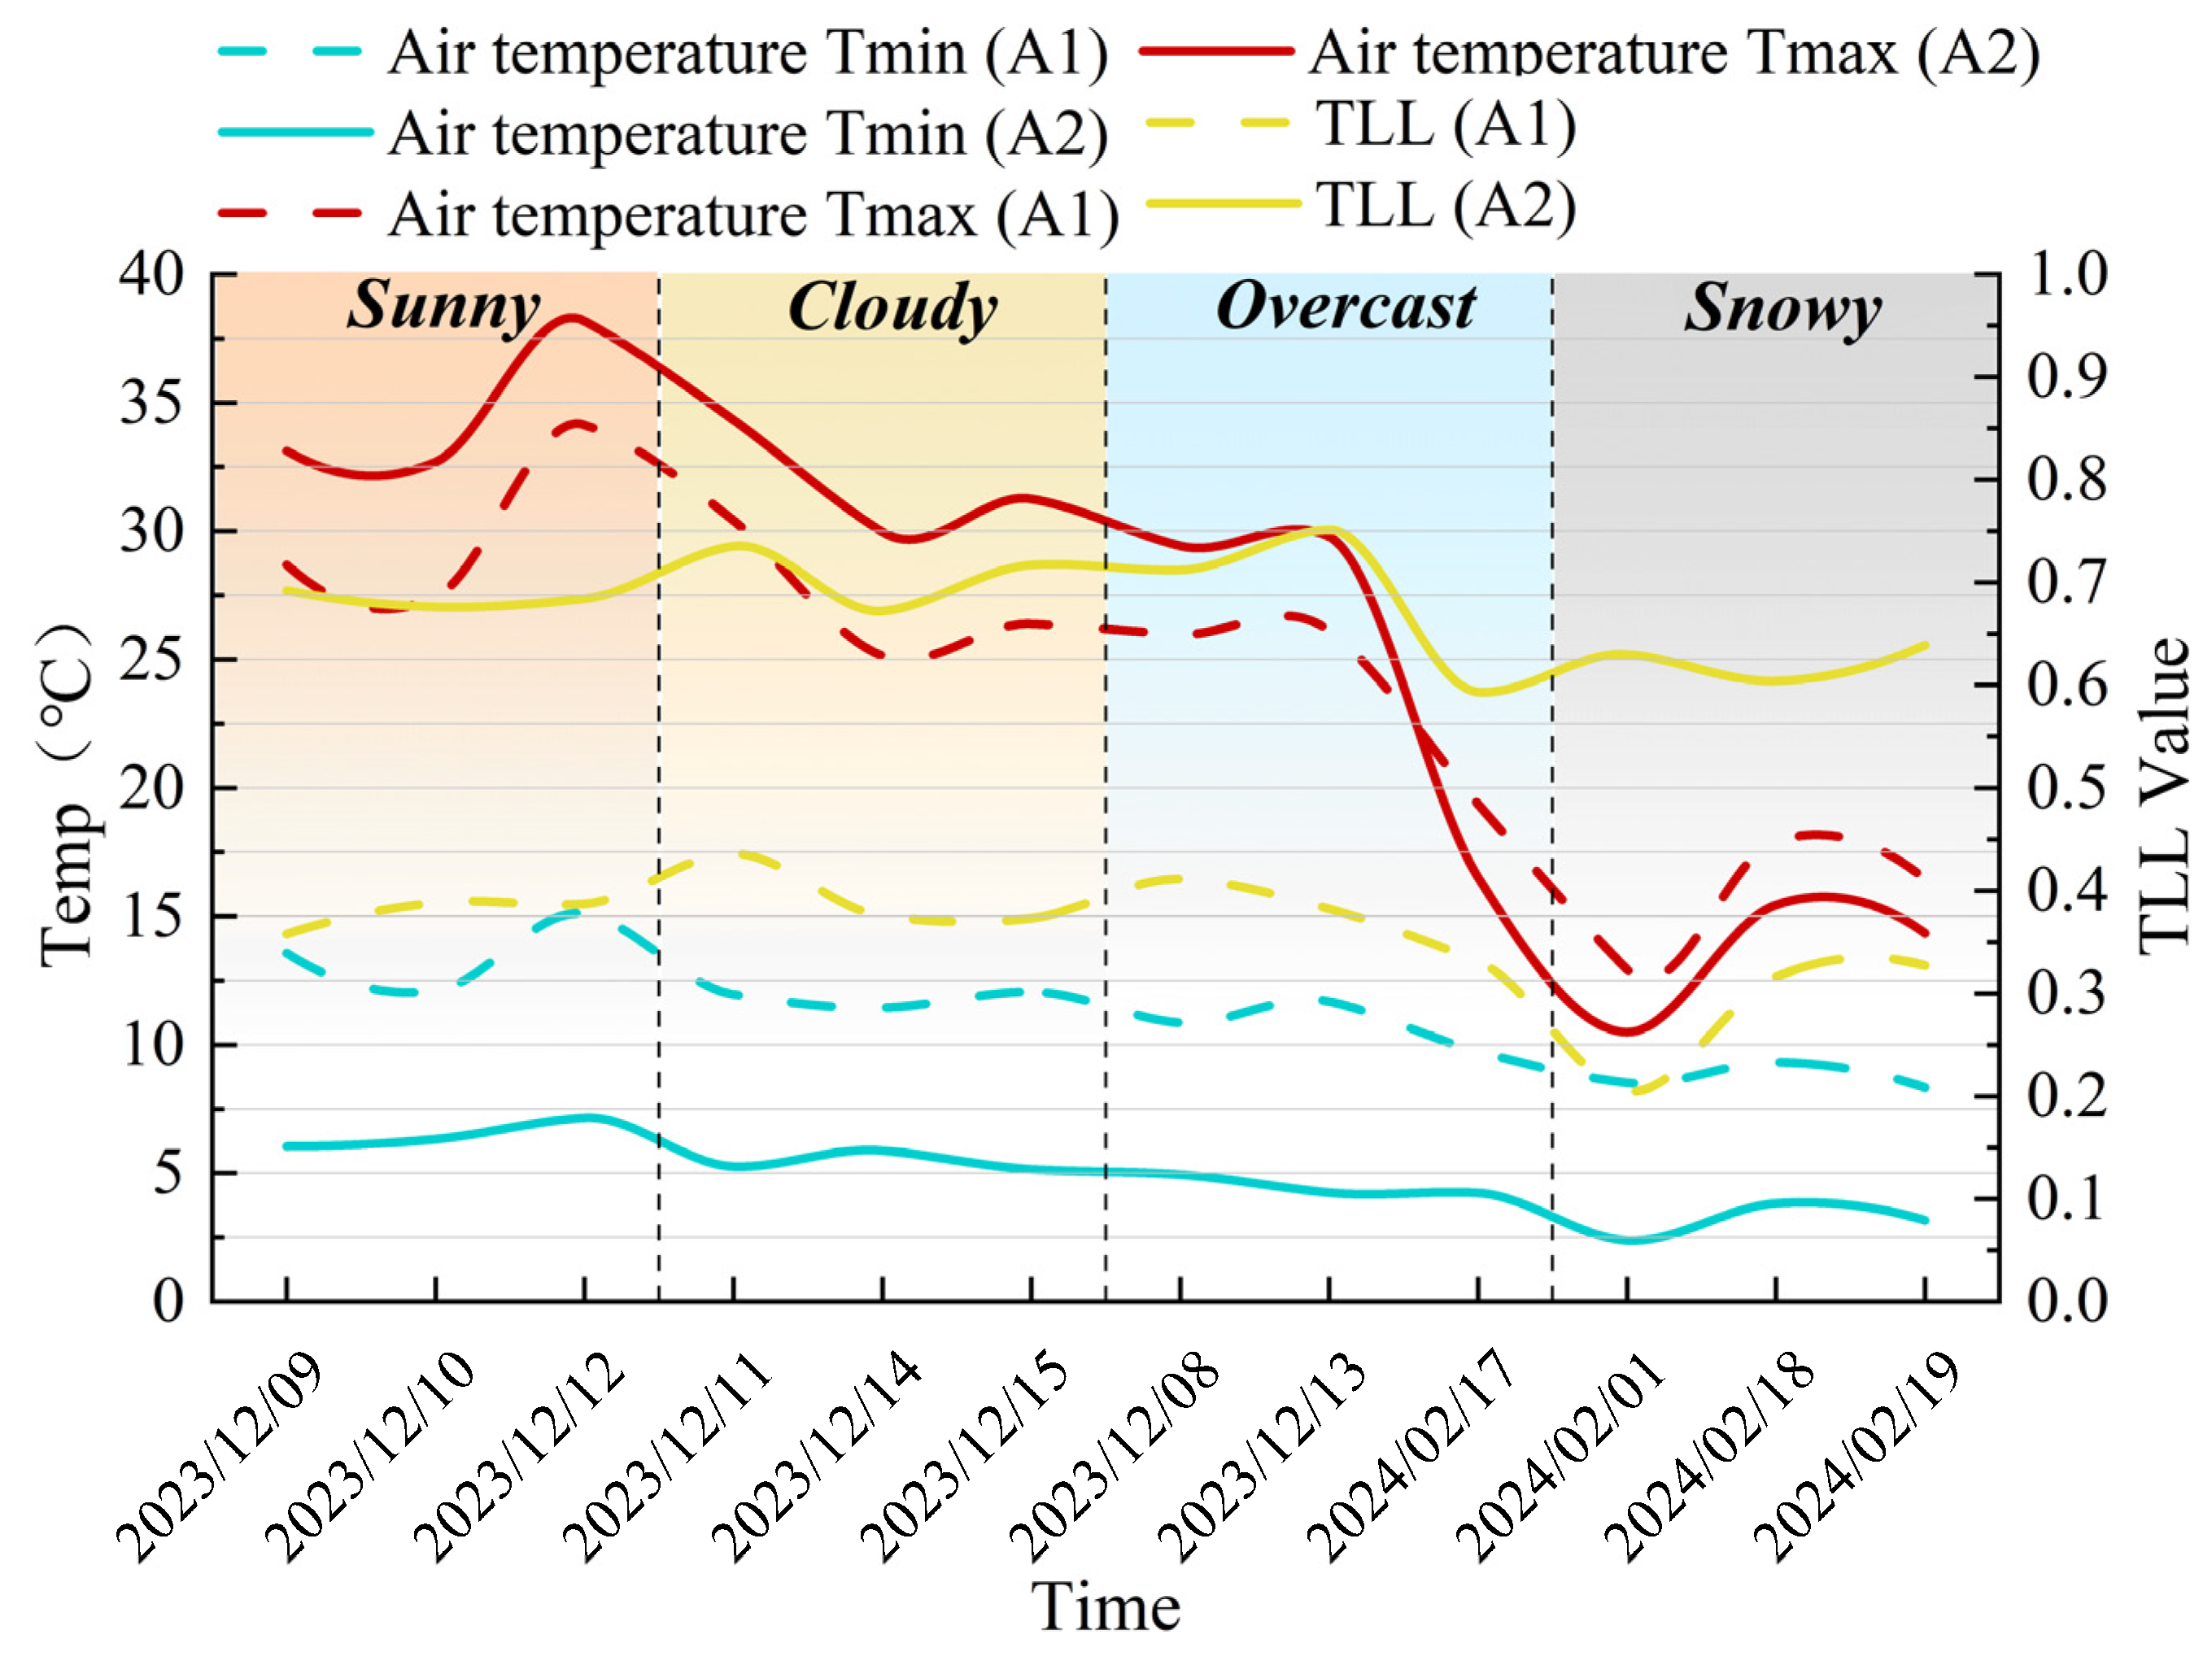
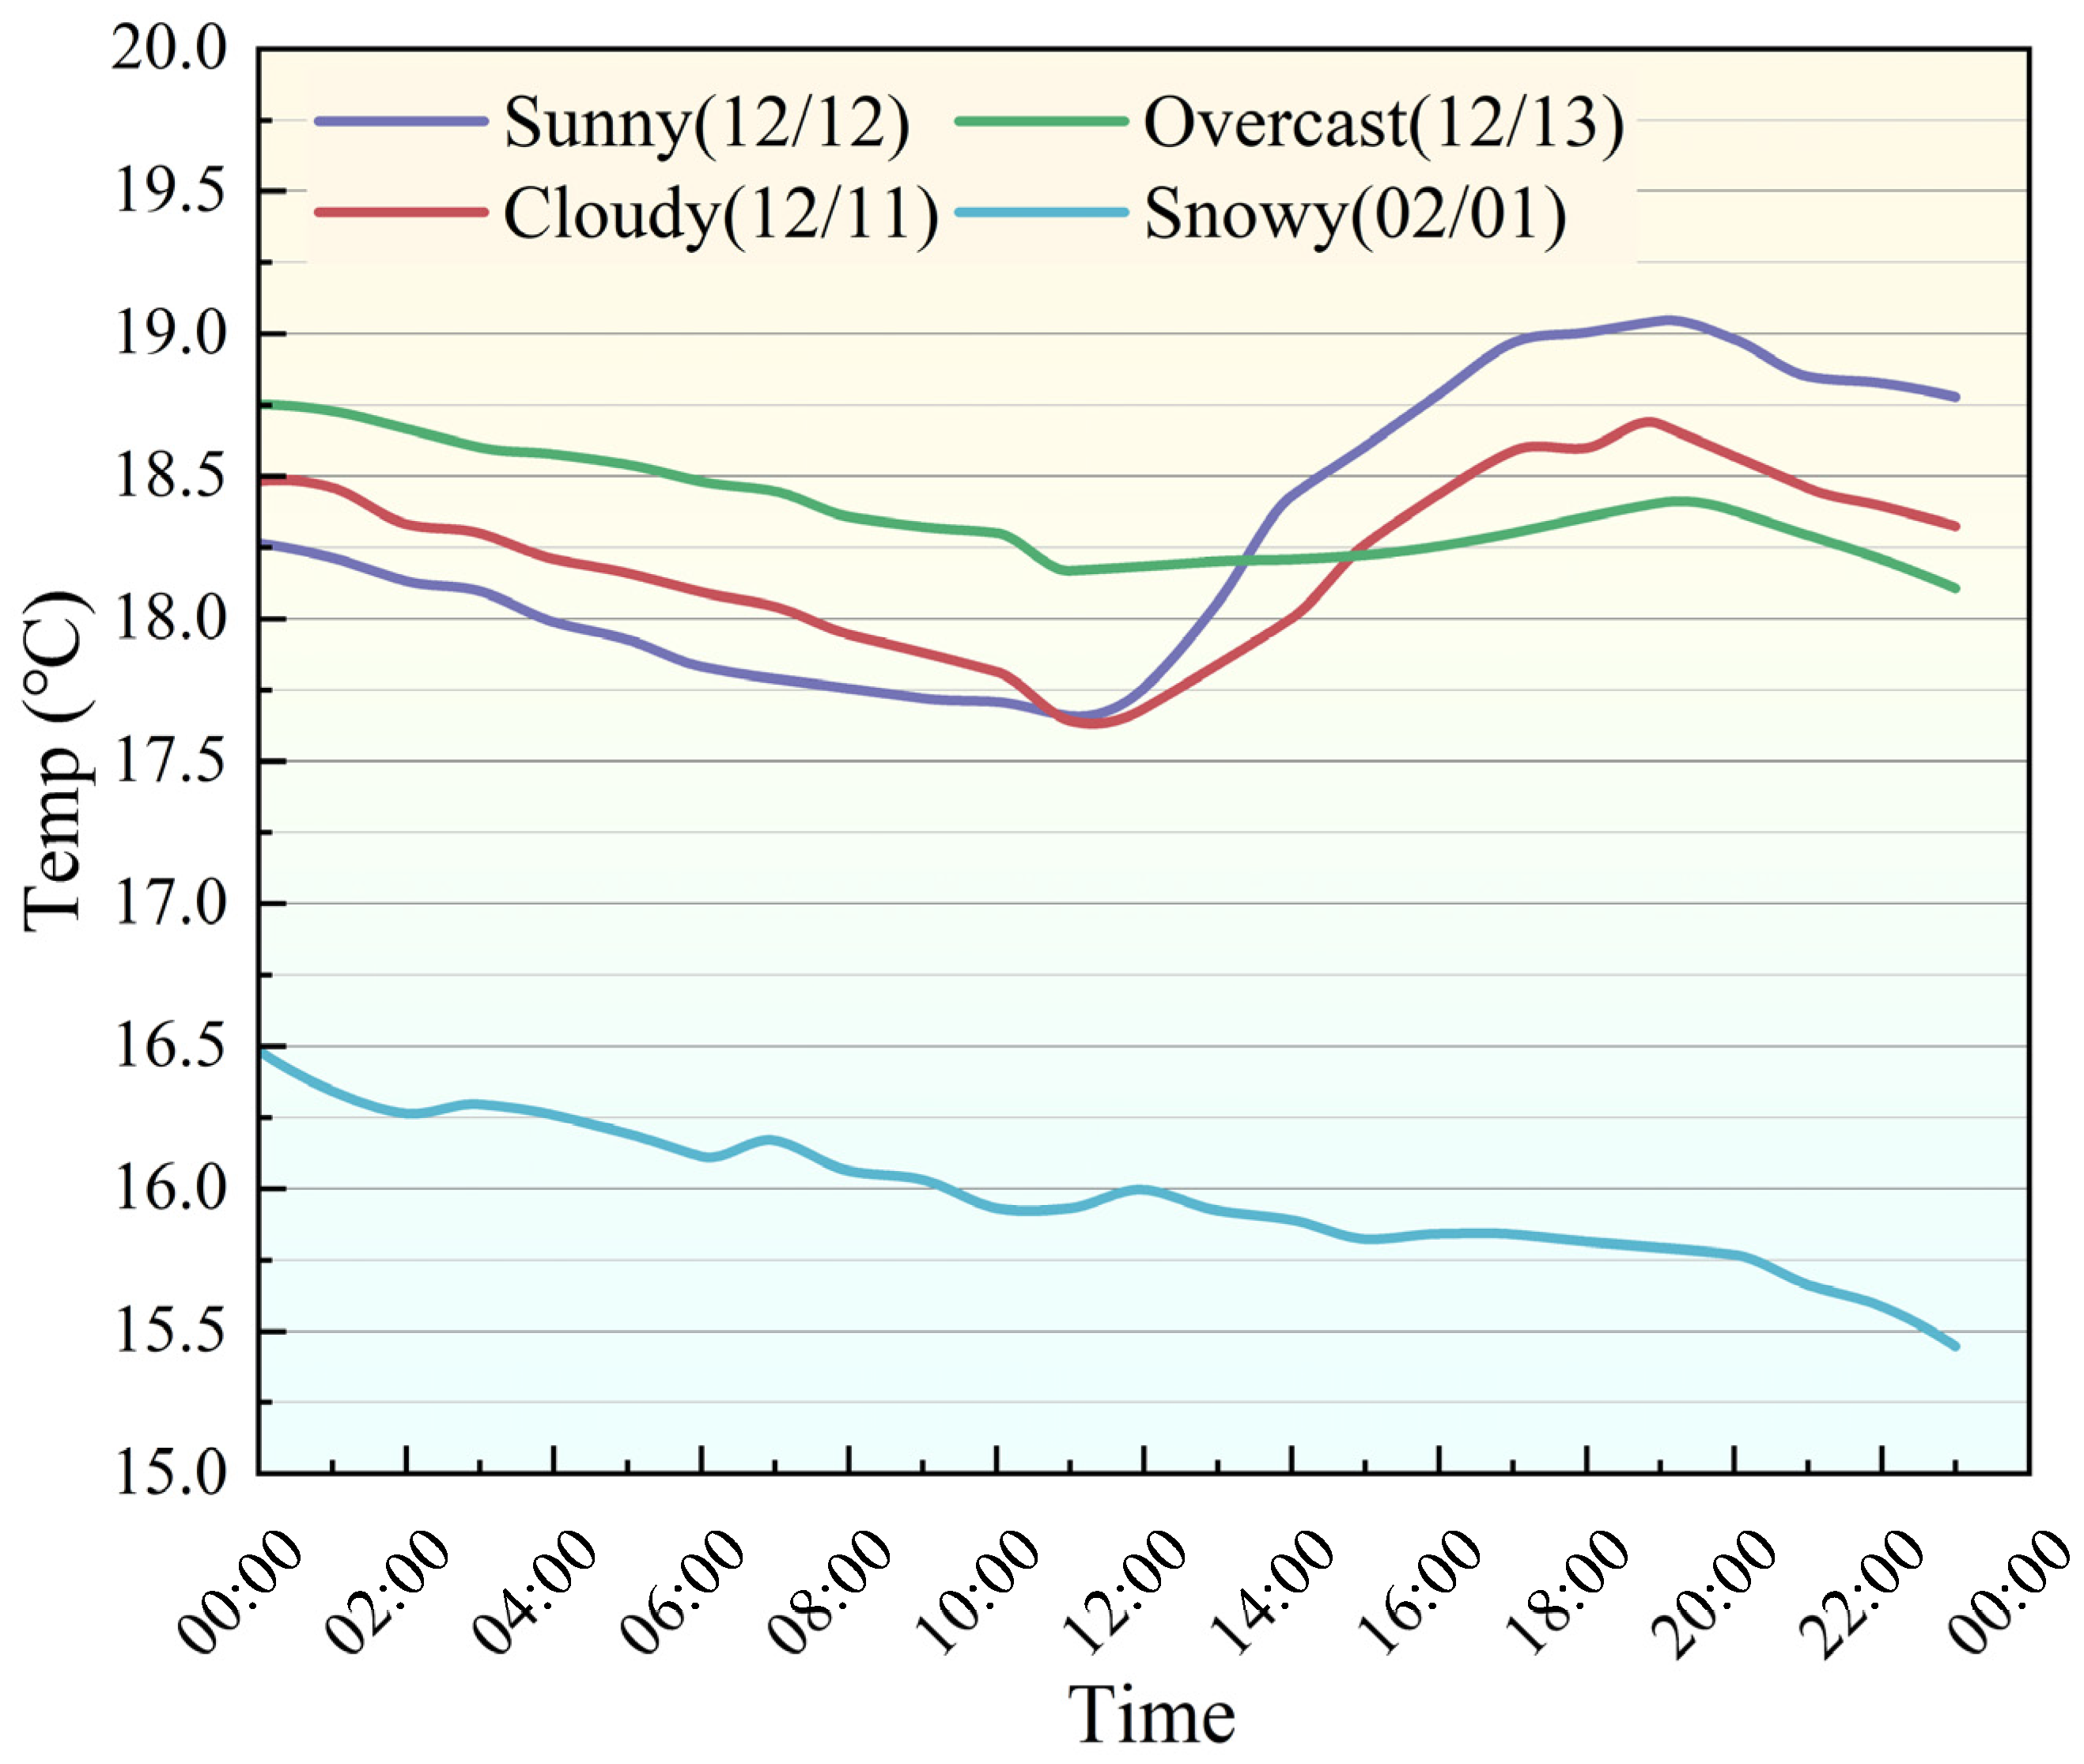
3.2.2. Analysis of Greenhouse Temperature Fluctuation

To better assess the effect of the ASHP–UP system on the TLL value of the greenhouse, four weather conditions were analyzed: sunny days (December 9, December 10, and December 12), cloudy days (December 11, December 14, and December 15), overcast days (December 8, December 13, and February 17), and snowy days (February 1, February 18, and February 19). On typical sunny and cloudy days (December 8 and December 13), the daily maximum temperature of greenhouse A1 was 3.5 °C to 5.0 °C lower than that of greenhouse A2, while the daily minimum temperature was 6.8 °C to 8.0 °C higher. Consequently, the TLL value for A1 was 0.28 to 0.36 lower than that of A2. During typical cloudy days (February 17) and snowy days, the daily maximum temperature of greenhouse A1 was 2.09 °C to 2.86 °C higher than that of greenhouse A2, and the daily minimum temperature was 6.19 °C to 7.51 °C higher. Additionally, the TLL value for A1 decreased by 0.26 to 0.42 (Figure 9). During the 12-day testing period, when the indoor temperature exceeded 25.0 °C, the activation of the heat storage mode in greenhouse A1 resulted in a reduction in the indoor temperature, causing the maximum temperature in A1 to be lower than that in A2. Notably, during typical cloudy days (February 17) and snowy days, the indoor temperature did not exceed 25.0 °C. Consequently, the heat storage mode was not activated. During this period, the maximum temperature in greenhouse A1 was higher than that in A2. This could be due to the system’s accumulation of substantial heat in the soil during the preceding period, which allowed the indoor temperature of A1 to rise through soil heat release. Finally, the ASHP–UP system effectively mitigated indoor temperature fluctuations across different weather conditions.

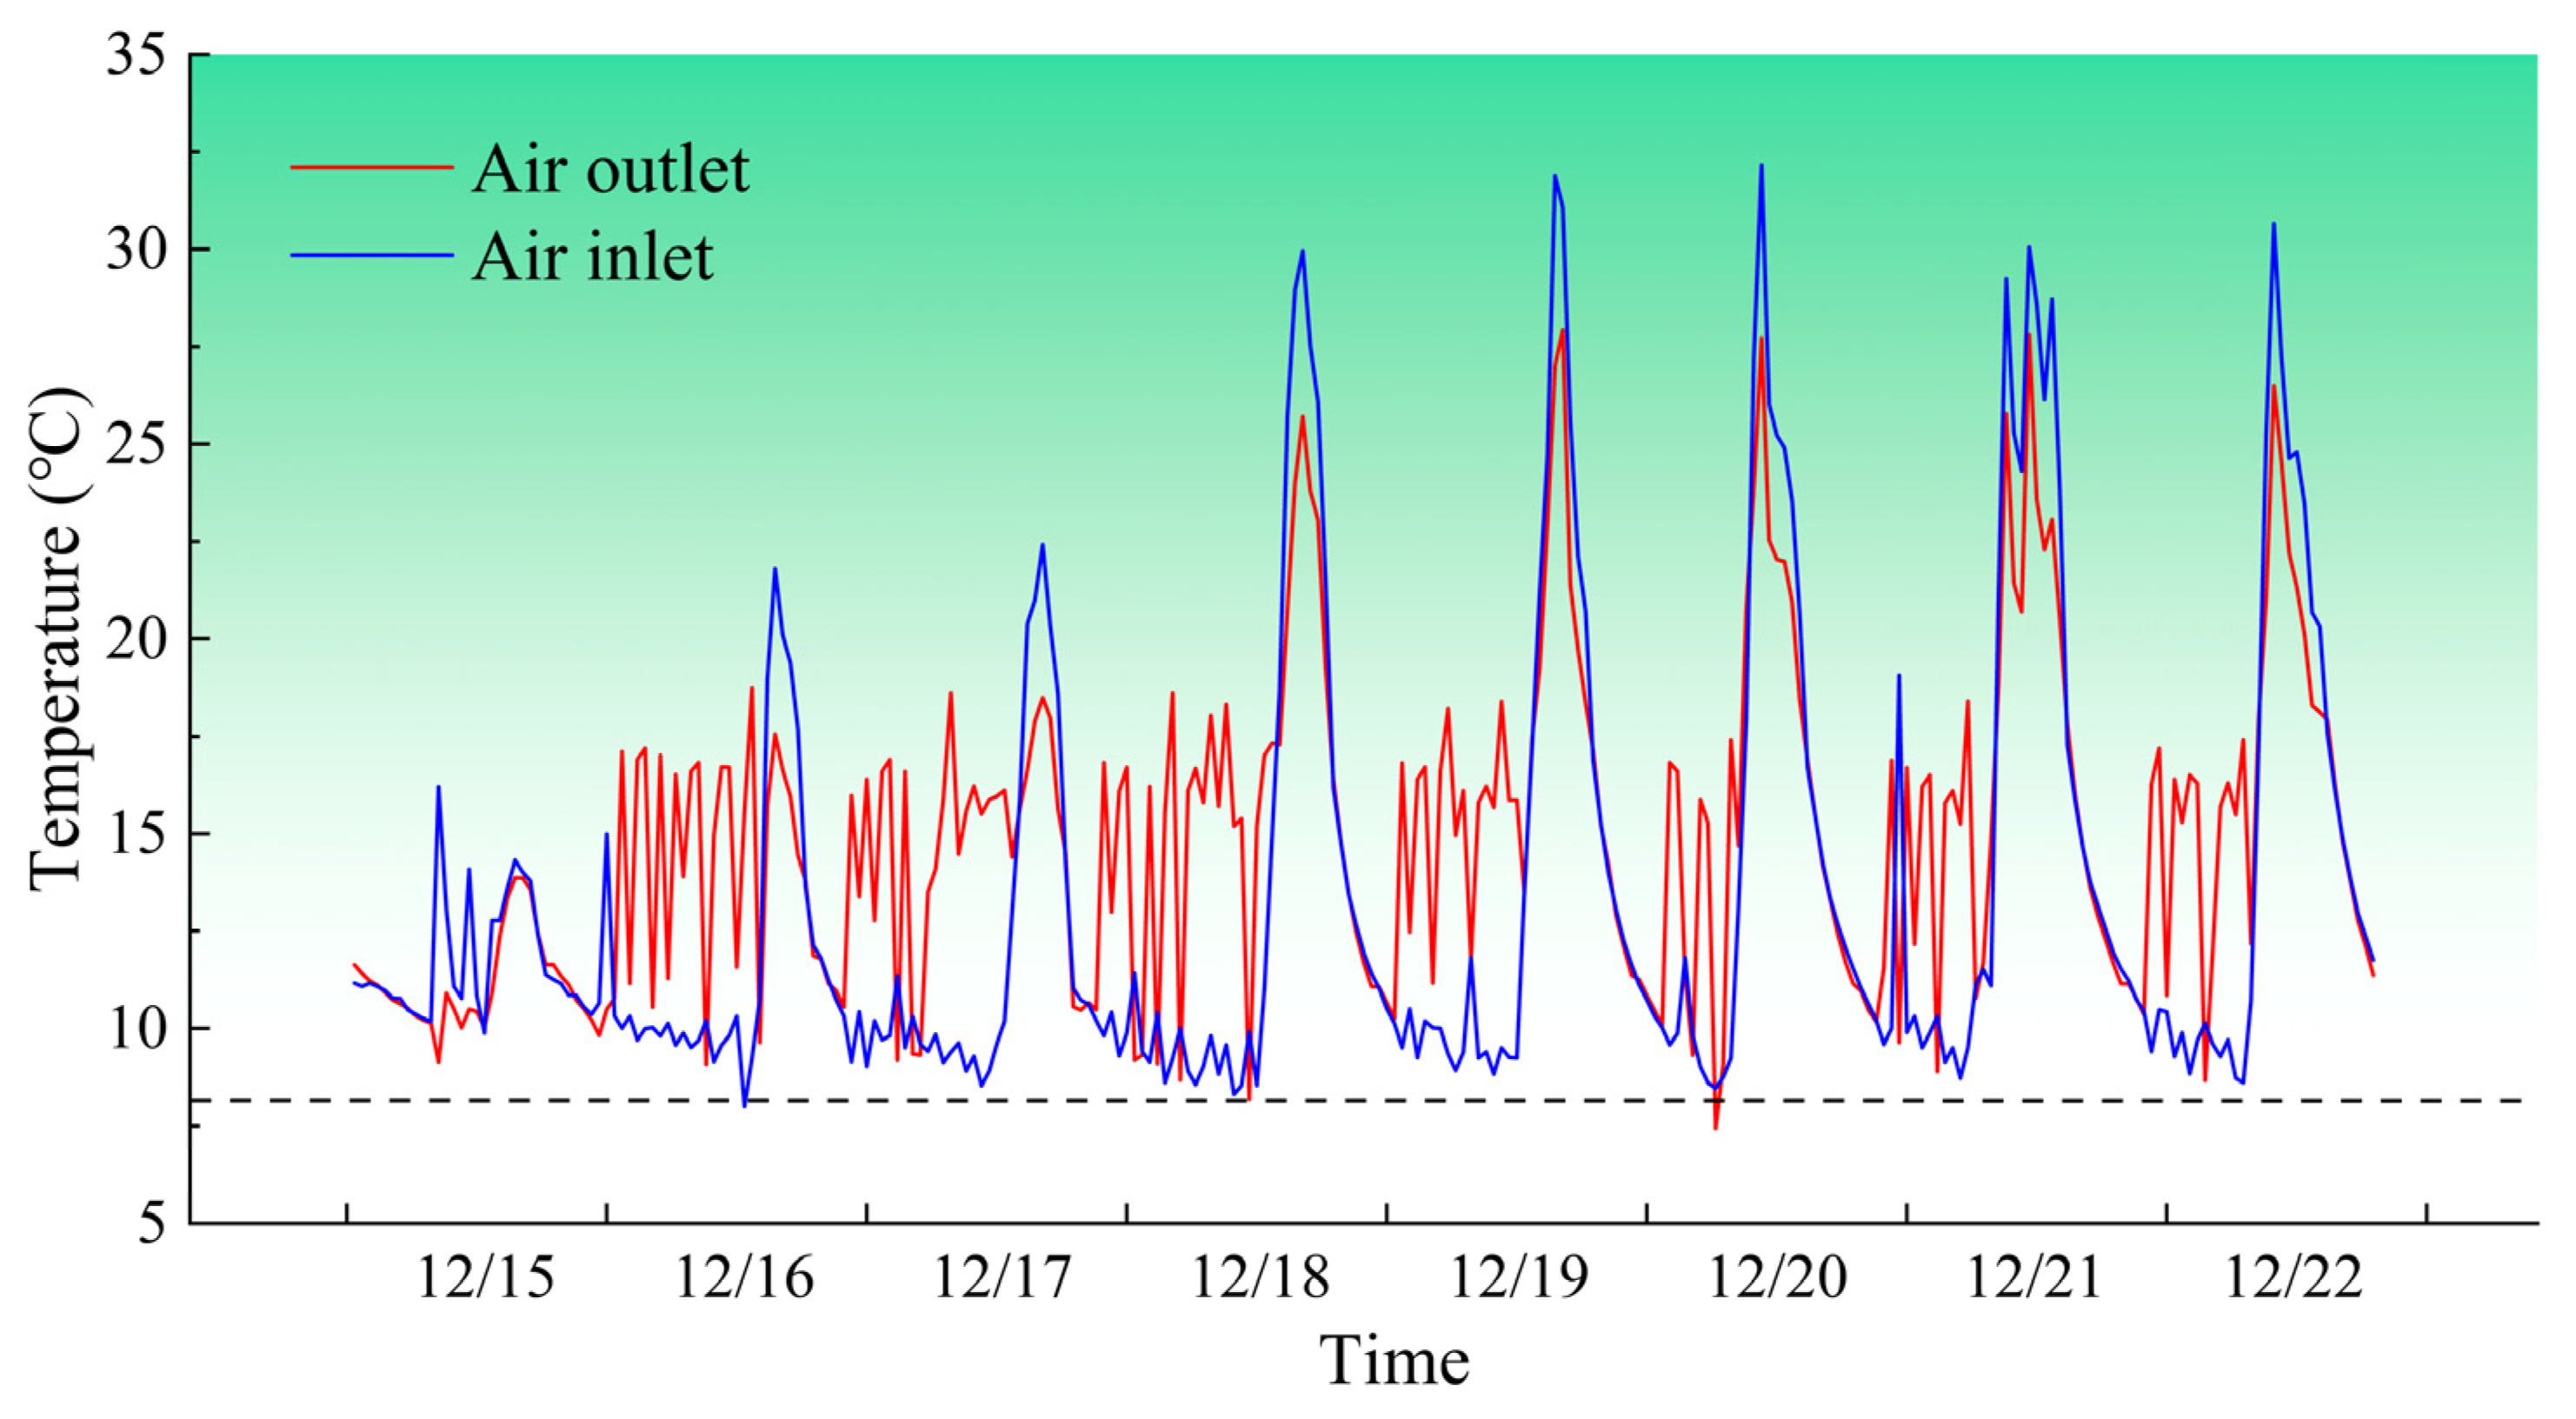
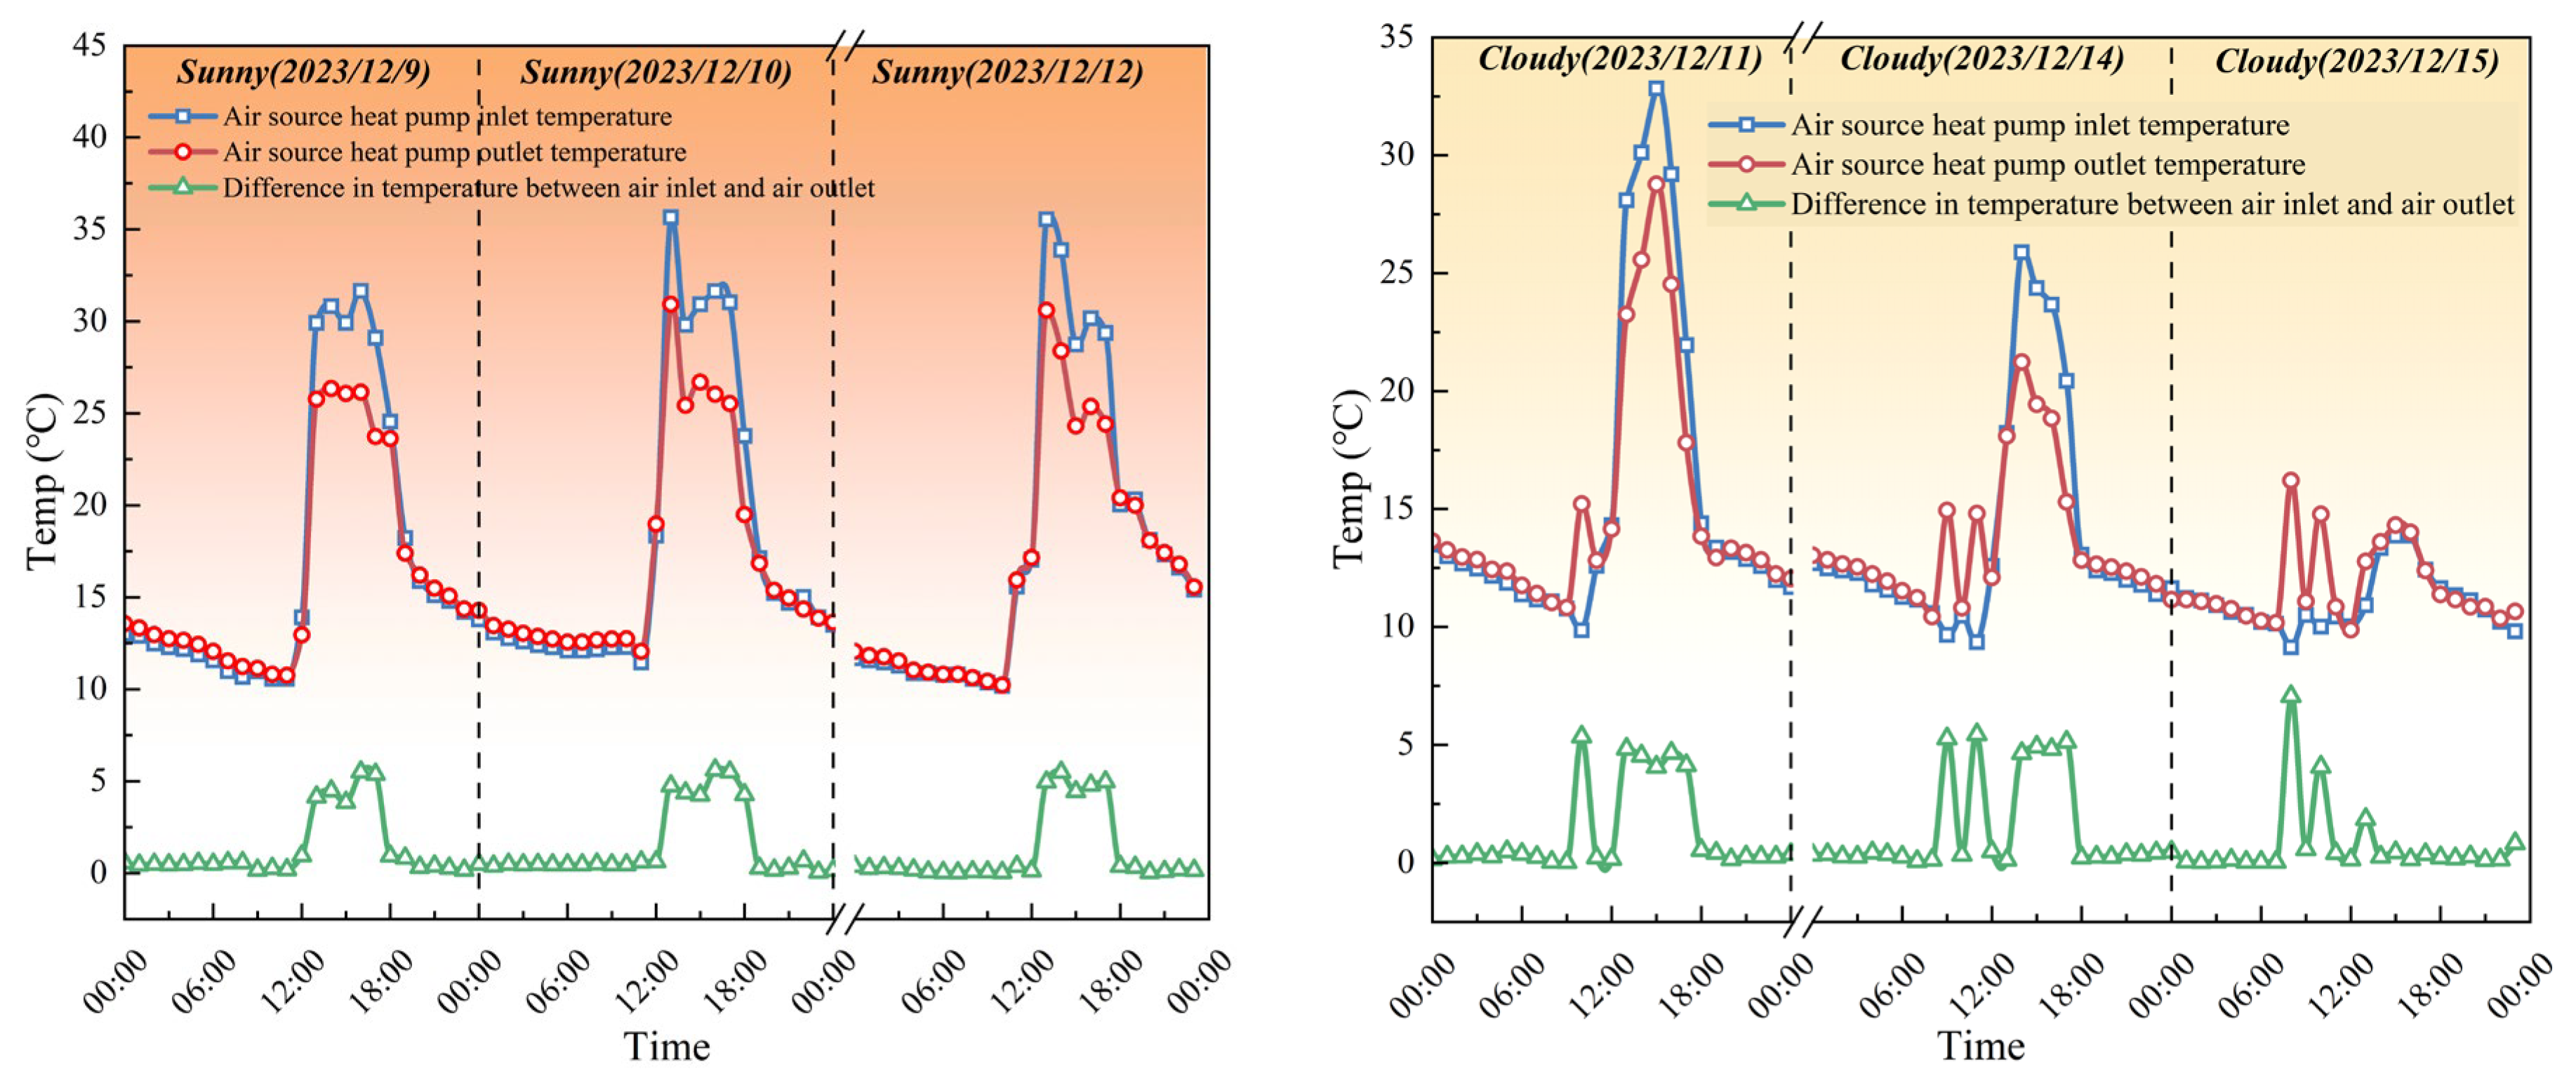
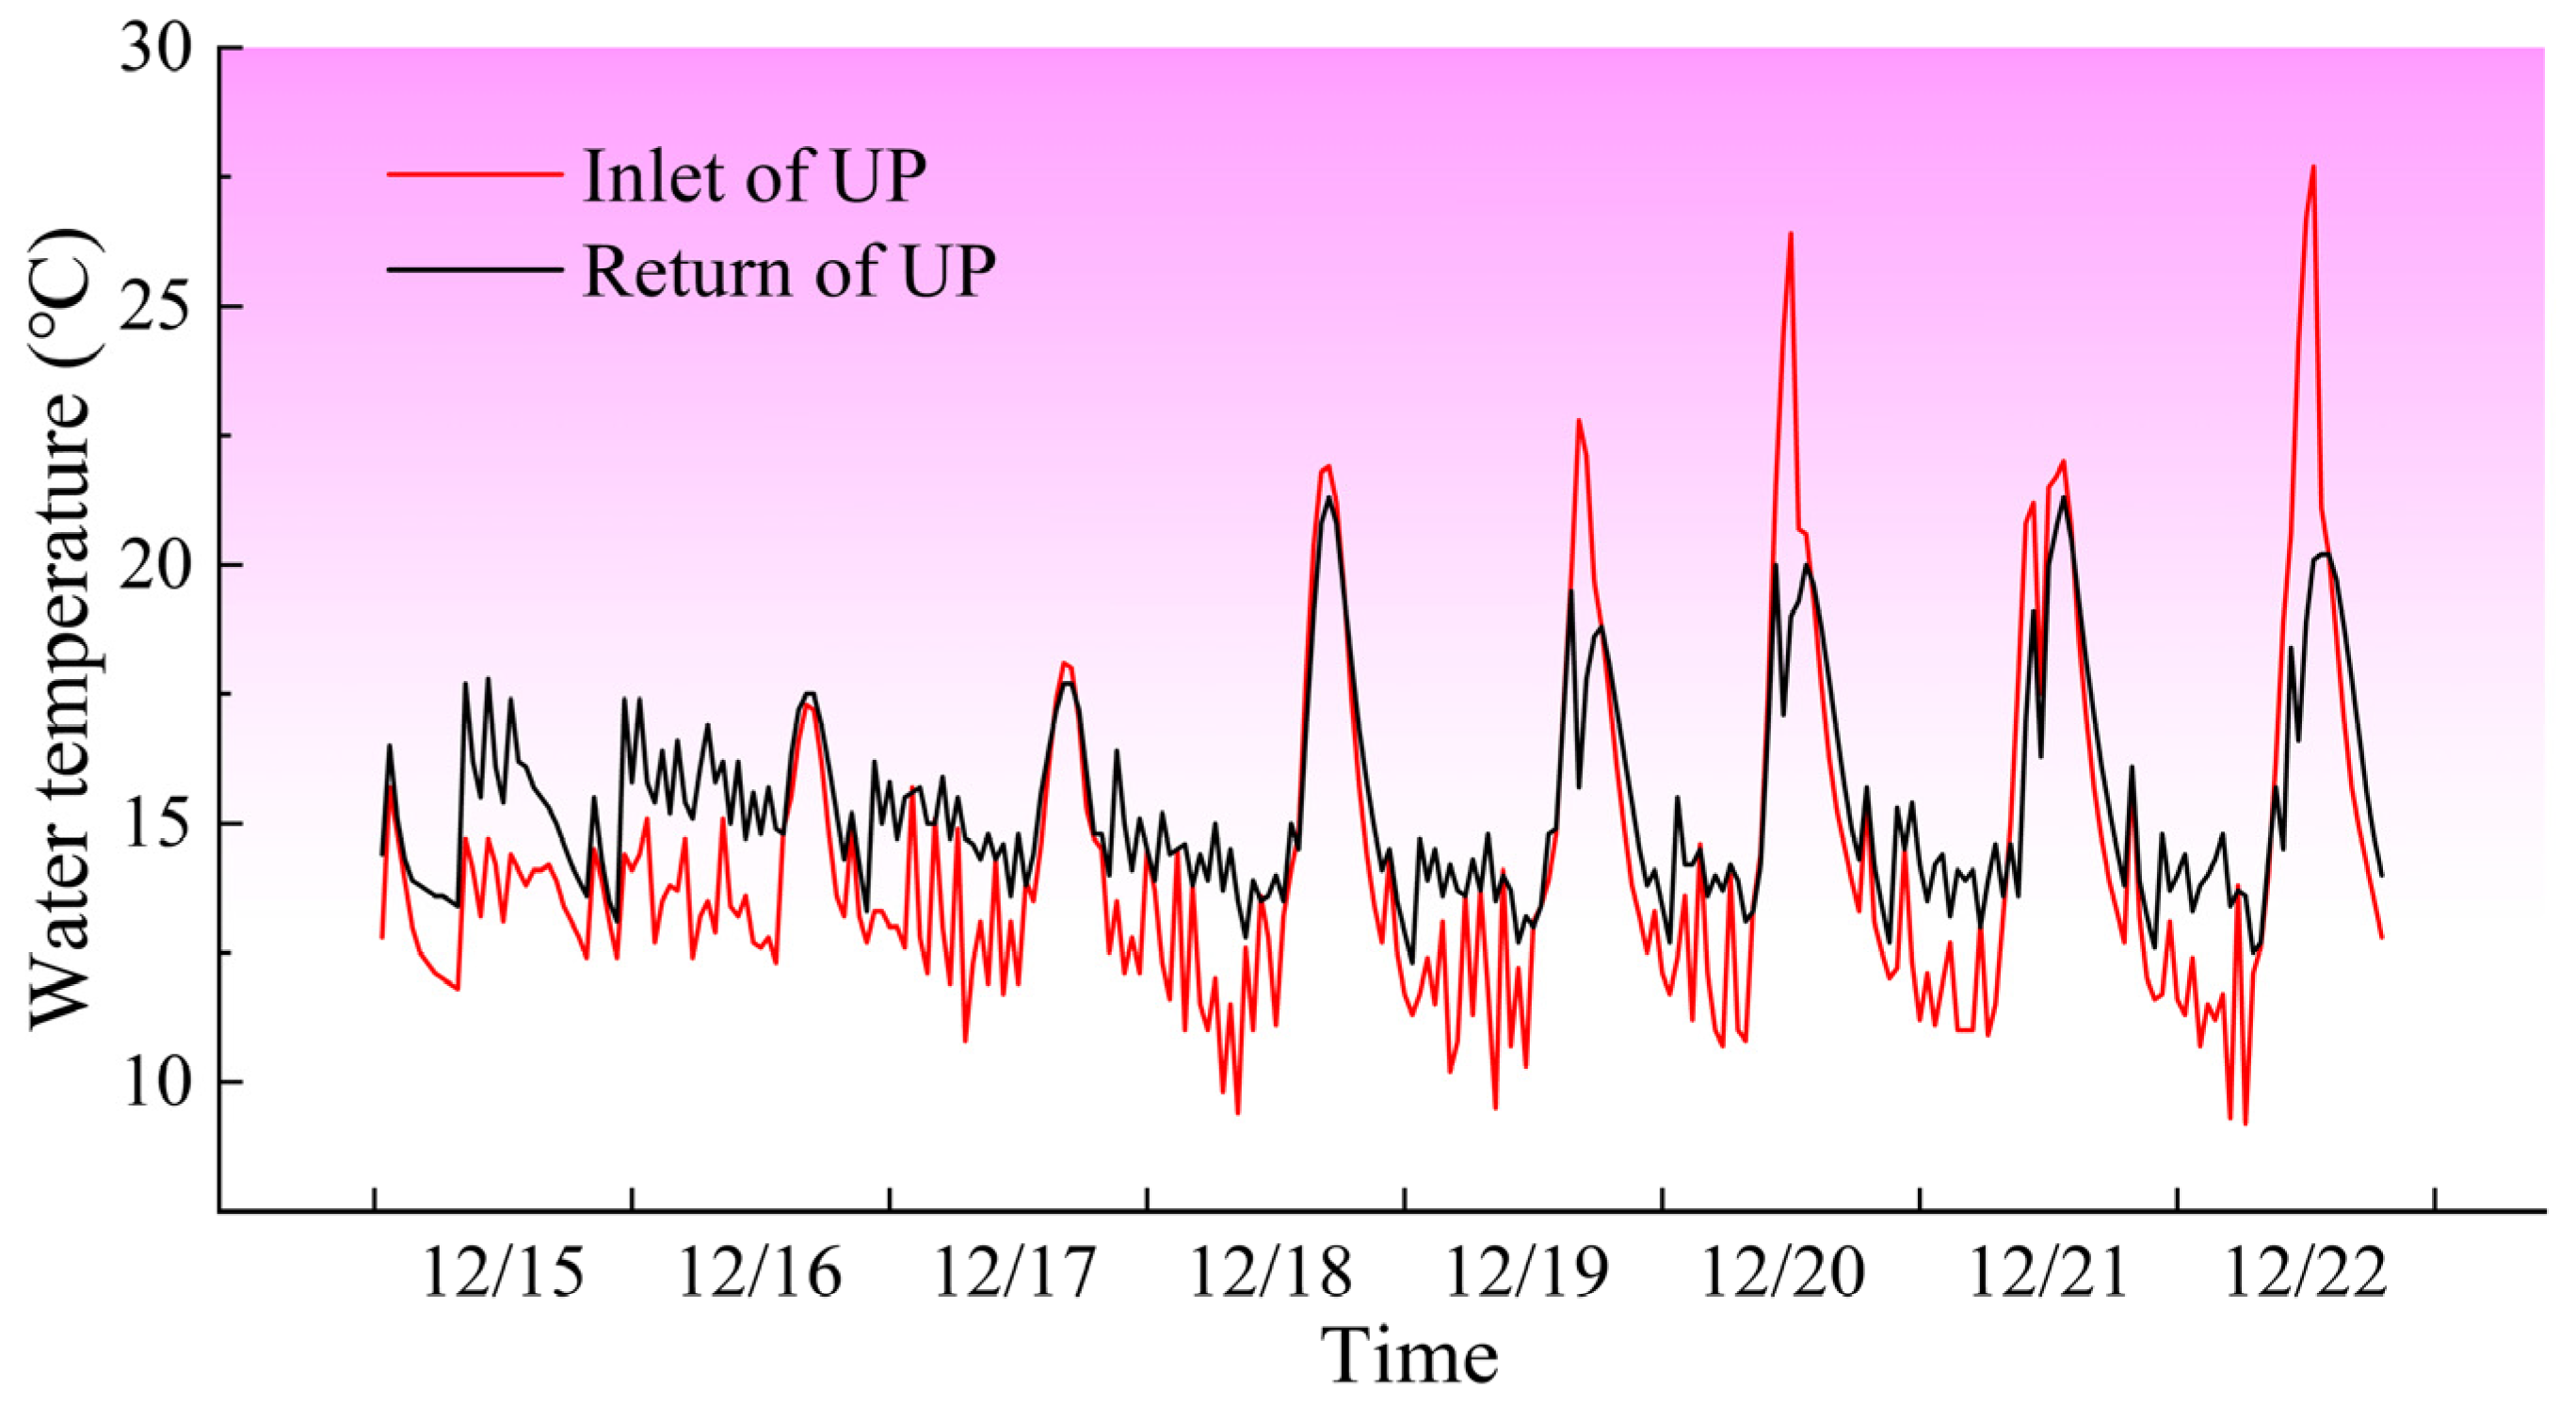
3.2.3. Temperature Analysis at the Heat Exchange Port of the System

Figure 10 illustrates the variations in air temperature at both the inlet and outlet of the air source heat pump unit over several consecutive days. During the night, the air temperature at the heat pump outlet remained stable at 17.1 °C, which is 8.3 °C higher than the minimum nighttime air temperature. Between 12:00 and 18:00 on sunny days, the air temperature at inlet was typically 4.86 °C higher than at the outlet. When the indoor temperature reached 25.0 °C, the system switched to heat storage mode, resulting in a significant temperature difference between the inlet and outlet. From 10:00 to 11:00 on cloudy days, the average temperature at the air inlet was approximately 5.43 °C lower than that at the air outlet. During this time, the indoor temperature was below 10.0 °C, prompting the system to activate the heat release mode, which led to the air inlet temperature being lower than the outlet temperature. On cloudy days, the system activated the heat release mode between 10:00 and 11:00, as well as between 23:00 and 24:00 on December 13. During this period, the average temperature at the air inlet was 5.46 °C lower than that at the outlet. The system activated the heat storage mode from 15:00 to 18:00, with the average air inlet temperature being 4.86 °C higher than that at the outlet. On cloudy and snowy days, the temperature variation in the air inlet and outlet followed a wavy pattern. The system activated heat release mode when the indoor temperature fell below 10.0 °C and deactivated it once the indoor temperature reached 12.0 °C. In total, the heat release mode operates for 7.0 to 8.0 h, during which the average air inlet temperature is 5.44 °C lower than that at the outlet (as shown in Figure 11).
Figure 12 provides a further analysis of the thermal performance of the buried water pipe, illustrating the variation in the total inlet and outlet water temperatures. The inlet and return water temperatures in the main pipeline exhibited considerable variation at night, with a maximum temperature difference of up to 5.2 °C. This observation indicated that the water within the buried pipe engaged in substantial heat exchange with the surrounding soil during circulation, effectively absorbing heat from the soil near the pipe wall. This heat was then transported through the pipeline to the heat pump unit, and then into the air for convective heat transfer. During the day, the system operated to collect surplus heat from the air, warming the soil and facilitating heat storage. By analyzing the water temperature changes from the afternoons of the three days (from the 20th to the 22nd), it was clear that the heat pump unit utilized the surplus air heat to raise the water temperature in the pipe, reaching values between 22 and 27.5 °C. This resulted in a temperature difference of up to 8.5 °C between the inlet and return pipes, further demonstrating the feasibility of using heat pump units to transfer heat to soil storage.

3.2.4. Ground Temperature Change

In this study, the analysis of indoor ground temperature changes was conducted in parallel with temperature variations. From 00:00 to 11:00 on typical sunny, cloudy, and overcast days, the indoor ground temperature exhibited a gradual decline. By 11:00, the minimum ground temperatures recorded were 17.63 °C, 17.73 °C, and 18.03 °C, respectively. By 19:00, the ground temperatures reached 18.97 °C, 18.77 °C, and 18.22 °C, respectively. During the daytime heat storage phase, the ground temperatures increased by 1.34 °C, 1.04 °C, and 0.19 °C, respectively (Figure 13). On typical snowy days, the ground temperature exhibited a gradual decline throughout the whole day, reaching a minimum of 15.45 °C by 23:00, with a decrease of 0.14 °C occurring between 11:00 and 19:00. Between 10:00 and 11:00 on cloudy days, the system activated the exothermic mode when the indoor temperature falls below 10.0 °C, causing the rate of ground temperature decline to accelerate. However, during sunny weather, the temperature remained above 10.0 °C, preventing the system from activating the exothermic mode. Consequently, the rate of ground temperature decrease remained relatively unchanged. Moreover, the changes in ground temperature varied significantly under different weather conditions. Between 11:00 and 17:00 on typical sunny, cloudy, and overcast days, the ground temperature increased gradually. The temperature rise was most pronounced on sunny days, followed by cloudy days, with the smallest increase observed on overcast days. The variation in ground temperature was positively correlated with solar radiation and duration of illumination. During sunny days, the higher intensity of solar radiation and longer duration of sunlight led to the most significant increase in ground temperature. In contrast, on snowy days, the lack of solar radiation and lower temperatures led the system to operate solely in exothermic mode throughout the day, resulting in a continuous decline in ground temperature.

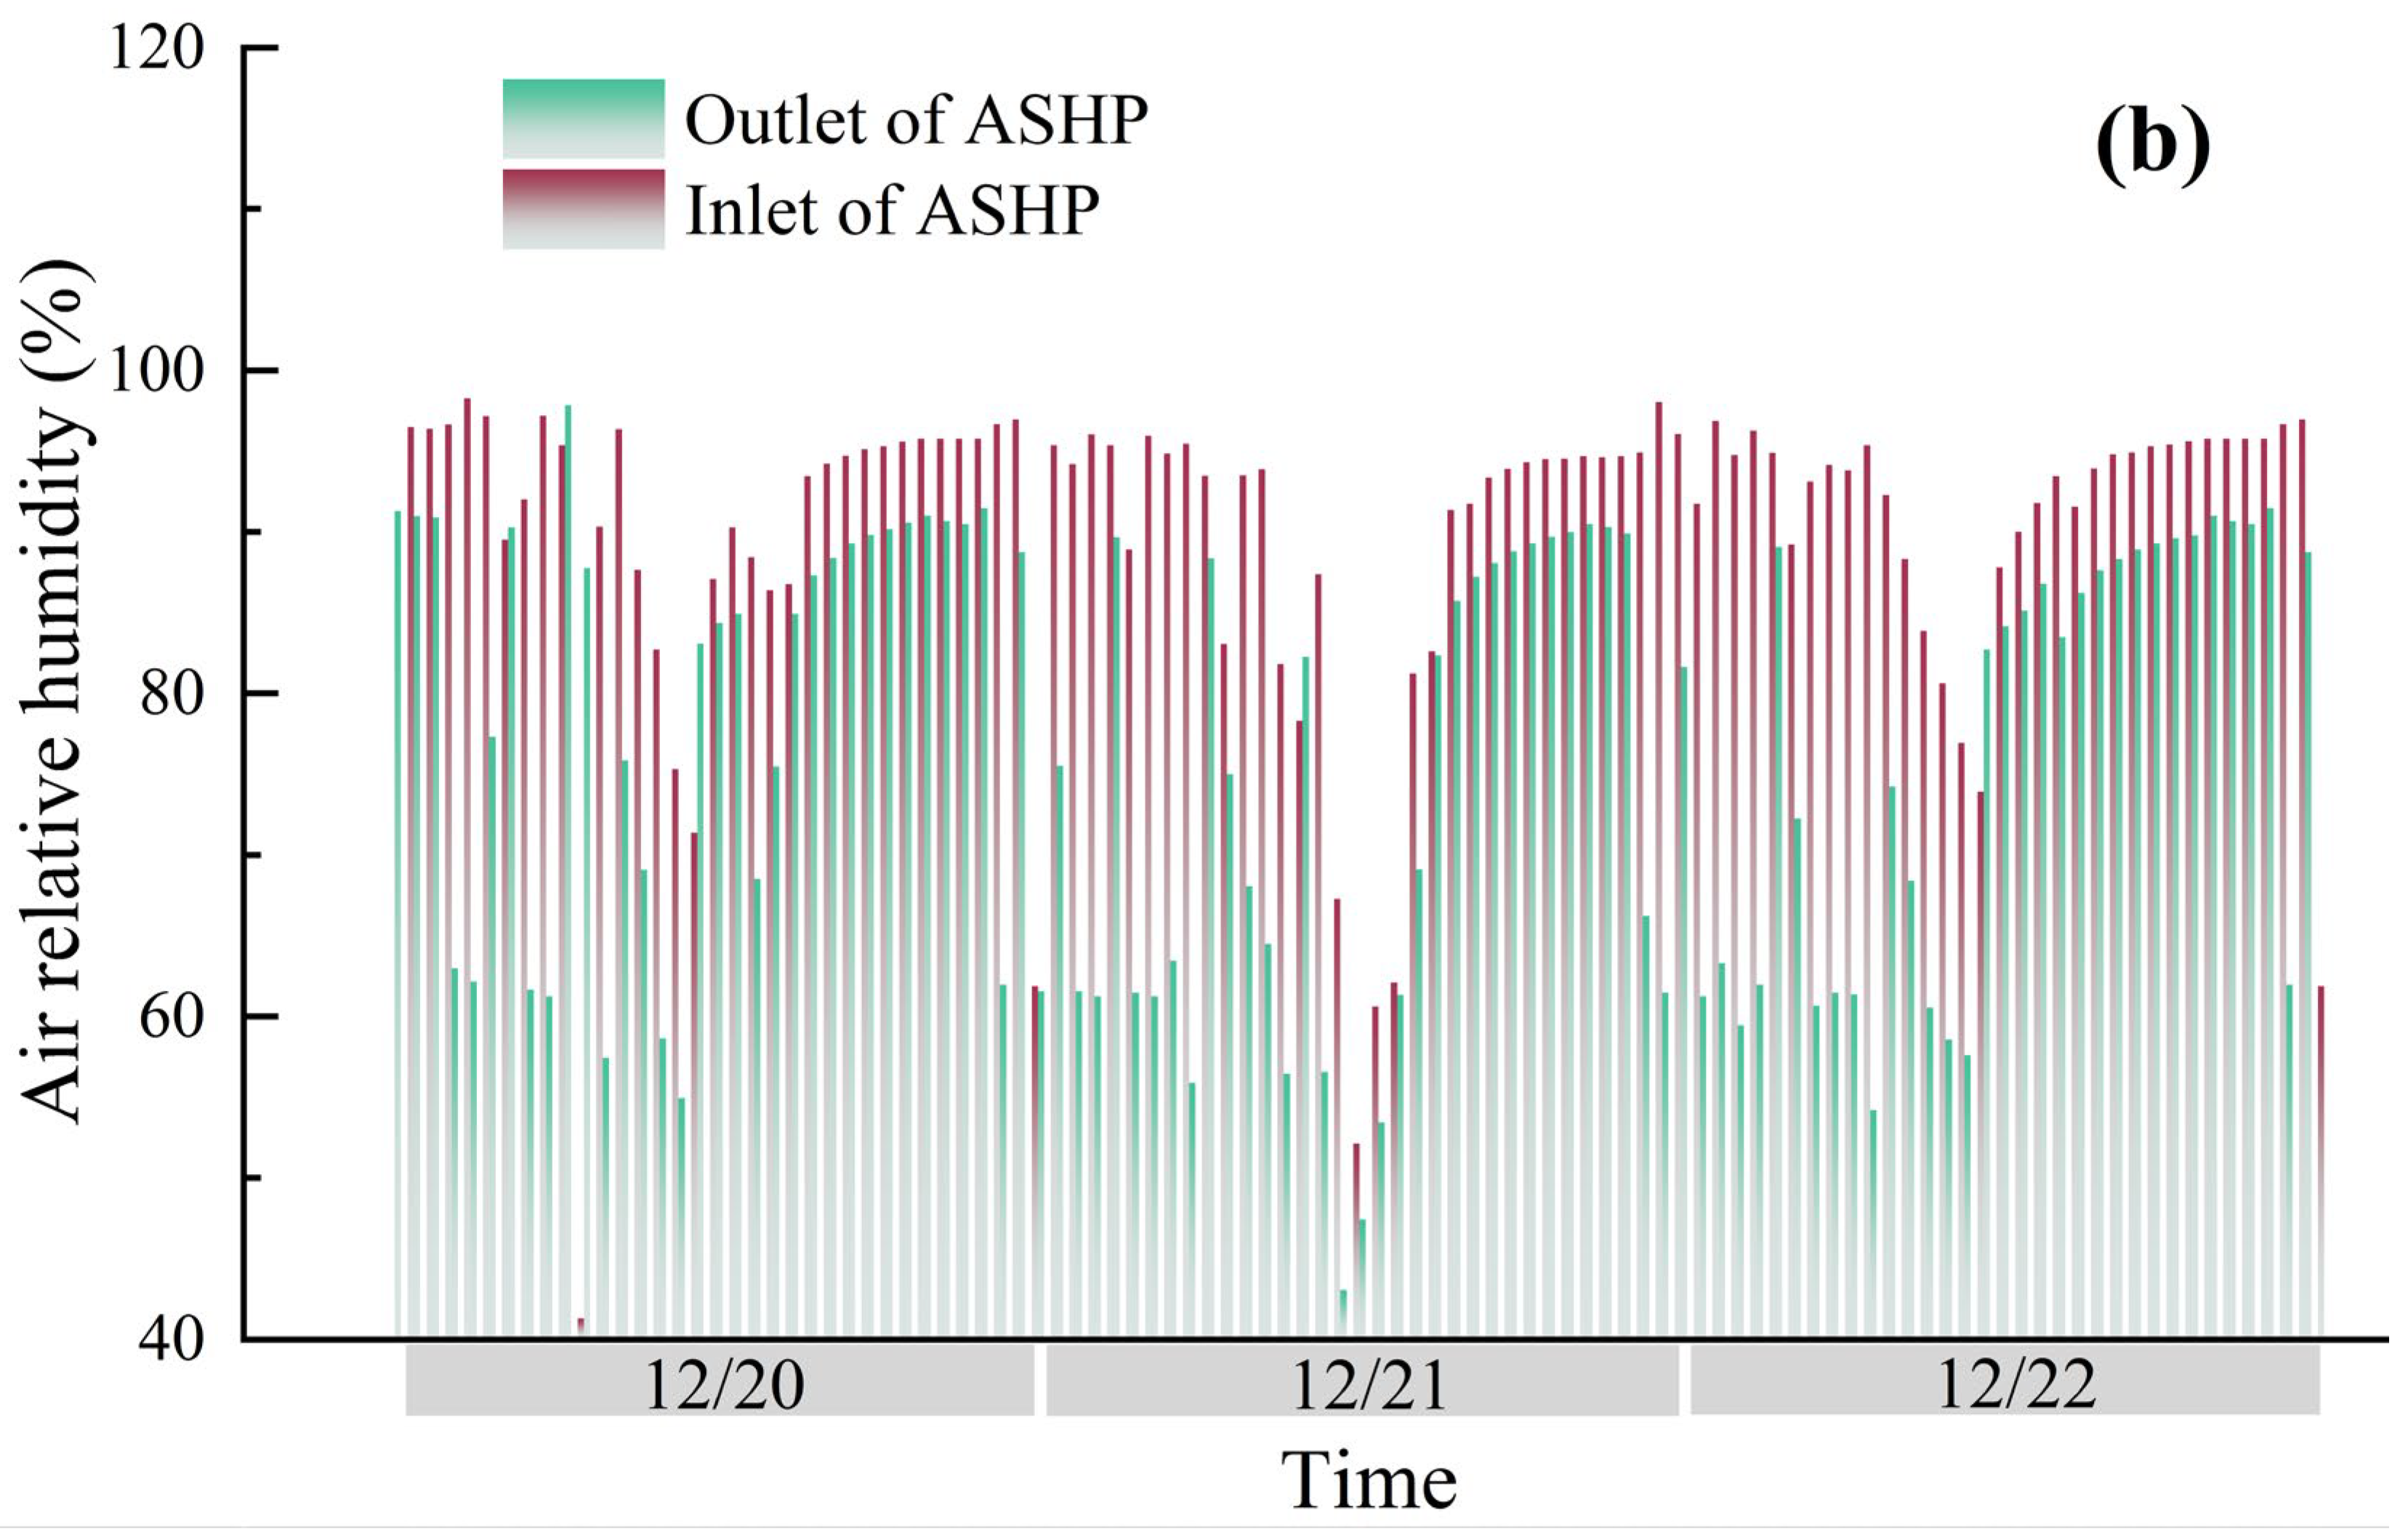
3.2.5. Air Humidity Analysis

Figure 14a illustrates the humidity levels within the greenhouse. Average humidity measurements were taken in various sections of the greenhouse, with each section positioned at varying distances from the exhaust port of the heat pump fan. The results indicated that humidity levels in the experimental greenhouse were significantly elevated during the nighttime. Without the ASHP–UP heating system, the indoor air relative humidity reached nearly 99.9%. The central region of the greenhouse, situated along the east–west axis and in proximity to the exhaust port of the heat pump fan, experienced minimal fluctuations in relative humidity during the night, with an average value of 93.7%. As the distance from the heat pump fan increased, the intermittent operation of the ASHP–UP heating system caused more pronounced fluctuations in air relative humidity. This was due to the diffusion and flow attenuation of dry air from the emissions of the air source heat pump into the greenhouse. This effect was particularly noticeable along the eastern and western edges of the greenhouse, where the relative humidity of indoor air could decrease by as much as 8.7%. Figure 14b provides a detailed analysis of air humidity levels at the inlet and outlet of the ASHP. When the heat pump unit was inactive, the humidity differential caused by the height variation between the inlet and outlet ranged from 8% to 10%. During the nighttime operation of the ASHP, the air humidity at the inlet exceeded 95%. After undergoing the heat exchange process of ASHP, the relative humidity of the air discharged from the outlet was maintained at approximately 60%. This demonstrated that the ASHP holds a highly effective dehumidification capability. Furthermore, the ASHP–UP system could significantly affect the temporal dehumidification of indoor air.

3.3. Energy Saving Analysis of ASHP–UP System

3.3.1. System Heat Absorbed and Released Capacity

To elucidate the thermal performance of the ASHP-UP system in the context of nighttime heating, Figure 15 presents the analysis of the heat transfer processes involving both the air source heat pump and the underground piping system. Figure 15a compares the average temperatures at the inlet and outlet of the ASHP, as well as the underground pipe. It also calculates the average daily heat absorption and heat release rates of the entire system using the heat balance calculation formula. The inlet and return water temperatures of the buried water pipe remained stable at 14 °C and 11 °C, respectively, over the course of several days. The observed temperature difference of approximately 3 °C further supports the viability of using underground soil as a low-grade heat source in the ASHP–UP system. The air temperatures at the inlet and outlet of the ASHP remained consistently stable at 9 °C and 16 °C, respectively. This temperature increase of approximately 7 °C ensured a favorable thermal environment inside the greenhouse. The calculated results indicated that the heat absorption and release rates of the ASHP–UP system fluctuated between 14 and 16 KJ s−1 and 36.5 and 37.5 KJ s−1, respectively. This suggested that the heating system in the greenhouse relied not only on heat absorption from the soil but also on the electric compensation heating provided by the air source heat pump. Figure 15b compares the total heat absorbed by the system, the electric compensation heating, and the total heat released during nighttime. Overall, the electric compensation heating contributed approximately 56% to 61% of the total heat released by the system into the greenhouse air. In comparison to traditional heating methods that solely utilize heat stored in the soil, the ASHP–UP system exhibited significantly higher thermal efficiency. This further highlights the outstanding heating performance of the ASHP–UP system.

3.3.2. System COP Analysis

The Coefficient of Performance (COP) serves as a key metric for evaluating the performance of the ASHP–UP system. This system includes both the heat storage COP and the heat release COP, which can be calculated from Equations (9) and (10). The COP value depends on the energy consumption of the air source heat pump (ASHP) unit and the circulating water pump, as well as the system’s heat storage and release capabilities. To achieve a more precise assessment of the COP under varying weather conditions (refer to Table 3), test data were selected from three days representing different weather scenarios. The heat storage COP of the system varied between 4.2 and 4.4, while the heat release COP fluctuated between 4.7 and 5.0. Notably, on the cloudy day of December 8, the system operated solely in heat storage mode, due to the substantial heat accumulation in the greenhouse from the sunny weather during the previous week. Consequently, there was no need to activate the heat release mode to elevate the temperature. On December 13, the system operated in both the heat storage and heat release modes during the cloudy day. Once the indoor temperature fell below 10.0 °C, it was necessary to activate the heat release mode to increase the temperature. On the cloudy day of February 17, the system operated in heat release mode due to the rapid decline in indoor temperature, which was caused by low outdoor temperatures and the lack of solar radiation. Additionally, since the air inlet of the system in this study was positioned 0.5 m above ground level, the COP value was not optimal. The optimal position for the air inlet should be between 1.0 m and 2.0 m above the ground, aligned with the north wall. This adjustment would enhance the system’s ability to absorb heat from the indoor air and improve its COP.

3.4. Analysis of Energy Saving Rate and Environmental Protection

Accurate estimating of energy consumption is crucial for enhancing the energy efficiency and conservation of the system [40]. During the testing phase of the ASHP–UP system in the Gobi region during winter, the system operated for a cumulative duration of 630 h, with a total power consumption of 1.77 × 10⁴ MJ. The total heat output of the ASHP–UP system was recorded at 8.07 × 10⁴ MJ, which was sufficient to meet the heating requirements of the assembled solar greenhouse throughout the winter. In this study, standard coal was utilized as a reference for the energy consumption of the ASHP–UP system, as well as for coal-fired, gas-fired, and electric heating systems. According to Formulas (11) through (14), it can be determined that the energy consumption of the system was reduced by 84.7%, 81.3%, and 79.1% when compared to coal-fired, gas-fired, and electric heating systems, respectively. According to previous studies, the combustion of 1 ton of standard coal generated approximately 2.45 tons of carbon dioxide emissions [53]. Therefore, the reduction in carbon dioxide emissions was calculated as 8.24 tons, 6.52 tons, and 5.67 tons, respectively, when compared to the other heating systems. These results highlighted the significant energy savings and environmental benefits of the ASHP–UP system, as summarized in Table 4.
To evaluate the environmental benefits of different heat storage systems, the fuzzy comprehensive evaluation method is used, considering the varying pollutant emissions from each heat source [54]. This approach assists in integrating the environmental impacts of different systems and addresses the ambiguity in pollution emission proportions [55]. The method involves the following steps:
Step 1: Determine the index set of a fuzzy comprehensive evaluation, denoted as H = (h1, h2, … hn), where h1 is the air source heat pump combined buried pipe system, h2 is the coal-fired boiler system, h3 gas boiler system, and h4 electric heating system.
Step 2: Establish the target set K = (k1, k2, …, km) for impact assessment, where k1 is the CO2 emission, k2 is the SO2 emission, k3 is the NOx emission, and k4 is the soot emission.
According to the index set and the target set, a fuzzy evaluation matrix E = (fij)4×4 is established, where fij represents the membership degree of each system’s impact with respect to each target. The pollutant emissions of different heating systems, derived from their energy consumption and discharge data, are used to fill in the matrix. The calculation results are shown in Table 5.
When comparing environmental benefits, the smaller the pollutant discharge of various systems, the better, so the calculation formula of fij using the smaller the quantity value is:
f i j = min ( x i j ) x i j
In the formula, x i j is the quantitative value of the i evaluation target of the j heating mode in the system scheme.
The fuzzy evaluation matrix E = (fij) 4×4 can be obtained via Equation (16):
E = 1.000 0.304 0.607 0.314 0.098 0.045 1.000 0.031 1.000 0.464 0.744 0.314 1.000 0.062 0.327 0.314
According to the characteristics of the heating system scheme and the influence degree of the evaluation target on the scheme, the analytic hierarchy process (AHP) is used to determine the weight vector W [56]. The calculation formula is:
W = ( w 1 , w 2 , w 2 , w 4 ) , i = 1 4 w i = 1
The important proportion of each environmental factor is shown in Table 6.
By accumulating the weight of each factor, the weight vector can be obtained as A = (3.38, 3.83, 4.78, 4.28). After normalization, the resulting weight vector W = (0.21, 0.24, 0.29, 0.26) is obtained from Equation (18). By fuzzy transformation B = WR, the evaluation vector is calculated as B = WR = (0.784, 0.225, 0.668, 0.246). According to the evaluation vector, the advantages and disadvantages of different systems on environmental superiority can be obtained.
W = A i j A i j
The environmental advantages of the air source heat pump combined with the buried pipe heat storage system were significant, with its environmental performance being 71% higher than coal-fired heating, 15% higher than gas-fired heating, and 69% higher than electric heating systems. These results demonstrate the remarkable environmental benefits of the air source heat pump system, highlighting its superior energy efficiency and lower pollutant emissions compared to traditional heating methods.

3.5. Economic and Sustainability Analysis

The economic viability of the air source heat pump combined with a ground heat storage system is promising, with an installation cost of approximately 16,000 RMB for materials and 4000 RMB for labor in an 800 m2 solar greenhouse. The system consumes 3402.0 kWh of electrical energy and 10,800 kWh of pure electric heating, achieving an energy consumption efficiency of around 69%, indicating substantial energy savings and economic advantages. Furthermore, the system can elevate the internal temperature of the greenhouse by 4.2 °C while reducing the relative humidity of the indoor air by approximately 6.6%. This system possesses considerable potential for development and application in enhancing crop yields.
The annual maintenance costs for the greenhouse heating system, which includes the heat pump, underground pipes for heat storage, and the control system, amount to approximately 1600 RMB. This includes 800 RMB for the heat pump system (covering air filter replacement, refrigerant recharge, and heat exchanger cleaning), 500 RMB for the buried pipe system (for pipe inspections, circulating pump maintenance, and internal cleaning), and 300 RMB for the control system (which covers software updates and sensor calibration). The system performance will degrade over time, with the heat pump’s efficiency expected to decrease by 1% annually and 10% over ten years. Additionally, the heat pump has an average failure time of 20,000 h, with an estimated 1–2 failures within ten years. The buried pipes will experience a 0.5% annual decrease in heat exchange efficiency, amounting to a total decrease of 5% over ten years. However, replacement will not be necessary due to the stability of the underground environment.
Calculating the payback period provides a clearer perspective on the sustainability of the system. Total income includes both energy savings and crop yield improvement. The payback period is defined as the ratio of total income to total investment costs. Based on calculations, the system can recover its costs within four years, with the actual investment recovery period being shorter than anticipated, highlighting its energy-efficient and environmentally friendly attributes.

4. Conclusions

This study introduces an active heat storage and release system that significantly enhances the thermal environment in solar greenhouses, particularly during nighttime, while also promoting energy efficiency. By combining an air source heat pump with an underground pipe system, the system effectively fulfills the greenhouse heating demands, which were estimated through the analysis of the greenhouse enclosure structure and heat losses. Field tests confirmed the accuracy of the design, demonstrating promising results in terms of heating performance. The main conclusions from this study are as follows:
(1)
Following the implementation of the ASHP–UP heating system, the minimum nighttime temperature of the greenhouse stabilized between 10 °C and 12 °C. The relative humidity of the air can be reduced by 8%, thereby providing an optimal thermal and humidity environment for crop growth. Under snowy weather conditions, the greenhouse internal temperatures were able to be maintained in the range of 10 to 12 °C throughout the day, mainly due to the lower ambient temperatures outside and the lower intensity of solar radiation. In this case, the greenhouse climate control system was operated solely in exothermic mode to maintain a stable internal temperature.
(2)
The ASHP–UP system greatly reduced indoor temperature fluctuations in all types of weather. The greatest reduction in TLL values was observed in sunny climates, where the greenhouse temperature varied the most throughout the day. However, the system’s ability to store heat during the day, which helps lower the daily maximum temperature, and its exothermic function to raise the minimum temperature at night, led to a significant reduction in TLL values on sunny days.
(3)
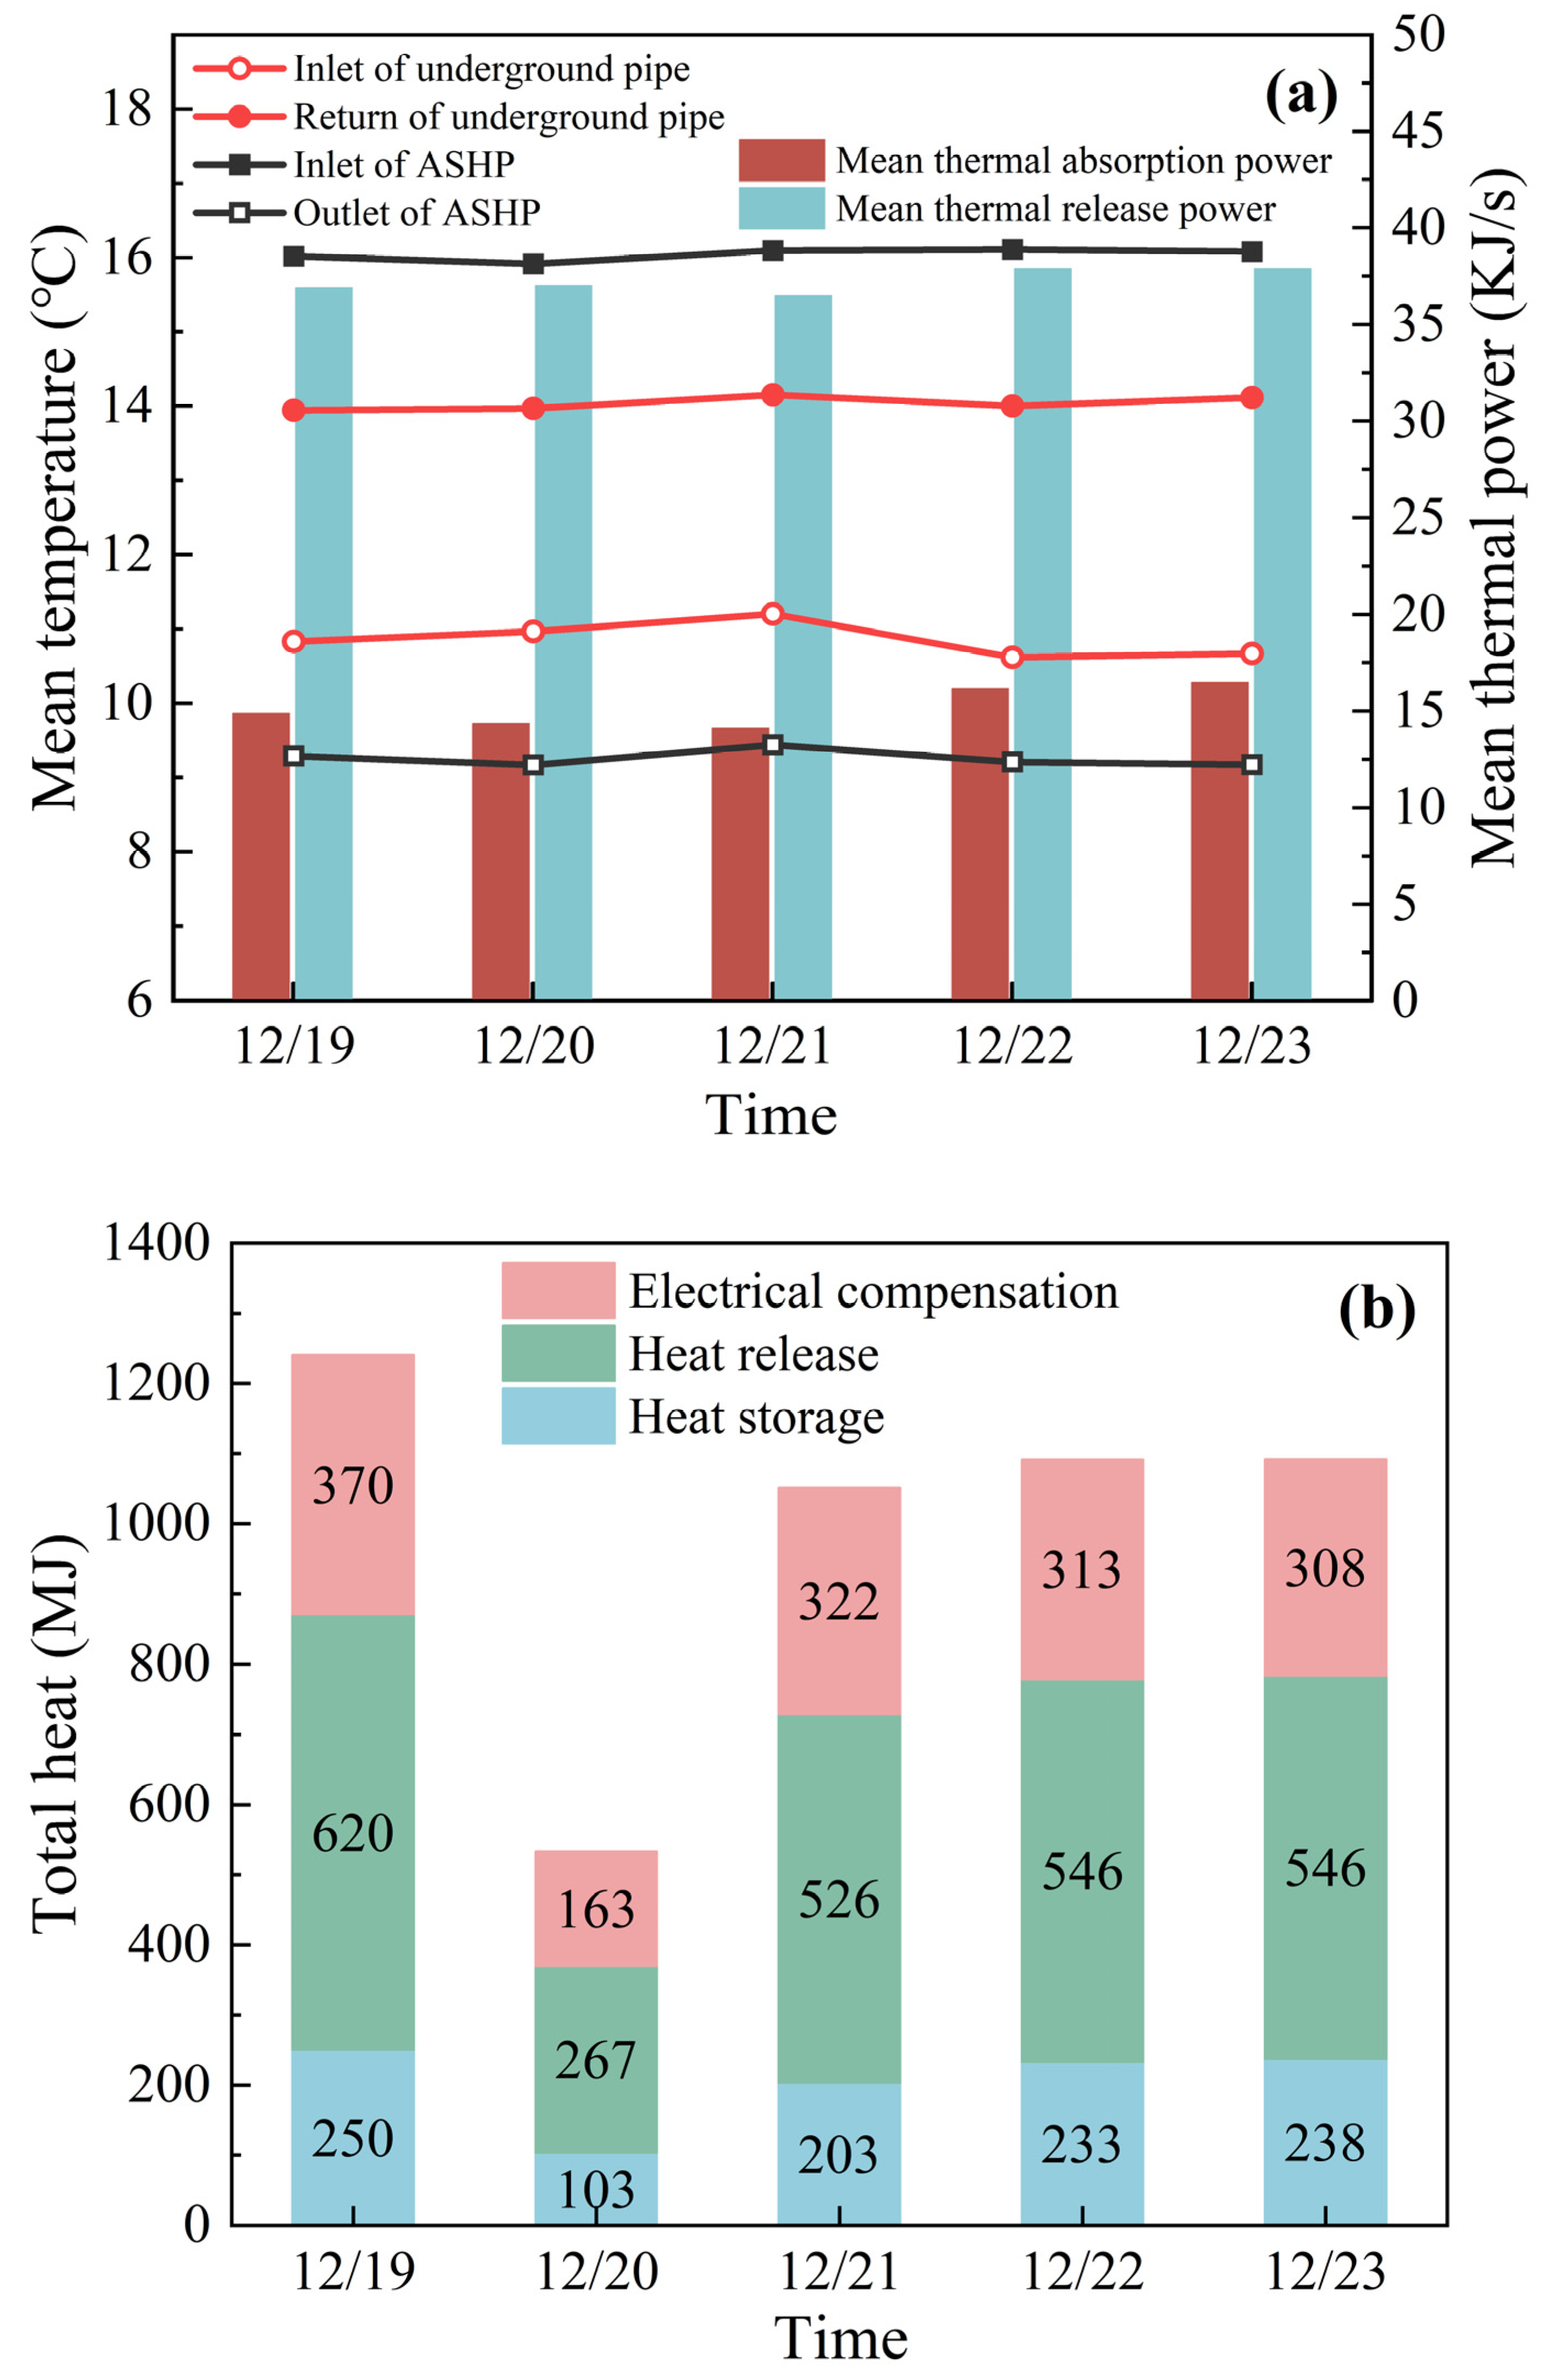
Throughout the system’s operation, the average heat release power fluctuated between 36.5 kJ s−1 and 37.5 kJ s−1, demonstrating satisfactory heating performance.
(4)
By calculating the temperature difference between the system’s inlet and outlet, the average coefficients of performance (COP) for heat storage and release were found to be 4.33 and 4.81, respectively. In comparison to traditional heating methods, such as coal-fired, gas-fired, and electric heating systems, energy consumption was reduced by 84.7%, 81.3%, and 79.1%, respectively.
(5)
When compared to coal-fired, gas-fired, and electric heating systems, as well as conventional heat storage methods, greenhouse gas emissions were reduced by 8.24 t, 6.52 t, and 5.67 t, respectively. An analysis of comprehensive costs and profitability indicated that the system demonstrates high sustainability, with a payback period of approximately four years.
In summary, the outstanding heat storage capacity and energy efficiency of the ASHP–UP system in assembled solar greenhouses indicated significant potential for this technology in similar environments. This system not only reduces cost inputs in facility agricultural production but also aids in alleviating energy tensions on a macro scale, while simultaneously reducing carbon dioxide emissions and other pollutants, thus promoting green and low-carbon development. However, during the actual production of the system, it was found that the performance of the system was significantly limited by the length and layout of the buried pipes. Inadequate design could lead to reduced economic benefits, and prolonged operation of the system may cause long-term negative impacts on the soil heat balance, potentially threatening the stability and sustainability of the system. The limitations of the system application are mainly related to the special requirements for the installation site, the reliability problems of the heat pump equipment at low temperatures, and the high requirements for the professional skills of the operator. Future research should focus on advancing technologies that improve the operational efficiency and reliability of air source heat pumps in low-temperature conditions. Additionally, optimizing the design of buried pipe systems to enhance heat exchange efficiency and reduce costs is essential. A comprehensive evaluation of the system’s long-term performance and its environmental impact should also be conducted. Moreover, developing an intelligent control system for adaptive optimization and efficient system operation would further enhance its effectiveness.

Author Contributions

Conceptualization, G.Z. and L.W.; data curation, G.Z.; formal analysis, L.W., Q.Y. and X.S.; funding acquisition, X.S. and H.S.; investigation, L.W., S.G., Q.Y. and X.S.; methodology, G.Z.; project administration, H.S.; resources, H.S.; software, G.Z.; supervision, Q.Y.; visualization, S.G.; writing—original draft, G.Z.; writing—review and editing, L.W., S.G. and H.S. All authors have read and agreed to the published version of the manuscript.

Funding

This research was funded by the National Key R&D Projects of China (2023YFD2000602), Autonomous Region Regional Collaborative Innovation Special Project (Science and Technology Assistance to Xinjiang Plan) (2022E02106), Key R&D Projects of Xinjiang Uygur Autonomous Region (2023B02024-2), Xinjiang Uygur Autonomous Region Major Sciences and Technology Special Project (2022A02005-5, 2022A02005-1).

Data Availability Statement

Data presented in this study are available on fair request to the corresponding author.

Acknowledgments

The authors would like to thank their schools and colleges, as well as the funding providers of the project. All support and assistance are sincerely appreciated.

Conflicts of Interest

The authors declare no conflicts of interest.

References

  1. Dong, J.; Gruda, N.; Li, X.; Cai, Z.; Zhang, L.; Duan, Z. Global vegetable supply towards sustainable food production and a healthy diet. Clean. Prod. 2022, 369, 133212. [Google Scholar] [CrossRef]
  2. Li, T.; Qi, M.; Meng, S. Sixty Years of Facility Horticulture Development in China: Achievements and Prospects. Acta Hortic. Sin. 2022, 49, 2119–2130. (In Chinese) [Google Scholar]
  3. Qi, F.; Wei, X.; Zhang, Y. Development status and future research emphase on greenhouse horticultural equipment and its relative technology in China. Trans. Chin. Soc. Agric. Eng. 2017, 33, 24. (In Chinese) [Google Scholar]
  4. Guo, B.; Zhou, B.; Zhang, Z.; Li, K.; Wang, J.; Papadakis, G. A Critical Review of the Status of Current Greenhouse Technology in China and Development Prospects. Appl. Sci. 2024, 14, 5952. Available online: https://www.mdpi.com/2076-3417/14/13/5952 (accessed on 10 December 2024). [CrossRef]
  5. Shi, Y.; Wang, X.; Wei, M.; Li, Q.; Liu, F.; Hou, J. Temperature variation, heat storage and heat release characteristics of soil wall in solar greenhouse. Trans. Chin. Soc. Agric. Eng. 2016, 32, 214–221. (In Chinese) [Google Scholar]
  6. Li, J.; Li, H.; Sun, G.; Wang, J. Performance testing and analysis of flexible composite walls in assembled solar greenhouse. Trans. Chin. Soc. Agric. Eng. 2024, 40, 179–187. (In Chinese) [Google Scholar]
  7. Bao, E.; Cao, Y.; Zou, Z.; Shen, T.; Zhang, Y. Research progress of thermal storage technology in energy-saving solar greenhouse. Trans. Chin. Soc. Agric. Eng. 2018, 34, 1–14. (In Chinese) [Google Scholar]
  8. Wang, H.; Zu, G.; Yang, F.; Li, D.; Tian, L. Design of multi-functional solar greenhouses in high latitude areas. Trans. Chin. Soc. Agric. Eng. 2020, 36, 170–178. (In Chinese) [Google Scholar]
  9. Zhang, X.; Zhang, W.; Yang, X.; Wang, L.; Ma, H.; Fan, Q. Survey of Research Methods on Agricultural Greenhouse Environment Control. Control. Eng. China 2017, 24, 8–15. (In Chinese) [Google Scholar]
  10. Zohra, F.; Dahmani, M. Optimization of greenhouse climate with solar heating systems. In Proceedings of the International Renewable Energy DAYS’2024, Algiers, Algeria, 28–30 May 2024; Available online: https://www.researchgate.net/publication/386553155 (accessed on 11 December 2024).
  11. Chaigneau, M.; Nienborg, B. Sustainable Heat Supply for Greenhouses with Heatpumps. In Proceedings of the International Sustainable Energy, Ho Chi Minh City, Vietnam, 10–11 November 2023; Available online: https://www.tib-op.org/ojs/index.php/isec/article/view/1162 (accessed on 22 December 2024).
  12. Ozcan, Z.; Bilir, L.; Caglar, B. Modelling and analysis of heat pump integrated Photovoltaics-Wind systems for an agricultural greenhouse in Turkey. Appl. Therm. Eng. 2024, 248, 123364. Available online: https://www.sciencedirect.com/science/article/abs/pii/S1359431124010329 (accessed on 25 December 2024). [CrossRef]
  13. Sun, W.; Yang, Q.; Fang, H.; Zhang, Y.; Guan, D.; Lu, W. Application of heating system with active heat storage-release and heat pump in solar greenhouse. Trans. Chin. Soc. Agric. Eng. 2013, 29, 168–177. (In Chinese) [Google Scholar]
  14. Sun, W.; Zhang, Y.; Yang, Q.; Fang, H.; Lu, W.; Hu, Y. Thermodynamic analysis of active heat storage-release associated with heat pump heating system in greenhouse. Trans. Chin. Soc. Agric. Eng. 2014, 30, 179–188. (In Chinese) [Google Scholar]
  15. Wang, Y.; Zhang, X.; Zhao, H.; Miao, R. Application analysis of centralized straw methane gas supply project in sunlight greenhouse. Acta Energiae Solaris Sin. 2017, 38, 913–919. (In Chinese) [Google Scholar]
  16. Chai, L.; Ma, C.; Zhang, X.; Qu, M.; Chen, Q.; Yu, F. Experimental investigation and performance analysis on ground source heat pump system for greenhouse cooling. Trans. Chin. Soc. Agric. Eng. 2008, 24, 150–154. (In Chinese) [Google Scholar]
  17. Marsh, L.S.; Singh, S. Economics of greenhouse heating with a mine air-assisted heat pump. Trans. ASAE 1994, 37, 1959–1963. [Google Scholar] [CrossRef]
  18. Tong, Y.; Kozai, T.; Nishioka, N.; Ohyama, K. Greenhouse heating using heat pumps with a high coefficient of performance (COP). Biosyst. Eng. 2010, 106, 405–411. [Google Scholar] [CrossRef]
  19. Bot, G.; Van De Braak, N.; Challa, H.; Hemming, S.; Rieswijk, T.; van Straten, G.; Verlodt, I. The solar greenhouse: State of the art in energy saving and sustainable energy supply. Acta Hortic. 2005, 691, 501. [Google Scholar] [CrossRef]
  20. Amirirad, A.; Kumar, R.; Fung, A.-S. Performance characterization of an indoor air source heat pump water heater for residential applications in Canada. Int. J. Energy Res. 2018, 42, 1316–1327. [Google Scholar] [CrossRef]
  21. Yang, S.H.; Rhee, J.Y. Utilization and performance evaluation of a surplus air heat pump system for greenhouse cooling and heating. Appl. Energy 2013, 105, 244–251. [Google Scholar] [CrossRef]
  22. Yu, W.; Wang, T.; Liu, W.; Bai, Y.; Tong, G. Soil Temperature in Solar Greenhouse with Buried Hot Water Pipes. J. Shenyang Agric. Univ. 2014, 45, 321–325. (In Chinese) [Google Scholar]
  23. Dong, P.; Lu, Q.; Chen, Q.; Zhang, Z.; Xu, H.; Yao, L. Influencing Factors of Greenhouse Buried Pipeline Temperature Field—Based on Fluent. J. Agric. Mech. Res. 2015, 37, 239–244. (In Chinese) [Google Scholar]
  24. Yu, T.; Wang, D.; Wang, Y. Research on Heat Storage Effect of Horizontal Underground Pipe in Solar Greenhouse in Cold Area. J. Agric. Mech. Res. 2022, 44, 248–258. (In Chinese) [Google Scholar]
  25. Guo, Z.; Wang, D.; Wang, X.; Liu, L.; Meng, K.; Wei, C. Simulation Study on Effect of Buried Pipe Heating on Distribution of Soil Temperature and Moisture in Vegetable Greenhouse. J. Shenyang Agric. Univ. 2022, 53, 73–82. (In Chinese) [Google Scholar]
  26. Zhen, Q.; Du, J.; Ta, N.; Yan, C.; Sun, Y. Numerical Analysis of the Influence of Solar Greenhouse Heating Channels and Soil Heat Transfer Intensity in Cold and Arid Areas. J. Agric. Mech. Res. 2024, 46, 257–263. (In Chinese) [Google Scholar]
  27. Bao, L.; Geng, J.; Zhu, S.; Li, R.; Dong, S. Study on Operation Characteristics of Ground Pipe and Air Source Heat Pump System in Greenhouse. J. Agric. Mech. Res. 2020, 42, 258–264. (In Chinese) [Google Scholar]
  28. Bao, L.; Cui, J.; Li, Y.; An, H. Heat Storage Performance of Air Source Heat Pump-underground Buried Pipe Heat Exchange System. Sci. Technol. Eng. 2022, 22, 10688–10697. (In Chinese) [Google Scholar]
  29. Wang, C.; Fang, H.; Zhang, Y.; Sang, S.; Cao, K. Energy consumption analysis of simply soft insulated wall-assembled Chinese solar greenhouse. Trans. Chin. Soc. Agric. Eng. 2023, 39, 190–197. (In Chinese) [Google Scholar]
  30. Luo, Q.; Cheng, R.; Zhang, Y.; Fang, H.; Li, D.; Zhang, J.; Song, G. Optimization of active heat storage and release system in solar greenhouse. Trans. Chin. Soc. Agric. Eng. 2020, 36, 234–241. (In Chinese) [Google Scholar]
  31. Zhou, B.; Zhang, Y.; Fang, H.; Yang, Q.; Ao, H. Performance experiment and design of simply assembled Chinese solar greenhouse equipped with heating and dehumidification system. Trans. Chin. Soc. Agric. Eng. 2016, 32, 226–232. (In Chinese) [Google Scholar]
  32. JB/T 10297-2001; Greenhouse Heating System Design Specification. Chinese Academy of Agricultural Mechanization Sciences Environmental Engineering Equipment Research and Development Center: Beijing, China, 2003. (In Chinese)
  33. Xia, T.; Li, Y.; Sun, Z.; Wan, X.; Sun, D.; Wang, L.; Liu, X.; Li, T. Performance study of an active solar water curtain heating system for Chinese solar greenhouse heating in high latitudes regions. Appl. Energy 2023, 332, 120548. [Google Scholar] [CrossRef]
  34. Xu, W.; Guo, H.; Ma, C. An active solar water wall for passive solar greenhouse heating. Appl. Energy 2022, 308, 118270. [Google Scholar] [CrossRef]
  35. Ahamed, M.-S.; Guo, H.; Tanino, K. Development of a thermal model for simulation of supplemental heating requirements in Chinese-style solar greenhouses. Comput. Electron Agric. 2018, 150, 235. [Google Scholar] [CrossRef]
  36. Jolliet, O.; Danloy, L.; Gay, J.B.; Munday, G.L.; Reist, A. HORTICERN: An improved static model for predicting the energy consumption of a greenhouse. Agric. Meteorol. 1991, 55, 265–294. [Google Scholar] [CrossRef]
  37. Deng, L.; Huang, L.; Zhang, Y.; Li, A.; Gao, R.; Zhang, L.; Lei, W. Analytic model for calculation of soil temperature and heat balance of bare soil surface in solar greenhouse. Sol. Energy 2023, 249, 312–326. [Google Scholar] [CrossRef]
  38. Ma, Q.; Li, M.; Wang, L.; Hu, X.; Song, W.; Wei, X. Heat storage and release characteristics of the combined heat storage system for prefabricated solar greenhouses with flexible material wall. Trans. Chin. Soc. Agric. Eng. 2024, 40, 183–193. (In Chinese) [Google Scholar]
  39. Zhang, Y.; Ni, X.; Zhang, K.; Xu, Y. Cooling performance for tomato root zone with intelligent ecological planting matrix temperature control system driven by photovoltaic in greenhouse. Trans. Chin. Soc. Agric. Eng. 2020, 36, 212–219. (In Chinese) [Google Scholar]
  40. Feng, S.; Hu, W.; Li, D. Heating Mode and Equipment Selection during Agricultural Construction. Tianjin Agric. Sci. 2017, 23, 78–81. (In Chinese) [Google Scholar]
  41. Tian, D.; Song, W.; Wang, P.; Cheng, J.; Liang, C.; Zhao, S. Soil heat storage and release characteristics of the plastic tunnel with external thermal insulation. Trans. Chin. Soc. Agric. Eng. 2022, 38, 189–196. (In Chinese) [Google Scholar]
  42. Xiao, J.; Wang, Q.; Wang, X.; Hu, Y.; Cao, Y.; Li, J. An earth-air heat exchanger integrated with a greenhouse in cold-winter and hot-summer regions of northern China: Modeling and experimental analysis. Appl. Therm. Eng. 2023, 232, 120939. [Google Scholar] [CrossRef]
  43. Mirzazade, A.A.; Haghighi, P.A.; Biglari, F. Performance analysis of domed roof integrated with earth-to-air heat exchanger system to meet thermal comfort conditions in buildings. Renew Energy 2021, 168, 1265–1293. [Google Scholar] [CrossRef]
  44. Ma, C.-W. Studies on the vinyl-house house heating by the underground heat exchange system. Trans. Chin. Soc. Agric. Eng. 1985, 1, 54–65. (In Chinese) [Google Scholar]
  45. Baddadi, S.; Bouadila, S.; Ghorbel, W.; Guizani, A. Autonomous greenhouse microclimate through hydroponic design and refurbished thermal energy by phase change material. J. Clean. Prod. 2019, 211, 360–379. [Google Scholar] [CrossRef]
  46. Sethi, V.; Sumathy, K.; Lee, C.; Pal, D. Thermal modeling aspects of solar greenhouse microclimate control: A review on heating technologies. Sol. Energy 2013, 96, 56–82. [Google Scholar] [CrossRef]
  47. Ihoume, I.; Tadili, R.; Arbaoui, N.; Bazgaou, A.; Idrissi, A.; Benchrifa, M.; Fatnassi, H. Performance study of a sustainable solar heating system based on a copper coil water to air heat exchanger for greenhouse heating. Sol. Energy 2022, 232, 128–138. [Google Scholar] [CrossRef]
  48. Yu, W.; Liu, W.; Bai, Y.-K.; Ding, X. Simulating thermal environment in a two-span solar greenhouse using CFD. Trans. Chin. Soc. Agric. Eng. 2023, 39, 215–222. (In Chinese) [Google Scholar]
  49. Yuan, Q.; Lu, W.; Wang, J.; Chen, R.; Li, Y.; Yu, X.; He, C.; Sun, M.; Yan, Y. Effects of irrigation strategies of accumulated solar radiation on cucumber growth under different soil textures in the solar greenhouse. Trans. Chin. Soc. Agric. Eng. 2023, 39, 98–105. (In Chinese) [Google Scholar]
  50. Sun, X.; Guo, K.; Zou, Z.; Zhang, Y. System investigation of a solar combined with air-source heat pump system for greenhouse heating. Acta Energ. Solaris Sin. 2016, 37, 658–665. (In Chinese) [Google Scholar]
  51. Zhou, S.; Zhang, Y.; Cheng, R.; Yang, Q.; Fang, H.; Zhou, B.; Lu, W.; Zhang, F. Evaluation on heat preservation effects in micro-environment of large-scale greenhouse with active heat storage system. Trans. Chin. Soc. Agric. Eng. 2016, 32, 218–225. (In Chinese) [Google Scholar]
  52. Sun, X.; Hui, L.; Sheng, W.; Liu, T.; Zhao, X. Study on the Potential of SO3 Emission Reduction from Coal Power Industry in China Through the Analysis of Whole Smoke treatment Process. Proc. CSEE 2024, 1–11. (In Chinese) [Google Scholar]
  53. Yao, Y.; Dai, J.; Luo, W.; Sun, G. Simulation analysis of distribution of energy consumption for year round cucumber production in multi-span greenhouse in China. Trans. Chin. Soc. Agric. Eng. 2011, 27, 273–279. (In Chinese) [Google Scholar]
  54. Wang, Z.; Lian, L. Comprehensive fuzzy evaluation of indoor thermal environment in cold area. J. Journal of Harbin Institute of Technology. 2004, 36, 752–755. (In Chinese) [Google Scholar] [CrossRef]
  55. Fang, K.; He, B.; Yang, M.; Wang, Z. Application of fuzzy comprehensive evaluation method to CENS. J. Harbin Inst. Technol. 2011, 43, 30–36. (In Chinese) [Google Scholar]
  56. Shang, L.; Liu, S.; Shan, Q.; Zhang, L.; Sun, N.; Wei, W. Comprehensive evaluation of low carbon performance of typical carbon dioxide utilization technologies. Chem. Ind. Eng. Prog. 2022, 41, 1199–1208. (In Chinese) [Google Scholar]
Figure 1. Plan view of test greenhouse.
Processes 13 00334 g001
Figure 2. Distribution of buried pipes.
Processes 13 00334 g002
Figure 3. Schematic diagram of the system principle.
Processes 13 00334 g003
Figure 4. ASHP–UP thermal storage system in the solar greenhouse.
Processes 13 00334 g004
Figure 5. Test point layout plan.
Processes 13 00334 g005
Figure 6. Test point profile layout.
Processes 13 00334 g006
Figure 7. Heat load of greenhouse structures.
Processes 13 00334 g007
Figure 8. The temperature change in experimental greenhouse: (a) solar radiation and indoor and outdoor temperature changes; (b) comparison of indoor temperature under different weather conditions.
Processes 13 00334 g008
Figure 9. Comparison of temperature fluctuations in A1 and A2 greenhouses under typical weather conditions.
Processes 13 00334 g009
Figure 10. Air flow temperature changes in air inlet and outlet of air source heat pump unit for several consecutive days.
Processes 13 00334 g010
Figure 11. System inlet and outlet temperatures.
Processes 13 00334 g011aProcesses 13 00334 g011b
Figure 12. Water temperature changes in the total inlet and outlet of the buried water pipe for several consecutive days.
Processes 13 00334 g012
Figure 13. Soil temperature changes in typical weather.
Processes 13 00334 g013
Figure 14. Spatial and temporal distribution of air humidity: (a) comparison of indoor air average humidity; (b) air humidity comparison of inlet and outlet of ASHP.
Processes 13 00334 g014aProcesses 13 00334 g014b
Figure 15. Thermal performance of system heating process: (a) average inlet and outlet temperature and heat transfer power; (b) comparison of total heat absorbed and released.
Processes 13 00334 g015
Table 2. Equipment parameters.
InstallationsParametricNumerical Value
Air source heat pumpRated heat capacity/kW30
Rated input power/kW6.3
Water pumpFlux/m3h−110
Power/kW1.5
Ground heat exchangerHorizontal spacing/m0.9
Main water pipe diameter/mm63
Branch water pipe diameter/mm32
Water supply tankDiameter/m0.4
High degree/m1.0
Table 3. System heat storage COP value and exothermic COP value.
DateWeatherRun ModelHeat Storage and Heat Release Value MJHeat Storage and Heat Release System Runtime hHeat Storage and Heat Release Electricity Consumption MJHeat Storage and Heat Release COP
9 December 2023SunnyHS596/-5.0/-140/-4.26/-
10 December 2023SunnyHS556/-4.7/-132/-4.21/-
12 December 2023SunnyHS534/-4.5/-126/-4.24/-
11 December 2023CloudyHS + HR458/1363.8/1.0106/284.32/4.87
14 December 2023CloudyHS + HR394/2783.2/2.090/564.38/4.96
15 December 2023CloudyHS + HR356/3823.0/2.884/794.24/4.83
8 December 2023OvercastHS485/-4.0/-112/-4.32/-
13 December 2023OvercastHS + HR424/2143.5/1.698/454.33/4.75
17 February 2024OvercastHR-/956-/7.2-/202-/4.74
1 February 2024SnowyHR-/1138-/8.5-/238-/4.78
18 February 2024SnowyHR-/990-/7.5-/210-/4.71
19 February 2024SnowyHR-/1052-/7.8-/218-/4.82
Table 4. Energy consumption and operating costs of different heating methods for greenhouses.
Equipment TypeThermal EfficiencyStandard Coal (t)Energy Conservation
Rate (%)
Amount of Carbon
Emission Reduction (t)
ASHP–UP system4.560.60-1.50
Coal-fired boiler0.703.9184.79.74
Gas-fired boiler0.853.2281.48.02
Electric boiler0.952.8879.27.17
Table 5. Total emissions of major pollutants from each heating system.
Objectivesh1h2h3h4
k1/kg1759.365790.362896.915596.58
k2/kg16.3235.361.6051.91
k4/kg9.2319.8912.4129.36
k5/kg1.0216.593.123.24
Table 6. Relative importance among environmental impact factors.
PollutantsTypes of Pollutants
CO2SO2NOxSoot
CO215/63/44/5
SO26/514/55/6
NOx4/35/416/5
Soot5/46/55/61
Disclaimer/Publisher’s Note: The statements, opinions and data contained in all publications are solely those of the individual author(s) and contributor(s) and not of MDPI and/or the editor(s). MDPI and/or the editor(s) disclaim responsibility for any injury to people or property resulting from any ideas, methods, instructions or products referred to in the content.

