Abstract
This paper presents results derived from carbothermic reduction of tellurium from a tellurium-containing condensate obtained during the oxidative-distillation roasting of a tellurium-containing middling. It is shown that the tellurium-containing condensate contains TeO2 and Te2O3(SO4) phases. A regression model and a generalized equation were constructed using mathematical planning methods. This model and equation describe the dependence of tellurium recovery from the tellurium-containing condensate on the main process parameters. The developed models demonstrated a high degree of adequacy and made it possible to calculate the optimal parameters for the carbothermic reduction of tellurium. Experimental verification confirmed the possibility of obtaining elemental tellurium with a purity of 99.5%. The obtained data indicate the feasibility of producing crude tellurium by means of a two-stage pyrometallurgical process performed at low pressure. Organization of the process via the use of sealed equipment for the capture of tellurium-containing compounds through condensation significantly reduces the environmental risks associated with the toxicity of tellurium and its compounds.
1. Introduction
Tellurium is an important element for high-tech industries and advanced technologies; therefore, efficient and environmentally safe production of tellurium is of particular relevance.
The main raw material source of tellurium is the slime from copper electrolysis production. A fairly wide range of technologies have been proposed for the processing of these slimes [1,2,3,4,5,6,7,8] due to the complexity and diversity of their chemical and phase compositions. In the classical scheme [9,10,11], the first stage of slime processing is leaching, as a result of which tellurium is concentrated in the solution. Selenium and silver are first extracted from the solution. Then, tellurium is precipitated as a finished middling—copper telluride—by adding copper to the solution. Industrial copper telluride is a mixture of phases of both stoichiometric (Cu2Te) and non-stoichiometric compositions (Cu2−xTe) [12,13,14,15,16], and it also contains a small amount of impurities of other elements and compounds.
Traditionally, oxidative–alkaline leaching with the addition of NaOH is carried out to decompose the copper telluride phase [8,10,11]. As a result, tellurium is concentrated in the solution in the form of sodium tellurite (Na2TeO3), while copper remains in precipitate form. According to [15], with the classical method, the efficiency of tellurium leaching is about 80%, which the authors attribute to the formation of insoluble CuTeO3. The solution is further directed to electrolysis, and the copper-containing residue to copper recovery [9,17]. The authors of [18,19] have shown that tellurium recovery during electrolysis reaches 90%. The purity of the obtained elemental tellurium is 99.95%.
Research has also pursued the development of hydrometallurgical methods to process tellurium-containing middling. Indeed, the concept of replacing the electrolysis stage with leaching in order to increase tellurium recovery efficiency has been proposed.
Y. Shen [20] performed oxidative–alkaline leaching in H2SO4 solution with the addition of NaClO3, as an oxidizer, for the separation of copper and tellurium. At the next stage, in order to extract impurity elements, the previously obtained tellurium oxide was dissolved in a NaOH solution with the addition of Na2S; then, H2O2 was added for the separation of tellurium and selenium. Furthermore, the obtained Na2TeO4 cake was dissolved in a Na2S solution, and Na2SO3 solution was added to precipitate elemental tellurium.
In [21], at the first stage, impurities were initially extracted, for which copper telluride was dissolved in H2SO4 solution with the addition of the H2O2 oxidizer. Then, Na2C2O4 was added to the obtained tellurium-containing solution for the separation of copper and tellurium, as a result of which copper was concentrated in the solid product in the form of copper oxalate. Na2SO3 was used as a reducing agent to precipitate elemental tellurium from the tellurium-enriched solution.
Both methods are characterized by sufficiently high overall tellurium recovery values (96.18 and 93%, respectively) at a purity of 99–99.85%. It should be noted that, after its hydrochemical precipitation, crude tellurium must be carefully washed with deionized water [20,21] or with water and alcohol [9] before being dried until moisture is completely removed (12–24 h) [9,20,21].
Despite the achieved signs of tellurium recovery efficiency, these newly proposed methods do not solve the main problems of hydrometallurgical processes, including its time-consuming, multi-stage nature; the need for high water consumption and excessive reagent use; and the need for neutralization and disposal of solutions.
Therefore, at present, research aimed at developing new pyrometallurgical technologies characterized by high tellurium recovery into a separate product (up to 99%), as well as environmental safety due to the process being performed with sealed equipment, is being conducted.
One such method is oxidative-distillation roasting with tellurium being transferred into the oxide form. The authors of [22] show that at a temperature of 1100 °C (pressure 0.67 kPa; oxidant (air) flow rate 2.2 × 10x2 m3/m2·s; roasting duration 60–90 min), the degree of tellurium recovery is 90–93%. When the temperature is increased to 1100 °C (with a roasting duration of 60 min), a technologically acceptable degree of tellurium recovery into the condensate (98%) is achieved [23]. One of the decomposition products is a copper oxide alloy, which constitutes the basis of the residue. Subsequent processing of the residues by known methods will ensure the return of copper into the production cycle. The second product is a condensate, the main component of which is the tellurium oxide phase.
The obtained condensate may be directed to tellurium recovery by known methods or sold as a commercial product.
This paper, for the first time in the literature, describes the results of research focused on the recovery of elemental tellurium from a condensate obtained via oxidative-distillation roasting. Carbothermic reduction of tellurium at low pressure using charcoal as a reducing agent was selected as the processing method.
2. Materials and Methods
2.1. Materials
The condensate selected for study was obtained by the oxidative-distillation roasting of a tellurium-containing middling derived from copper production (Kazakhmys Smelting LLP, Balkhash, Republic of Kazakhstan), carried out according to the procedure described in [22]. The production of the tellurium-containing condensate was performed under the following conditions: temperature 1100 °C, pressure 0.67 kPa, oxidant flow rate 2.2 × 10⁻² m3/m2·s, and roasting duration 60 min. Atmospheric oxygen was used as the oxidant.
According to X-ray diffraction analysis (Figure 1), the bulk condensate sample consisted of tellurium oxide phases, TeO2 (PDF 00-042-1365), and dittellurium trioxide sulfate, Te2O3(SO4) (PDF 01-070-0135). The results of our semi-quantitative analysis showed the presence of TeO2 in the crystalline part of the condensate in an amount of 67.7 wt. %. X-ray fluorescence analysis showed that the main elemental composition (wt. %) was as follows: Te—62.02; O—35.17; S—2.49. A more detailed description of the condensate is provided in Section 3.1.
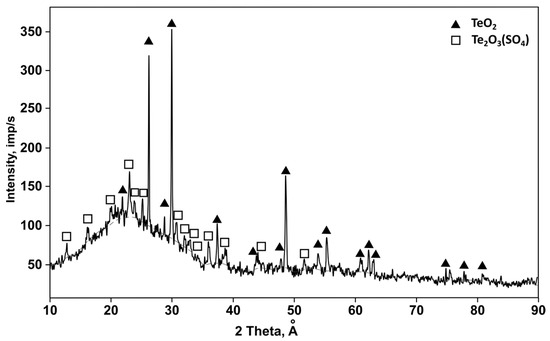
Figure 1.
X-ray diffraction pattern of the tellurium-containing condensate.
Charcoal BAU-MF (Uralkhimsorb, Perm, Russia) was used as the reducing agent. Its characteristics are as follows: total pore volume—not less than 1.6 cm3/g; bulk density— not more than 200 g/dm3; main fraction size (95.5%)—3.6–1 mm; ash content—not more than 6.0%; and specific surface area—about 800–900 m2/g.
Argon (purity 99.993%) (Ikhsan Tekhnogaz LLP, Almaty, Republic of Kazakhstan) was used as an inert gas to purge the internal system of the vacuum installations and to perform the experiments.
2.2. Methodology
The process was performed in a vacuum unit with a horizontally positioned reactor (Figure 2). The setup consisted of a Nabertherm RT 50/250/13 tubular electric furnace (Nabertherm, Lilienthal, Germany) with a B-180 controller, a 2NV3-5DM UHL4 vacuum pump, and a quartz reaction vessel containing a boat containing the sample. A detachable porcelain condenser was placed over the boat, on which the reduced tellurium was deposited. A chromel–alumel thermocouple (thermoelectric transducer DTPK021-1.2/0.7) with a single-channel microprocessor-based measuring controller TRM1 was used to control the temperature in the reaction zone. The overall temperature measurement error was ±3 °C. The pressure was measured with a DCP 3000 vacuum gauge (Vacuubrand, Wertheim, Germany) with a VSP 3000 sensor (accuracy ±10 Pa). A filter was installed at the outlet of the retort to capture particles not deposited in the reactor. The vacuum gauge was calibrated against standards in the DAkkS calibration laboratory of the manufacturer.
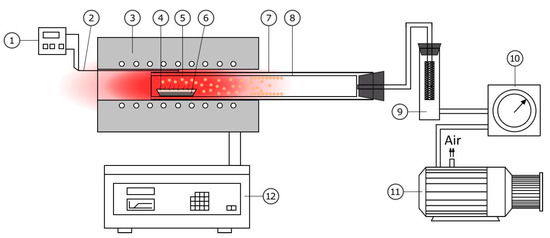
Figure 2.
Schematic diagram of the setup for obtaining elemental tellurium: (1) temperature controller in the reaction zone, (2) control thermocouple, (3) electric furnace, (4) boat, (5) isothermal zone, (6) sample, (7) reactor, (8) detachable condenser, (9) filter, (10) vacuum gauge, (11) vacuum pump, and (12) furnace controller.
A weighed sample of the mixture of the tellurium-containing condensate and reducing agent of the required composition was loaded into the boat during the experiment. The boat was then placed into the detachable (longitudinal) condenser. This condenser was then placed into the quartz reactor. The reactor was connected to the vacuum system and then purged several times with an inert gas. After evacuating the gases from the system to the specified pressure, the reactor was placed into a preheated furnace in such a way that the boat was located in the isothermal zone. The start of the experiment was defined as the moment when the target temperature, recorded in the reaction zone by a thermocouple, was reached. At the end of the experiment, the reactor was removed from the furnace, before being cooled under vacuum, and the vacuum system was disassembled. The residue, the condenser, and the quartz retort were weighed separately. Weighing was performed using PA214C analytical balances (Ohaus-Pioneer, Parsippany, NJ, USA) with an accuracy of ±0.1 mg.
The degree of recovery was calculated based on the total amount of tellurium deposited on the condenser and the retort. The carbon consumption (C, %) was calculated relative to the stoichiometrically amount required for complete reduction of tellurium from tellurium dioxide.
2.3. Characterization
The study of the elemental composition was performed by X-ray fluorescence analysis using a wavelength-dispersive spectrometer (Axios 1 kW, PANalytical, Almelo, The Netherlands) with an accuracy of ±5%.
For phase composition identification, X-ray diffraction analysis was performed using a D8 Advance diffractometer (Bruker, Germany), Cu-Kα radiation. The phase composition was determined using the ASTM database (reference database of diffraction data PDF-2 rel. 2023 of the International Centre for Diffraction Data (ICDD, Newtown Square, PA, USA).
3. Results and Discussion
3.1. Tellurium-Containing Condensate
Figure 3 shows the appearance of the tellurium-containing condensate on the alumina condenser, obtained for studies on the carbothermal reduction of tellurium. The resulting condensate is a dense fine-crystalline powder that can be easily separated from the condenser surface.
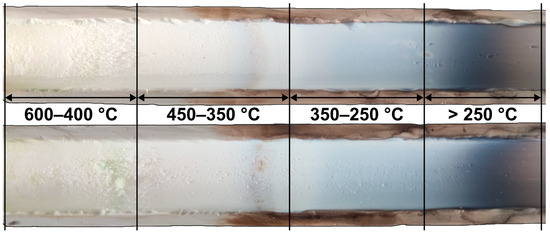
Figure 3.
Tellurium deposited on the condenser in oxide forms.
It was established that, during oxidative-distillation roasting, the condensate deposited in the “cold” part of the reactor at temperatures below 600 °C. Several distinct temperature deposition zones can be distinguished by the external appearance of the condensate. Samples were taken from each zone for analysis in order to determine the influence of deposition temperature on the phase composition of the condensate. The results are presented in Table 1 and Figure 4.

Table 1.
Phase composition of the condensate deposited in different temperature zones.
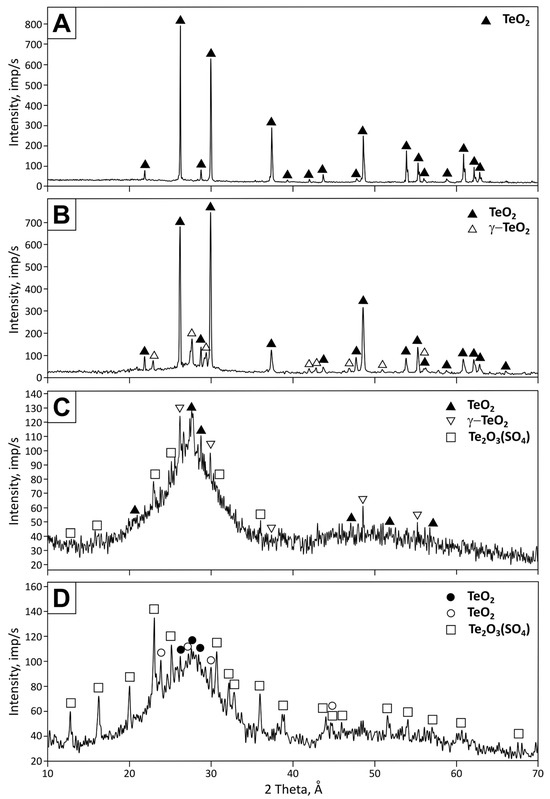
Figure 4.
X-ray diffraction patterns of the condensate deposited in low-temperature zones: (A) 600–450 °C, (B) 450–350 °C, (C) 350–250 °C, and (D) 250–100 °C.
As the data show, the co-deposition of tellurium oxide and tellurium oxysulfate is observed in the low-temperature condensation zones (100–350 °C). At the same time, the X-ray diffraction patterns show a pronounced amorphous halo. The condensate deposition corresponds to crystalline single-phase tellurium oxide in higher-temperature zones (350–600 °C). According to X-ray fluorescence analysis, the tellurium content in the condensate of all temperature zones is about 60 wt. %. At the same time, the sulfur content in the condensate increases as the condensation temperature decreases from 0.02 to 2.65 wt. %.
The presence of dittellurium trioxide sulfate is caused by the decomposition of copper hydroxy-sulfates present in the initial tellurium-containing middling. These compounds first lose molecular and crystallization water under thermal influence before decomposing into copper(II) oxide and sulfur dioxide [24] or sulfur trioxide [25]. Tellurium dioxide is readily oxidized to trioxide. Sulfur trioxide reacts with tellurium oxide, leading to the formation of dittellurium trioxide sulfate.
According to [26], dittellurium trioxide sulfate decomposes at atmospheric pressure at temperatures above 450 °C through the following reaction:
Te2O3(SO4)(s) → 2TeO2(s) + SO3(g)
Therefore, its formation in the solid material with subsequent evaporation is excluded. More likely, the compound forms directly in the vapor phase.
Given the decomposition temperatures, the presence of tellurium oxysulfate in the condensate will not cause technological difficulties during the carbothermal reduction of tellurium.
3.2. Choice of Reducing Agent
Graphite, coke, and charcoal are examples of carbon-containing reducing agents. When selecting a reducing agent, one important characteristic is the ash content, which determines the type of impurities contaminating the target product, as well as the amount of impurities. Thus, charcoal, depending on the type of wood, has a relatively low ash content (on average 0.5–3% [27,28,29,30]). Coke is characterized by an increased ash content of up to 15% [30,31,32]. Graphite has the best ash content values (up to 0.1%) [33,34,35]. However, its use is limited by its high cost, meaning its use must be economically justified. The more rational choice is charcoal, which is characterized by sufficiently low ash content and high reactivity due to its developed porous structure. An additional significant advantage of charcoal is its greater availability and much lower cost compared to graphite. Moreover, charcoal is a renewable resource, which makes its use environmentally sound.
3.3. Thermodynamic Justification of the Process
Using the program HSC Chemistry 5.11 (Outokumpu) [36], a thermodynamic analysis of the carbothermal reduction reactions of tellurium from tellurium dioxide was performed as a function of temperature and pressure. Initial data from the program’s standard database were used for the calculations.
Solid-phase reduction of tellurium can proceed via the main reactions listed in Table 2. According to the calculation of the isobaric–isothermal potential, all the reactions are thermodynamically possible over the entire selected temperature range already at atmospheric pressure. Performing the process in an air atmosphere may lead to partial oxidation of reduced tellurium by oxygen, resulting in the formation of tellurium dioxide, which would adversely affect process efficiency. Therefore, the reduction process must be performed in an oxygen-free atmosphere to minimize oxygen influence. There is a risk of excessive accumulation of gaseous reaction products when performing the process in a closed system at atmospheric pressure. In such an environment, the equipment must include a pressure control system to prevent exceeding critical values. A more rational solution is to conduct the process under low-pressure conditions. This approach lowers the process temperature and, consequently, reduces energy consumption, as well as facilitates the release of elemental tellurium into the condensate, minimizing the influence of components present in the reducing agent on the purity of the final product.
Table 2.
Change in Gibbs free energy of reaction as a function of temperature at atmospheric pressure.
The calculation of Gibbs free energy change at reduced pressure was performed according to the following expression:
where ΔGPT and ΔGT (kJ/mol) represent the Gibbs free energy change at reduced and atmospheric pressure, respectively; Δn represents the change in the number of moles in the gaseous phase during the reaction; R is the universal gas constant, kJ/mol·K; T is temperature, K; and P is residual pressure, atm.
ΔGPT = ΔGT + ΔnRTlnP,
Calculations were performed for temperatures of 300, 500, 700, and 900 °C at pressures of 50.66, 10.13, 5.06, 1.013, 0.506, and 0.1013 kPa. The results derived from our calculation of Gibbs free energy change as a function of pressure decrease are shown in Figure 5. As can be seen, with decreasing pressure, the probability of all the considered reactions forming elemental tellurium increases. The reactions involving tellurium evaporation are thermodynamically the most favorable across the entire range of considered pressures and temperatures.
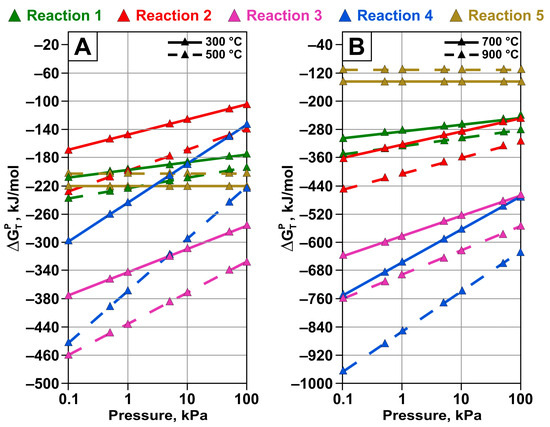
Figure 5.
Dependence of Gibbs free energy change for reactions of tellurium oxide interaction with carbon under pressure at temperatures of (A) 300 and 500 °C and (B) 700 and 900 °C.
In addition to determining the probability of the main reactions, an important step is analyzing the vapor pressure of elements and compounds capable of transitioning into the vapor-gas phase. Figure 6 shows the vapor pressure values of elemental tellurium and tellurium dioxide according to [37] and [38], respectively.
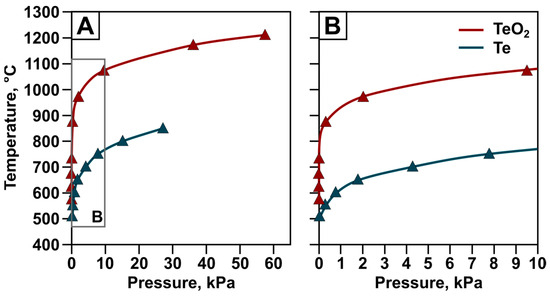
Figure 6.
Vapor pressure of tellurium and tellurium oxide under the pressure ranges of 0–60 kPa (A) and 0–10 kPa (B).
It can be seen that tellurium dioxide is less volatile than elemental tellurium. The saturated vapor pressure of TeO2 at its melting point of 1006 K (733 °C) is 0.026 kPa according to [38] and approximately 0.019 kPa according to [9]. At the same temperature, the saturated vapor pressure of elemental tellurium is about 6.5 kPa. This ratio of saturated vapor pressure values makes it possible to select conditions under which the reduced elemental tellurium will pass into the vapor-gas phase, while the initial tellurium oxide remains in the solid phase. This ensures high efficiency of the carbothermal reduction process of elemental tellurium from the tellurium-containing condensate.
3.4. Experimental Data and Modeling
The application of statistical experimental design methods makes it possible to significantly reduce the number of trials while obtaining reliable information about the effect of technological parameters on the process. In this study, we applied an experimental design based on the Taguchi orthogonal array L25, allowing for the investigation of four factors at five levels. This approach reduces the number of required experiments to 25 instead of, for example, 625 in a full factorial design. Table 3 presents the varied factors and their corresponding levels, while the experimental matrix and results are summarized in Table 4. The response variable was the tellurium recovery rate. Each experiment was performed in triplicate.
Table 3.
Factors and levels.
Table 4.
Conditions and results of experiments on optimizing the conditions for the efficient recovery of tellurium from tellurium dioxide (initial sample mass of TeO2: 2 g).
The signal-to-noise (SN) ratio was calculated for each experiment to determine the relative influence of the factors on tellurium recovery. Since the output characteristic was to be maximized, the “larger-is-better” criterion was applied for temperature (t), time (τ), and carbon content (C), while the “smaller-is-better” criterion was applied for pressure (P). The response plots as a function of temperature, pressure, duration, and carbon content are shown in Figure 7.
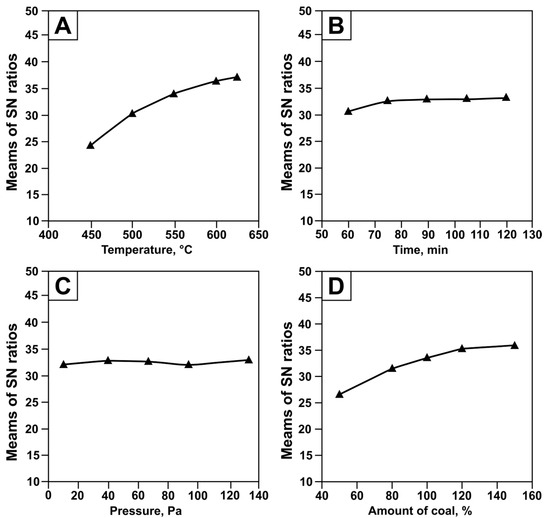
Figure 7.
Signal-to-noise (SN) ratio for tellurium recovery from tellurium-containing condensate as a function of temperature (A), time (B), pressure (C), and charcoal content (D).
It was established that the most significant factors determining the SN level were temperature and carbon content. As shown in Figure 7A, at lower temperatures (450–500 °C), the SN ratio increases most intensively, indicating that the process is highly sensitive to temperature variation. In the 500–550 °C range, the growth slows down, and at 600–625 °C, the curve levels off, marking the saturation zone. This temperature range is therefore optimal for maximizing the SN ratio. A similar effect was observed for the “carbon content” factor. The maximum SN value was achieved when adding 150% carbon relative to the tellurium oxide feed. Secondary factors were pressure and duration, which only exerted a minor influence within the studied ranges.
Thus, when optimizing process parameters, priority should be given to temperature (600–625 °C) and carbon content (130–150%), since they exert the strongest effect on the response. Pressure and duration may be varied within technologically convenient limits without noticeably affecting process performance.
Based on regression analysis of the experimental data, the following empirical model describing the dependence of tellurium recovery on the main parameters was obtained:
Y = −177.78 + 0.34T + 0.44C.
Figure 8 shows a three-dimensional surface plot constructed based on the obtained equation, illustrating the combined effect of temperature and the amount of charcoal in the charge, on tellurium recovery during its reduction from TeO2.
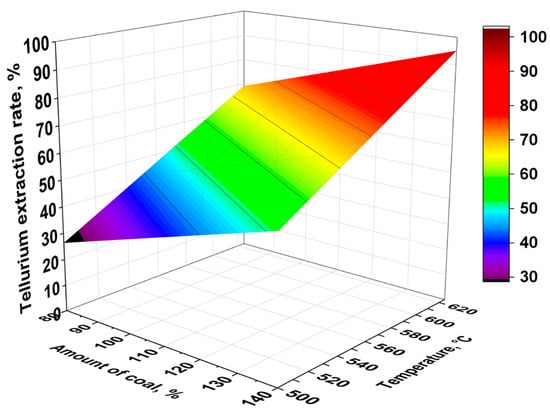
Figure 8.
Response surface plot of tellurium recovery as a function of temperature and charcoal amount.
Analysis of variance (ANOVA) showed that the model had high significance (F = 104.13, p = 6.05 × 10⁻¹²). The multiple correlation coefficient (R) was 0.95, indicating that the model had good agreement with the experimental data. The coefficient of determination R2 was 0.90, the adjusted R2 was 0.89, and the standard error was 9.14. These results confirm the reliability of the regression model. It should be noted that including pressure, durations, their squared terms, and interaction variables increased the correlation coefficients but reduced the overall statistical significance of the model. Moreover, when optimizing parameters, an unrealistic response of the model to pressure was observed: the recovery decreased with decreasing pressure. However, exclusion of pressure as a variable is not possible, since the process fundamentally depends on tellurium evaporation under reduced pressure.
Figure 9 presents the internally studentized residuals for the 25 experimental points. Analysis of the plot shows that the residuals are distributed irregularly, which indicates the random nature of experimental errors and the absence of systematic errors. It is important to note that their values fall within the range of −2 to 2, which suggests the absence of significant outliers or erroneous measurements. The absence of residual values beyond the critical range of −3 to 3 further confirms the correctness of the applied model and the adequacy of the approximation.
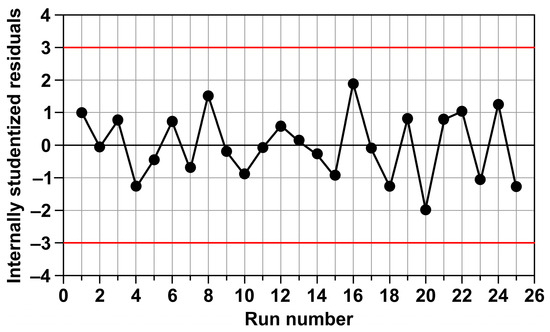
Figure 9.
The internally studentized residuals at different run numbers, ranging from 1 to 25.
Table 5 presents the results of the regression analysis, including regression coefficients (coeff), standard errors (std err), t-statistics (t stat), p-values, and 95% confidence intervals (lower and upper) for all factors included in the model.
Table 5.
Regression coefficients of the model and statistical significance indicators of factors.
As can be seen, temperature and the amount of carbon exert a statistically significant positive effect on the studied parameter (p < 0.05). Low standard errors and high t-statistics confirm the reliability of the estimates. Thus, the obtained model adequately describes the experimental data and can be used for a quantitative assessment of the contribution of the considered factors.
The experimental data (Table 4) were also processed using the least squares method, as a result of which approximating partial functions describing the influence of the studied parameters on the tellurium recovery rate were graphically fitted. The approximation curves are shown in Figure 10.
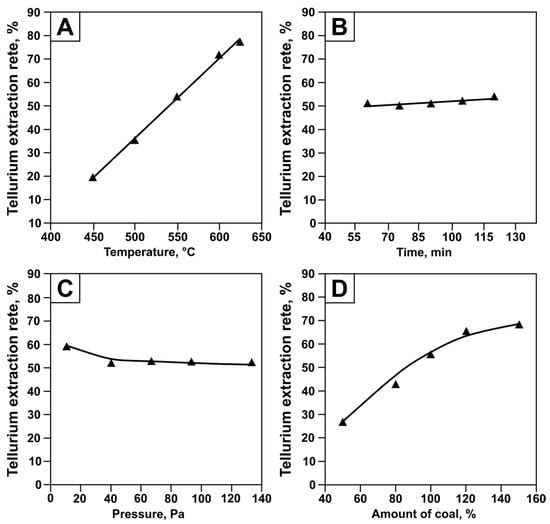
Figure 10.
Influence of temperature (A), time (B), pressure (C), and charcoal content (D) on tellurium recovery, with approximation curves. Symbols represent experimental data; lines represent calculated values.
As can be seen from Figure 10 and Table 6, the effects of temperature, process duration, and carbon consumption on tellurium recovery are adequately described by linear equations, while pressure is described by a cubic polynomial. The significance values of the correlation coefficient (tR) support the adequacy of the chosen dependencies. According to the methodology described in [39], the approximating equation is considered significant when tR > 2, calculated as follows:
where R is the nonlinear multiple correlation coefficient, N is the number of observed points, and K is the number of influencing factors.
Table 6.
Partial equations describing the influence of the main parameters on tellurium recovery during carbothermic reduction.
To describe statistical multifactorial dependencies, ref. [40] proposed the following formula:
where is the generalized function; is the partial function; is the product of all partial functions; and is the overall mean of all considered values of the generalized function, raised to the power of one less than the number of partial functions.
Applied to the studied process, the following equation was obtained:
It was found that the correlation coefficient of the obtained generalized equation is 0.97, and its significance, calculated using Equation (4), is 77.84, indicating its adequacy. The error of the equation, calculated by Formula (7), is 7.6 abs.%, which confirms the reliability of the model.
where N = 25 is the number of observed points, and K = 4 is the number of influencing factors. αexp—experimentally obtained value of the recovery degree; αcalc—recovery degree value calculated from the generalized equation.
The three-dimensional surface plots (Figure 11), constructed based on Equation (7), clearly illustrate the combined effects of temperature and pressure, as well as temperature and charcoal amount, on tellurium recovery.
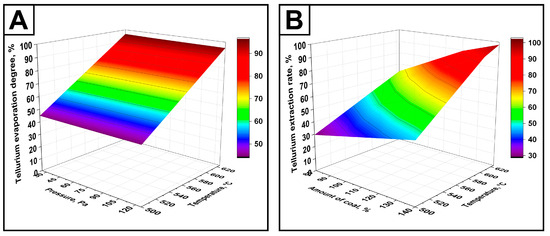
Figure 11.
Response surface plots of tellurium recovery as a function of temperature and pressure (A), as well as temperature and charcoal amount (B), under the following conditions: (A) duration—60 min, charcoal amount—130%; (B) duration—60 min, pressure—60 Pa.
3.5. Production of Elemental Tellurium and Its Characterization
Based on the obtained multifactor Equation (6) and the regression analysis model (4), the parameters for effective (over 90%) tellurium extraction were calculated, and experimental studies were conducted under these conditions. The results are presented in Table 7. As can be seen, the values calculated by the models are in good agreement with the experimental data, confirming their adequacy.
Table 7.
Process conditions for carbothermic reduction to achieve effective tellurium extraction from tellurium oxide.
The best results were obtained with a temperature of 625 °C, a pressure of 66.5 Pa, a processing time of 60 min, and with addition of 150% charcoal to the tellurium oxide sample. X-ray phase analysis (Figure 12) showed that the condensate obtained under these conditions exclusively contains the elemental tellurium phase corresponding to the reference PDF card 00-036-1452. According to the results of X-ray fluorescence analysis (Table 8), the content of impurities was minimal. The purity of the recovered tellurium was 99.5%.
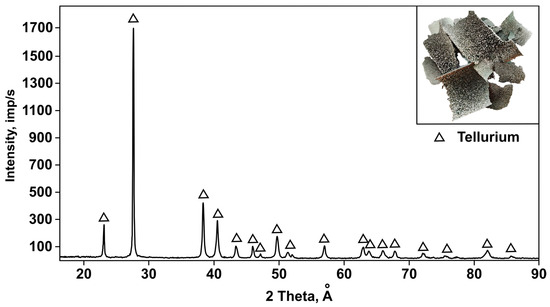
Figure 12.
X-ray diffraction pattern of the obtained elemental tellurium.
Table 8.
Elemental composition of the obtained elemental tellurium.
The obtained elemental tellurium appears as a silvery-colored fine-crystalline, dense layer deposited in the hot and middle zones of the condenser and reactor; a slight dark-gray coating is observed at the cold end of the condenser (Figure 13). The condensate easily separates into a layer from the condenser surface.
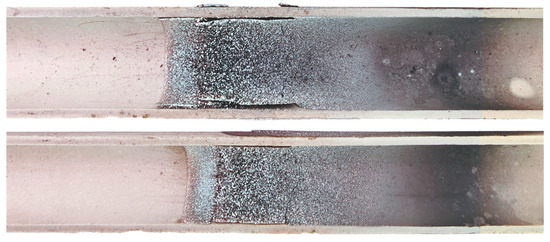
Figure 13.
Elemental tellurium deposited on the surface of the condenser.
An alternative to the proposed method could be the reduction of tellurium dioxide with hydrogen [41], which results in the complete reduction of tellurium from its oxide. However, this process is characterized by a high temperature (800 °C) and long duration (2 h). In addition, the use of hydrogen requires stringent safety measures in terms of both equipment and personnel, since it involves handling explosive materials.
4. Conclusions
This paper presents results derived from carbothermic reduction of tellurium from a tellurium-containing condensate obtained by the oxidative-distillation roasting of a tellurium-containing middling from Kazakhmys Smelting LLP (Republic of Kazakhstan). The phase composition features of the condensate obtained during oxidative-distillation roasting of a tellurium-containing intermediate product, as well as the details of its subsequent processing, have been presented for the first time. Based on the obtained data, the following conclusions can be made:
- The tellurium-containing condensate is deposited in four temperature zones during oxidative-distillation roasting. Phases of TeO2 and Te2O3(SO4) are present in the condensate deposited in low-temperature zones (100–350 °C). The condensate contains a single-phase TeO2 in higher-temperature zones (350–600 °C). In the carbothermic reduction process, the presence of Te2O3(SO4) does not cause technological difficulties since it decomposes to TeO2 and SO3 at the process temperatures.
- Thermodynamic analysis demonstrated the feasibility of tellurium reduction reactions from TeO2 with the formation of elemental tellurium in both solid and gas phases at temperatures above 300 °C. Decreasing the pressure increases the possibility of all considered reactions leading to elemental tellurium formation. The reactions involving tellurium evaporation are thermodynamically the most favorable across the entire range of considered pressures and temperatures.
- A regression model and a generalized equation were constructed using mathematical planning methods based on experimental data. This model and equation describe the dependence of tellurium recovery from tellurium-containing condensate on the main process parameters. The calculated errors of the dependencies were 7–9%.
- Parameters for effective tellurium extraction were calculated based on the obtained dependencies. Experimental studies performed under the calculated optimal conditions confirmed the adequacy of the proposed model. The observed tellurium recovery values corresponded to theoretical predictions and exceeded 95%, indicating the reliability of the mathematical planning method and its applicability for process optimization.
- At a temperature of 625 °C, pressure of 66.5 Pa, processing time of 60 min, and addition of 150% charcoal, the tellurium recovery from tellurium-containing condensate reached 98.74%. The condensate contained only the elemental tellurium phase, with no impurity compounds, indicating high selectivity of the process.
Thus, the comprehensive studies presented in [22,23] and in this paper demonstrate the feasibility of obtaining crude tellurium using a two-stage pyrometallurgical technology conducted under low pressure. In the first stage, the industrial tellurium-containing product undergoes oxidative-distillation roasting, yielding two products: a copper-containing residue and tellurium-containing condensate. The residue is an alloy of copper oxides and can be further processed to produce metallic copper. The tellurium-containing condensate, as shown in this study, can be processed by carbothermic reduction under low pressure. The obtained elemental tellurium exhibits a high degree of purity. If necessary, it can undergo further purification using techniques such as distillation, zone melting, or electrorefining. These approaches allow the product purity to reach levels required for applications in microelectronics, in optoelectronic devices, or as catalysts in high-tech processes.
Author Contributions
Conceptualization, A.N. and V.V.; methodology, A.N.; investigation, A.N., X.L. and S.T.; data curation, A.N., X.L. and N.B.; writing—original draft preparation, A.N., V.V., X.L., S.T. and N.B.; writing—review and editing, A.N., X.L., S.T., V.V. and N.B.; visualization, A.N., S.T. and X.L.; project administration, A.N. All authors have read and agreed to the published version of the manuscript.
Funding
This work was supported by the Science Committee of the Ministry of Science and Higher Education of the Republic of Kazakhstan (Grant AP19576910).
Data Availability Statement
The data pertaining to this study are available in the article.
Conflicts of Interest
The authors declare no conflicts of interest.
References
- Mahmoudi, A.; Shakibania, S.; Mokmeli, M.; Rashchi, F. Tellurium, from copper anode slime to high purity product: A review paper. Metall. Mater. Trans. B 2020, 51, 2555–2575. [Google Scholar] [CrossRef]
- Liu, G.; Wu, Y.; Tang, A.; Pan, D.; Li, B. Recovery of scattered and precious metals from copper anode slime by hydrometallurgy: A review. Hydrometallurgy 2020, 197, 105460. [Google Scholar] [CrossRef]
- Mastyugin, S.A.; Naboichenko, S.S. Processing of copper-electrolyte slimes: Evolution of technology. Russ. J. Non-Ferrous Met. 2012, 53, 367–374. [Google Scholar] [CrossRef]
- Xing, W.D.; Lee, M.S. Leaching of gold and silver from anode slime with a mixture of hydrochloric acid and oxidizing agents. Geosyst. Eng. 2017, 20, 216–223. [Google Scholar] [CrossRef]
- Xiao, L.; Wang, Y.L.; Yu, Y.; Fu, G.Y.; Han, P.W.; Sun, Z.H.I.; Ye, S.F. An environmentally friendly process to selectively recover silver from copper anode slime. J. Clean. Prod. 2018, 187, 708–716. [Google Scholar] [CrossRef]
- Ding, Y.; Zhang, S.; Liu, B.; Li, B. Integrated process for recycling copper anode slime from electronic waste smelting. J. Clean. Prod. 2017, 165, 48–56. [Google Scholar] [CrossRef]
- Kenzhaliyev, B.K.; Trebukhov, S.A.; Volodin, V.N.; Trebukhov, A.A.; Tuleutay, F.H. Selenium extraction out of metallurgical production middlings. Kompleks. Ispol. Miner. 2018, 307, 56–64. [Google Scholar] [CrossRef]
- Kenzhaliyev, B.K.; Trebukhov, S.A.; Nitsenko, A.V.; Burabayeva, N.M.; Trebukhov, A.A. Determination of technological parameters of selenium recovery from metallurgical production middlings in a vacuum distillation unit. Int. J. Mech. Prod. Eng. Res. Dev. 2019, 9, 87–98. [Google Scholar]
- Chizhikov, D.M.; Shchastlivyi, V.P. Tellurium and Tellurides; Collet’s Publishers Ltd.: London, UK, 1970. [Google Scholar]
- Hoffman, J.E. Recovering selenium and tellurium from copper refinery slimes. JOM 1989, 41, 33–38. [Google Scholar] [CrossRef]
- Mastyugin, S.A.; Volkova, N.A.; Naboichenko, S.S.; Lastochkina, M.A. Slime from Electrolytic Refining of Copper and Nickel; Ural Federal University: Ekaterinburg, Russia, 2013. [Google Scholar]
- Wang, S. Tellurium, its resourcefulness and recovery. JOM 2011, 63, 90–93. [Google Scholar] [CrossRef]
- Shibasaki, T.; Abe, K.; Takeuchi, H. Recovery of tellurium from decopperizing leach solution of copper refinery slimes by a fixed bed reactor. Hydrometallurgy 1992, 29, 399–412. [Google Scholar] [CrossRef]
- Nitsenko, A.V.; Burabaeva, N.M.; Tuleytay, F.K.; Seisembaev, R.S.; Linnik, X.A.; Azlan, M.N. Study of physical and chemical properties of tellurium–containing middlings. Kompleks. Ispol. Miner. 2020, 315, 49–56. [Google Scholar] [CrossRef]
- Xu, L.; Xiong, Y.; Song, Y.; Zhang, G.; Zhang, F.; Yang, Y.; Hua, Z.; Tian, Y.; You, J.; Zhao, Z. Recycling of copper telluride from copper anode slime processing: Toward efficient recovery of tellurium and copper. Hydrometallurgy 2020, 196, 105436. [Google Scholar] [CrossRef]
- Nitsenko, A.V.; Linnik, K.A.; Tuleutay, F.H.; Burabayeva, N.M.; Seisembayev, R.C. Physical and chemical characterization of tellurium–containing industrial product of Kazakhmys Smelting LLP. Theory Technol. Metall. Prod. 2021, 3, 10–16. [Google Scholar]
- Li, Z.; Qiu, F.; Tian, Q.; Yue, X.; Zhang, T. Production and recovery of tellurium from metallurgical intermediates and electronic waste—A comprehensive review. J. Clean. Prod. 2022, 366, 132796. [Google Scholar] [CrossRef]
- Ha, Y.-C.; Sohn, H.-J.; Jeong, G.-J.; Lee, C.K.; Rhee, K.-I. Electrowinning of tellurium from alkaline leach liquor of cemented Te. J. Appl. Electrochem. 2000, 30, 315–322. [Google Scholar] [CrossRef]
- Rhee, K.I.; Lee, C.K.; Ha, Y.C.; Jeong, G.J.; Kim, H.S.; Sohn, H.J. Tellurium recovery from cemented tellurium with minimum waste disposal. Hydrometallurgy 1999, 53, 189–201. [Google Scholar] [CrossRef]
- Shen, Y.; Xu, S.; Feng, W.; Yu, T.; Zhang, H.; Cao, H.; Zheng, G. An efficient hydrometallurgical process for extracting tellurium from copper telluride slag. Metall. Mater. Trans. B 2022, 53, 2838–2851. [Google Scholar] [CrossRef]
- Xu, L.; Yao, D.; He, J.; Zhang, X.; Xiong, Y.; Hua, Z.; Tian, Y.; Zhao, Z. An efficient process for recycling of copper telluride residue out of copper anode slime. J. Environ. Chem. Eng. 2022, 10, 107987. [Google Scholar] [CrossRef]
- Nitsenko, A.; Linnik, X.; Volodin, V.; Tuleutay, F.; Burabaeva, N.; Trebukhov, S.; Ruzakhunova, G. Phase transformations and tellurium recovery from technical copper telluride by oxidative-distillate roasting at 0.67 kPa. Metals 2022, 12, 1774. [Google Scholar] [CrossRef]
- Nitsenko, A.V.; Volodin, V.N.; Linnik, X.A.; Tuleutay, F.K.; Burabaeva, N.M. Distillation recovery of tellurium from copper telluride in oxide form. Russ. J. Non-Ferrous Met. 2022, 63, 284–291. [Google Scholar] [CrossRef]
- Koga, N.; Mako, A.; Kimizu, T.; Tanaka, Y. Thermal decomposition of synthetic antlerite prepared by microwave-assisted hydrothermal method. Thermochim. Acta 2008, 467, 11–19. [Google Scholar] [CrossRef]
- Güner, E.K.; Kancan, D.; Naktiyok, J.; Özer, A. Synthesis, characterization, and thermal decomposition kinetics of copper hydroxide sulfate (Cu4(SO4)(OH)6) synthesized by chemical precipitation method. Asia-Pac. J. Chem. Eng. 2020, 16, e2583. [Google Scholar] [CrossRef]
- Ahmed, M.A.K.; Fjellvåg, H.; Kjekshus, A. Synthesis, structure and thermal stability of tellurium oxides and oxide sulfate formed from reactions in refluxing sulfuric acid. J. Chem. Soc. Dalton Trans. 2000, 24, 4542–4549. [Google Scholar] [CrossRef]
- Khasraw, D.; Spooner, S.; Hage, H.; Meijer, K.; Li, Z. Devolatilisation characteristics of coal and biomass with respect to temperature and heating rate for HIsarna alternative ironmaking process. Fuel 2021, 284, 119101. [Google Scholar] [CrossRef]
- Wang, T.; Mirgaux, O.; Patisson, F. Cleaner steelmaking using biomass: A novel ironmaking process. Chem. Eng. Sci. 2026, 319, 122319. [Google Scholar] [CrossRef]
- Galvão, M.L.; Batista, A.S.; Nobre, J.R.C.; Balboni, B.M.; Santos, I.S.; Fernandes, M.E.B. Chemical, physical, and mechanical wood properties of Rhizophora mangle L., Avicennia germinans (L.) L., and Laguncularia racemosa (L.) C.F. Gaertn. on the Brazilian Amazon coast. Ann. For. Sci. 2025, 82, 13. [Google Scholar] [CrossRef]
- Han, Y.; Bernasowski, M.; Ślęzak, M.; Migas, P.; Mohanty, S.; Cheisson, T.; Tangstad, M. A Sustainable Way to Produce Mn-Sinter with Charcoal. J. Sustain. Metall. 2025, 11, 1922–1936. [Google Scholar] [CrossRef]
- Wang, L.; Li, Z.; Du, C.; Han, Y.; Yang, J. High-temperature graphitization of coke and lithium storage properties of coke-based graphite. Int. J. Coal Prep. Util. 2023, 44, 19–36. [Google Scholar] [CrossRef]
- Ning, X.; Liang, W.; Zhang, J.; Wang, G.; Li, Y.; Jiang, C. Effect of ash on coal structure and combustibility. Int. J. Miner. Metall. Mater. 2019, 26, 973–982. [Google Scholar] [CrossRef]
- Graphite Properties and Characteristics. Available online: https://poco.entegris.com/content/dam/poco/resources/reference-materials/brochures/brochure-graphite-properties-and-characteristics-11043.pdf (accessed on 17 August 2025).
- Jara, A.D.; Betemariam, A.; Woldetinsae, G.; Kim, J.Y. Purification, application and current market trend of natural graphite: A review. Int. J. Min. Sci. Technol. 2019, 29, 671–689. [Google Scholar] [CrossRef]
- Our Specialty Graphites for the Semiconductor Industry. Available online: https://www.sglcarbon.com/pdf/SGL-Brochure-Specialty-Graphites-for-the-Semiconductor-Industry-EN.pdf (accessed on 17 August 2025).
- Outotec Research Oy. HSC Chemistry for Windows, version 5.1; Outotec Research Oy: Pori, Finland, 2002. [Google Scholar]
- Nesmeyanov, A.N. Vapor Pressure of Chemical Elements; Akad. Nauk SSSR: Moscow, Russia, 1961. [Google Scholar]
- Chemistry and Technology of Rare and Scattered Elements, 2nd ed.; Bolshakov, K.A., Ed.; Higher School: Moscow, Russia, 1976; Volume 3. [Google Scholar]
- Malyshev, V.P. Mathematical Planning of Metallurgical and Chemical Experiments; Alma-Ata: Nauka, Russia, 1977. [Google Scholar]
- Protodyakonov, M.M.; Teder, R.I. Metdology of Rational Planning of Experiments; Nauka: Moscow, Russia, 1970. [Google Scholar]
- Chung, H.; Friedrich, S.; Qu, M.; Friedrich, B. Hydrogen reduction of tellurium oxide in a rotary kiln, initial approaches for a sustainable process. Crystals 2025, 15, 478. [Google Scholar] [CrossRef]
Disclaimer/Publisher’s Note: The statements, opinions and data contained in all publications are solely those of the individual author(s) and contributor(s) and not of MDPI and/or the editor(s). MDPI and/or the editor(s) disclaim responsibility for any injury to people or property resulting from any ideas, methods, instructions or products referred to in the content. |
© 2025 by the authors. Licensee MDPI, Basel, Switzerland. This article is an open access article distributed under the terms and conditions of the Creative Commons Attribution (CC BY) license (https://creativecommons.org/licenses/by/4.0/).