Article

Characteristics of Nanosecond Bipolar Pulsed Water Electrode Dielectric Barrier Discharge for Ozone Generation

1
Zhejiang Key Laboratory of Digital Precision Measurement Technology Research, Zhejiang Institute of Quality Sciences, Hangzhou 310018, China
2
School of Electrical Engineering & Telecommunications, University of New South Wales, Sydney, NSW 2052, Australia
3
College of Energy Environment and Safety Engineering, China Jiliang University, Hangzhou 310018, China
4
School of Resources & Environment, Nanchang University, Nanchang 330038, China
5
College of Energy Engineering, Zhejiang University, Hangzhou 310013, China
*
Author to whom correspondence should be addressed.
Processes 2025, 13(11), 3619; https://doi.org/10.3390/pr13113619 (registering DOI)
Submission received: 13 October 2025 / Revised: 3 November 2025 / Accepted: 5 November 2025 / Published: 8 November 2025

Abstract

This study investigates the ozone generation characteristics of a nanosecond bipolar pulse-excited single-water electrode (dielectric barrier discharge) DBD reactor, with a particular focus on the effects of pulse width (Tp) on discharge behavior, plasma parameters, and ozone generation efficiency. The results indicate that the bipolar pulse voltage displays a symmetric alternating waveform, and the reactor demonstrates excellent thermal stability. Rotation temperature (Trot) remains stable between 307 and 310 K (close to room temperature, which effectively suppresses O3 thermal decomposition), while vibrational temperature (Tvib) stabilizes at 3120 ± 50 K (sufficient to ensure the electron energy required for O2 dissociation). Electron excitation temperature (Texc) increases with both the specific input energy (SIE) and Tp. At SIE = 200 J/L, extending Tp from 200 ns to 1000 ns results in an increase in Texc from 2633 K to 2724 K. The ozone generation efficiency exhibits a “rise-then-decline” trend with increasing Tp. The optimal Tp is 500–600 ns, at which the maximum efficiency reaches 102 g/kWh (corresponding to SIE = 35.95 J/L), which is slightly higher than the peak efficiency of the unipolar pulse-driven water electrode reactor (99.64 ± 0.87 g/kWh, corresponding to SIE = 33.60 ± 1.53 J/L). This work innovatively applies nanosecond bipolar pulse excitation to a single-water electrode DBD reactor for ozone generation, an understudied configuration that integrates the discharge stability advantage of bipolar pulses and the superior cooling advantages of water electrodes. This study offers significant insights into the pulse power excitation of ozone generation.

1. Introduction

Ozone (O3) is a potent oxidizing agent with a standard oxidation potential of 2.07 V, ranking just below fluorine. Its formidable oxidative capabilities render it indispensable across a wide range of applications, including water treatment, air purification, exhaust gas control, and food processing [1,2]. However, its inherent instability restricts its storage and transport, necessitating the development of highly efficient on-site ozone generation technologies [3].
Among the various ozone generation techniques, DBD stands out as an ideal method due to its exceptional efficiency and energy-saving properties. DBD technology operates by exciting gas molecules with a high-voltage electric field to generate non-thermal plasma, which efficiently dissociates oxygen molecules, thereby producing ozone. In comparison to traditional electrolysis [4] and ultraviolet methods [5], DBD offers distinct advantages, particularly in terms of energy efficiency and system stability. In recent years, nanosecond-pulse DBD has gained prominence as an emerging ozone generation technology, attracting significant research attention for its ability to generate ozone efficiently while minimizing thermal effects [6].
Bipolar pulse power supplies, as a relatively novel discharge excitation technique, have shown notable advantages in DBD systems. Researchers have undertaken studies on bipolar pulse DBD ozone generation. Jiang et al. [7] employed a bipolar nanosecond pulse-driven cylindrical electrode DBD reactor with a 15 ns rise-time, utilizing an instantaneous high electric field to excite electron avalanches that synchronize, achieving uniform discharge in atmospheric pressure air. Spectral diagnostics indicated that the system’s rotational temperature is approximately 330 K (close to room temperature, which helps suppress ozone thermal decomposition), while the Tvib is 2600 K (ensuring the necessary electron energy for O2 dissociation), thus providing an optimal plasma environment for efficient ozone generation. Yuan et al. [8] compared bipolar and unipolar pulse DBDs and discovered that the bipolar pulse, owing to the electric field superposition effect caused by charge accumulation during the discharge cycle, can lower the gas breakdown voltage and achieve higher ozone concentrations at a constant peak voltage. Kim et al. [9] investigated the discharge characteristics and ozone generation performance of DBD driven by a high-repetition-rate bipolar pulse power supply under different electrical conditions in atmospheric-pressure air. Furthermore, the discharge uniformity and ozone performance of the bipolar pulse are also governed by the pulse repetition frequency (which enhances the energetic electron density and promotes O2 dissociation) and the diameter of the dielectric tube (larger diameters reduce the electric field and degrade uniformity) [7,8].
Despite existing studies on the use of bipolar pulse power supplies in DBD systems, research on employing them to excite a single-water electrode reactor for ozone generation remains limited. This paper introduces an innovative approach: utilizing a bipolar pulse power supply to excite a single-water electrode reactor for ozone generation. Unlike conventional parallel-plate reactors, such as those used by Jiang et al. [7], which rely on solid dielectrics and suffer from high Trot (up to 390 K), the single-water electrode reactor exhibits higher cooling efficiency and electrode durability, which could lead to a substantial improvement in discharge stability and ozone generation efficiency [10]. This study presents an innovative approach by utilizing a bipolar pulse power supply to excite a single-water electrode reactor for ozone generation and investigates the potential of this novel configuration to enhance ozone generation efficiency. The aim of this paper is to examine the ozone generation characteristics of the bipolar pulse power supply single-water electrode DBD reactor, with a focus on the influence of pulse width parameters on ozone generation efficiency. By studying these pulse parameters, this research seeks to offer theoretical insights for optimizing the DBD system driven by bipolar pulse power supplies, aiming to enhance the efficiency and sustainability of ozone generation.

2. Experimental Setup

The experimental setup, illustrated in Figure 1, mainly consists of the gas supply system, DBD plasma generation subsystem, exhaust gas detection system, and optical emission spectroscopy analysis system.
Since the single-water electrode reactor had already demonstrated excellent temperature behavior and ozone generation performance in our previous studies [11,12], we chose to reuse this reactor configuration to further expand its research scope. This reactor was specially designed and fabricated by Nanjing Suman Plasma Technology Co., Ltd. (Nanjing, China) Unlike conventional metal-electrode dielectric barrier discharge (DBD) reactors, it features a key modification: replacing the traditional metal grounded electrode with flowing water. The grounded water electrode and the discharge gas are separated by a layer of quartz glass that serves as the dielectric layer, and the external tubular structure is also composed of quartz glass. Its specific structural design has been detailed in [10].
The reactor is linked to a circulating water system (LX-150 model, Beijing Changliu Scientific Instrument Co., Ltd., Beijing, China) to ensure the water-cooled chamber operates at a stable temperature of 20 ± 1 °C. This temperature control strategy effectively stabilizes the discharge conditions, ensuring consistent ozone production.
The experiment utilizes an external compressed gas cylinder supply system to deliver high-purity (≥99.99%) oxygen and nitrogen (79% N2 + 21% O2) as simulated synthetic air to the reactor. The gas flow is meticulously regulated using a mass flow controller (Alicat kM7100 model, Alicat Scientific, Tucson, AZ, USA, 0–5 L/min), ensuring a constant total flow rate of 2 SLPM (standard liters per minute) throughout the duration of the experiment. The calibration has an uncertainty of ±1.0%. The LOQ for flow measurement is 0.1 L/min, which corresponds to the lowest stable flow rate that can be controlled by the device, and the LOD is 0.05 L/min, which is the smallest measurable change in flow rate given the instrument’s resolution and accuracy. The mixed gas flows into the DBD reaction zone from the bottom of the gas chamber, with an upstream flow regulator installed to improve the uniformity of the flow within the reactor.
This study utilizes a parametric high-voltage pulse power supply (HVP—10B/PLC, Xi’an Lingfengyuan Electronic Technology, Xi’an, China) as the excitation source. This power supply supports a 220 V/50 Hz AC input and provides an adjustable output peak voltage ranging from 0 to ±10 kV, capable of delivering positive, negative, or alternating square wave pulses. Regarding pulse timing characteristics, the pulse width can be adjusted flexibly between 100 ns and 1 ms, with a step size of 10 ns, and the maximum duty cycle can reach 75%. The rise times of both the positive and negative pulses can be independently adjusted within the range of 50 ns to 200 ns, with a step size of 10 ns. The maximum pulse repetition frequency of this power supply can reach up to 10 kHz. This power supply has been optimized for capacitive loads ranging from 0 to 50 pF and exhibits a certain degree of load adaptability, ensuring stable operation at higher capacitive loads through waveform fine-tuning. The output bipolar pulse waveform is depicted in Figure 2.
During this experiment, a Tektronix MDO3054C oscilloscope (Tektronix, Beaverton, OR, USA, featuring a maximum frequency fmax of 500 MHz and a sampling rate of 5 Gs/s) is used in conjunction with a Tektronix P6015A high-voltage differential probe (Tektronix, Beaverton, OR, USA, fmax = 75 MHz, 1000× attenuation ratio) and a current transformer (Pearson 2877, Pearson Electronics, Camarillo, CA, USA) to measure electrical parameters. This configuration allows for real-time monitoring and recording of the applied voltage and discharge current throughout the entire plasma generation process.
The concentration of high-concentration ozone gas generated is measured using an ozone analyzer (OSTI BMT964, OSTI GmbH, Berlin, Germany) that employs non-dispersive ultraviolet (UV) absorption technology. The analyzer is calibrated using a traceable ozone calibration gas mixture (typically generated by gravimetric or flow dilution methods) and periodically verified using a zero gas to check for drift. The LOQ (Limit of Quantification) for this analyzer is 0.01 g/Nm3, which is the lowest concentration reliably quantifiable, and the LOD (Limit of Detection) is 0.005 g/Nm3, based on the sensitivity of the UV absorption at the relevant wavelength (254 nm).
Optical Emission Spectroscopy (OES), a key diagnostic technique for probing the energy states and chemical reaction pathways of non-thermal plasmas, is utilized in this study through the integrated diagnostic system from Princeton Instruments. The system is composed of a SpectraPro HRS-750 fiber optic spectrometer (LG-455-020-3, FREDOR Scientific Instrument Co., Ltd, Beijing, China) and a Pi-Max4:1024i enhanced charge-coupled device (ICCD) camera (Princeton Instruments, Trenton, NJ, USA), with its hardware configuration and functionality specifically optimized for the characteristics of nanosecond pulse DBD under atmospheric pressure. This system enables the precise capture of plasma characteristic spectral lines in the discharge region, such as the second positive band system of nitrogen molecules (N2(SPS, C3Πu → B3Πg)) and the first negative band system of nitrogen ions (N2+(FNS, B2Σu+ → X2Σg+)). The system is configured with a 750 mm focal length, a 300 nm blaze wavelength, a 2400 lines/mm diffraction grating, a 30 μm slit width, and a 2 ms gate width. The OES system is calibrated with emission standards (such as a calibration light source with known spectral lines) to ensure accurate spectral measurements. The LOQ for OES intensity is 0.01 a.u., and the LOD is 0.005 a.u., based on the system’s sensitivity to weak emission lines and the signal-to-noise ratio in the recorded spectra.
For the single-water electrode DBD reactor (Customized, SuMan Plasma Technology Co., Ltd., Nanjing, China) used in this study, the calculation of the system’s average discharge power (P, W) involves both the pulse repetition frequency (f, Hz) and single-pulse energy (EP, J). The energy consumption within a single pulse cycle (i.e., single-pulse energy, EP) is determined by integrating the instantaneous discharge power over the effective duration of the pulse. Instantaneous discharge power is defined as the product of discharge voltage U(t) and discharge current I(t) at any given time t, with the integration interval extending over the entire single pulse duration τ (s). The system’s average discharge power is calculated as shown in Equation (1) [13,14].
P = f × E P = f × 0 τ U ( t ) · I ( t ) d t
Here, U(t) represents the instantaneous discharge voltage (V) at time t, and I(t) represent the instantaneous discharge current (A) at time t. The value of τ must correspond to the effective pulse width output by the pulse power supply to prevent energy calculation errors due to integration interval discrepancies.
SIE represents the electrical energy consumed per unit volume of gas and is a key parameter for characterizing the reactor’s energy density. This parameter directly indicates the energy transfer efficiency between the discharge plasma and gas molecules, making it critical for optimizing reactor performance. The calculation method for the SIE characteristics and ozone synthesis efficiency is presented in the following equation [10]:
S I E = 60 × P Q  
[ O z o n e   g e n e r a t i o n   e f f i c i e n c y ] = 60 × C Q P
Here, Q represents the total gas flow (SLPM, standard liters per minute) and C represents the ozone concentration (g/Nm3). During the experiment, the gas flow Q is regulated using a mass flow controller (MFC, Alicat Scientific, Tucson, AZ, USA), and the discharge parameters are simultaneously collected using a high-voltage probe (Tektronix P6015A, Tektronix, Beaverton, OR, USA) and a current transformer (Pearson 2877, Pearson Electronics, Camarillo, CA, USA).

3. Result and Discussion

3.1. Electrical Characteristics

Figure 3 illustrates the typical discharge voltage, current, and single-pulse energy waveforms for the bipolar nanosecond pulse-driven single-water electrode DBD system. As shown in Figure 3, the voltage waveform alternates symmetrically in a bipolar manner, with the amplitudes and durations of the positive and negative half-waves being consistent. The current waveform exhibits significant changes with pulse width (Tp): as Tp increases from 200 ns to 500 ns, the total current oscillation time lengthens, with the amplitude of the first half (positive pulse phase) increasing, and the amplitude of the second half (negative pulse phase) slightly decreasing. The single-pulse energy increases from 3.5 mJ to 5.9 mJ; at Tp = 600 ns, the current oscillation amplitude decreases sharply after the rising edge, and the single-pulse energy concurrently decreases slightly.
Bipolar pulse power supplies present distinct advantages in water electrode DBD reactors. The voltage alternates periodically between the positive and negative half-cycles, efficiently neutralizing or eliminating the residual charges accumulated on the dielectric surface from prior discharges, which enhances the discharge process’s stability in the time domain and uniformity in the spatial domain [7]. The nanosecond-scale short rise time of the pulse power supply and trapezoidal-like voltage output effectively minimize energy losses during discharge, further enhancing the reactor’s efficiency, reducing harmonic distortion in the output voltage [15], and ensuring the high quality of the power supply output. The DBD driven by the bipolar power supply surpasses the unipolar DBD in peak discharge current, single discharge–charge transfer, and energy consumption per unit time, all while achieving the same effect [16].
The image features in Figure 4 clearly show the effect of peak voltage on discharge morphology: when Vp = 8.5 kV, the discharge luminous area is mainly concentrated at the upper and side edges of the reactor, with only a few discrete filamentary discharge channels in the central gap. The luminous intensity is weak and unevenly distributed. As peak voltage (Vp) increases to 9.0 kV, the discharge morphology exhibits a clear trend of “diffusion,” with the edge discharge regions extending toward the center. The discharge frequency and luminous intensity in the central gap increase significantly, and the density of filamentary discharge channels increases and becomes denser. This pattern aligns with the findings of Li et al. [17], who used ICCD imaging to confirm that increasing voltage strengthens the electric field and enhances the electron avalanche process, leading to a significant increase in the density of filamentary discharge channels, ultimately resulting in a more uniform discharge pattern. When Vp = 10 kV, the discharge intensity further increases, and the high-intensity discharge channels in the upper region almost form a continuous bright line. The overall discharge morphology approaches a “diffuse discharge” characteristic, with only a minimal amount of discrete filamentary structures remaining locally. This mode transition aligns with the “electron avalanche merging mechanism” proposed by Wang et al. [18]: when the electric field strength reaches a critical value, the electron avalanche regions of adjacent filamentary discharges merge, forming a continuous luminous region, thereby giving the discharge a diffuse characteristic. This figure presents a time-sequenced image averaging of the results obtained in a single shot, showing the distribution and intensity of the discharge phenomena. At 8.5 kV, the discharge is concentrated in the upper and side regions of the reactor, with only a few filamentary discharges in the middle gap. At 9.0 kV, the discharge becomes more diffuse, with an increase in both the frequency and intensity of discharges in the central gap. When the peak voltage reaches 10 kV, the discharge intensity further increases, with the high-intensity discharge at the top almost forming a continuous line, approaching a diffuse discharge pattern. Research has shown that an increase in peak voltage results in a higher E/N ratio (where E is the electric field and N is the number density) and an increase in the average electron energy of the discharge, which in turn increases the electron diffusion constant (De), making the discharge more uniform [19].

3.2. The Optical Emission Spectroscopy and Gas Temperature

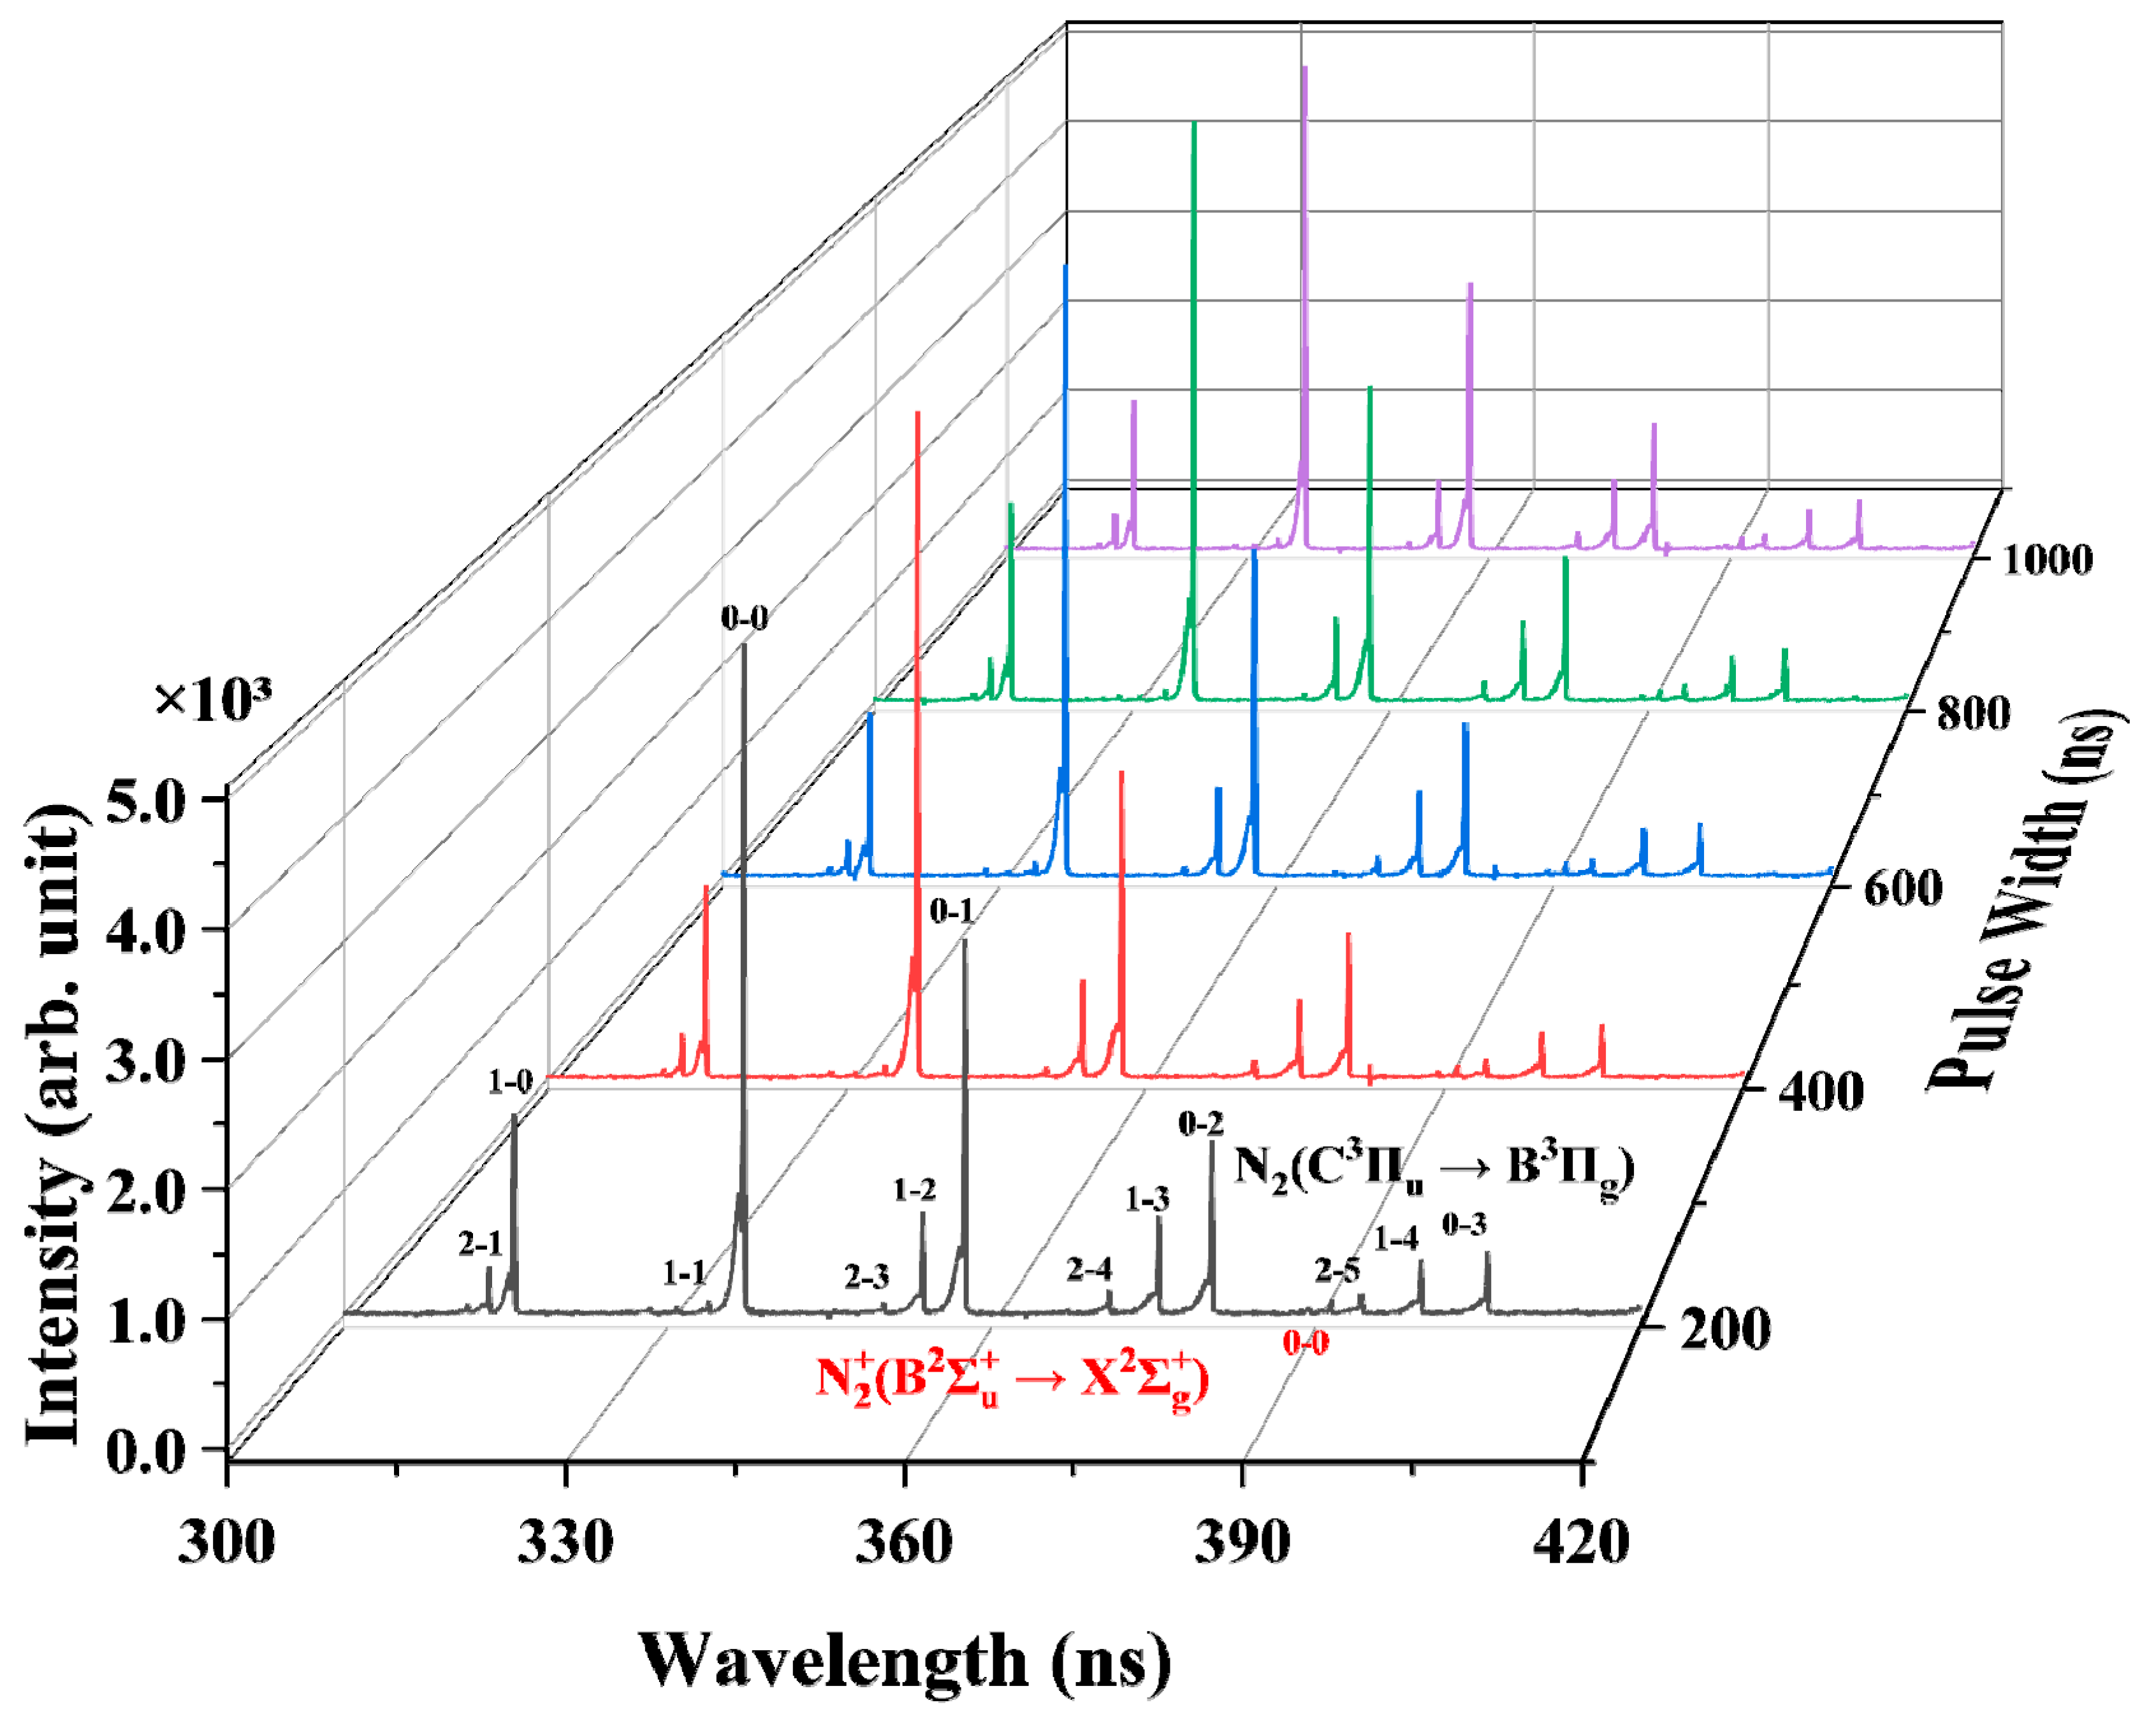
Figure 5 shows the optical emission spectra (OES) of the bipolar nanosecond pulse-excited single-water electrode surface DBD. The main components of the spectrum are the second positive system (SPS) and the first negative system (FNS). The experimental results indicate that as the pulse width increases, the overall emission intensity of the plasma reaction zone rises. According to Bílek et al. [16], the ratios of FNS (0, 0)/SPS (0, 2), FNS (0, 0)/SPS (1, 4), and FNS (0, 0)/SPS (2, 5) can effectively reflect the reduced electric field intensity (E/N) within a specific pressure range. E/N, being a key parameter for assessing the average electron energy, directly affects the dispersion and mode of the discharge. Within the experimental parameter range in this study (as shown in Figure 5), these three key ratios did not show significant fluctuations with changes in pulse width. This phenomenon suggests that within the examined experimental conditions, the effect of pulse width on the reduced electric field intensity is minimal, and therefore, its impact on the dispersion characteristics of the discharge is also relatively small.
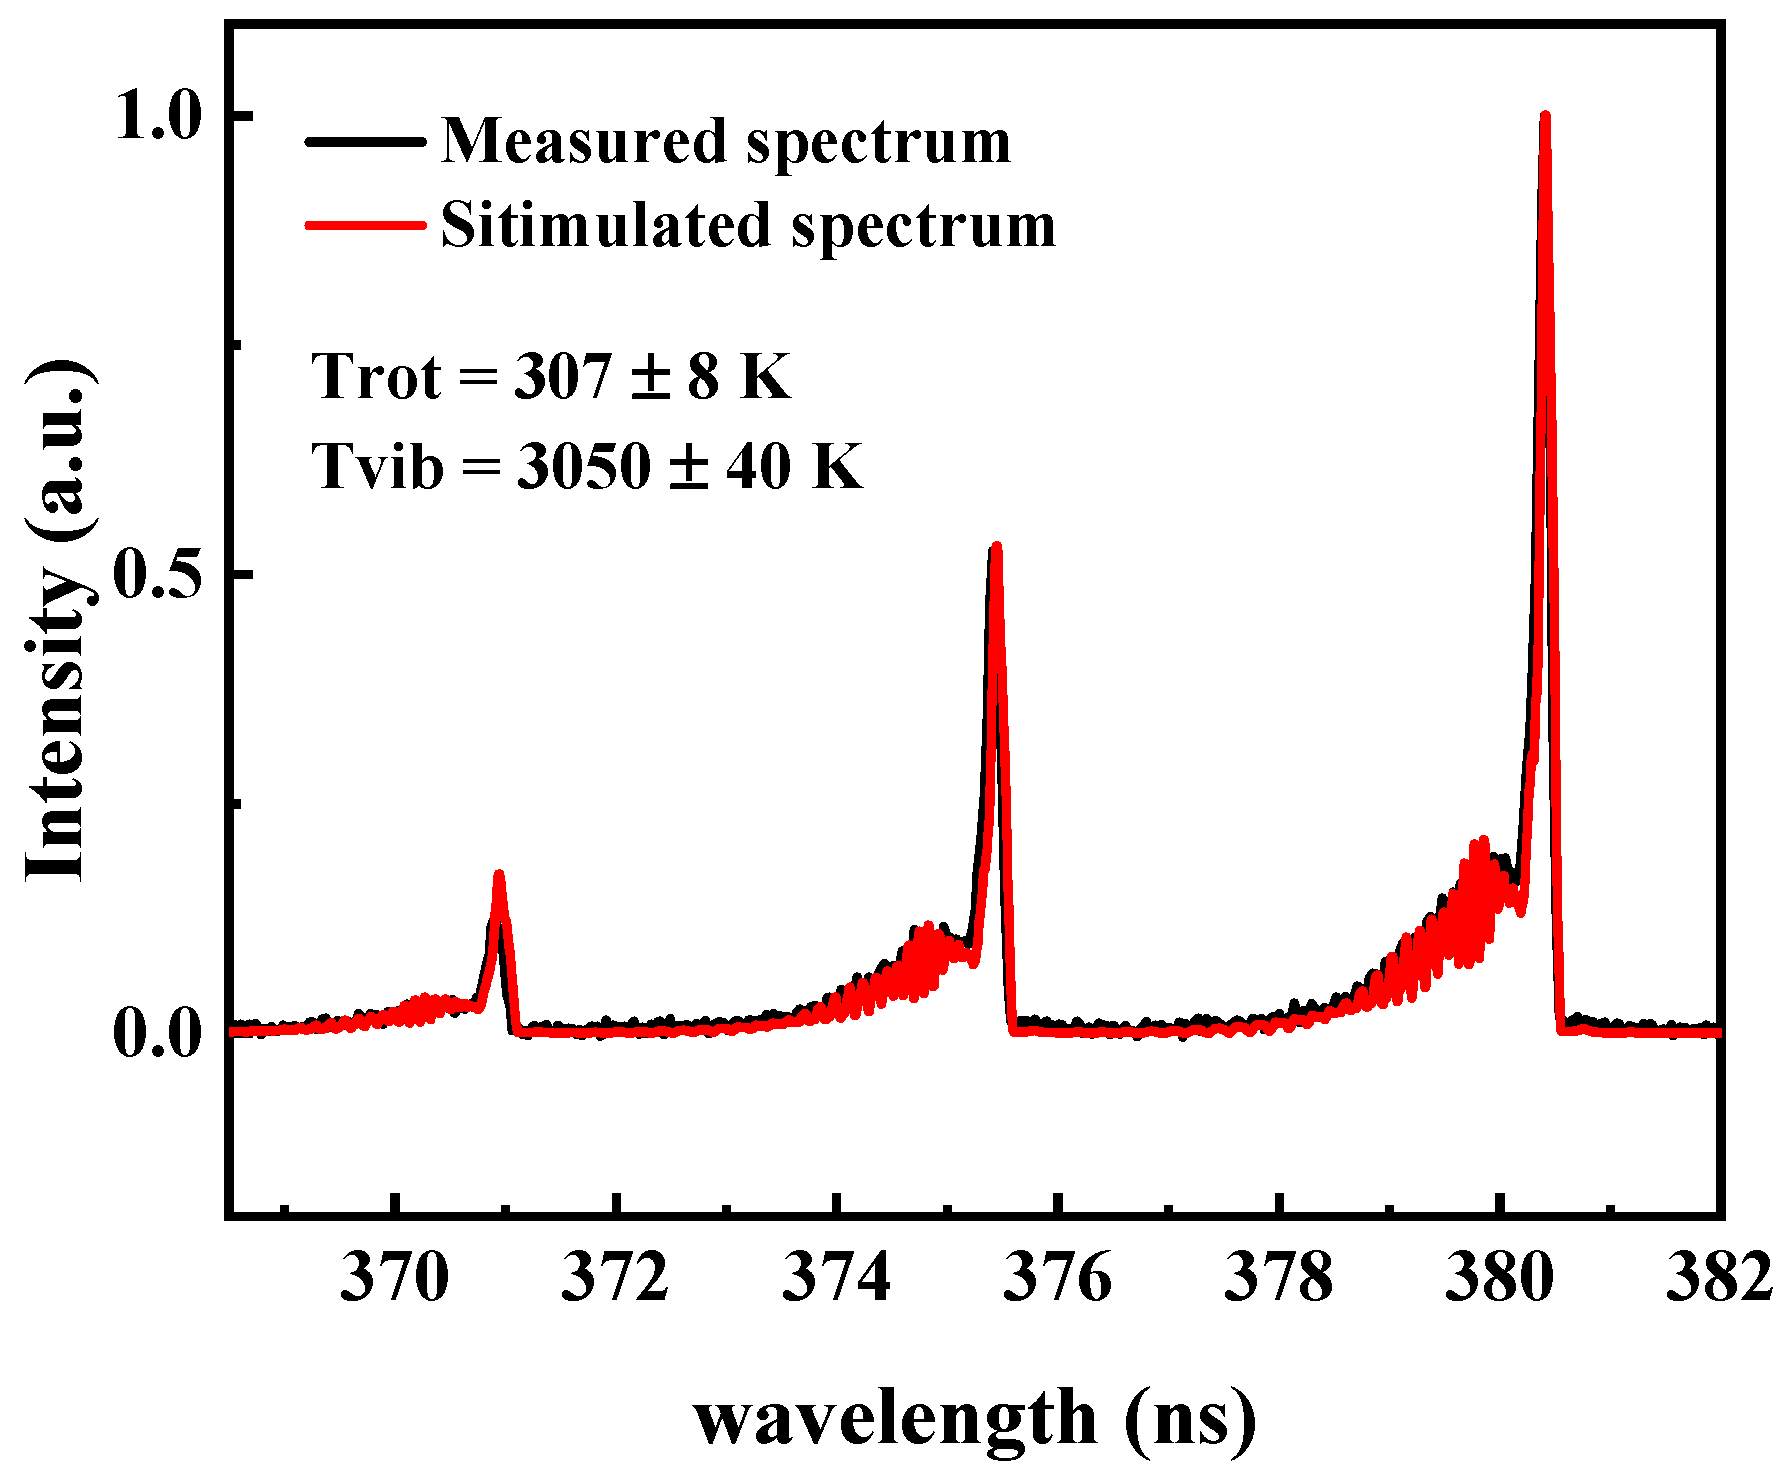
The influence of gas temperature is especially crucial in the ozone generation process, a fact particularly evident in the micro-discharge region. This region serves as the core site for ozone synthesis while simultaneously facilitating the occurrence of ozone decomposition reactions [20,21]. Fluctuations in gas temperature thus play a pivotal role in the overall kinetic process of the reaction, directly influencing the rate and efficiency of ozone generation. Typically, the energy level distribution of gas molecules is described using two key parameters: Trot and Tvib. In practical use scenarios, Trot is frequently used to assess the gas temperature within the micro-discharge channel [22,23]. This study employs emission spectroscopy to measure both rotational and Tvib. Figure 6 presents the fitting results between the experimental emission spectrum and the SPECAIR 2.2 simulation spectrum. The experimental results indicate that, under conditions of Vp = 5.5 kV, f = 2 kHz, Tp = 400 ns, and Tris = 50 ns, the Trot is 307 ± 5 K, and the Tvib is 3120 ± 50 K. As the pulse width increases, the gas temperature exhibits a slight rise. When the pulse width increases from 200 ns to 1000 ns, Trot increases from 307 K to 310 K. This change suggests that a longer pulse width contributes to a slight increase in rotational temperature. Compared to the single-pulse power supply driving a single-water electrode [11], the slight temperature rise further demonstrates that the pulse power supply, combined with the water-cooling system, effectively controls the temperature, preventing excessively high temperatures from negatively impacting ozone synthesis efficiency.

3.3. The Electron Excitation Temperature

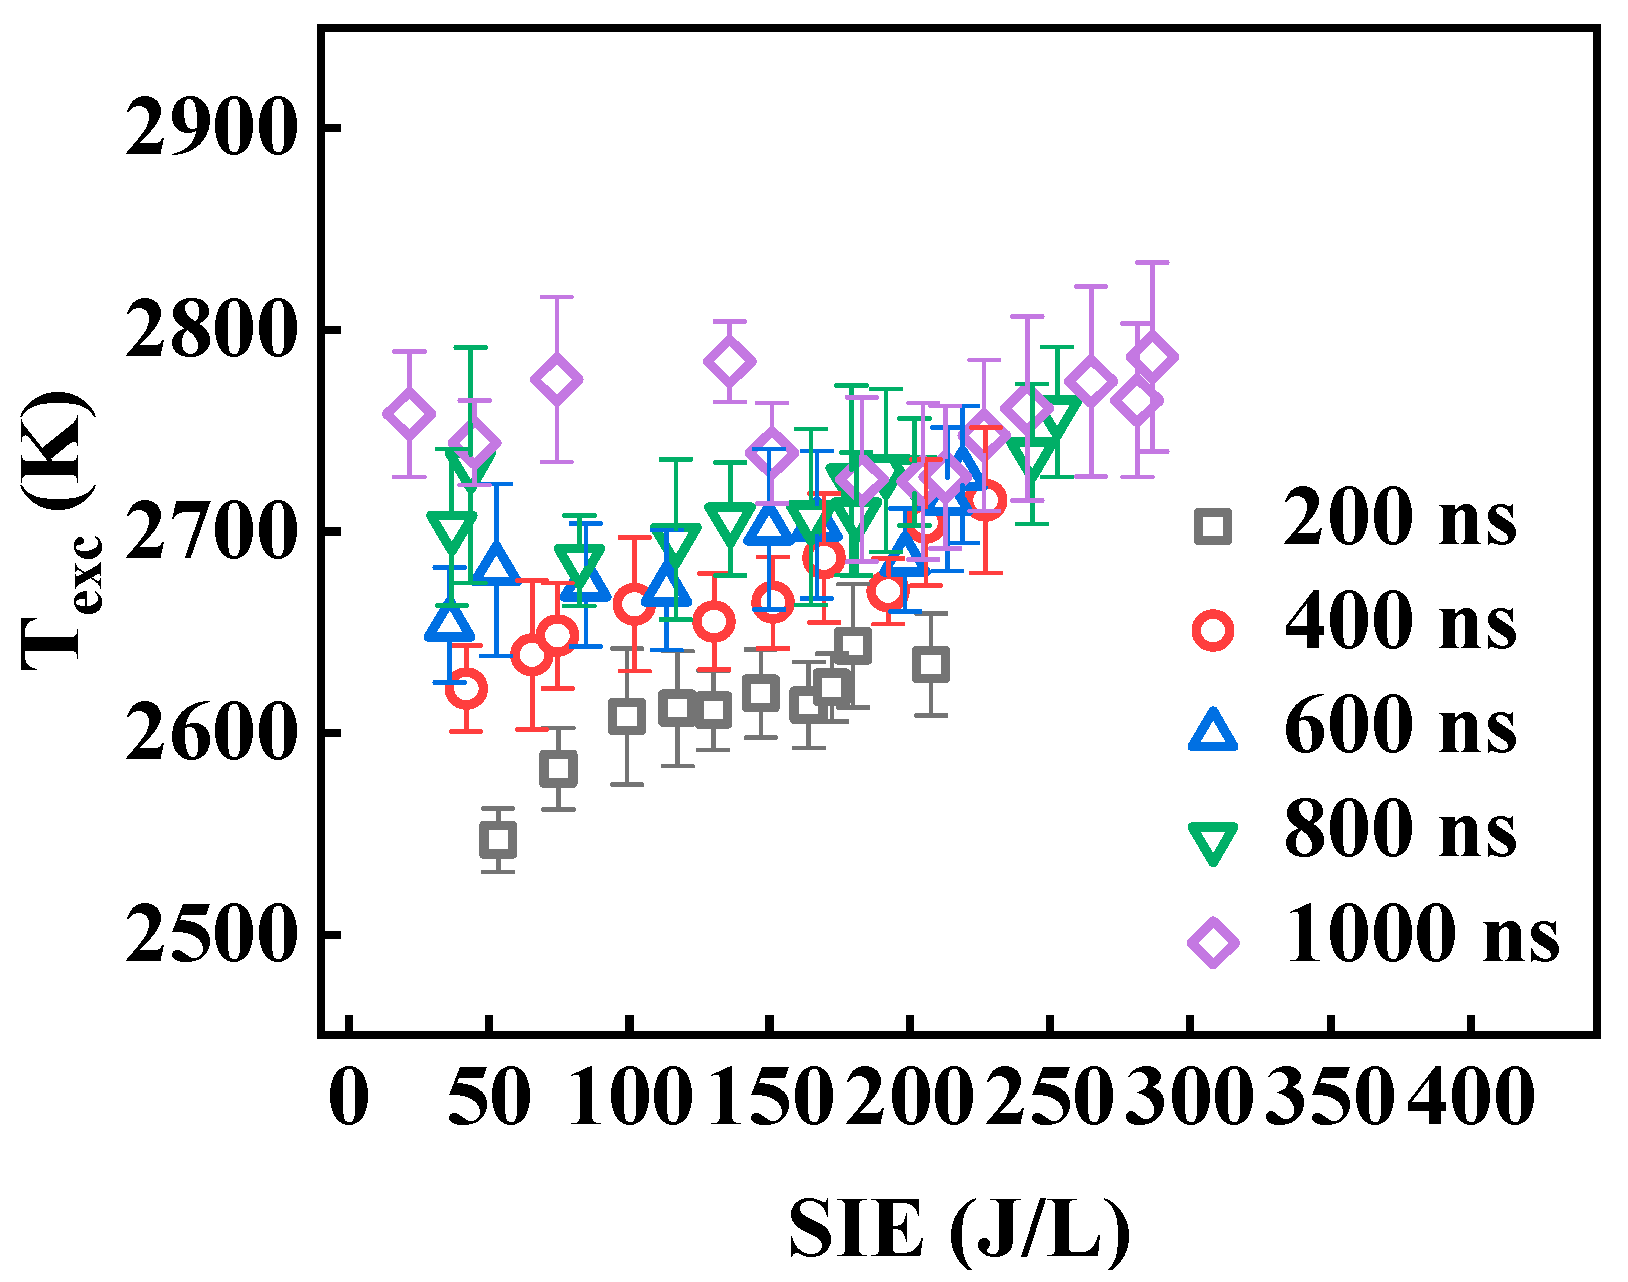
The Texc, a critical parameter representing the energy state of plasma electrons, directly correlates with the efficiency of energy exchange between electrons and gas molecules during discharge, which plays an essential role in understanding the plasma chemical mechanisms underlying ozone generation [24]. Notably, electronic excitation temperature is gas-specific—different gases correspond to distinct electronic excitation temperatures due to variations in their atomic/molecular energy levels and excitation characteristics. The Texc discussed in this study refers exclusively to the electronic excitation temperature of argon (Texc, Ar). In this study, argon gas, which has stable chemical properties and well-defined spectral response characteristics, was introduced into the simulated synthetic air. The characteristic spectral line intensities of argon at 763.498 nm and 772.411 nm were measured using an optical fiber spectrometer (LG-455-020-3, FREDOR Scientific Instrument Co., Ltd, Beijing, China). By applying a model that correlates spectral line intensity with temperature, Texc was quantitatively measured, and the results are presented in Figure 7. Figure 7 clearly illustrates the evolution of Texc with SIE across different pulse widths (Tp, ranging from 200 ns to 1000 ns). Overall, Texc exhibits a significant increase with the rise in SIE, as an increase in SIE results in more energy being transferred to the gas volume, accelerating the electrons and, in turn, raising the electron excitation levels. As the Tp increases, Texc shows a clear upward trend. At an SIE of 200 J/L, as the Tp rises from 200 ns to 1000 ns, the Texc increases from 2633 K to 2724 K.

3.4. The Ozone Production

Figure 8 illustrates the relationship between SIE and Vp, along with the typical energy deposition characteristics in the bipolar nanosecond pulse-driven single-water electrode DBD reactor. From the SIE variation curves with different pulse widths in Figure 8, it is evident that SIE is positively correlated with both Vp and Tp, but the growth trend exhibits significant dependence on pulse width. As Vp increases from 8 kV to 12 kV, the SIE increases continuously at all pulse widths. When Vp is 9 kV, SIE rises from 74.7 J/L at Tp = 200 ns to 150.87 J/L at Tp = 1000 ns. This phenomenon is in agreement with [11].
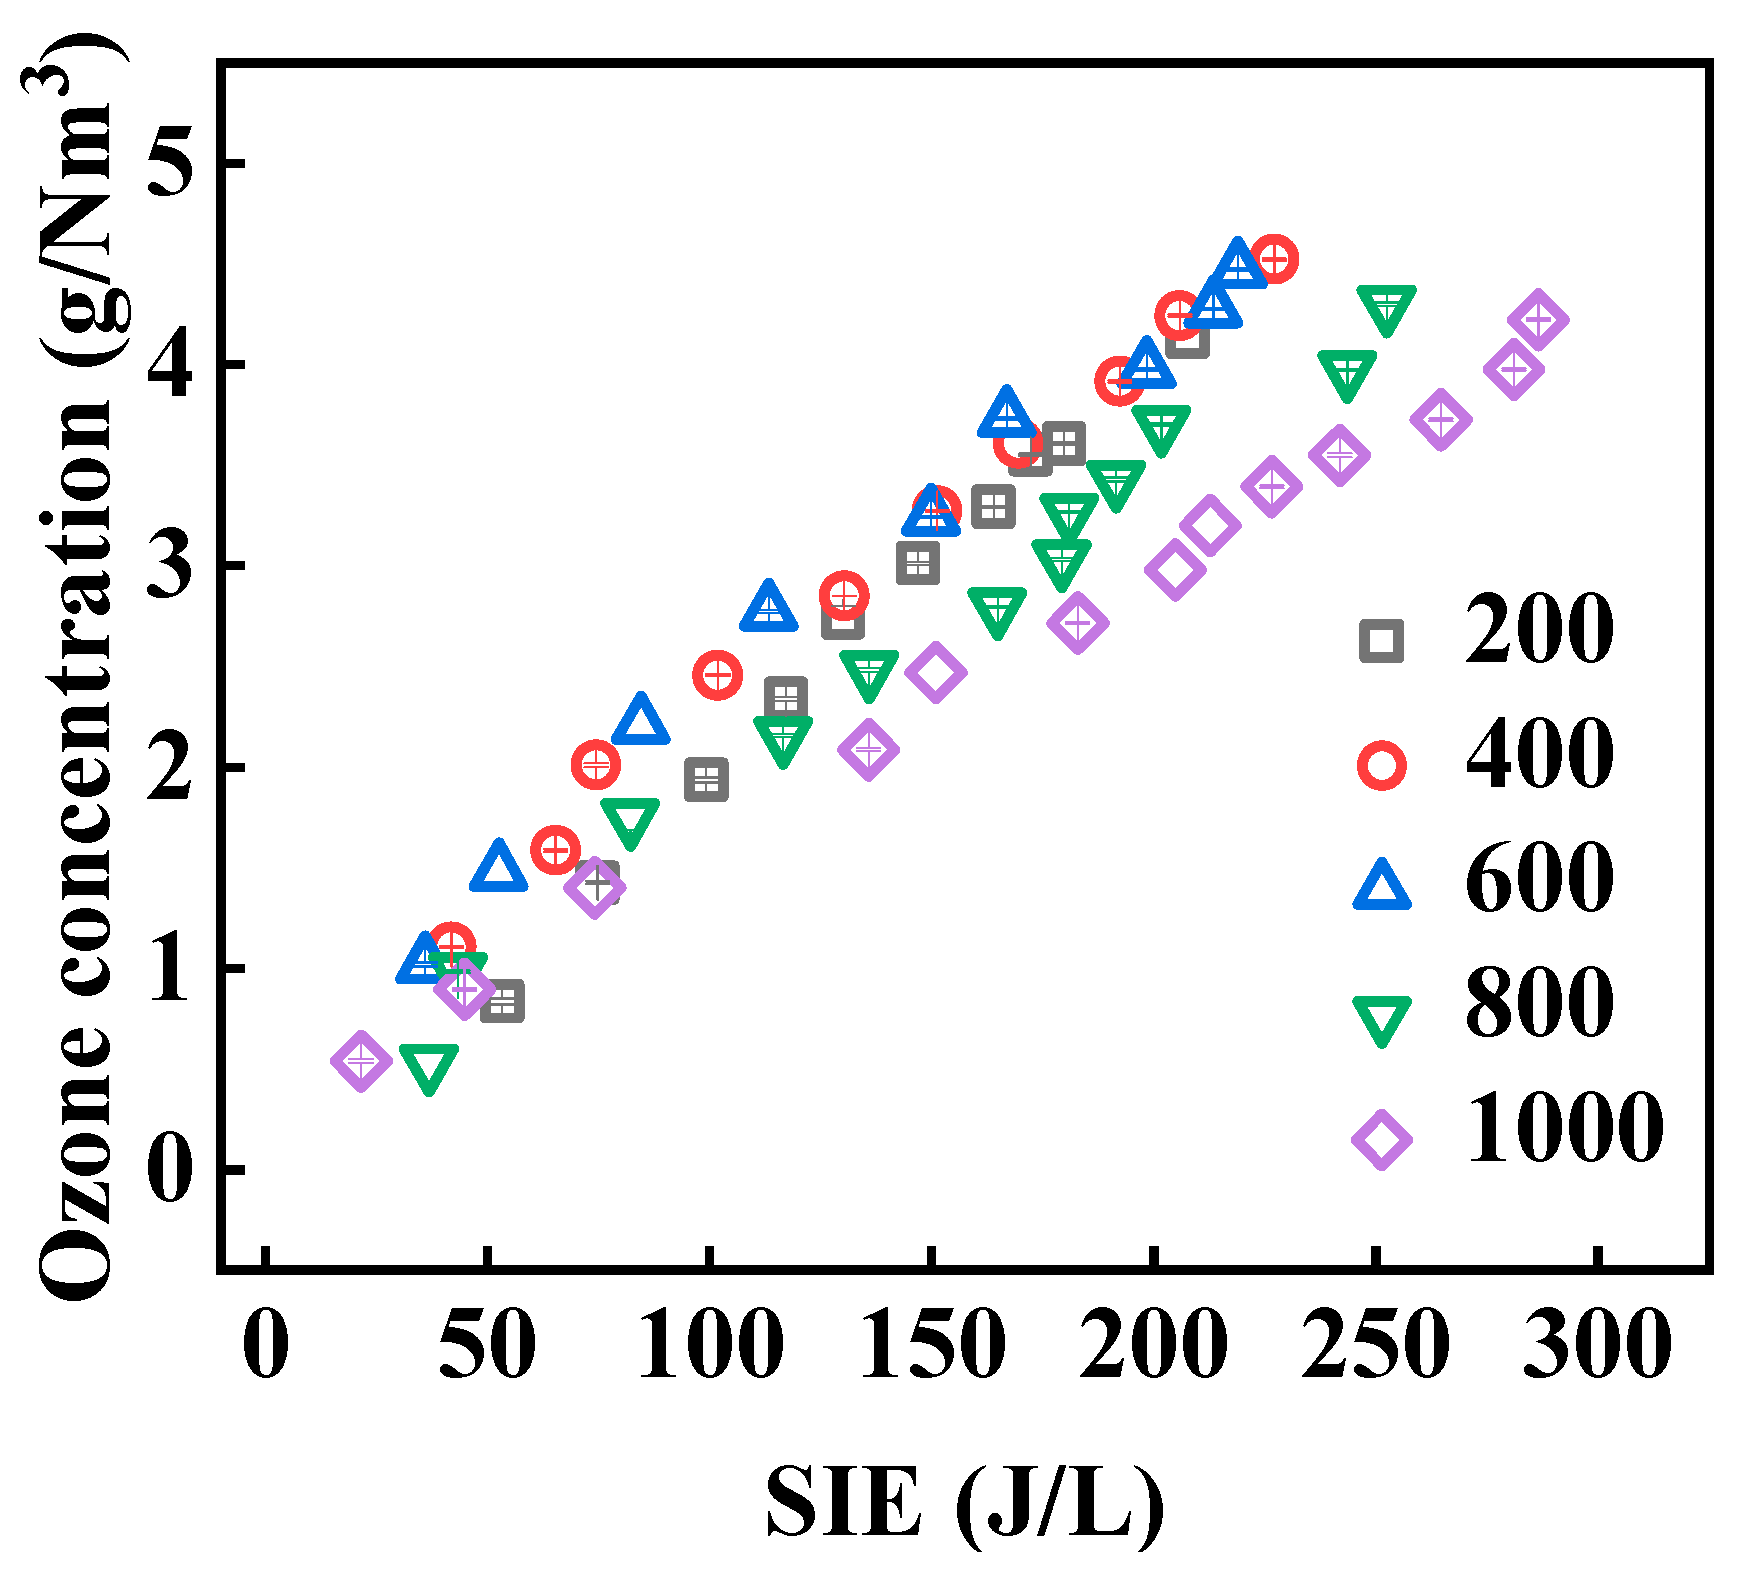
Figure 9 illustrates the correlation between ozone concentration and SIE at varying pulse widths. In the low-SIE range (SIE < 100 J/L), the ozone concentration increases almost linearly with SIE, with minimal variations observed across the curves. Upon reaching an SIE of 100 J/L, the ozone concentration corresponding to all Tp values increases to 2 g/Nm3. This is because, at this stage, energy is predominantly utilized for O2 dissociation (requiring electron energy ≥ 6.12 eV), and the energy transfer efficiency between electrons and gas molecules is relatively high. The influence of Tp is not yet apparent. In the mid-to-high SIE range (SIE > 100 J/L), the slope of the curve’s increase significantly decreases, and the differences between the Tp values gradually widen. When SIE reaches 200 J/L, the ozone concentration corresponding to Tp = 200 ns is approximately 4 g/Nm3, while the concentration for Tp = 1000 ns is 3.97 g/Nm3.
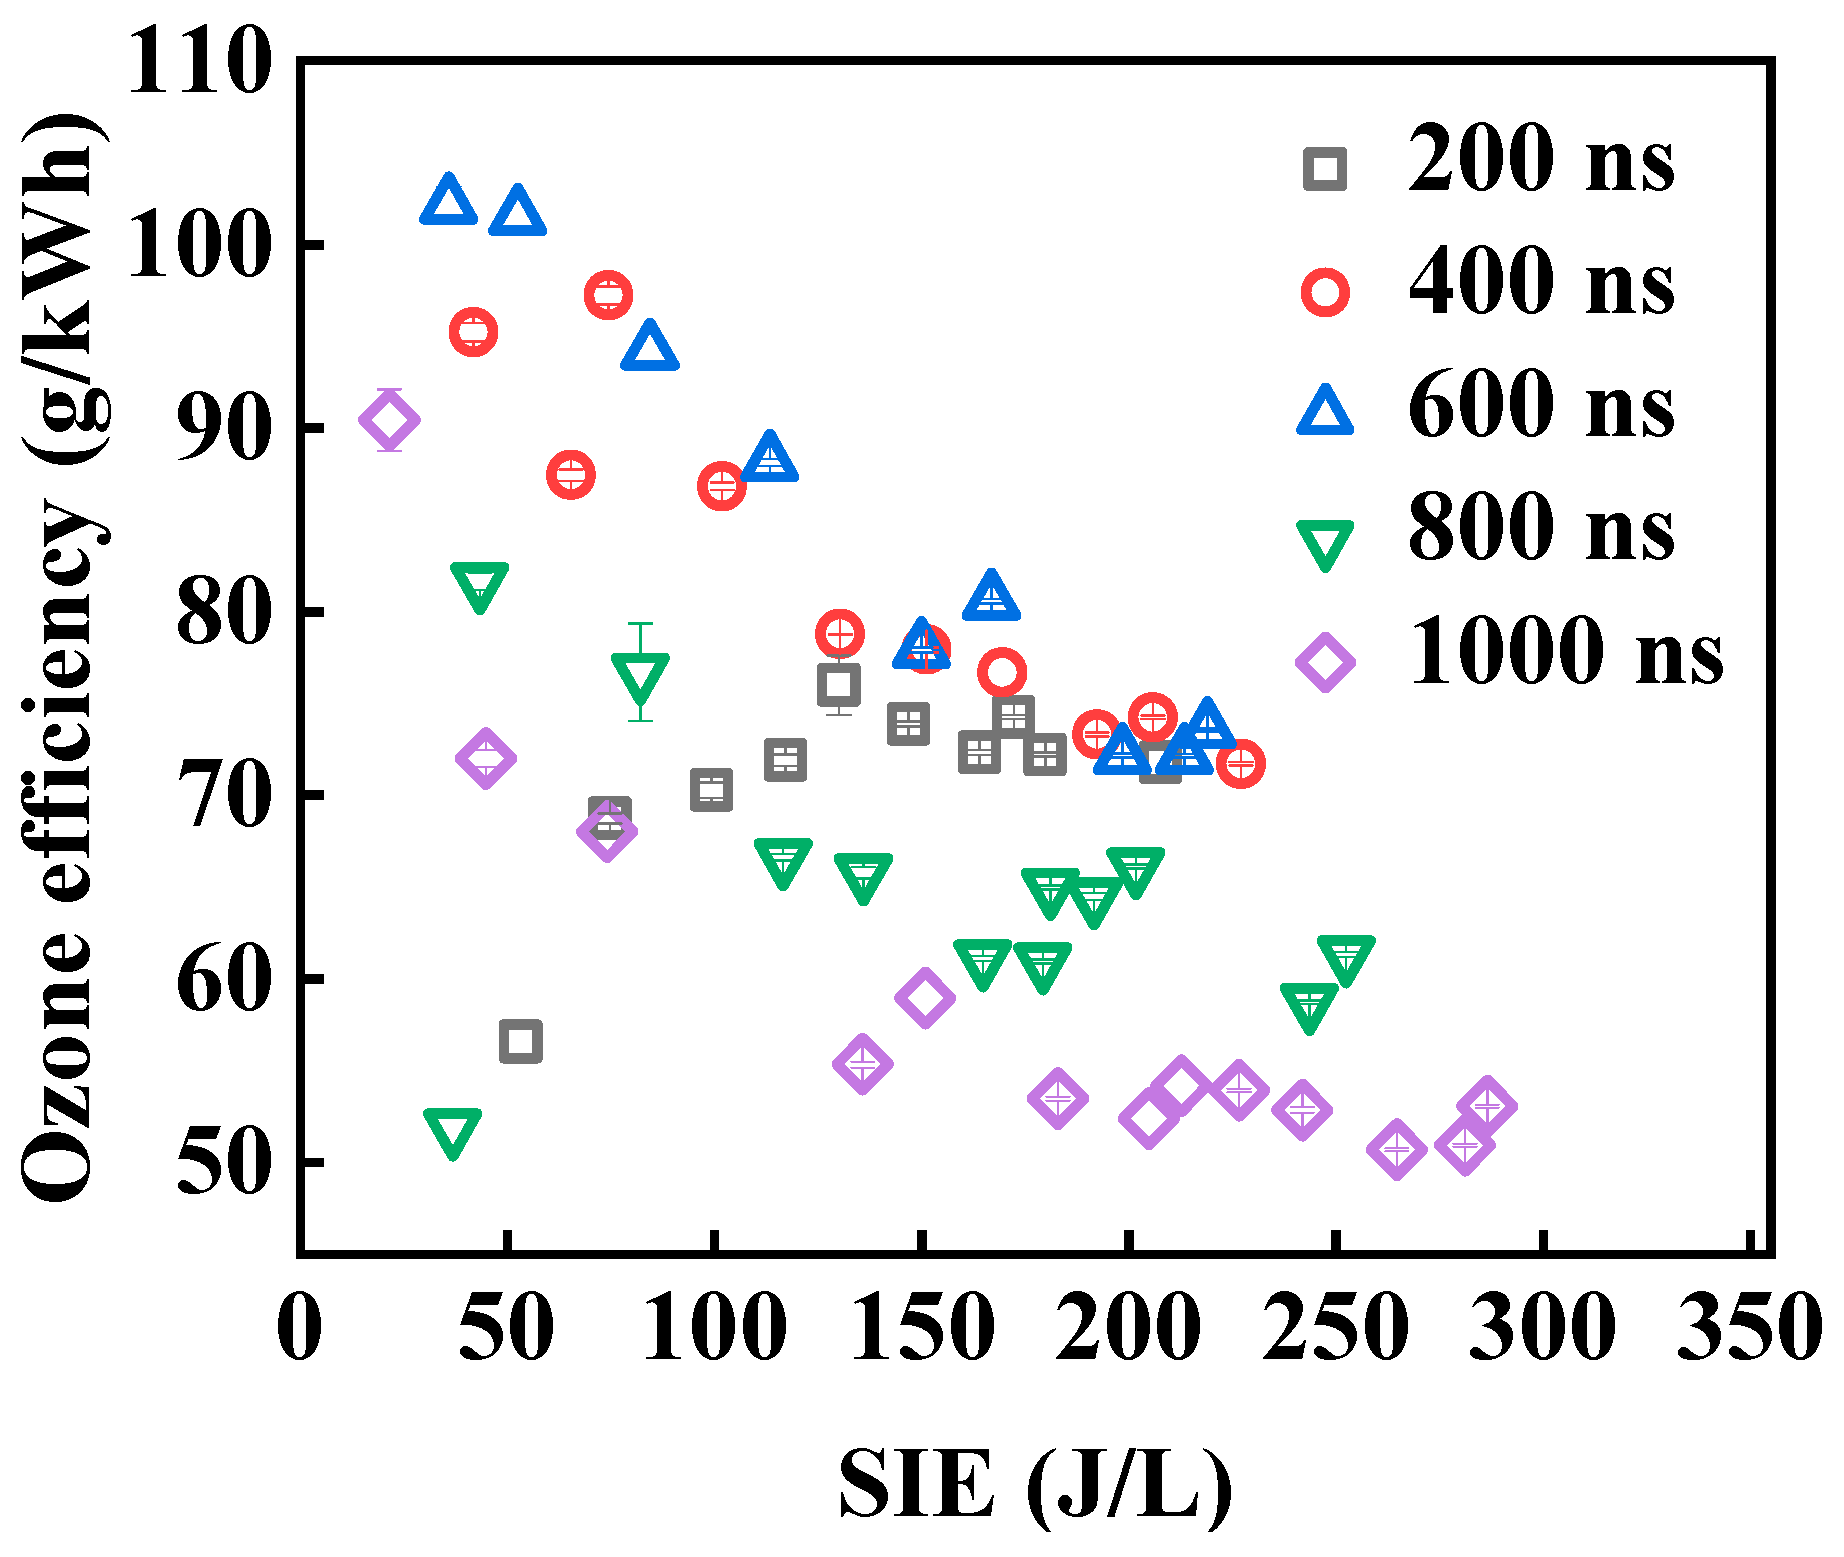
Figure 10 illustrates the ozone generation characteristics of the water electrode under bipolar pulse excitation, highlighting the relationship between pulse width (Tp), SIE, and ozone generation efficiency. Under the experimental conditions of synthetic air flow rate Q = 2 SLPM, frequency f = 1 kHz, and peak voltage Vp = 11 kV, the ozone generation efficiency peaked at 102 g/kWh, which was associated with a SIE of 35.95 J/L. The ozone generation efficiency shows a “rise-then-decline” trend with increasing Tp: when Tp increases from 200 ns to 600 ns, the efficiency continuously rises. However, when Tp exceeds 600 ns (e.g., at 1000 ns), the efficiency significantly decreases to below 85 g/kWh. This phenomenon may be attributed to the excessive energy deposition as pulse width increases, which results in an increase in the discharge channel temperature and promotes ozone decomposition [25]. The highest ozone yield measured in this study is slightly higher than the peak ozone yield of the unipolar pulse-driven water electrode reactor, which achieved a peak efficiency of 99.64 ± 0.87 g/kWh at an SIE of 33.60 ± 1.53 J/L. However, both studies exhibit similar performance in achieving optimal ozone generation efficiency under identical pulse width and SIE conditions.
Table 1 further compares the performance and energy consumption of the nanosecond bipolar pulsed single-water electrode DBD system in this study with those of similar pulsed DBD ozone generation studies. From the perspective of energy consumption, the SIE of the system in this study is 35.95 J/L, combined with a peak ozone generation efficiency of 102 g/kWh. Compared with the system using the same single-water electrode but equipped with a unipolar pulse reported by Ji et al. [11], the system in this study achieves a slightly higher ozone efficiency under the premise of similar energy consumption, confirming that bipolar pulses can optimize energy utilization efficiency without increasing energy consumption. Although Yuan et al. [26] reported a high efficiency of 312 g/kWh, their SIE of 176.9 J/L is approximately 5 times that of this study, resulting in significantly higher energy consumption demand, which makes it unsuitable for the air-fed low-energy consumption scenarios targeted by this study. In contrast to the conventional DBD system by Zhang et al. [27], the system in this study achieves a 27.5% increase in efficiency while reducing the unit energy consumption by 21.6%. This is attributed to the stable rotational temperature of the water electrode, which can suppress ozone decomposition and avoid energy waste. In summary, Table 1 confirms that the system in this study achieves a balance between low energy consumption and high ozone efficiency under air-fed conditions, meeting the energy-saving requirements for industrial on-site ozone generation.

4. Conclusions

This study investigates the ozone generation characteristics of a nanosecond bipolar pulse-excited single-water electrode DBD reactor, with a particular focus on the effects of Tp on discharge behavior, plasma parameters, and ozone generation efficiency.
  • The bipolar pulse voltage alternates symmetrically, with the Trot maintained between 307–310 K, and the Tvib remains stable at 3120 ± 50 K. This thermal stability outperforms Jiang et al.’s cylindrical metal-electrode bipolar pulse DBD and Zhang et al. ’s conventional DBD, effectively suppressing ozone decomposition while ensuring sufficient O2 dissociation energy, addressing a long-standing trade-off in pulse DBD ozone generation
  • The Texc increases as SIE and Tp increase: when SIE = 200 J/L, Tp extends from 200 ns to 1000 ns, and Texc rises from 2633 K to 2724 K.
  • The ozone generation efficiency exhibits a “first increases, then decreases” trend with respect to Tp: the optimal Tp is between 500–600 ns, where the maximum efficiency reaches 102 g/kWh (corresponding to SIE = 35.95 J/L), slightly higher than the peak efficiency of 99.64 ± 0.87 g/kWh (corresponding to SIE = 33.60 ± 1.53 J/L) in the single-pulse-driven water electrode reactor. When Tp exceeds 600 ns, excess energy deposition results in an increase in discharge temperature, leading to a decrease in efficiency. This result confirms the originality of bipolar pulses in improving energy utilization, while the low SIE (35.95 J/L) and air-fed compatibility endow the system with practical value for industrial on-site ozone generation.

Author Contributions

Conceptualization, W.W. and C.J.; methodology, Y.W., W.W.; validation, W.W.; formal analysis, C.J.; investigation, Y.W.; resources, L.W. (Lijian Wang); writing—original draft preparation, W.W. and C.J.; writing—review and editing, X.Z. and Z.L.; supervision, X.Z., L.W. (Linsheng Wei); project administration, X.Z., L.W. (Linsheng Wei); funding acquisition, L.W. (Lijian Wang), Z.L. All authors have read and agreed to the published version of the manuscript.

Funding

This research was funded by the Science and Technology Program Projects of Zhejiang Provincial Administration for Market Regulation (ZD2024006), Zhejiang Provincial Natural Science Foundation of China under Grant No. LQN25E060007 and the Zhejiang Provincial Science and Technology Plan Project (No. 2025C02260).

Data Availability Statement

The original contributions presented in this study are included in the article. Further inquiries can be directed to the corresponding author.

Conflicts of Interest

The authors declare no conflicts of interest.

References

  1. Kogelschatz, U. Dielectric-barrier discharges: Their history, discharge physics, and industrial applications. Plasma Chem. Plasma Process. 2003, 23, 1–46. [Google Scholar] [CrossRef]
  2. Zhou, Y.; Huang, G.; Wang, T.; MacGregor, S.J.; Ren, Q.; Wilson, M.P.; Timoshkin, I.V. Optimization of ozone generation by investigation of filament current characteristics under dielectric barrier discharge. IEEE Trans. Plasma Sci. 2016, 44, 2129–2136. [Google Scholar] [CrossRef]
  3. Zhang, K.; Liu, J.; Lv, H.; Zeng, X.; Ling, Z.; Ding, L.; Jin, C.J.P. Advances in Ozone Technology for Environmental, Energy, Food and Medical Applications. Processes 2025, 13, 1126. [Google Scholar] [CrossRef]
  4. Thanos, J.C.; Wabner, D.W. Elektrochemische abscheidung von sauerstoff und ozon an bleidioxid und platin-anoden in wässrigen elektrolyten mit 18O-markiertem wasser. Electrochim. Acta 1985, 30, 753–756. [Google Scholar] [CrossRef]
  5. Eliasson, B.; Kogelschatz, U. Ozone generation with narrow–band UV radiation. Ozone Sci. Eng. 1991, 13, 365–373. [Google Scholar] [CrossRef]
  6. Mabuchi, R.; Nakata, Y.; Kageyama, T.; Teranishi, K.; Shimomura, N. Investigation of ozone production using nanosecond pulsed power to increase ozone concentration. In Proceedings of the 2012 IEEE International Power Modulator and High Voltage Conference (IPMHVC), San Diego, CA, USA, 3–7 June 2012; pp. 512–515. [Google Scholar] [CrossRef]
  7. Jiang, P.-C.; Wang, W.-C.; Zhang, S.; Jia, L.; Yang, D.-Z.; Tang, K.; Liu, Z.-J. An uniform DBD plasma excited by bipolar nanosecond pulse using wire-cylinder electrode configuration in atmospheric air. Spectrochim. Acta Part A Mol. Biomol. Spectrosc. 2014, 122, 107–112. [Google Scholar] [CrossRef] [PubMed]
  8. Yuan, D.; Ding, C.; He, Y.; Wang, Z.; Kumar, S.; Zhu, Y.; Cen, K. Characteristics of dielectric barrier discharge ozone synthesis for different pulse modes. Plasma Chem. Plasma Process. 2017, 37, 1165–1173. [Google Scholar] [CrossRef]
  9. Kim, S.-H.; Yun, U.-H.; Kim, J.-G. Characteristics of high-repetition-rate bipolar pulse DBD under various electrical conditions in atmospheric-pressure air. J. Phys. D Appl. Phys. 2023, 57, 125206. [Google Scholar] [CrossRef]
  10. Gou, X.; Yuan, D.; Wang, L.; Xie, L.; Wei, L.; Zhang, G.J.V. Enhancing ozone production in dielectric barrier discharge utilizing water as electrode. Vacuum 2023, 212, 112047. [Google Scholar] [CrossRef]
  11. Ji, K.; Yuan, D.; Jin, C.; Wang, D.; Li, Y.; Peng, B.; Wei, L.J.V. Ozone production in nanosecond pulsed dielectric barrier discharge in synthetic air: The effect of pulse width. Vacuum 2024, 230, 113688. [Google Scholar] [CrossRef]
  12. Xie, L.; Yuan, D.; Wang, L.; Zhang, G.; Peng, B.; Wei, L.; Ling, Z. A novel dielectric barrier discharge ozone generator with excellent microdischarge temperature behavior. Appl. Therm. Eng. 2024, 250, 123453. [Google Scholar] [CrossRef]
  13. Zhao, Y.; Shang, K.; Duan, L.; Li, Y.; An, J.; Zhang, C.; Lu, N.; Li, J.; Wu, Y. Influence of power supply on the generation of ozone and degradation of phenol in a surface discharge reactor. J. Phys. Conf. Ser. 2013, 418, 012131. [Google Scholar] [CrossRef]
  14. Jin, C.; Lin, F.; Peng, B.; Wei, L.; Ling, Z.; Zeng, X.; Yuan, D.J.V. Nanosecond pulsed multi-hollow surface dielectric barrier discharge for ozone production. Vacuum 2025, 238, 114252. [Google Scholar] [CrossRef]
  15. Tang, X.; Zhou, Z.; Chen, Y.; Lin, Z.; Zhang, M.; Li, X. A pulsed bipolar current-mode power supply with high power factor in a single stage for dielectric barrier discharge application. Circuit World 2025, 51, 30–43. [Google Scholar] [CrossRef]
  16. Truong, H.T.; Uesugi, Y.; Nguyen, X.B. Mechanisms of low-frequency dielectric barrier discharge (DBD) plasma driven by unipolar pulses and bipolar pulses. AIP Adv. 2021, 11, 025022. [Google Scholar] [CrossRef]
  17. Gao, M.; Zhang, Y.; Wang, H.; Guo, B.; Zhang, Q.; Bogaerts, A.J.C. Mode transition of filaments in packed-bed dielectric barrier discharges. Catalysts 2018, 8, 248. [Google Scholar] [CrossRef]
  18. Wenhao, Z.; Zhang, D.; Xiaohui, D.; Xi, Z.; Feng, L.; Zhi, F. Effect of dielectric material on the uniformity of nanosecond pulsed dielectric barrier discharge. Plasma Sci. Technol. 2024, 26, 094008. [Google Scholar] [CrossRef]
  19. Zhang, S.; Jia, L.; Wang, W.-c.; Yang, D.-z.; Tang, K.; Liu, Z.-J. The influencing factors of nanosecond pulse homogeneous dielectric barrier discharge in air. Spectrochim. Acta Part A Mol. Biomol. Spectrosc. 2014, 117, 535–540. [Google Scholar] [CrossRef]
  20. Li, J.; Yao, J.; He, F.; Ouyang, J. Comparison of ozone production in planar DBD of different modes. Plasma Chem. Plasma Process. 2024, 44, 891–905. [Google Scholar] [CrossRef]
  21. Kim, H.-H.; Abdelaziz, A.A.; Teramoto, Y.; Nozaki, T.; Kim, D.-Y.; Brandenburg, R.; Schiorlin, M.; Hensel, K.; Song, Y.-H.; Lee, D.; et al. Revisiting why DBDs can generate O 3 against the thermodynamic limit. Int. J. Plasma Environ. Sci. Technol. 2023, 17, e02004. [Google Scholar]
  22. Jodzis, S.; Baran, K. The influence of gas temperature on ozone generation and decomposition in ozone generator. How Is Ozone Decomposed? Vacuum 2022, 195, 110647. [Google Scholar] [CrossRef]
  23. Jodzis, S.; Barczyński, T. Ozone synthesis and decomposition in oxygen-fed pulsed DBD system: Effect of ozone concentration, power density, and residence time. Ozone Sci. Eng. 2019, 41, 69–79. [Google Scholar] [CrossRef]
  24. Zhang, Y.; Li, J.; Lu, N.; Shang, K.; Wu, Y. Diagnosis of electronic excitation temperature in surface dielectric barrier discharge plasmas at atmospheric pressure. Plasma Sci. Technol. 2014, 16, 123. [Google Scholar] [CrossRef]
  25. Linsheng, W.; Liang, X.; Zhang, Y. Numerical investigation on the effect of gas parameters on ozone generation in pulsed dielectric barrier discharge. Plasma Sci. Technol. 2018, 20, 125505. [Google Scholar] [CrossRef]
  26. Yuan, D.; Jin, C.; Li, Y.; Zeng, X.; Wei, L.; Ling, Z.; Lin, F. Advanced ozone generator for efficient NOx oxidation: Enhanced energy efficiency with optimal microdischarge temperature. Therm. Sci. Eng. Prog. 2025, 65, 103954. [Google Scholar] [CrossRef]
  27. Zhang, X.; Lee, B.J.; Im, H.G.; Cha, M.S. Ozone production with dielectric barrier discharge: Effects of power source and humidity. IEEE Trans. Plasma Sci. 2016, 44, 2288–2296. [Google Scholar] [CrossRef]
Figure 1. The schematic of experimental system.
Processes 13 03619 g001
Figure 2. Schematic diagram of bipolar pulsed nanosecond power supply.
Processes 13 03619 g002
Figure 3. Characteristic voltage waveforms of SDBD plasmas under synthetic air conditions (f = 1 kHz, Q = 2 SLM, Vp = 10.1 kV, SIE = 159.4 J/L).
Processes 13 03619 g003
Figure 4. ICCD images of SDBD driven by single pulse signals under different Vp (Q = 2 SLM, f = 1 kHz, exposure time 1 μs).
Processes 13 03619 g004
Figure 5. Optical emission spectra of DBD sources under different Tp. (Q = 2SLM, Vp = 11 kV, f = 1 kHz).
Processes 13 03619 g005
Figure 6. (At Q = 2 SLPM, Vp = 9.7 kV, f = 1 kHz, Tp = 400 ns, pulsed rise time = 50 ns) Typical normalized measured spectra (black line) and spectra simulated via SPECAIR (red line).
Processes 13 03619 g006
Figure 7. The variation in electron excitation temperature Texc with different Tp.
Processes 13 03619 g007
Figure 8. The SIE with Vp at different Tp.
Processes 13 03619 g008
Figure 9. The Ozone concentration with SIE at different Tp.
Processes 13 03619 g009
Figure 10. Ozone production characterization: ozone generation efficiency at varying pulse widths.
Processes 13 03619 g010
Table 1. Comparison of ozone generation performance between this work and relevant literature.
ResearchersType of DBDGas SourcePower SupplySIE
(J/L)
Ozone Generation
Efficiency (g/kWh)
Ref.
Wu et al.,
2025
Single-water electrode DBDAirBipolar Pulse35.95102This work
Yuan et al.,
2025
Double-water electrode DBDAirPulse176.9312[26]
Ji et al.,
2024
Single-water electrode DBDAirPulse33.699.64[11]
Zhang et al.,
2016
Conventional DBDAir
(Dry/Humid)
Pulse2380[27]
Disclaimer/Publisher’s Note: The statements, opinions and data contained in all publications are solely those of the individual author(s) and contributor(s) and not of MDPI and/or the editor(s). MDPI and/or the editor(s) disclaim responsibility for any injury to people or property resulting from any ideas, methods, instructions or products referred to in the content.