Article

Simulation of Absorption and Flash Evaporation for Natural Gas Desulfurization

PetroChina Southwest Oil and Gasfield Company, Chengdu 610017, China
*
Author to whom correspondence should be addressed.
Processes 2025, 13(11), 3504; https://doi.org/10.3390/pr13113504
Submission received: 26 August 2025 / Revised: 24 September 2025 / Accepted: 30 October 2025 / Published: 31 October 2025
(This article belongs to the Section Separation Processes)

Abstract

A rigorous rate-based absorption model integrated with an improved thermodynamic framework was developed to simulate natural gas desulfurization using TMS–MDEA (Tetramethylene Sulfone–Methyldiethanolamine) aqueous solutions. The model was validated against 50 sets of industrial and experimental data, achieving R2 values above 0.98 and average deviations within 5%. The model was formulated for steady-state operation of a trayed absorber integrated with flash and packed-bed regeneration and applicable over industrially relevant ranges (absorber pressure 3–6.4 MPa; gas–liquid ratio 350–720; flash pressure 0.3–0.6 MPa; packing height ≥ 3 m). The results indicate that H2S can be removed almost completely (>99.9%); CO2 and COS achieve 70–85% and 75–83% removal, respectively; and CH3SH removal exceeds 90% under typical conditions. Parametric analysis revealed that higher tray numbers, weir heights, and pressures enhance absorption efficiency, whereas hydrocarbon solubility increases with carbon number and is strongly affected by pressure and the gas–liquid ratio. In the desorption section, flash regeneration efficiently strips light hydrocarbons, with decreasing desorption efficiency from CH4 to C6H14. This study provides quantitative insights into the coupled absorption–desorption process and offers practical guidance for process design, solvent selection, and energy-efficient operation in natural gas purification.

1. Introduction

Energy is a foundational pillar of socioeconomic systems and a critical resource; developing countries generally regard energy security as a prerequisite for sustained economic growth and environmental sustainability [1,2]. Although conventional fossil fuels such as coal and oil are widely used for power generation, their combustion releases large quantities of greenhouse gases, causing significant environmental pollution [3]. By contrast, natural gas (NG)—which is relatively inexpensive and emits less CO2 and other pollutants during combustion—is considered an important component of the clean-energy portfolio [4].
As produced, NG is a multicomponent mixture of combustible and inert gases. It consists primarily of low-molecular-weight saturated hydrocarbons (CH4–C6H14) and typically contains acidic components (e.g., CO2 and H2S) and organic sulfur species (e.g., COS and CH3SH) as impurities; therefore, it must be further purified before use [5,6,7,8]. Conventional natural gas purification technologies include absorption [8], membrane separation [9], adsorption [10], and cryogenic separation [11]. Adsorption offers clear advantages for enhancing CO2 capture, but it can incur substantial methane (CH4) losses [12]. Membrane separation is attractive for its operational simplicity and process flexibility; however, membranes are prone to fouling and blockage, and remediation or replacement is costly [13]. In industrial applications, aqueous amine solutions are widely employed to remove acid gases. Common alkanolamines include monoethanolamine (MEA), diethanolamine, methyldiethanolamine (MDEA), and diisopropanolamine [14]. As a tertiary amine, MDEA lacks the N–H bond required for carbamate formation, conferring high chemical stability and a low propensity for degradation, and it has become a mainstream choice for acid-gas removal. Nevertheless, amine solvents exhibit limited affinity for organic sulfur species [15,16,17]. To address this limitation, a sulfone-containing mixed-solvent system is proposed that enables the simultaneous and efficient removal of high concentrations of CO2 and H2S from the feed gas.
Beyond conventional single-method approaches, recent progress has increasingly focused on hybrid process configurations that combine the strengths of different separation principles. On the membrane side, membrane-assisted contactors and cascades have evolved from laboratory-scale demonstrations to plant-wide modeling and techno-economic assessment, showing compact footprints, mitigation of foaming/flooding, and competitive costs for acid-gas enrichment when reasonable H2S/CO2 selectivity and permeance targets are met [18,19,20]. On the solvent side, hybrid solvents have proven superior to single amines; for example, MEA + NMP improves CO2/H2S removal while lowering reboiler duty relative to neat MEA [21]. Sulfolane–MDEA blends reduce energy use, exergy destruction, and operating cost in 5E analyses [22], and ionic liquid (IL)–alcohol mixtures designed by computer-aided methods achieve significant power (≈56%) and TAC (≈24%) savings compared with Rectisol in process-level comparisons [23]. At the molecular level, functionalized ILs have delivered record H2S/CO2 selectivities by leveraging reversible nucleophilic addition chemistry, opening a new pathway for highly selective desulfurization with efficient regeneration [24]. Broader evaluations likewise indicate that IL-based capture can be integrated with LNG chains and assessed favorably on energy, exergy, and environmental metrics [25], while comprehensive reviews highlight IL–amine blends and CO2-binding organic liquids as promising, tunable platforms for NG sweetening and CO2 capture [26]. Collectively, these advances in membrane–absorption integration, IL-enabled chemistry, and hybrid solvents provide an up-to-date context and benchmark for the present TMS–MDEA (Tetramethylene Sulfone–Methyldiethanolamine) study.
It should also be noted that most existing studies and reviews focus primarily on the removal of acidic components and organic sulfur compounds from natural gas, while relatively little attention has been paid to the influence of light hydrocarbons during the absorption process [26,27]. In practice, light hydrocarbons can readily dissolve into amine solutions in absorbers, particularly under high-pressure and low-temperature conditions, where the solubility of heavier components such as C4H10 and above increases significantly. These dissolved hydrocarbons occupy part of the effective volume of the amine solution, reduce the number of active sites available for acid gas reactions, and thereby diminish selective absorption efficiency. In addition, the dissolution of light hydrocarbons may promote foaming, disrupt liquid flow patterns, and, in severe cases, cause flooding, threatening stable plant operation.
To address these challenges, this study develops a mass-transfer rate-based absorption model integrated with an improved thermodynamic framework to systematically investigate the removal and desorption performance of TMS–MDEA aqueous solutions for acid gases, organic sulfur species, and light hydrocarbons in NG treatment. The effects of key operating parameters—such as the gas–liquid ratio, weir height, and absorption pressure—on the removal efficiency of each component are examined, and the dissolution behavior of light hydrocarbons in amine solutions and their overall impact on purification performance are analyzed in detail. Furthermore, a desorption–absorption system consisting of a flash drum and a packed column is designed for efficient regeneration of rich amine solutions, and the effects of flash pressure and liquid level in the packed column on desorption efficiency are evaluated. The findings of this study not only provide deeper insight into the mechanisms by which light hydrocarbons influence acid gas and sulfur removal from natural gas but also offer a solid theoretical basis and technical guidance for optimizing absorption operations and improving equipment design.

2. Model Development

The model comprises two units—absorption and desorption—as illustrated in Figure 1. In the absorption unit, the feed gas containing acid gases, sulfur species, and light hydrocarbons enters the bottom of a trayed absorption tower, while the lean amine solution (TMS, MDEA, and water) is introduced at the top. The two streams contact counter-currently and undergo mass transfer and reaction. The lean amine selectively absorbs the acid gases, organic sulfur compounds, and part of the light hydrocarbons, forming a rich amine that is withdrawn from the column bottom; the purified natural gas exits overhead for downstream processing. The desorption unit consists of a flash drum and a packed absorber. The rich amine first enters the flash drum, where a pressure reduction strips the dissolved hydrocarbons. To prevent acid gases and organic sulfur compounds from co-evolving with the hydrocarbons during flashing, the flash gas is routed to a packed absorption tower for polishing, where the residual acid gases and organic sulfur species are captured.
The simulation of the natural gas treatment process for removing CO2, H2S, and other mixed components was developed in Fortran 90. The process model incorporates three key phenomena: reaction kinetics, mass transfer, and heat transfer equations.

2.1. Thermodynamics and Chemical Equilibrium

2.1.1. Thermodynamic Properties

In vapor–liquid equilibrium modeling, the fugacity coefficient of the vapor phase, the activity coefficient of the liquid phase, and the Henry’s constant are introduced to account for the non-ideality of the system. The fugacity coefficient ϕi of component i in the vapor phase is defined as shown in Equation (1).
ϕ i = f i gas y i P
Here, f i gas is the fugacity of component i in the vapor phase (Pa), y i is its mole fraction in the vapor phase, and P is the total system pressure (Pa). The activity coefficient γ i represents the deviation of the activity of component i from its ideal behavior and is defined in Equation (2).
γ i = a i x i
Here, a i and x i are the activity and the mole fraction of component i in the liquid phase, respectively. At vapor–liquid equilibrium, according to Henry’s law, the partial pressure of component i in the vapor phase is linearly related to its mole fraction in the liquid phase, as shown in Equation (3).
P i = H i x i
Here, H i is Henry’s constant of component i (Pa). By combining the fugacity equality condition between the vapor and liquid phases ( f i gas = f i liq ), a unified expression for the phase equilibrium relationship can be obtained, as shown in Equation (4).
ϕ i y i P = γ i x i H i
The fugacity coefficient ϕ i is calculated using the Peng–Robinson equation of state (EOS). In the liquid phase, γ i represents the asymmetric activity coefficient of component i in the mixed solvent, normalized to the infinite-dilution reference state of the mixed solvent. For such mixed-solvent systems, the Henry’s constant H i of component i can be estimated from the parameters of the pure solvents using a weighted logarithmic form, as expressed in Equation (5).
ln H i = A ω A ln γ i , A + ln H i , A
The H i values for solutes such as CO2, H2S, and CH4 can be directly obtained from the literature, whereas the H i values for C5H12–C6H14—due to the lack of publicly available data—were obtained by regression of experimental measurements; the regression and validation procedure is detailed in Section 3.1,Henry’s constants are shown in Table 1.

2.1.2. Chemical Equilibrium Process

The formation of ionic species renders the system highly non-ideal, as acidic gases and amines partially dissociate in the aqueous phase due to their weak electrolyte nature. Chemical reactions occurring in the liquid phase, involving both molecular and ionic species, can be described by the following equilibrium reactions.
C O 2 + 2 H 2 O H 3 O + + HC O 3
H 2 S + H 2 O H 3 O + + H S
H 2 O + MDEA H + H 3 O + + MDEA
H S + H 2 O S 2 + H 3 O +
HC O 3 + H 2 O C O 3 2 + H 3 O +
2 H 2 O H 3 O + + O H
MDEA exhibits basicity through the lone pair of electrons on its nitrogen atom, enabling it to react with hydrogen sulfide (H2S) [15,17]. This reaction is essentially a proton transfer process that primarily occurs within the extremely thin liquid film near the gas–liquid interface. The reaction rate is extremely fast, proceeding almost instantaneously, which allows H2S to be absorbed rapidly and efficiently. One of the most practical approaches for simulating chemical equilibrium is to employ an energy-free excess Gibbs model or an activity coefficient–based model to accurately represent the equilibrium constants. The e-NRTL model proposed by Chen et al. and the Extended UNIQUAC model developed by Thomsen et al. are widely used for the thermodynamic description of electrolyte systems. In addition, the e-NRTL model is frequently applied for estimating activity coefficients in multicomponent electrolyte systems. In this work, the e-NRTL model is adopted for calculations. The thermodynamic equilibrium constants (K) for each chemical reaction are directly taken from the literature; these constants are expressed on a mole fraction basis and exhibit explicit temperature dependence (parameters are given in Table 2). For the reactions represented by Equations (6)–(11), the equilibrium constants are calculated from the Gibbs free energy change, ∆Gⱼ(T), according to Equation (12), with the relevant parameters provided in Table 2.
ln K j = Δ G j ° R T = i = 1 n V i j ln x i γ i = A + B T + C ln T + D T
Here, K j is the equilibrium constant of reaction j, Δ G j ° the standard Gibbs free energy change (J·mol−1), R the universal gas constant (8.314 J·mol−1·K−1), T the absolute temperature (K), V i j the stoichiometric coefficient of component i. A, B, C, D are empirical fitting parameters, with A and C dimensionless, B in J·mol−1, and D in K−1.
However, previous studies have shown that during the absorption process, MDEA undergoes chemical reactions with acidic components, and the extent of these reactions significantly affects the absorption performance of organic sulfur compounds in sulfolane–MDEA aqueous solutions [32]. To account for this effect, a variable termed the “unreacted MDEA ratio” is introduced to represent the residual concentration of MDEA after reacting with acid gases. This variable is then used to correct the Henry’s constant of methanethiol (CH3SH) in the sulfolane–MDEA aqueous solution.
H C H 3 SH = H C H 3 SH f C
In the equation, f represents the unreacted MDEA ratio, defined as the ratio of unreacted MDEA to the total amount of MDEA and MDEAH+ in the aqueous solution. C is the influence factor, representing the effect of acidic components on Henry’s constant. and denote Henry’s constant of CH3SH in the mixed solvent without and with the influence of acidic components, respectively.

2.2. Process Modeling

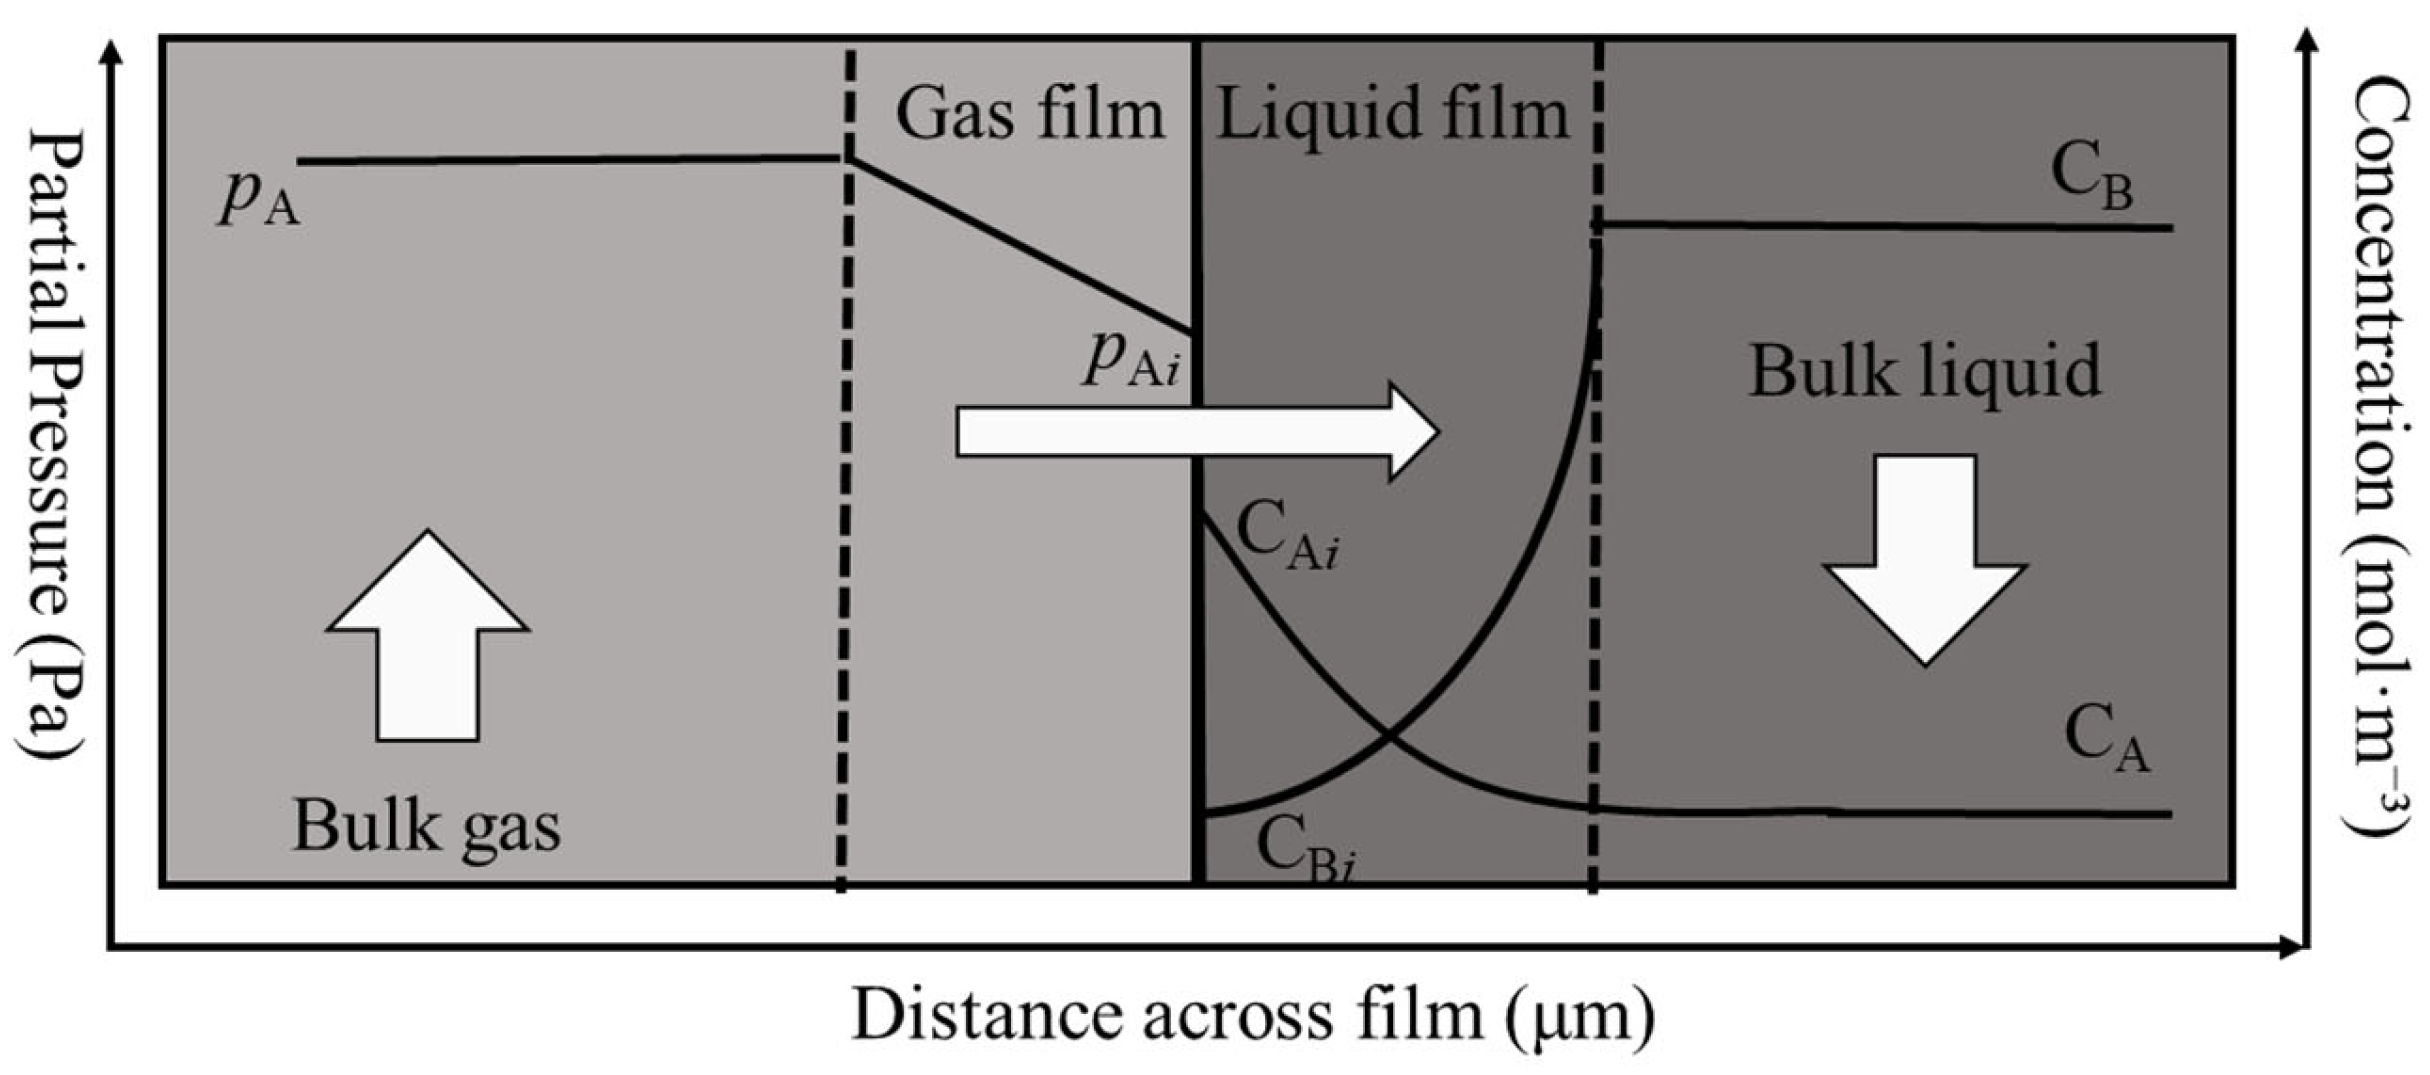
Thermodynamic and kinetic models play a critical role in mass transfer processes. Mass transfer in both the liquid and vapor phases is driven by concentration gradients. In addition to the bulk phases, the modeling also assumes the presence of a gas film phase. In the mathematical modeling of acid gas separation from natural gas, two general approaches are commonly used: (i) the equilibrium stage model and (ii) the rate-based model. In this study, a rate-based modeling approach is adopted. The rate-based model explicitly accounts for the finite rates of mass transfer, heat transfer, and chemical reactions, thereby avoiding the use of stage efficiency factors and instead calculating absorption capacity directly from the actual mass fluxes at each stage. This method assumes that the bulk liquid phase reaches chemical equilibrium, whereas vapor–liquid equilibrium is established only at the gas–liquid interface. As shown in Figure 2, the rate-based approach models the mass transfer behavior at the gas–liquid interface using the two-film theory. In practice, the VLE at the gas–liquid interface determines the partial pressure of each component, while chemical equilibrium is established in the bulk liquid phase. Therefore, the influence of chemical reactions on mass flux can be evaluated using an expression for the enhancement factor.
To simulate the dynamic behavior of the absorption column, the mathematical model is developed based on the following assumptions:
(i)
Both physical absorption and chemical absorption are considered, with reactions occurring only in the liquid phase.
(ii)
The absorption column operates adiabatically.
(iii)
Heat transfer resistance in the liquid phase is neglected, the interfacial temperature is equal to the bulk fluid temperature, and no temperature gradient exists.
(iv)
Axial flow is treated as one-dimensional, with radial temperature and concentration variations neglected.
(v)
Countercurrent flow is assumed, and both vapor and liquid phases are perfectly mixed.

2.2.1. Material and Energy Balances

In the absorption column, the absorption of gas components by the MDEA solution is accompanied by complex chemical reactions, mass transfer, and heat transfer, representing a typical multistage separation process. To model and analyze this process, the equilibrium-stage model is employed for the simulation of the absorption column.
In developing the model, it is assumed that the vapor and liquid streams leaving each stage are in phase equilibrium. Based on this assumption, the mathematical model for each stage of the absorption column can be formulated by applying fundamental equations for material balance, energy balance, and phase equilibrium. The following MESH equations are expressed in vectorial form, representing balances over all chemical species on each stage.
Material Balance Equations (M-equations)
For component i on stage j:
L j x i , j 1 + V j + 1 y i , j + 1 L j x i , j V j y i , j = 0
where L and V are the liquid and vapor molar flow rates (mol·s−1), x i , j 1 and y i , j + 1 are the mole fractions of component iii in liquid and vapor phases.
Energy Balance Equations (H-equations)
Overall energy conservation on stage j:
V j + 1 H j + 1 V + L j 1 H j 1 L V j H j V L j H j L = 0
where H V and H L are the molar enthalpies of vapor and liquid streams (J·mol−1), and L and V are molar flow rates (mol·s−1).
Summation Equations (S-equations)
The sum of mole fractions in both the vapor and liquid phases is equal to 1:
x i , j = 1 y i , j = 1  
where x i , j and y i , j are mole fractions.
Phase Equilibrium Relations (K-equations)
The vapor–liquid equilibrium is expressed using the vapor–liquid distribution coefficient Ki,j as follows:
y i , j = K i , j x i , j  
where K i , j is the distribution coefficient of component i, y i , j is the vapor-phase mole fraction, and x i , j is the liquid-phase mole fraction.
By combining the material balance equations, energy balance equations, summation equations, and phase equilibrium equations, a mathematical model of the absorption column is established—namely, the MESH equations (Material, Energy, Summation, and Phase Equilibrium equations).
When performing an energy balance calculation, it is essential to account for the heat of absorption released during the reactions between acidic gases and MDEA. Both the reactions of MDEA with hydrogen sulfide (H2S) and with carbon dioxide (CO2) are exothermic; therefore, in the energy balance, the heat of absorption must be included as a negative term. In this study, the energy balance model incorporates the heat effects associated with the reactions of H2S and CO2 with MDEA. According to thermodynamic principles, there is a temperature-dependent relationship between the equilibrium constant and the heat of reaction. Using fundamental thermodynamic equations, an expression describing the variation in the equilibrium constant with temperature can be derived, thereby providing the theoretical basis for calculating the thermal effects during the absorption process:
d ln K d 1 T = Δ H R
In the equation, K denotes the equilibrium constant during desorption, which is equal to that during absorption; T is the temperature (K); ΔH is the heat of desorption; and R = 8.314 J·mol−1·K−1. The heats of absorption for MDEA reacting with H2S and CO2 are 37.2 and −71.8 kJ·mol−1, respectively. Equation (18) is expressed in one-dimensional form along the column height, assuming radial uniformity of temperature and composition. This simplification is commonly adopted for rate-based models; however, the framework can be extended to multi-dimensional balances if radial gradients are significant.

2.2.2. Mass Transfer and Enhancement Factor

Tray columns are among the most widely used separation units in industrial production, and their modeling is typically based on the concept of “theoretical stages” using the equilibrium stage model. The mass transfer process between the vapor and liquid phases can be described using the two-film theory, with the mass transfer flux estimated by the following equation:
N i = K G , i ( P i P i * ) a p A C
K G , i represents the overall mass transfer coefficient; P is the total system pressure; P i is the partial pressure of component i in the vapor phase; P i * is the equilibrium partial pressure of component i at the gas–liquid interface; P i * is the effective mass transfer area per unit tray area m2; and Ac is the column cross-sectional area m2.
For packed columns, where a continuous gas–liquid contact interface exists throughout the column, the mass transfer process can likewise be modeled using the two-film theory. To improve prediction accuracy, the rate-based mass transfer model is employed, which accounts for the limitations imposed by multicomponent mass transfer, heat transfer, and reaction rates at the gas–liquid interface. The mass transfer flux in a packed column is expressed as follows:
N i = K G , i P i P i * a e V f
ae is the specific surface area of the packing (m2/m3), and Vf is the packed bed volume (m3).
The overall mass transfer resistance of component i is determined by the combined resistances of the gas and liquid phases. The overall mass transfer coefficient, KG,i can be calculated using the expression given in Equation (21):
1 K G , i = 1 k G , i + H i k L , i E i
KG,i and KL,i are the gas-phase and liquid-phase mass transfer coefficients of component i, respectively; and Ei is the enhancement factor, defined as the ratio of the mass transfer rate with reaction to that without reaction. The value of Ei is related to the Hatta number, which represents the ratio between the diffusion time and the reaction time. For the reaction scheme A + νBB → products, where a first-order reaction with respect to A occurs (reaction rate rA = k1CA), the Hatta number is defined as shown in Equation (22):
H a = k 2 t , i D i , L C M D E A B u l k k L , i
D i , L is the diffusion coefficient of absorbing component i in the sulfolane–MDEA aqueous solution, and C M D E A B u l k is the concentration of MDEA in the absorption liquid. Pacheco [33] and Rochelle and Al-Ghawas et al. [34] measured the reaction rate constants of CO2 with MDEA and COS with MDEA in mixed solvents, as given in Equations (23) and (24), respectively.
k 2 t , C O 2 = 2.576 × 10 9 exp 6024 / T
k 2 t , C O S = 4198.74 exp 4575.80 / T
When the stoichiometric coefficient of the reactant is equal to 1, the Hatta number can be used as an indicator of whether the reaction occurs predominantly in the bulk liquid phase—thus requiring a large volume of liquid—or entirely within the film, in which case equipment providing a large interfacial area is necessary. For a pseudo-first-order, irreversible reaction, the enhancement factor in the thin-film (two-film) model is given by Equation (25):
E i , p s f i l m = H a tanh H a
When the reaction rate constant is large and the reaction order is greater than one, the enhancement factor is governed jointly by the Hatta number (Ha) and the infinite enhancement factor (E) from the instantaneous reaction model. In this case, the enhancement factor can be calculated using the following expression:
E i = E 1 H a 3 / 2 + 1 E 3 / 2 2 / 3
E = 1 + D M D E A , L D i , L C M D E A B u l k C i In
For CO2 and COS, the calculation of the mass transfer rate requires the use of the enhancement factor, which is determined by Equation (25) since their absorption occurs primarily within the film. In contrast, the reaction between H2S and MDEA is extremely fast, allowing the enhancement factor to be calculated using the infinite reaction rate model, as given in Equation (27). For CH3SH and C2H6–C6H14, absorption is governed mainly by physical processes; therefore, the influence of chemical reactions does not need to be considered.

2.3. Solution Procedure

The absorption model is solved via a stage-to-stage (tray-by-tray) algorithm:
(i)
With the feed gas and lean-liquid compositions of the absorbed species and the gas-to-liquid (G/L) ratio given, postulate component-wise overall removal fractions to initialize the calculation and thereby estimate the liquid compositions on the bottom (last) tray.
(ii)
Starting from the bottom tray, perform stage calculations upward: for each tray, use the inlet vapor and liquid compositions to compute phase transfer/equilibrium and obtain the outlet compositions, which then serve as the inlet to the tray above.
(iii)
Continue tray by tray to the column top to obtain the overhead gas compositions, from which the actual overall removal of each species across the column is determined.
(iv)
Compare the computed overall removals with the initial assumptions. If the maximum deviation exceeds 1.0 × 10⁻⁴, update the assumptions and iterate until the convergence criterion is satisfied.

3. Modeling Results

3.1. Verification of Henry’s Constants for C5H12 and C6H14

Since no literature data are available for Henry’s constants of C5H12 and C6H14 in pure MDEA, this study employed experimental data for a 50 wt% MDEA aqueous solution to perform correlation calculations, thereby indirectly estimating their solubility in pure MDEA [29,30]. Henry’s constants of C5H12 and C6H14 in a 50 wt% MDEA solution are also presented in this work.
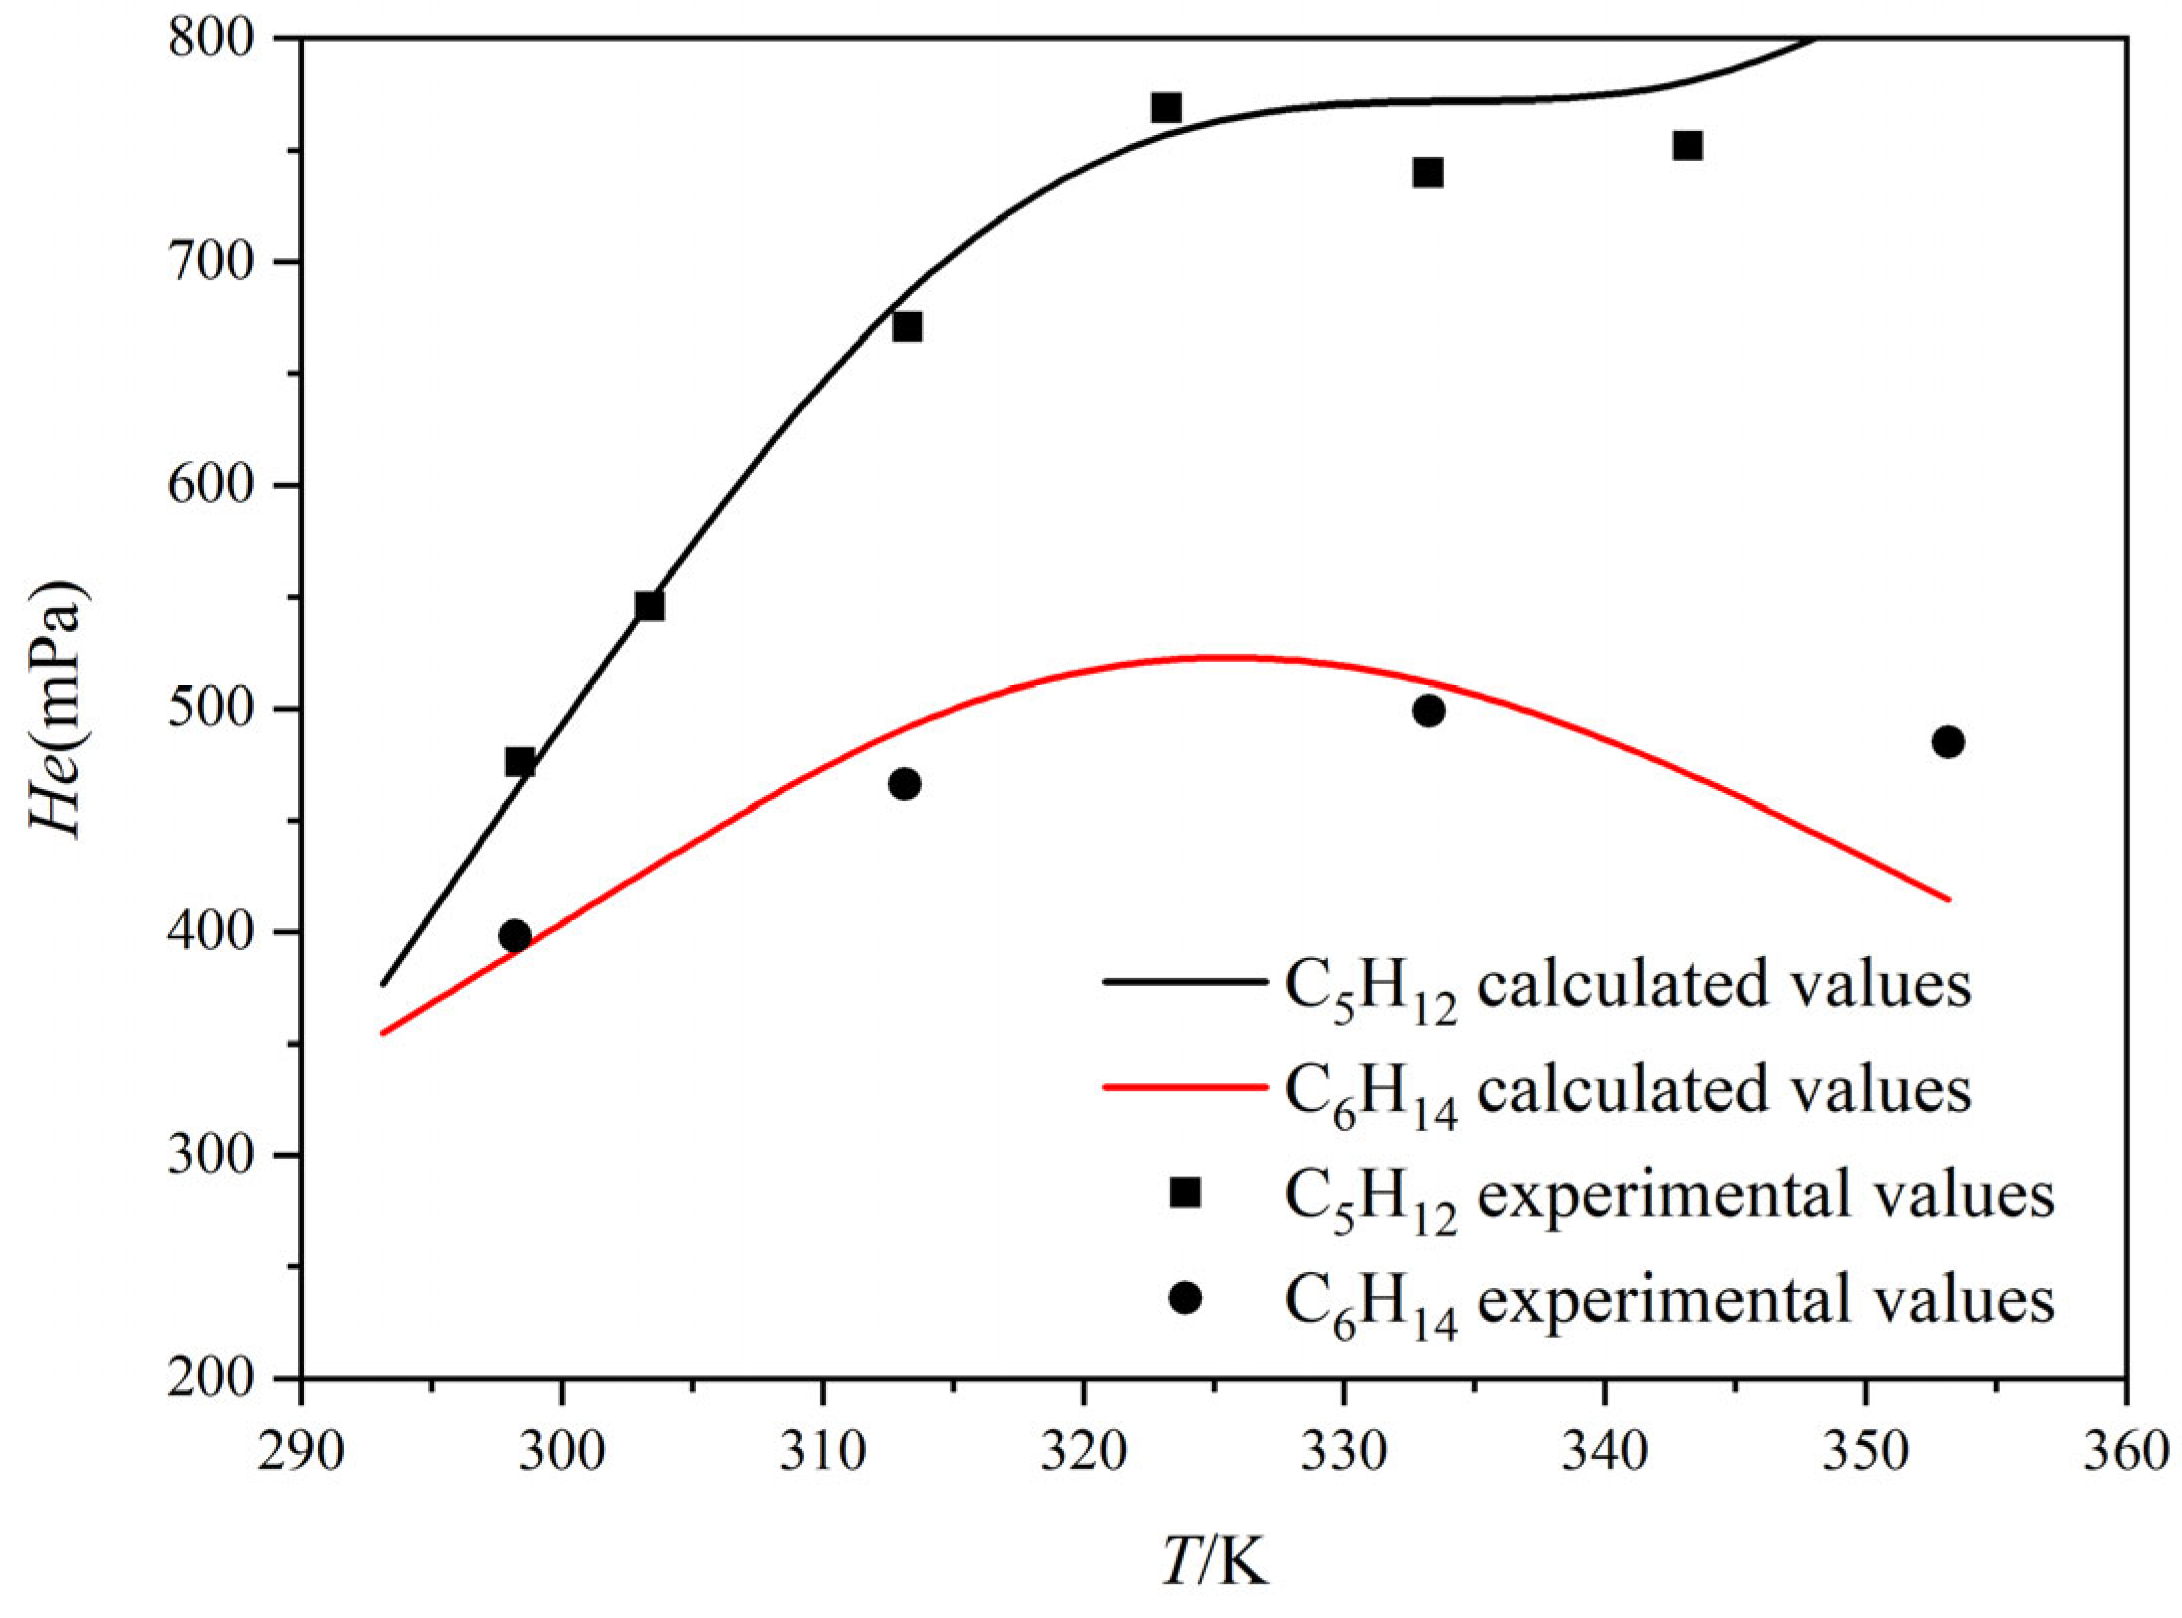
Figure 3 shows the variation in the Henry’s constants (He) of C5H12 and C6H14 in a 50 wt% MDEA aqueous solution with temperature, compared against experimental data. The fitted curves agree closely with the experimental measurements, with a maximum deviation of less than 5%, indicating that the developed correlation model provides good predictive accuracy. This model can reliably describe the solubility behavior of light hydrocarbons in MDEA solutions, thereby offering a robust thermophysical property basis for the subsequent simulation and design of the absorption process.

3.2. Model Validation

3.2.1. Absorption Model

To validate the absorber model, experiments were conducted over a representative operating window: gas–liquid ratio (G/L) 490–720, feed-gas flow 3.8–6.1 × 10⁴ Nm3/d, and absorber pressure 6.1–6.4 MPa. The outlet concentrations of H2S and CO2 remained consistently low at 0.01–0.05 vol%, while COS and methanethiol (CH3SH) varied between 14 and 40 mg/m3. These data capture the absorber’s behavior under varying conditions and provide a robust basis for model validation.
Figure 4 compares the model-predicted and experimentally measured removal efficiencies of CO2, COS, and MSH (methanethiol, CH3SH). The data cluster closely around the parity line (y = x), indicating strong overall agreement. For CO2, nearly all points lie on or near the parity line, with only occasional ~2–3% underestimation under specific conditions, evidencing high predictive fidelity. For COS, predictions follow the measured trend with errors within ±4%. MSH exhibits greater dispersion; nevertheless, the trend is captured, and most deviations remain within ±5%. Taken together, these results show that the model reliably predicts the removal of all three representative impurities and maintains good agreement over a wide operating window, confirming its applicability to industrial process simulation and performance forecasting.

3.2.2. Flash Model

A suite of experiments was conducted to validate the simulation model. The operating ranges were feed gas flow rate 5000–8000 Nm3/h, absorption pressure 3–5 MPa, gas–liquid ratio 350–450; flash-drum liquid flow rate 0.6–1.2 m3/h and flash pressure 0.6 MPa. The equipment specifications were absorber diameter 1.0 m (26 trays; weir width 0.10 m) and desorption/packed column diameter 0.30 m with a 6 m packing height. These data span a representative operating window and are suitable for validating the model for the flashing behavior of C2H6–C6H14 hydrocarbons.
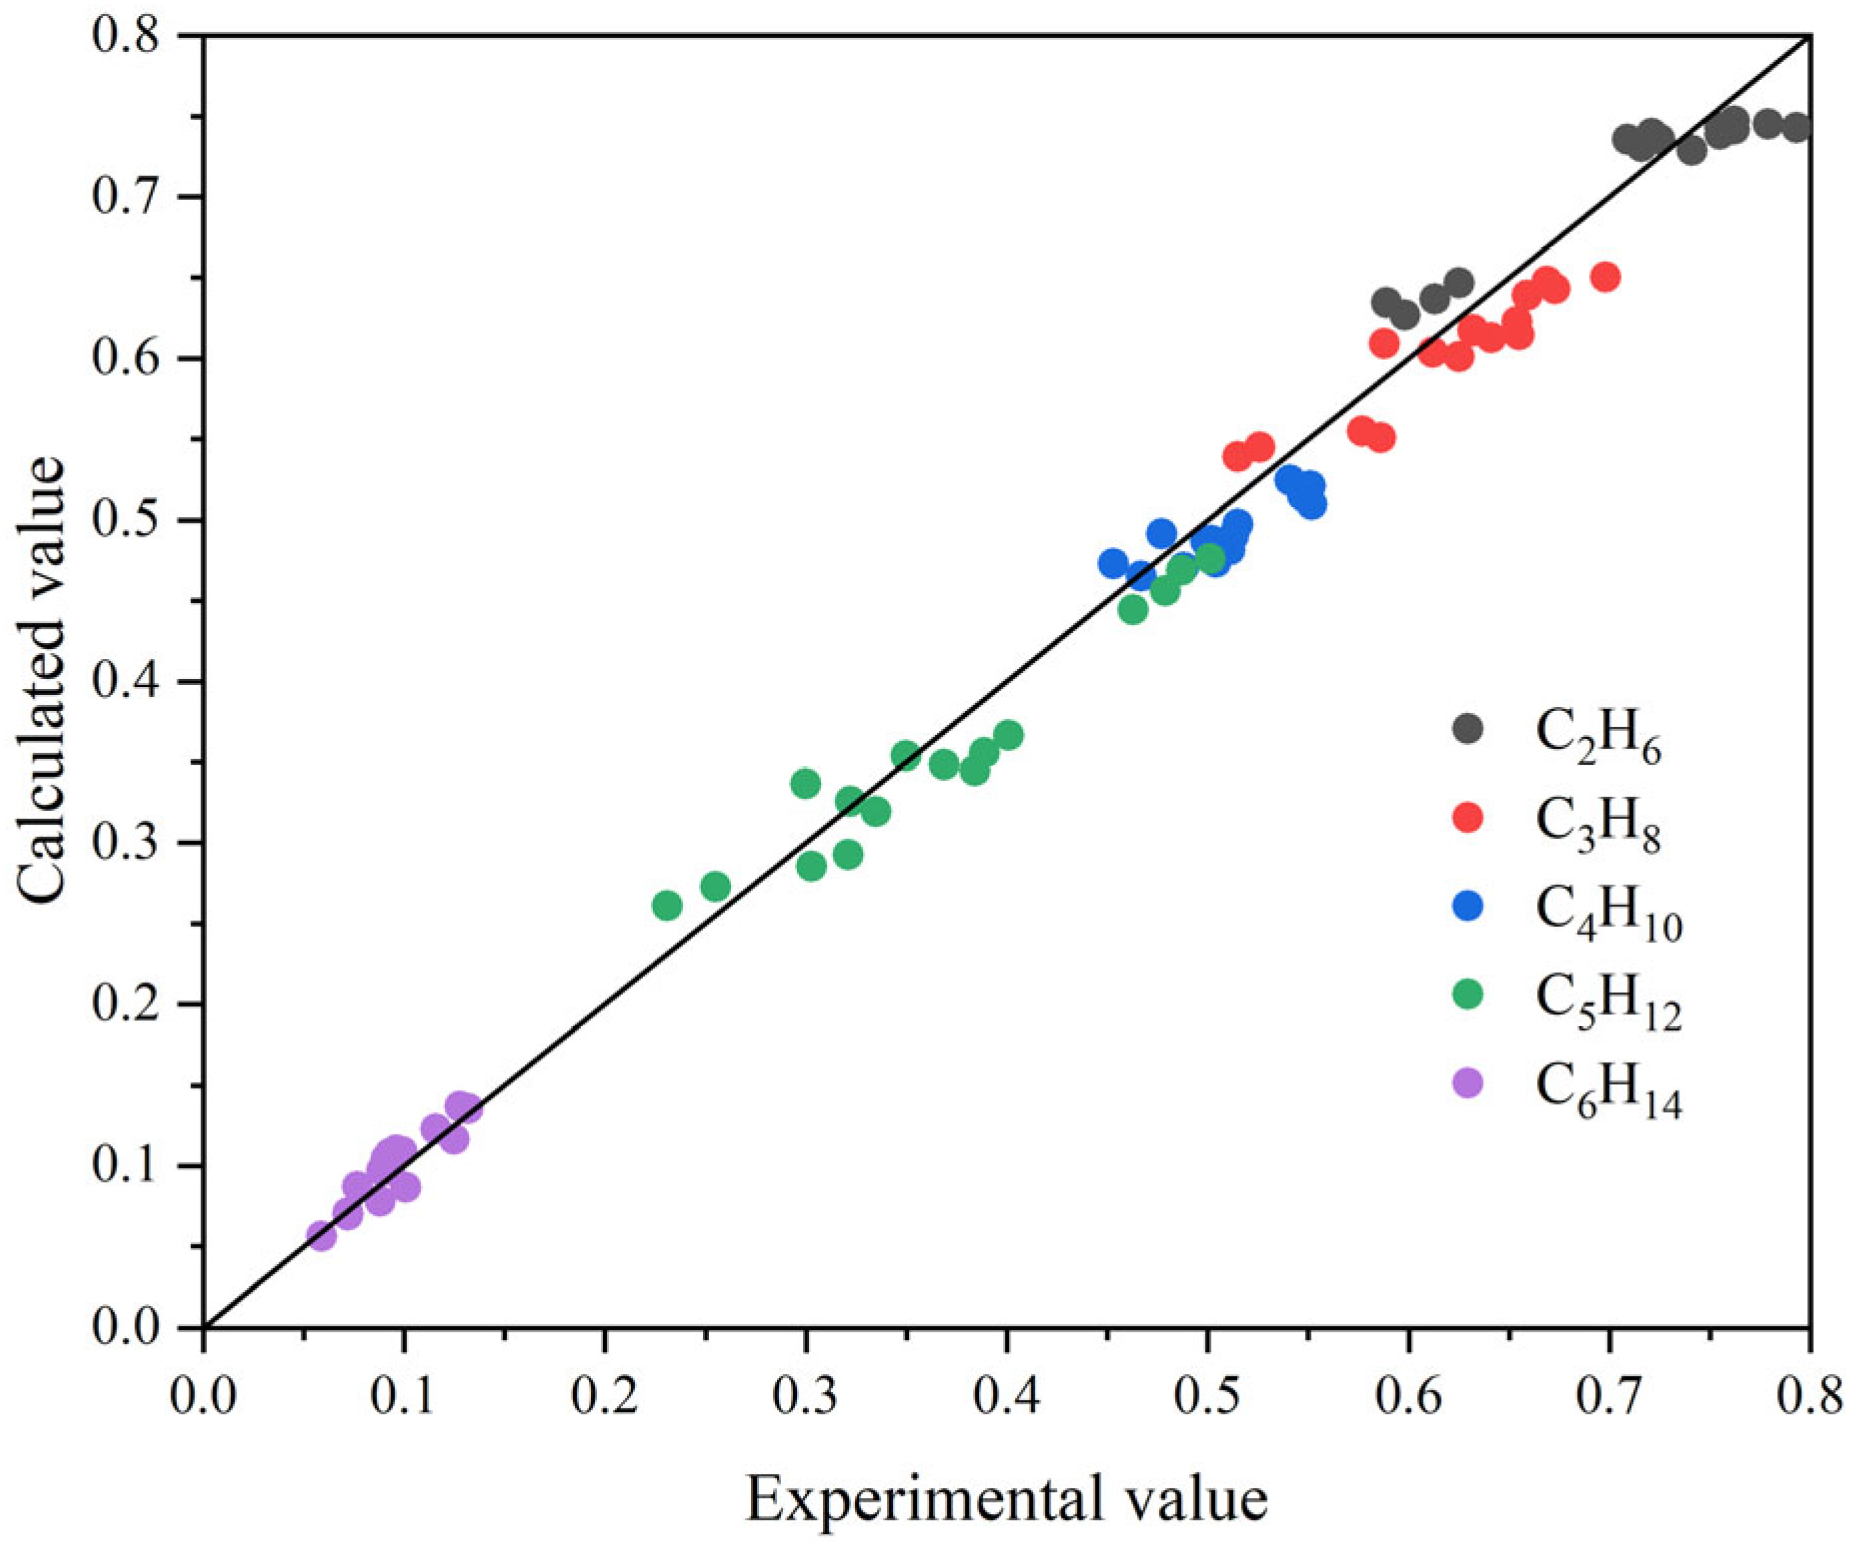
Figure 5 compares the distributions of flash-drum model predictions and experimental measurements for different hydrocarbon species. The scatter lies close to the parity line (y = x), indicating that the model reproduces the flash separation well. Predictions for C2H6 and C3H8 nearly coincide with the measurements (error < ±2%). Results for C4H10 and C5H12 fall essentially along the parity line, with only slight deviations at intermediate concentrations, and C6H14—though present at low levels—still shows consistent agreement. Overall, the model demonstrates high predictive accuracy and strong engineering applicability for light-hydrocarbon separation.
To further strengthen the model validation beyond the parity plots, quantitative error metrics including RMSE, MAE, and R2 were calculated for both the absorption tower and the flash tank (Table 3). The results show that the model predictions agree well with experimental values across most components, with R2 values generally above 0.7, indicating strong correlations. Particularly high accuracy was achieved for COS (R2 = 0.92) and C5H12 (R2 = 0.90), while relatively lower R2 values for C4H10 highlight the challenge of accurately describing heavier hydrocarbon desorption. Overall, these error metrics confirm that the developed rate-based model is capable of reliably reproducing the absorption and desorption behavior of TMS–MDEA systems under various operating conditions.

3.3. Rate-Based Absorption Model Calculations

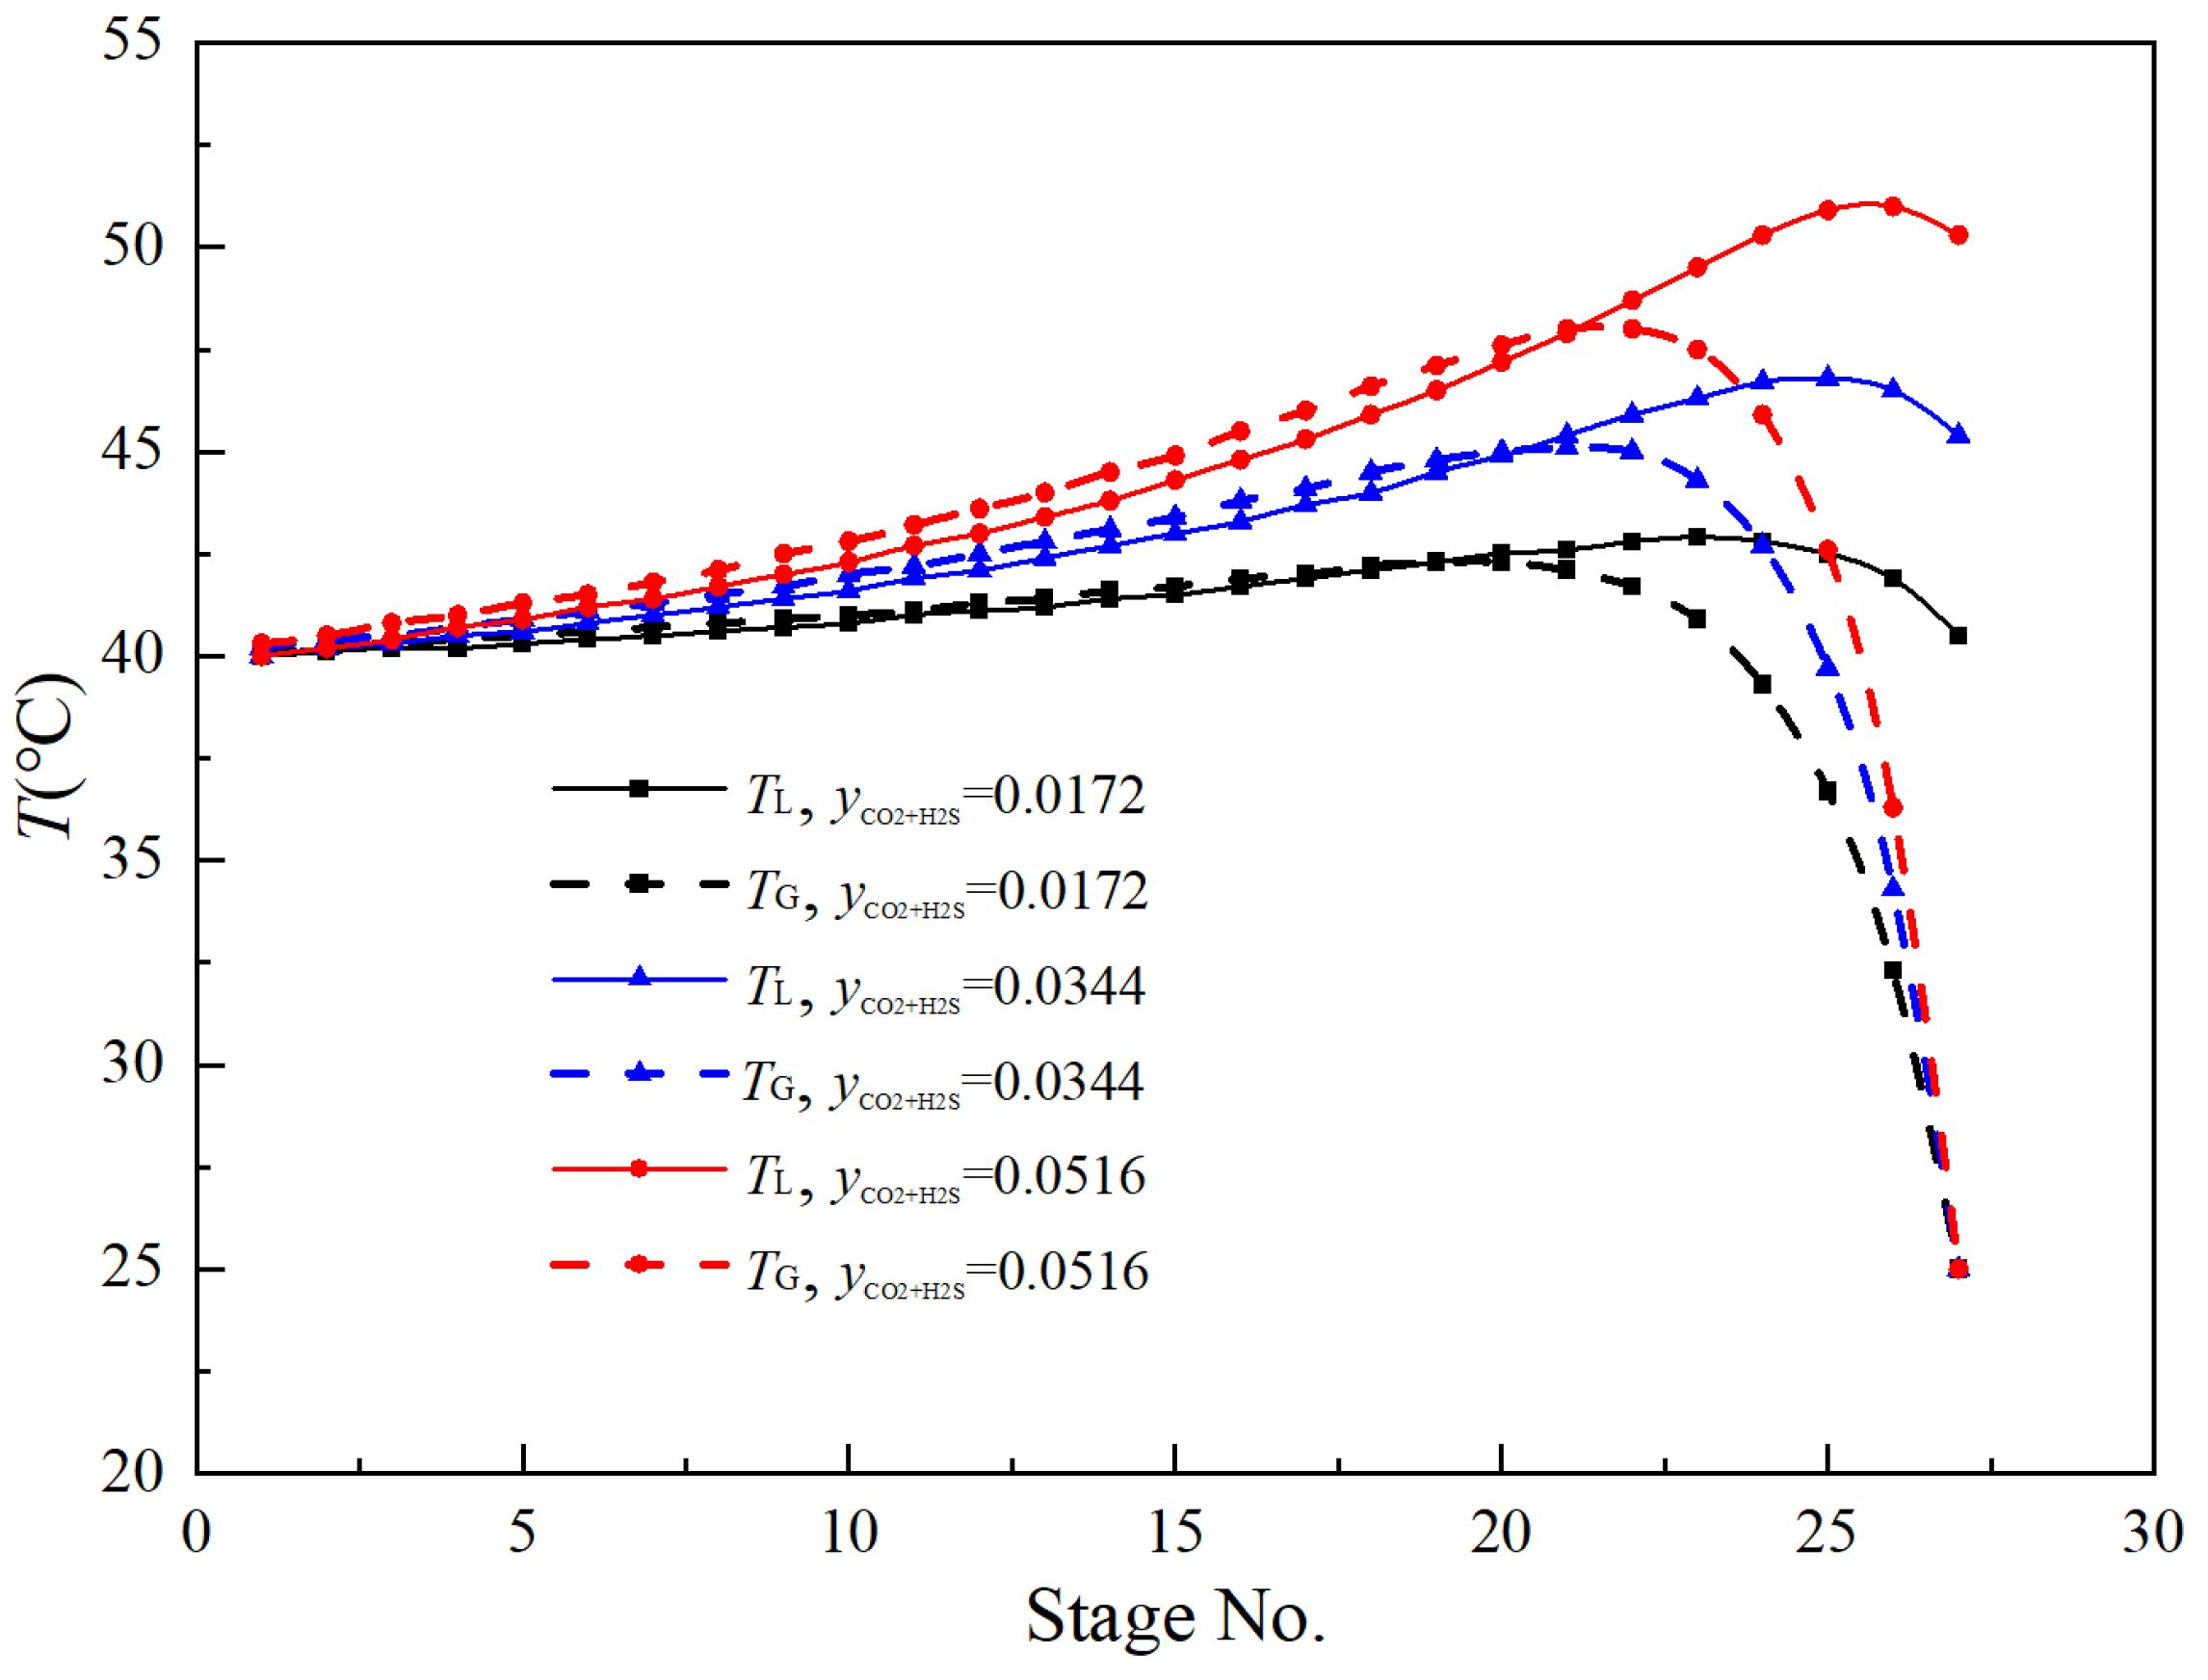
Physical and chemical absorption are often accompanied by pronounced heat effects; the resulting heat release alters the system temperature, thereby influencing mass-transfer behavior and overall absorption efficiency. Figure 6 shows the vapor- and liquid-phase temperature distributions in the column under different H2S and CO2 concentration conditions. For a given solute concentration, the temperature profile along the column height exhibits an initial rise followed by a decline: intense exothermic gas–liquid reactions near the column bottom cause the temperature to increase, whereas toward the top, as the gas is progressively absorbed, the reaction rate and associated heat release diminish sharply, leading to a marked temperature drop in the top section.
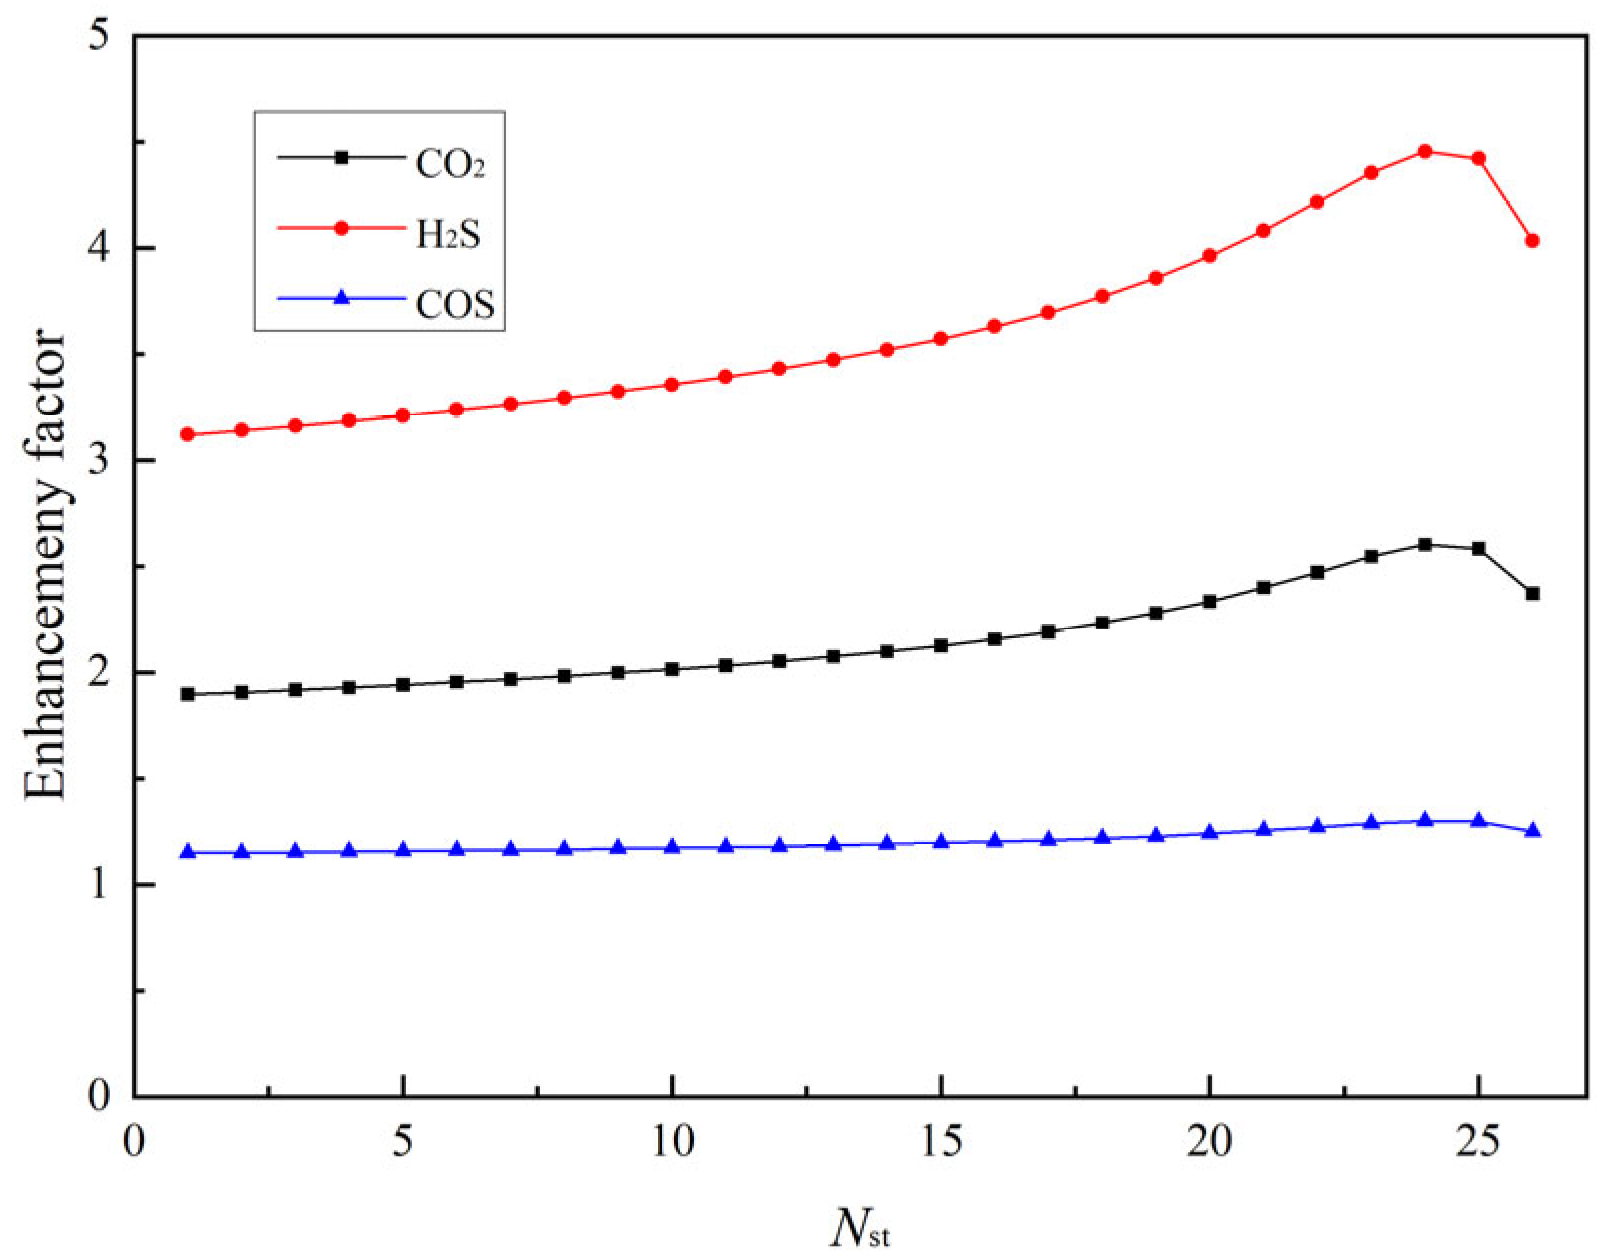
Figure 7 shows the distribution of enhancement factors for different gas components (CO2, H2S, and COS) along the absorption column. H2S shows the highest enhancement factor, attributable to its facile acid–base reaction with MDEA. CO2 shows a moderate enhancement effect, while the enhancement factor of COS remains close to 1, suggesting it is almost unaffected by chemical reactions and relies primarily on physical absorption.
The calculated overall mass transfer coefficients and mass transfer resistances of each component within the absorption column are presented in Figure 8. For CH3SH and H2S, the gas-phase mass transfer resistance accounts for approximately 17–19% and 14–18% of the total mass transfer resistance, respectively, indicating that gas-phase resistance cannot be neglected. In contrast, for CO2 and COS, the gas-phase mass transfer resistance is almost negligible.
The calculated overall gas-phase mass transfer coefficients (KGa) and the fractional contributions of gas-phase resistance (αf) for different components are shown in Figure 8. Here, αf is defined as the ratio of the gas-side resistance (kGa) to the total resistance 1/KGa), i.e., αf = (1/kGa)/(1/KGa). For CH3SH and H2S, αf reaches approximately 17–19% and 14–18%, respectively, indicating that the gas-side resistance constitutes a considerable portion of the overall resistance and thus cannot be neglected. This observation is consistent with earlier studies on hydrocarbons and sulfur compounds in alkanolamine systems, which also reported the non-negligible role of gas-side resistance under comparable conditions [35,36,37,38]. In contrast, for CO2 and COS, αf remains close to zero, confirming that their absorption is almost entirely governed by liquid-phase mass transfer.

3.4. Influence of Operating Parameters

Based on the developed thermodynamics–absorption coupled model, a systematic analysis was conducted to evaluate the effects of key operating parameters—such as the number of trays, weir height, column diameter, operating pressure, and gas–liquid ratio—on the removal efficiency of target components in natural gas. Figure 9 illustrates the influence of the number of trays on the outlet concentrations of different components. The results show that as the number of trays increases, the outlet concentrations of all components gradually decrease. Among them, H2S exhibits the most pronounced decrease, indicating that the number of trays has the greatest impact on its absorption performance. Further examination of Figure 9b reveals that the removal efficiency of H2S in the absorption column can reach 100%, demonstrating that it can be almost completely removed. This phenomenon is primarily attributed to the fact that increasing the number of trays enhances the mass transfer efficiency between the gas and liquid phases, prolongs the contact time, and thereby promotes the absorption reaction, leading to improved removal of acidic gases.
Figure 10 illustrates the effect of weir height on the removal performance of different gas components in the packed absorption column. As shown in Figure 10a, increasing the weir height significantly reduces the outlet concentration of H2S, from an initial 137.0 to 2.0 mg/m3. In contrast, the outlet concentrations of COS and CH3SH change only slightly, with CH3SH remaining almost constant. In Figure 10b, the removal efficiency of H2S remains close to 100% at all weir heights. The removal efficiency of COS increases gradually with weir height, suggesting that its absorption process is more strongly limited by mass transfer. CO2 shows the most pronounced improvement, with removal efficiency rising from 52% to 74%. The absorption efficiency of CH3SH shows a slight increase but consistently remains above 90%, indicating a certain absorption capacity yet limited potential for further improvement. This may be due to higher concentrations of CO2 and H2S in the liquid phase, which inhibit CH3SH dissolution.
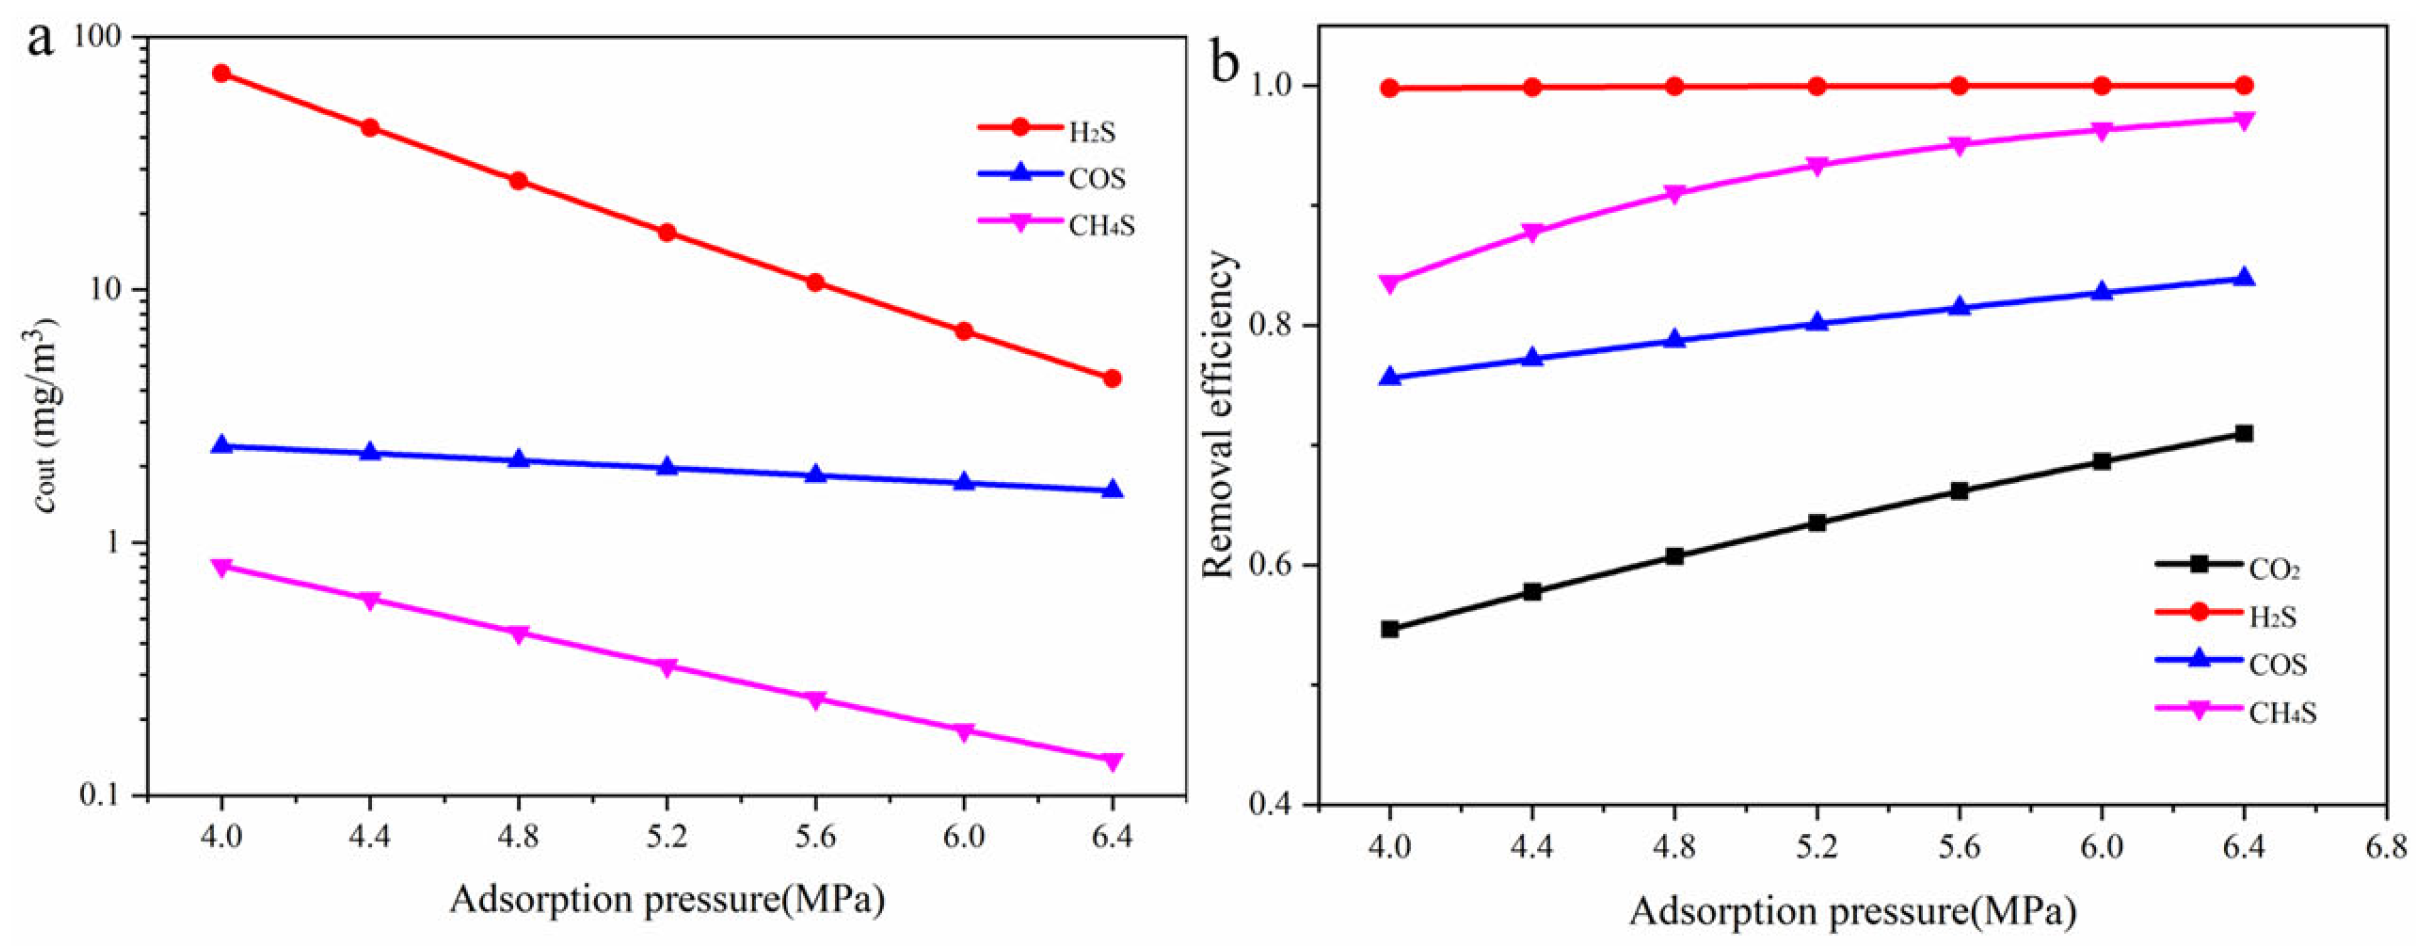
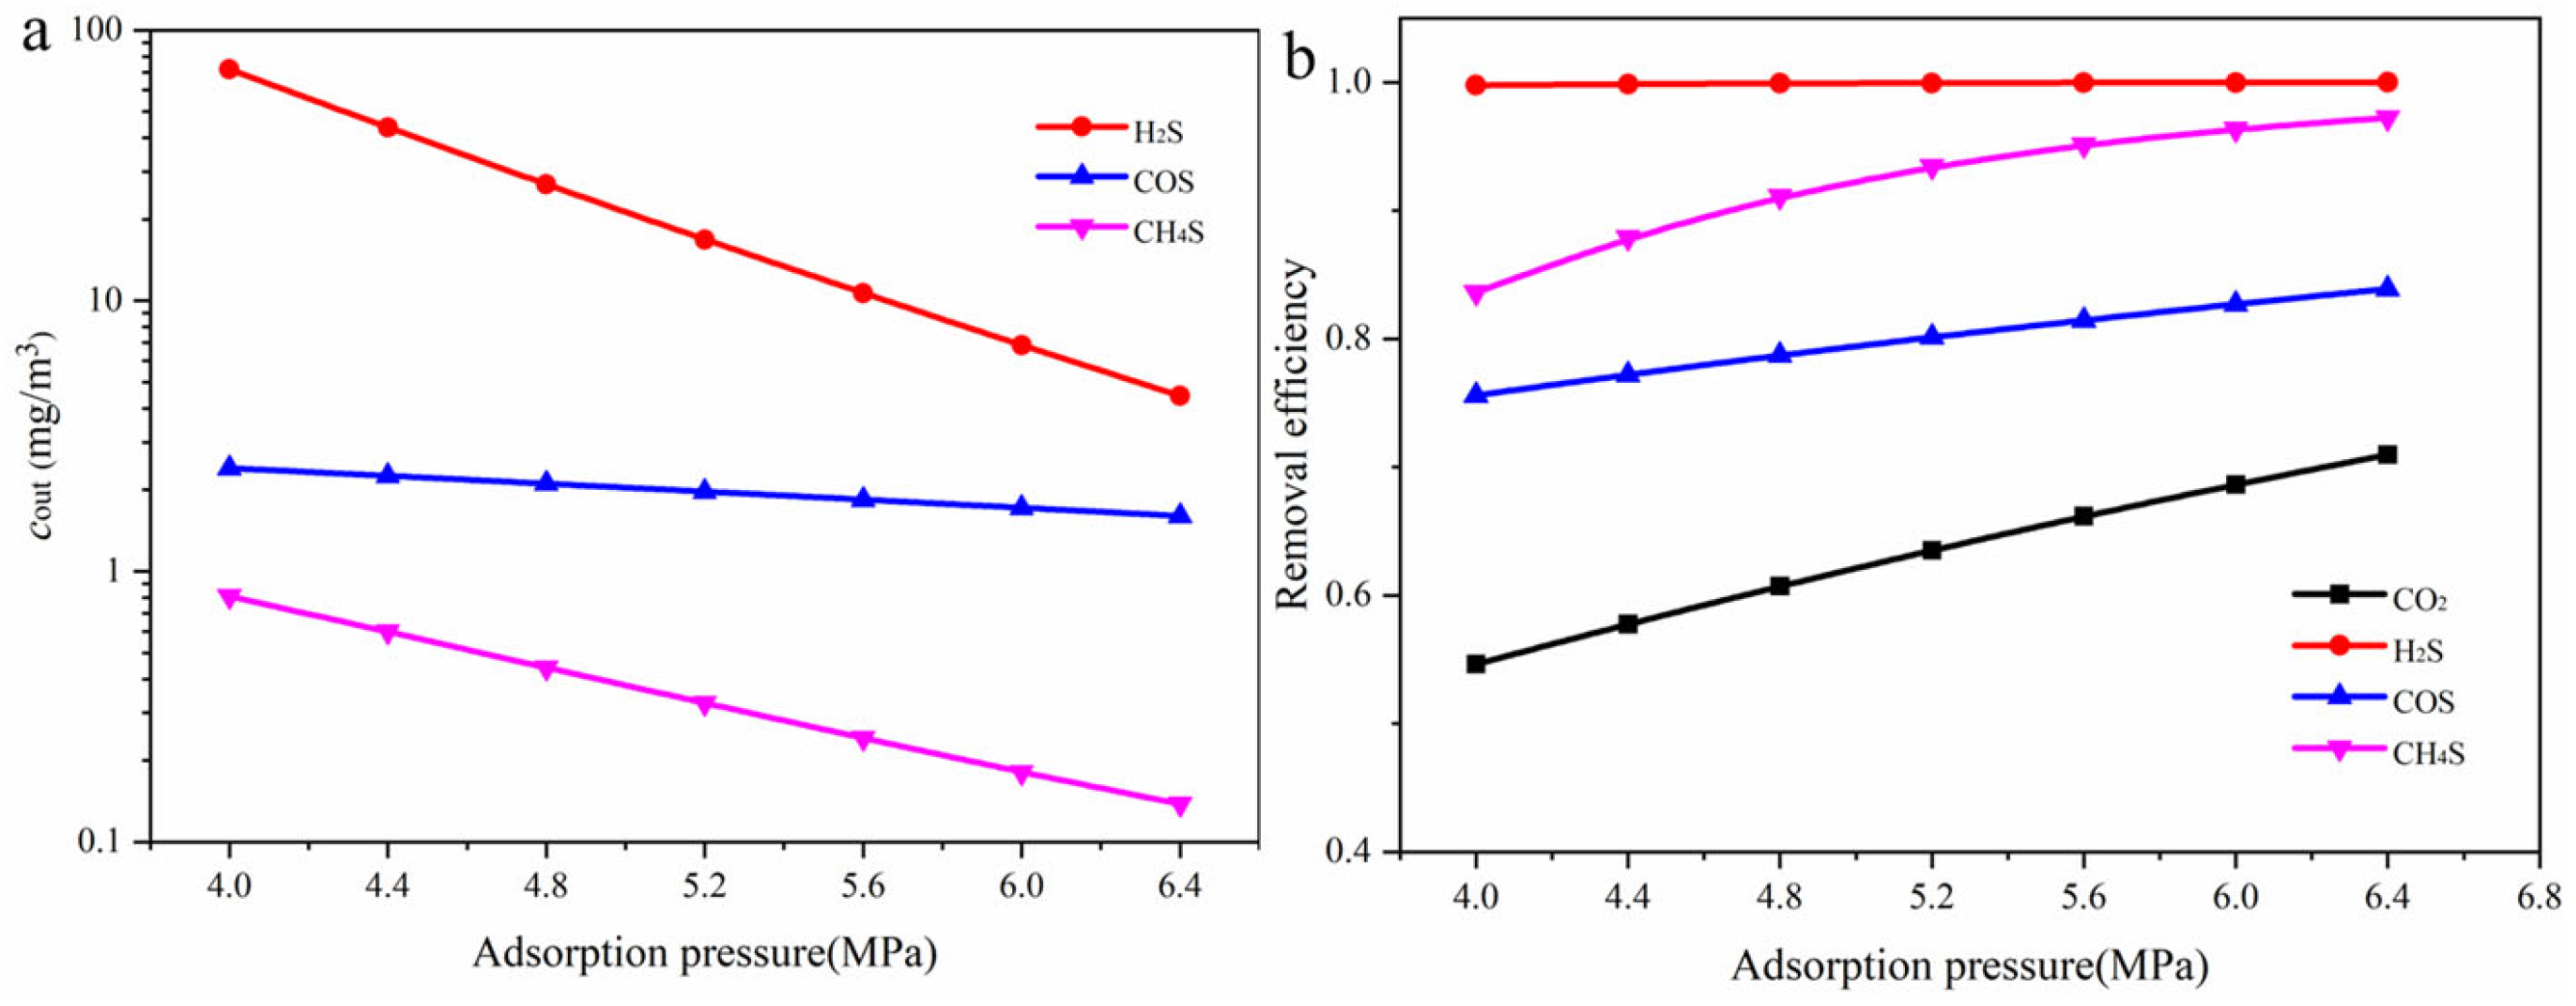
The effect of operating pressure on the removal efficiency of each component is shown in Figure 11. As illustrated in Figure 11a, increasing the operating pressure significantly reduces the outlet concentrations of all gas components, indicating an overall enhancement in absorption performance. H2S exhibits the most pronounced concentration decrease. The outlet concentration of CH3SH also decreases markedly with increasing pressure. In contrast, the concentration reduction for COS is more gradual, suggesting that its absorption may be influenced by chemical reaction kinetics or solvent selectivity. Figure 11b further shows that the removal efficiency of H2S remains close to 100% across the entire pressure range, demonstrating its high reactivity with MDEA and its ability to be effectively removed even at lower pressures. The removal efficiency of CO2 increases from approximately 55% to 71%, showing strong pressure sensitivity. The removal efficiencies of COS desorption performance and CH3SH increase to around 83% and 97%, respectively, indicating that higher operating pressures effectively intensify gas–liquid mass transfer and improve the absorption of organic sulfur compounds. The influence of the acid gas content in the feed gas(y(CO2 + H2S) on the absorption efficiency of each component is shown in Figure 12. As the acid gas content increases, the outlet concentration of H2S rises significantly, while the concentrations of COS and CH3SH remain relatively stable.
The effect of the gas–liquid ratio on the removal efficiency of each component is shown in Figure 13. The gas–liquid ratio has a pronounced impact on the absorption efficiency of CH3SH. When the gas–liquid ratio increases from 400 to 700, the absorption efficiency of CH3SH decreases from 0.97 to 0.79, indicating that increasing the liquid-phase flow rate favors the physical absorption process and thereby improves its removal efficiency. In contrast, the absorption efficiencies of CO2 and COS show no significant change within the examined range of gas–liquid ratios.
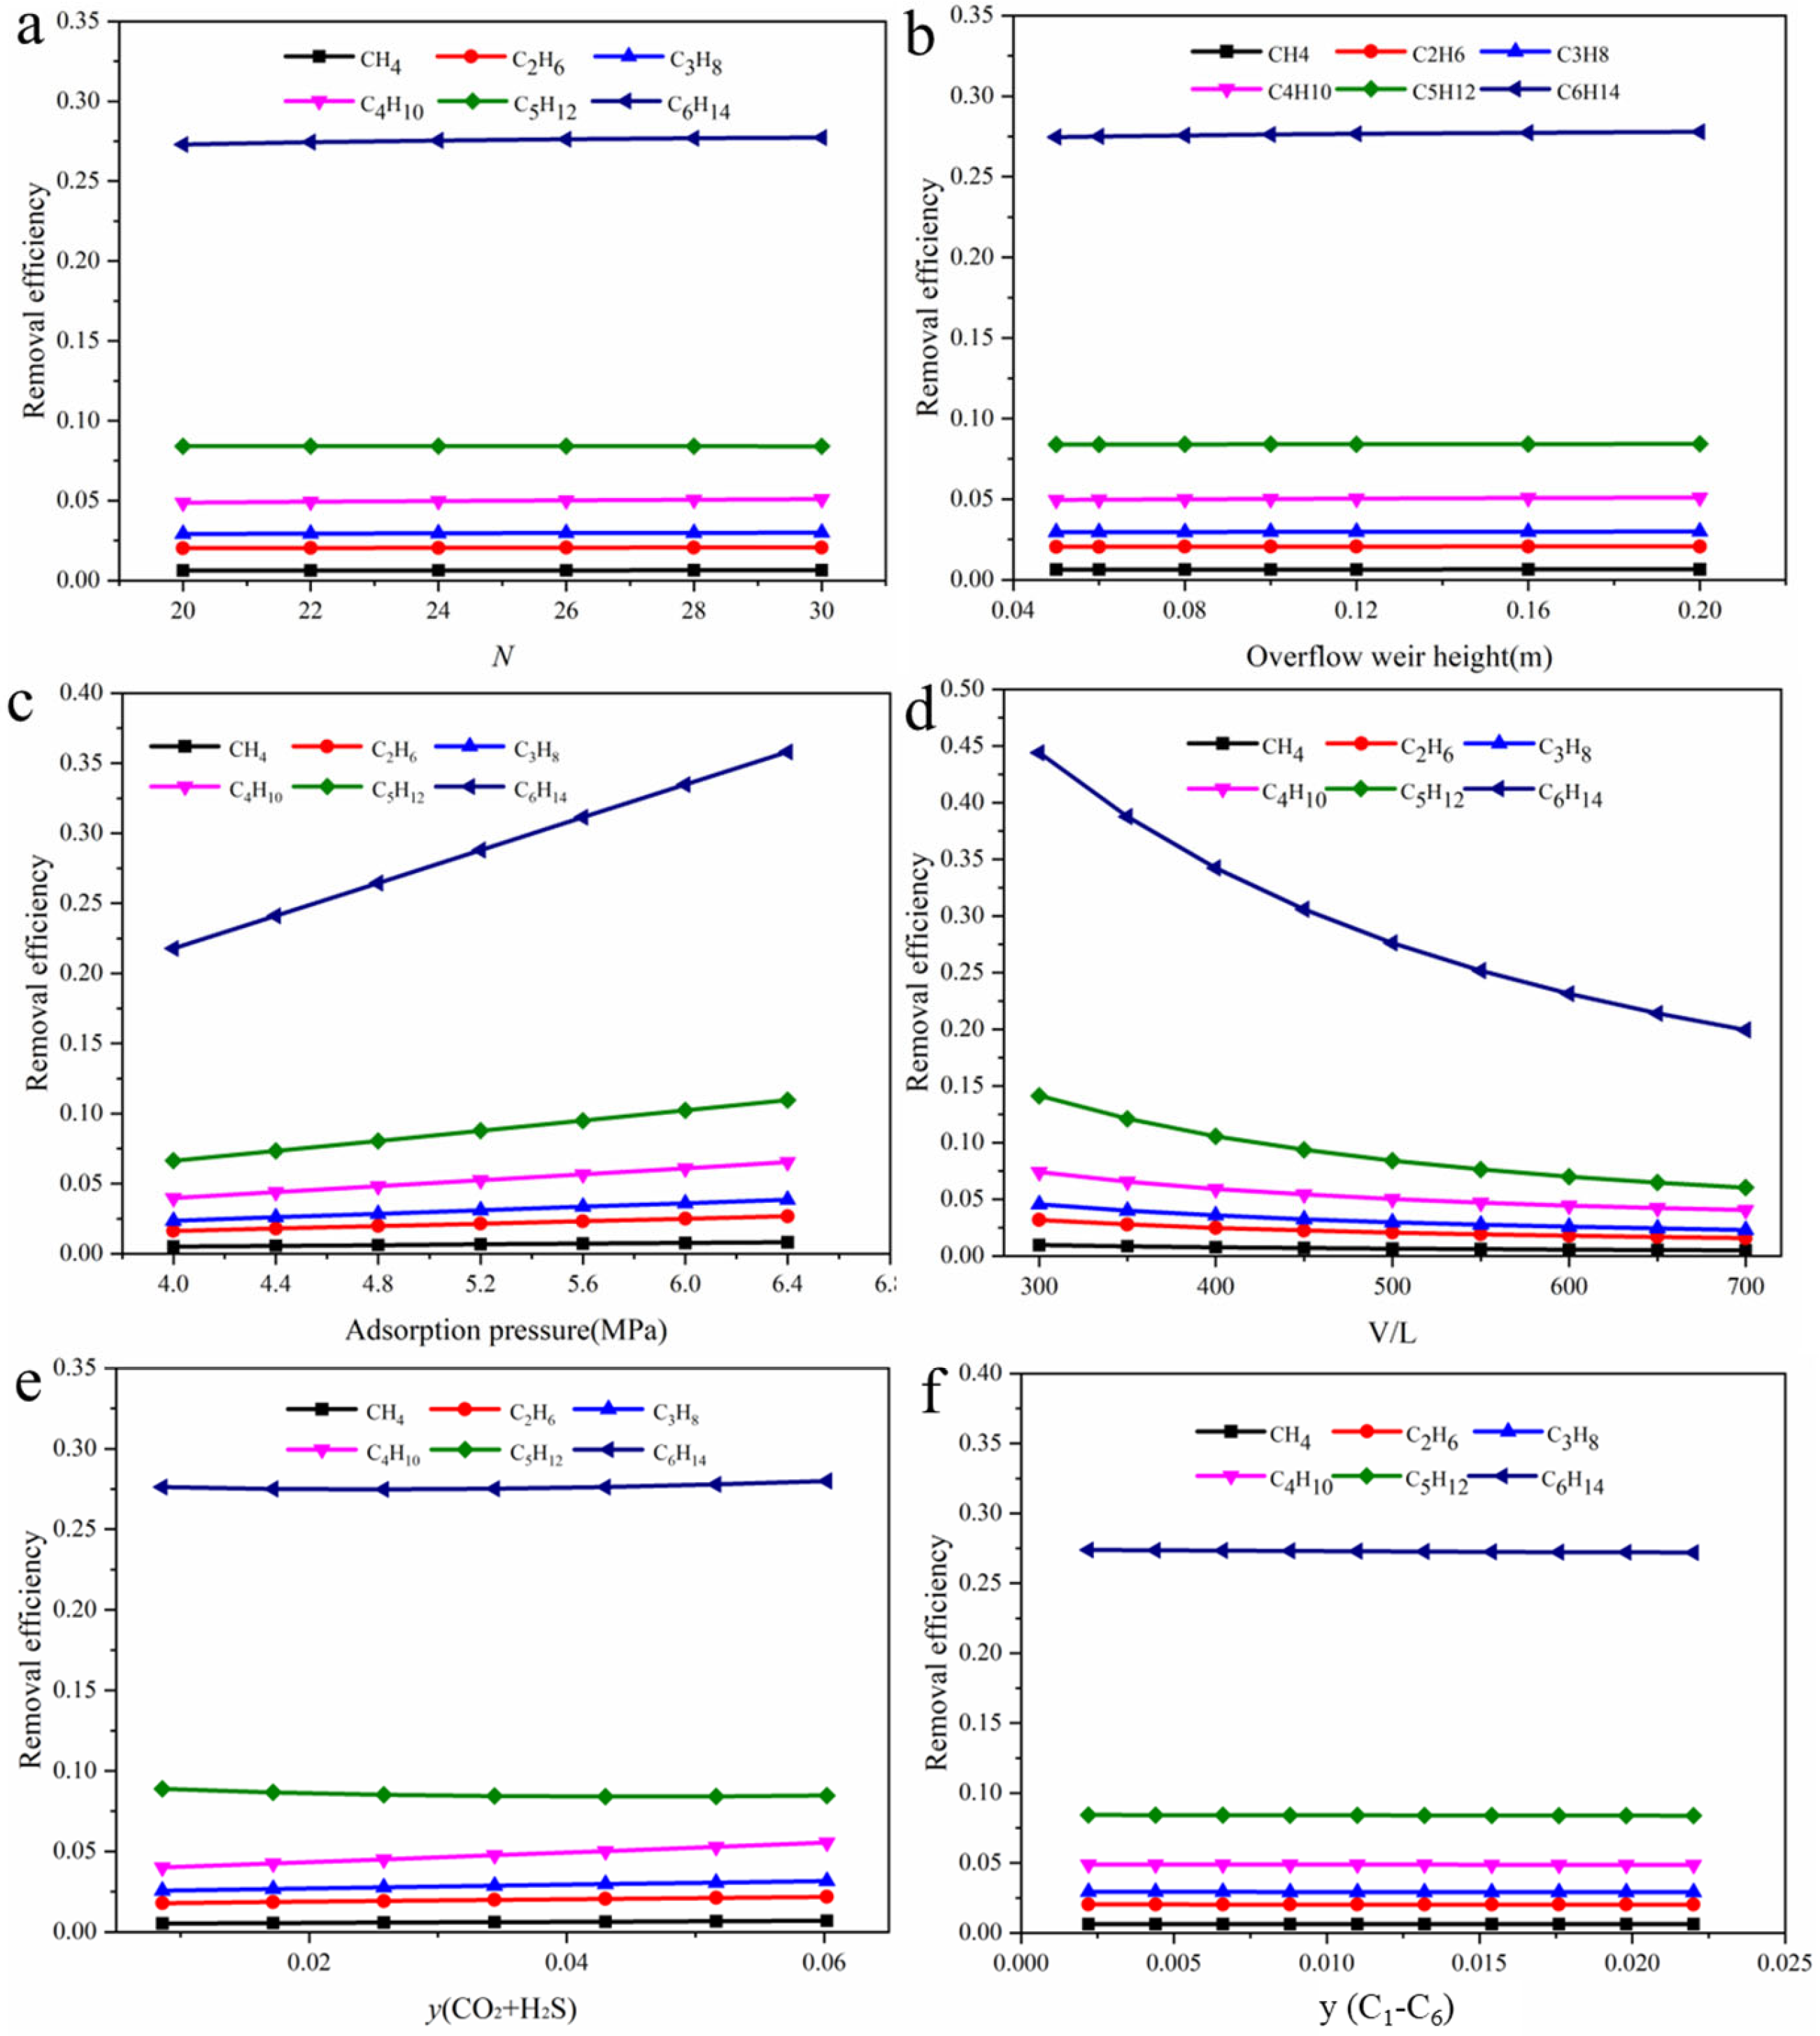
Figure 14 presents the dissolution behavior of hydrocarbons in the absorbent solution within the absorber column under different operating conditions. The solubility of hydrocarbons in the solvent increases gradually with the number of carbon atoms, indicating that hydrocarbons with longer carbon chains are more readily dissolved by the absorbent. This trend may be related to their polarity, intermolecular interactions, and solubility parameters. Notably, operating pressure and gas–liquid ratio have the most significant impact on the absorption efficiency of hydrocarbons. When the operating pressure increases from 4.0 to 6.4 MPa, the solubility of all hydrocarbons rises, with C6H14 showing the most pronounced improvement. Its absorption efficiency increases from 0.22 to 0.36,demonstrating its high sensitivity to pressure changes. In contrast, an increase in the gas–liquid ratio generally reduces the solubility of light hydrocarbons in the solvent, indicating that a higher gas–liquid ratio weakens the driving force for absorption. For example, the absorption efficiency of C6H14 decreases from 0.44 to 0.20, the largest drop among the hydrocarbons studied, further confirming its strong responsiveness to changes in the gas–liquid ratio.
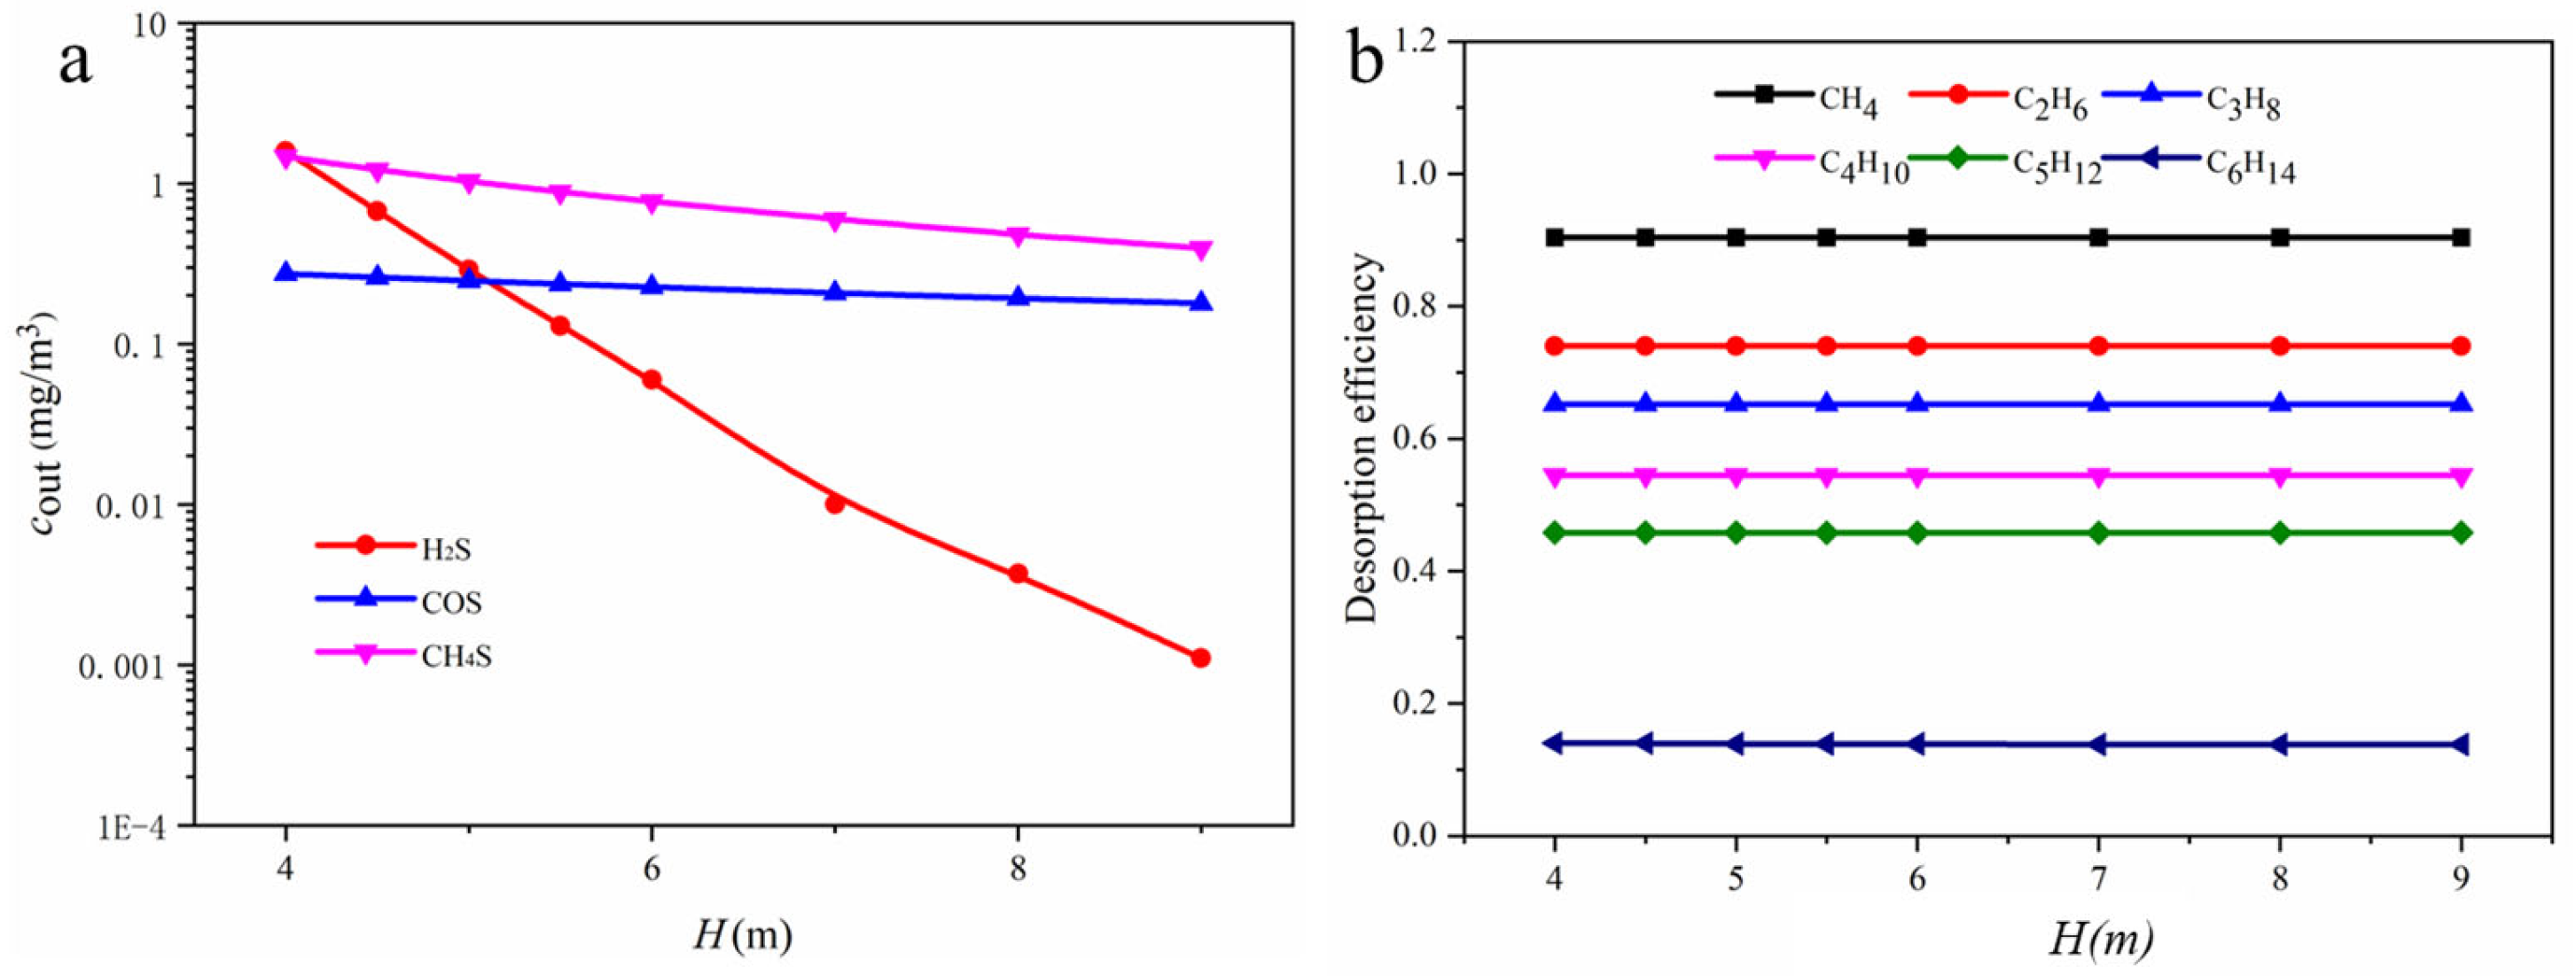
As shown in Figure 15a, when the flash drum pressure decreases from 0.6 MPa to 0.3 MPa, the desorption rate of all gas components increases. Under these conditions, the outlet concentrations of H2S and CH3SH from the flash drum increased to 2.26 mg/m3 and 15.886 mg/m3, respectively. The influence of operating pressure on hydrocarbon desorption performance is presented in Figure 15b. At the same operating pressure, hydrocarbons with fewer carbon atoms are more easily desorbed. CH4 exhibits the highest desorption efficiency, readily evolving from the solution and making it a promising target product for further recovery. In contrast, C6H14 is the most difficult to desorb, with a considerable fraction remaining dissolved in the solution.
Figure 16 investigates the effect of varying the absorption liquid flow rate in the packed column on the composition of the flash gas. When the liquid flow rate increases from 0.40 to 2.0 m3/h, the outlet concentration of H2S decreases from 4.33 to 0.02 mg/m3, and that of CH3SH decreases from 24.64 to 0.063 mg/m3. This indicates that by adjusting the liquid flow rate in the packed column, complete reabsorption of acidic components can be achieved, preventing acid gases from being discharged along with hydrocarbons. The effect of liquid flow rate on the hydrocarbons present in the flash gas is relatively minor. In contrast, the carbon number of hydrocarbons has a significant influence on desorption efficiency: as the number of carbon atoms increases, desorption becomes more difficult. CH4 is the most readily desorbed, with a stable desorption rate of about 91%, while C6H14 is the most difficult to desorb.
Figure 17 examines the effect of packing height on the concentration of various gas components in the flash gas. When the packing height increases from 4.0 to 9.0 m, the H2S concentration decreases from 1.6 to 0.001 mg/m3. The change in packing height has little effect on the desorption of hydrocarbon components in the flash gas. As the packing height increases, the desorption rate of methane remains stable at approximately 91% with no significant variation, indicating that when the packing height exceeds 3 m, hydrocarbons have already reached physical absorption equilibrium.
Foaming during cyclic operation is primarily attributed to the accumulation of dissolved C2–C6 hydrocarbons. Reducing the flash-drum pressure effectively strips these hydrocarbons from the solvent, thereby suppressing foam formation and lowering their concentration in the circulating amine. Although an increased number of trays enhances C2–C6 absorption and could potentially exacerbate foaming, a sufficient tray count is already required to achieve efficient removal of CO2 and sulfur species; under these conditions, most C2–C6 hydrocarbons have already been absorbed, rendering the incremental impact of tray number on foaming negligible. The gas–liquid ratio exhibits an opposite effect: a higher G/L improves overall gas absorption, but the corresponding increase in solvent circulation dilutes the hydrocarbon concentration in the liquid phase, reducing the foaming tendency. Because flash regeneration decreases the C2–C6 content of the lean amine entering the absorber, foaming was effectively mitigated in this design and was therefore not examined in detail. Beyond separation efficiency, industrial feasibility also depends on energy consumption, solvent stability, and environmental considerations. In this regard, flash regeneration offers the benefit of reduced reboiler duty, while the incorporation of TMS suppresses hydrocarbon-induced foaming and limits volatility losses. Combined with the lower solvent circulation rate, these improvements translate into reduced operating costs and a smaller environmental footprint.

4. Conclusions

This study developed and validated a rigorous rate-based absorption model integrated with an improved thermodynamic framework to evaluate the absorption and desorption behavior of TMS–MDEA aqueous solutions for natural gas purification. Verified against 50 sets of industrial and experimental data, the model achieved high predictive accuracy (R2 > 0.98, deviations < 5%). Simulation results show that H2S can be almost completely removed, while CO2 and COS reach 70–85% and 75–83% removal, respectively, and CH3SH consistently exceeds 90%. Hydrocarbon solubility increases with carbon number, with absorption strongly influenced by pressure and the gas–liquid ratio; by contrast, for desorption, CH4 is easily released, but heavier species such as C6H14 are difficult to strip.
Beyond separation performance, the study highlights practical implications. Flash regeneration effectively lowers energy demand compared with conventional steam stripping, while the addition of TMS suppresses hydrocarbon-induced foaming and reduces volatility losses. Foaming mainly arises from accumulated C2–C6 hydrocarbons, mitigated by higher gas–liquid ratios or lower flash pressures. Continuous monitoring and periodic reclaiming are, therefore, essential for long-term stability. Overall, TMS–MDEA solvents demonstrate strong technical effectiveness and industrial viability, combining efficient acid-gas removal with reduced regeneration energy, improved stability, and lower environmental impact.

Author Contributions

Conceptualization, C.Y. and Y.J.; methodology, J.X.; software, C.Y.; validation, Y.J., K.L. and C.Z.; formal analysis, Y.J.; investigation, K.L.; resources, K.L.; data curation, Y.J. and Z.L.; writing—original draft preparation, C.Y. and J.X.; writing—review and editing, C.Y. and J.X.; visualization, C.Y. and J.X.; supervision, K.L.; project administration, C.Z.; funding acquisition, Z.L. All authors have read and agreed to the published version of the manuscript.

Funding

This research received no external funding.

Data Availability Statement

The original contributions presented in this study are included in the article. Further inquiries can be directed to the corresponding author.

Conflicts of Interest

All the authors were employed by the PetroChina Southwest Oil and Gasfeild Company. All the authors declare that the research was conducted in the absence of any commercial or financial relationships that could be construed as potential conflicts of interest.

Abbreviations

The following abbreviations are used in this manuscript:
NGNatural gas
MDEAMethyldiethanolamine
TMSTetramethylene sulfone
G/LGas–liquid ratio
MEAMonoethanolamine
DEADiethanolamine
ILsIonic liquids
DESDeep eutectic solvents
RMSERoot mean square error
MAEMean absolute error
R2Coefficient of determination
SymbolDefinitionUnit
HiHenry’s constant of component iPa
KG,iOverall gas-phase mass transfer coefficient of component imol·m−2·s−1·Pa−1
KL,iOverall liquid-phase mass transfer coefficient of component imol·m−2·s−1
EiEnhancement factor
HaHatta number
γiActivity coefficient of component i
ϕiFugacity coefficient of component i
aiActivity of component i
xiMole fraction of component i in liquid phase
yiMole fraction of component i in vapor phase
fUnreacted MDEA ratio
RUniversal gas constantJ·mol−1·K−1
ΔHHeat of absorption/desorptionkJ·mol−1

References

  1. Mubashir, M.; Ashena, R.; Bokhari, A.; Mukhtar, A.; Saqib, S.; Ali, A.; Saidur, R.; Khoo, K.S.; Ng, H.S.; Karimi, F.; et al. Effect of process parameters over carbon-based ZIF-62 nano-rooted membrane for environmental pollutants separation. Chemosphere 2022, 291, 133006. [Google Scholar] [CrossRef] [PubMed]
  2. Tawfik, A.; Nasr, M.; Galal, A.; El-Qelish, M.; Yu, Z.; Hassan, M.A.; Salah, H.A.; Hasanin, M.S.; Meng, F.; Bokhari, A.; et al. Fermentation-based nanoparticle systems for sustainable conversion of black-liquor into biohydrogen. J. Clean. Prod. 2021, 309, 127349. [Google Scholar] [CrossRef]
  3. Wainaina, S.; Awasthi, M.K.; Horváth, I.S.; Taherzadeh, M.J. Anaerobic digestion of food waste to volatile fatty acids and hydrogen at high organic loading rates in immersed membrane bioreactors. Renew. Energy 2020, 152, 1140–1148. [Google Scholar] [CrossRef]
  4. Asif, S.; Ahmad, M.; Bokhari, A.; Chuah, L.F.; Klemeš, J.J.; Akbar, M.M.; Sultana, S.; Yusup, S. Methyl ester synthesis of Pistacia khinjuk seed oil by ultrasonic-assisted cavitation system. Ind. Crops Prod. 2017, 108, 336–347. [Google Scholar] [CrossRef]
  5. Shirazizadeh, H.A.; Haghtalab, A. Simultaneous solubility measurement of (ethyl mercaptan + carbon dioxide) into the aqueous solutions of (N-methyl diethanolamine + sulfolane + water). J. Chem. Thermodyn. 2019, 133, 111–122. [Google Scholar] [CrossRef]
  6. Amararene, F.; Bouallou, C. Kinetics of Carbonyl Sulfide (COS) Absorption with Aqueous Solutions of Diethanolamine and Methyldiethanolamine. Ind. Eng. Chem. Res. 2004, 43, 6136–6141. [Google Scholar] [CrossRef]
  7. Huttenhuis, P.J.G.; Agrawal, N.J.; Versteeg, G.F. Solubility of Carbon Dioxide and Hydrogen Sulfide in Aqueous N-Methyldiethanolamine Solutions. Ind. Eng. Chem. Res. 2009, 48, 4051–4059. [Google Scholar] [CrossRef]
  8. Xu, S.; Wang, Y.-W.; Otto, F.D.; Mather, A.E. The physicochemical properties of the mixed solvent of 2-piperidineethanol, sulfolane and water. J. Chem. Technol. Biotechnol. 1993, 56, 309–316. [Google Scholar] [CrossRef]
  9. Olajire, A.A. CO2 capture and separation technologies for end-of-pipe applications—A review. Energy 2010, 35, 2610–2628. [Google Scholar] [CrossRef]
  10. Tagliabue, M.; Farrusseng, D.; Valencia, S.; Aguado, S.; Ravon, U.; Rizzo, C.; Corma, A.; Mirodatos, C. Natural gas treating by selective adsorption: Material science and chemical engineering interplay. Chem. Eng. J. 2009, 155, 553–566. [Google Scholar] [CrossRef]
  11. Sifat, N.S.; Haseli, Y. A Critical Review of CO2 Capture Technologies and Prospects for Clean Power Generation. Energies 2019, 12, 4143. [Google Scholar] [CrossRef]
  12. Salvinder, K.M.S.; Zabiri, H.; Isa, F.; Taqvi, S.A.; Roslan, M.A.H.; Shariff, A.M. Dynamic modelling, simulation and basic control of CO2 absorption based on high pressure pilot plant for natural gas treatment. Int. J. Greenh. Gas Control 2018, 70, 164–177. [Google Scholar] [CrossRef]
  13. Asif, K.; Lock, S.S.M.; Taqvi, S.A.A.; Jusoh, N.; Yiin, C.L.; Chin, B.L.F.; Loy, A.C.M. A Molecular Simulation Study of Silica/Polysulfone Mixed Matrix Membrane for Mixed Gas Separation. Polymers 2021, 13, 2199. [Google Scholar] [CrossRef] [PubMed]
  14. Kazmi, B.; Haider, J.; Ammar Taqvi, S.A.; Qyyum, M.A.; Ali, S.I.; Hussain Awan, Z.U.; Lim, H.; Naqvi, M.; Naqvi, S.R. Thermodynamic and economic assessment of cyano functionalized anion based ionic liquid for CO2 removal from natural gas integrated with, single mixed refrigerant liquefaction process for clean energy. Energy 2022, 239, 122425. [Google Scholar] [CrossRef]
  15. Zhang, Y.; Chen, C.-C. Thermodynamic Modeling for CO2 Absorption in Aqueous MDEA Solution with Electrolyte NRTL Model. Ind. Eng. Chem. Res. 2011, 50, 163–175. [Google Scholar] [CrossRef]
  16. Zhang, Y.; Chen, C.-C. Modeling Gas Solubilities in the Aqueous Solution of Methyldiethanolamine. Ind. Eng. Chem. Res. 2011, 50, 6436–6446. [Google Scholar] [CrossRef]
  17. Austgen, D.M.; Rochelle, G.T.; Peng, X.; Chen, C.C. Model of vapor-liquid equilibria for aqueous acid gas-alkanolamine systems using the electrolyte-NRTL equation. Ind. Eng. Chem. Res. 1989, 28, 1060–1073. [Google Scholar] [CrossRef]
  18. Xuezhong, H.; Izumi, K.; Magne, H. Conceptual Process Design and Simulation of Membrane Systems for Integrated Natural Gas Dehydration and Sweetening. Sep. Purif. Technol. 2020, 247, 116993. [Google Scholar] [CrossRef]
  19. Rezakazemi, M.; Amooghin, A.E.; Montazer-Rahmati, M.M.; Ismail, A.F.; Matsuura, T. State-of-the-art membrane based CO2 separation using mixed matrix membranes (MMMs): An overview on current status and future directions. Prog. Polym. Sci. 2014, 39, 817–861. [Google Scholar] [CrossRef]
  20. Han, Y.; Rezakazemi, M.; Zhang, W.; Liu, X.; Chen, C. Membranes for acid gas enrichment: A techno-economic study. J. Membr. Sci. 2025, 714, 122035. [Google Scholar] [CrossRef]
  21. Farooqi, A.S.; Ramli, R.M.; Lock, S.S.M.; Farooqi, A.S.; Shahid, M.Z.; Hasnain, S.M.W.U.; Hira, N.; Abdullah, B. Removal of carbon dioxide and hydrogen sulfide from natural gas using a hybrid solvent of monoethanolamine and N-methyl 2-pyrrolidone. ACS Omega 2024, 9, 25704–25714. [Google Scholar] [CrossRef]
  22. Ellaf, A.; Taqvi, S.A.A.; Zaeem, D.; Siddiqui, F.U.H.; Kazmi, B.; Idris, A.; Alshgari, R.A.; Mushab, M.S.S. Energy, exergy, economic, environment, exergo-environment based assessment of amine-based hybrid solvents for natural gas sweetening. Chemosphere 2023, 313, 137426. [Google Scholar] [CrossRef]
  23. Lei, Y.; Du, L.; Liu, X.; Yu, H.; Liang, X.; Kontogeorgis, G.M.; Chen, Y. Natural gas sweetening using tailored ionic liquid–methanol mixed solvent with selective removal of H2S and CO2. Chem. Eng. J. 2023, 464, 142514. [Google Scholar] [CrossRef]
  24. Shi, M.; Li, G.; Wu, H.; Ning, H.; Chen, X.; Wang, Y.; Zhang, Y.; Zhao, J.; Dai, S. Efficient hydrogen sulfide separation from carbon dioxide achieved by carbonyl-functionalized ionic liquids for natural gas upgrading. Angew. Chem. Int. Ed. 2025, 64, e202503498. [Google Scholar] [CrossRef] [PubMed]
  25. Kazmi, B.; Haider, J.; Taqvi, S.A.A.; Ali, S.I.; Qyyum, M.A.; Nagulapati, V.M.; Lim, H. Tetracyanoborate anion–based ionic liquid for natural gas sweetening and DMR-LNG process: Energy, exergy, environment, exergo-environment, and economic perspectives. Sep. Purif. Technol. 2022, 303, 122242. [Google Scholar] [CrossRef]
  26. Kumar, S.; Cho, J.H.; Moon, I. Ionic liquid-amine blends and CO2BOLs: Prospective solvents for natural gas sweetening and CO2 capture technology—A review. Int. J. Greenh. Gas Control 2014, 20, 87–116. [Google Scholar] [CrossRef]
  27. Blauwhoff, P.M.M.; Versteeg, G.F.; Van Swaaij, W.P.M. A study on the reaction between CO2 and alkanolamines in aqueous solutions. Chem. Eng. Sci. 1984, 39, 207–225. [Google Scholar] [CrossRef]
  28. Versteeg, G.F.; van Swaaij, W.P.M. On the kinetics between CO2 and alkanol amines both in aqueous and non-aqueous solutions—II. Tertiary amines. Chem. Eng. Sci. 1988, 43, 587–591. [Google Scholar] [CrossRef]
  29. Mokraoui, S.; Coquelet, C.; Valtz, A.; Hegel, P.E.; Richon, D. New Solubility Data of Hydrocarbons in Water and Modeling Concerning Vapor-Liquid-Liquid Binary Systems. Ind. Eng. Chem. Res. 2007, 46, 9257–9262. [Google Scholar] [CrossRef]
  30. Mokraoui, S.; Hadj-Kali, M.K.; Valtz, A.; Richon, D. New Vapor−Liquid−Liquid Equilibrium Solubility Data for iso-Butane, n-Butane, n-Pentane, and n-Hexane in Alkanolamine Aqueous Solutions. J. Chem. Eng. Data 2014, 59, 1673–1684. [Google Scholar] [CrossRef]
  31. Jou, F.-Y.; Deshmukh, R.D.; Otto, F.D.; Mather, A.E. Solubility of H2S, CO2, CH4 and C2H6 in Sulfolane at Elevated Pressures. Fluid Phase Equilibria 1990, 56, 313–324. [Google Scholar] [CrossRef]
  32. Xue, J.; Yang, C.; Fu, J.; He, J.; Li, J. Research and Performance Evaluation on Selective Absorption of H2S from Gas Mixtures by Using Secondary Alkanolamines. Processes 2022, 10, 1795. [Google Scholar] [CrossRef]
  33. Austgen, D.M.; Rochelle, G.T.; Chen, C.C. Model of vapor-liquid equilibria for aqueous acid gas-alkanolamine systems. 2. Representation of hydrogen sulfide and carbon dioxide solubility in aqueous MDEA and carbon dioxide solubility in aqueous mixtures of MDEA with MEA or DEA. Ind. Eng. Chem. Res. 1991, 30, 542–555. [Google Scholar] [CrossRef]
  34. Pacheco, M.A.; Rochelle, G.T. Rate-based modeling of reactive absorption of CO2 and H2S into aqueous methyldiethanolamine. Ind. Eng. Chem. Res. 1998, 37, 4107–4117. [Google Scholar] [CrossRef]
  35. Al-Ghawas, H.A.; Ruiz-Ibanez, G.; Sandall, O.C. Absorption of carbonyl sulfide in aqueous methyldiethanolamine. Chem. Eng. Sci. 1989, 44, 631–639. [Google Scholar] [CrossRef]
  36. Carroll, J.J.; Maddocks, J.; Mather, A.E. The Solubility of Hydrocarbons in Amine Solutions. In Laurance Reid Gas Conditioning Conference Proceedings; University of Oklahoma: Norman, OK, USA, 1998. [Google Scholar]
  37. Huttenhuis, P.J.G.; Agrawal, N.J.; Hogendoorn, J.A.; Versteeg, G.F. Gas Solubility of H2S and CO2 in Aqueous Solutions of N-Methyldiethanolamine. J. Pet. Sci. Eng. 2007, 55, 122–134. [Google Scholar] [CrossRef]
  38. Jou, F.Y.; Carroll, J.J.; Mather, A.E.; Otto, F.D. Phase Equilibria in the System Water–Methyldiethanolamine–Propane. AIChE J. 1992, 38, 511–520. [Google Scholar] [CrossRef]
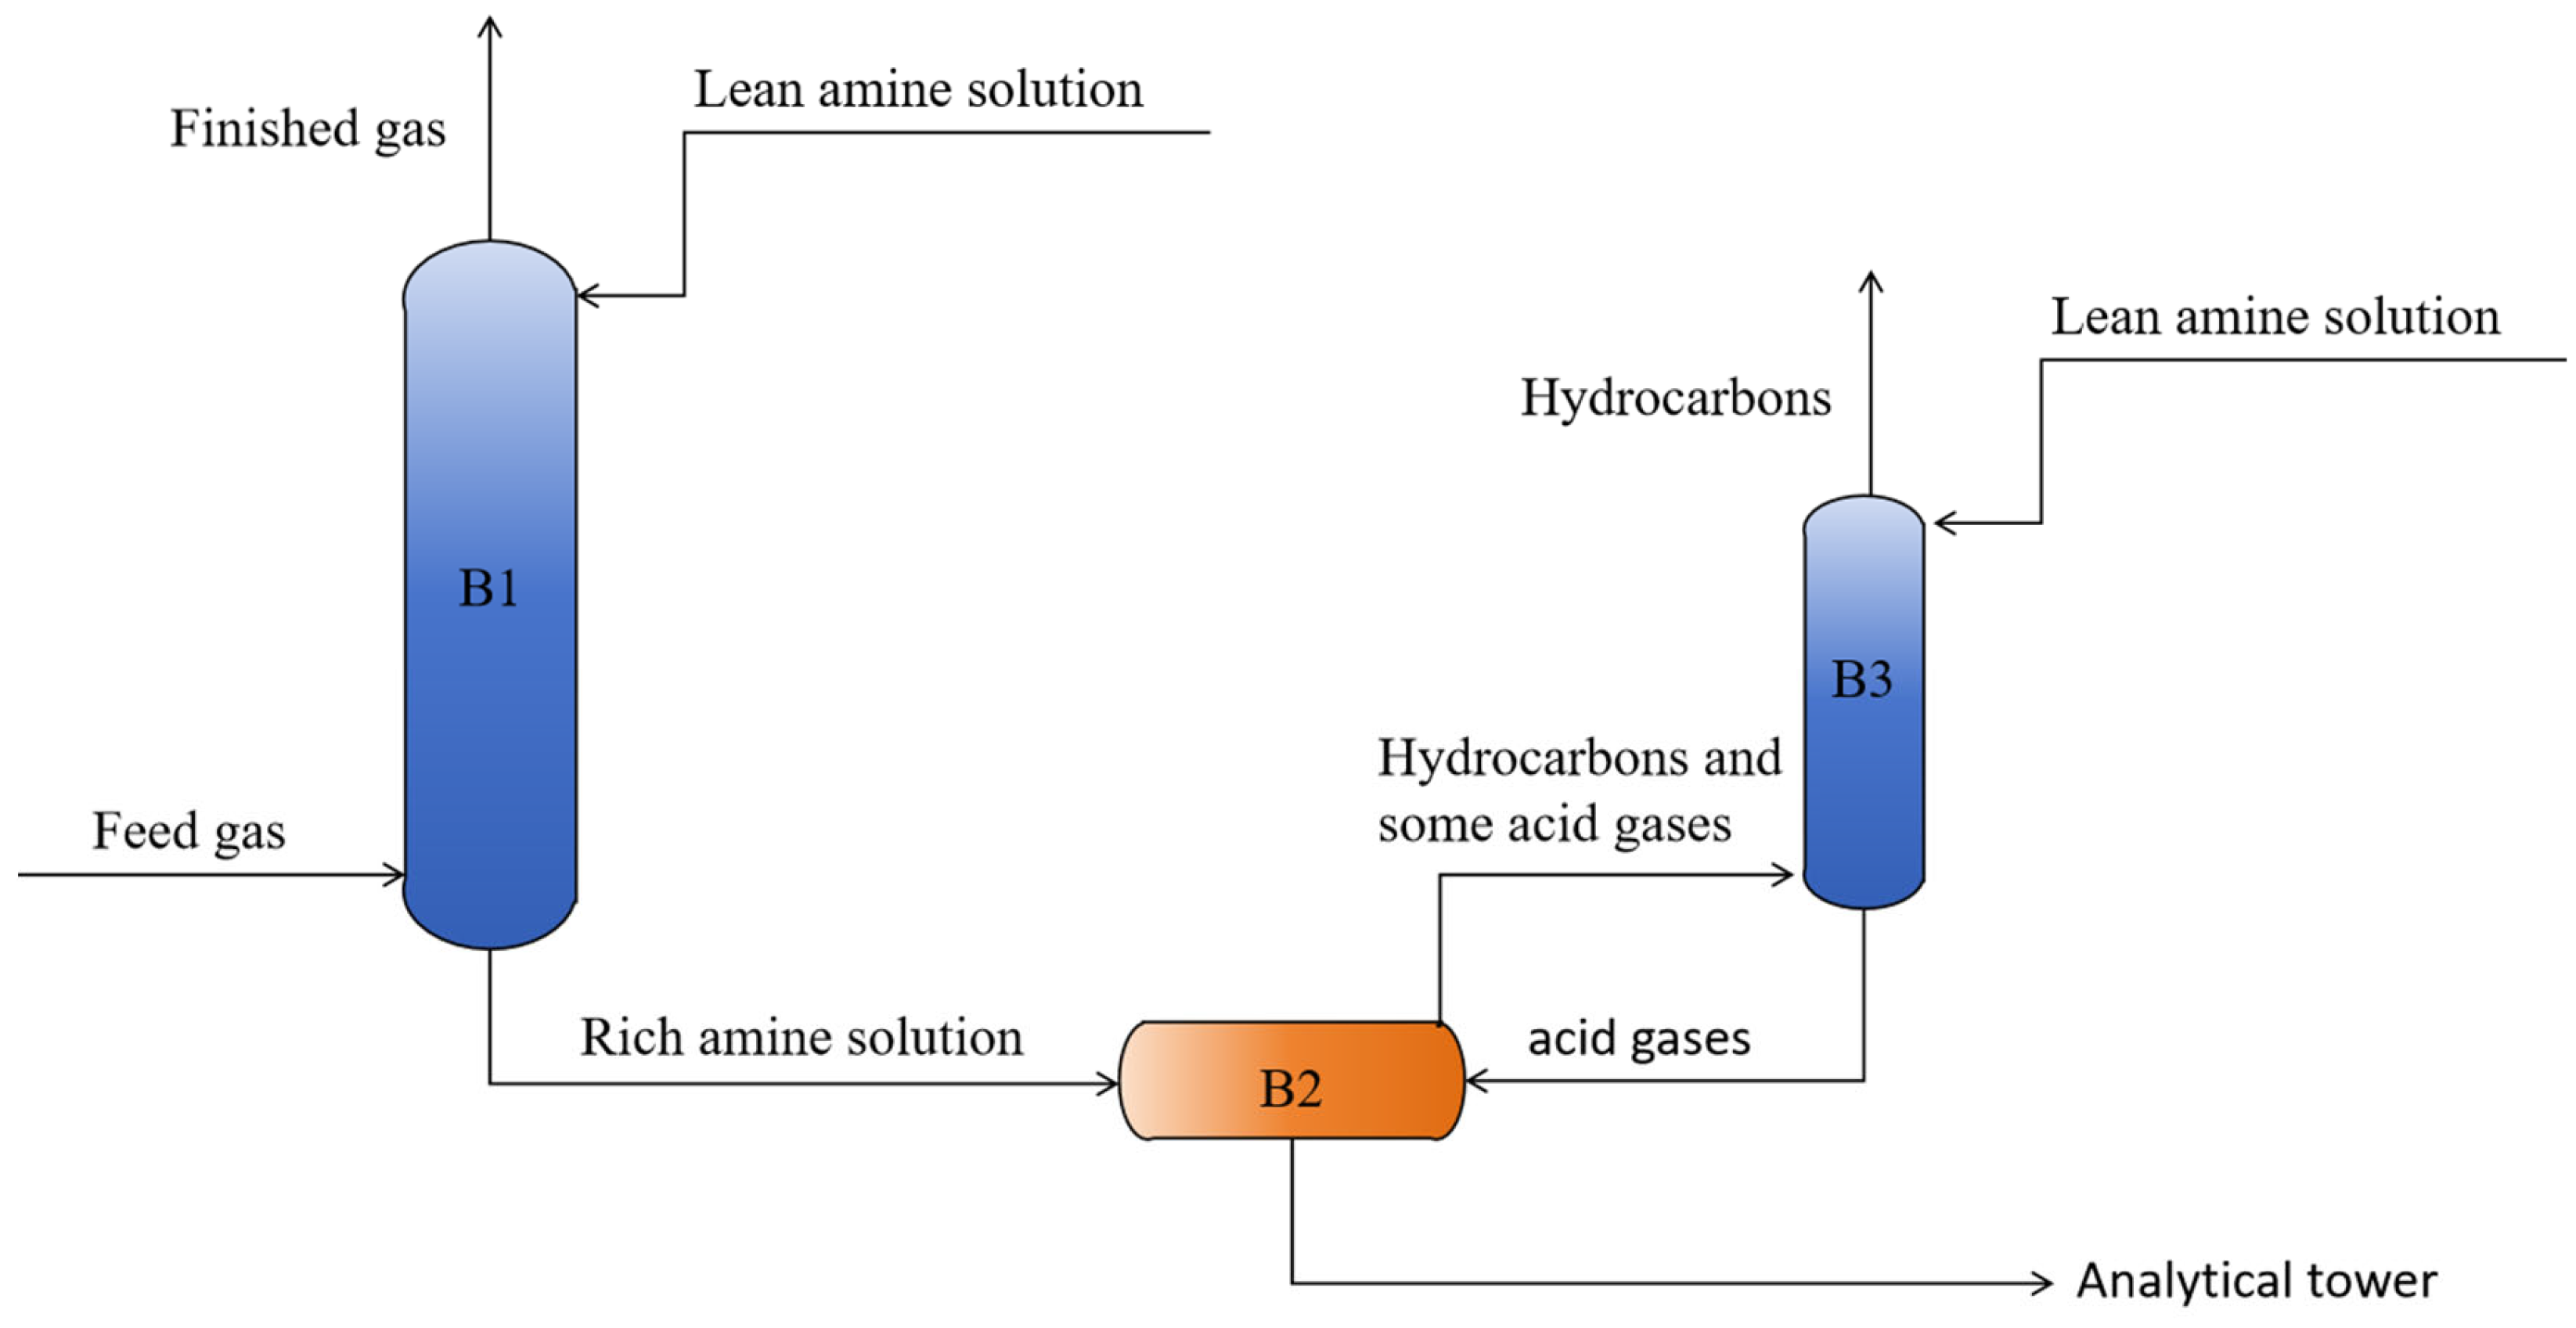
Figure 1. Process flow diagram for the removal of acid gases and hydrocarbons from natural gas: B1: trayed absorption tower; B2: flash drum; B3: packed absorption tower.
Processes 13 03504 g001
Figure 2. Mass transfer model at the gas–liquid interface based on the two-film theory.
Processes 13 03504 g002
Figure 3. Temperature dependence of simulated and experimental Henry’s constants for C5H12 and C6H14.
Processes 13 03504 g003
Figure 4. Comparison of simulation results with industrial data.
Processes 13 03504 g004
Figure 5. Distribution of flash-drum model predictions versus experimental measurements for different hydrocarbon species.
Processes 13 03504 g005
Figure 6. Axial temperature profiles of vapor and liquid phases for each component in the absorption column.
Processes 13 03504 g006
Figure 7. Axial distribution of enhancement factors in the absorption column.
Processes 13 03504 g007
Figure 8. Axial distribution of (a) overall gas-phase mass transfer coefficient (KGa) and (b) fractional gas-phase resistance contribution (αf) for different components in the absorption column.
Processes 13 03504 g008
Figure 9. (a) Relationship between outlet concentrations of different components and the number of trays in the absorption column; (b) relationship between absorption efficiency of different components and the number of trays.
Processes 13 03504 g009
Figure 10. (a) Relationship between outlet concentrations of different components and weir height in the absorption column; (b) Relationship between absorption efficiency of different components and weir height.
Processes 13 03504 g010
Figure 11. (a) Relationship between outlet concentrations of different components and operating pressure in the absorption column; (b) relationship between absorption efficiency of different components and operating pressure.
Processes 13 03504 g011
Figure 12. Relationship between outlet concentrations of different components in the absorption column and the acid gas content in the feed gas.
Processes 13 03504 g012
Figure 13. Effect of gas–liquid ratio on the absorption efficiency of different components.
Processes 13 03504 g013
Figure 14. The effect of (a) number of trays; (b) weir height; (c) operating pressure; (d) gas–liquid ratio; (e) acid gas content; and (f) hydrocarbons content on the absorption efficiency of hydrocarbons.
Processes 13 03504 g014
Figure 15. (a) Relationship between outlet concentrations of different components in the packed column and operating pressure; (b) effect of operating pressure on the desorption rate of hydrocarbons in the flash gas.
Processes 13 03504 g015
Figure 16. (a) Relationship between outlet component concentrations in the packed column and absorption liquid flow rate; (b) effect of liquid flow rate in the packed column on the desorption rate of hydrocarbons.
Processes 13 03504 g016
Figure 17. (a) Relationship between outlet component concentrations in the packed column and packing height; (b) effect of packing height on the desorption rate of hydrocarbons.
Processes 13 03504 g017
Table 1. Henry’s Constants.
Systemln (H/pa) = a + b/T + c × ln(T)Source
abc
H2OCH4188.53−8720.4−24.07[28]
H2OC2H6247.81−11,988.3−32.59
H2OC3H8350.88−17,129−47.64
H2OC4H10898.95−44,053.7−127.99
H2OC5H12−14.510.366.53[16]
H2OC6H14361.56−17,990.73−48.83
MDEACH4−19.5924015.77[28]
MDEAC2H6−23.912435.56.11
MDEAC3H8−216.8612,221.134.17
MDEAC4H10−345.5220,003.552.06
MDEAC5H121027.12−47,124.34−149.46In this work
MDEAC6H14302.53−11,947.25−43.23
TMSCH419.0085.210[29]
TMSC2H620.21−728.610
TMSC3H820.44−1070.820[30]
TMSC4H10−108.156708.617.89In this work
TMSC5H121264.49−60,419.33−183.64
TMSC6H14539.90−25,242.16−77.41
Table 2. Chemical Equilibrium Constant Parameters for Water, Acid Gases, and MDEA.
ReactionAB/TCD/K−1T Range/KSource
6819.80−37,655.90−124.500273–498[31]
7−553.4028,412.7077.700273–423
8−9.42−42,334.9800298–333
9−32.00−3338.0000287–343
10216.05−12,431.70−35.480273–498
11132.90−13,445.90−22.480273–498
Table 3. Quantitative error metrics (RMSE, MAE, R2) for absorption tower and flash tank predictions compared with experimental data.
TypeSubstanceRMSEMAER2
Absorption towerCO20.02900.02330.6251
COS0.02580.02030.9206
MSH0.02160.01730.6560
Flash TankC2H60.02560.02290.8466
C3H80.02690.02510.7100
C4H100.02360.02170.3011
C5H120.02510.02290.9002
C6H140.00930.00820.7921
Disclaimer/Publisher’s Note: The statements, opinions and data contained in all publications are solely those of the individual author(s) and contributor(s) and not of MDPI and/or the editor(s). MDPI and/or the editor(s) disclaim responsibility for any injury to people or property resulting from any ideas, methods, instructions or products referred to in the content.