Article

Double-Layer Reactive Power Optimal Configuration Method for Large-Scale Offshore Wind Farms Based on an Adaptively Improved Gravitational Search Algorithm

1
Power China Guiyang Engineering Corporation Limited, Guiyang 550000, China
2
School of Water Resources and Hydropower, Xi’an University of Technology, Xi’an 710000, China
3
School of Electrical Engineering, Xi’an Jiaotong University, Xi’an 710000, China
*
Author to whom correspondence should be addressed.
Processes 2025, 13(11), 3408; https://doi.org/10.3390/pr13113408
Submission received: 2 September 2025 / Revised: 10 October 2025 / Accepted: 21 October 2025 / Published: 24 October 2025

Abstract

To address the issue of frequent power frequency overvoltage disconnection accidents in offshore WF caused by the capacitive effect of submarine cables, this paper proposes a double-layer RP optimal configuration method for large-scale offshore WF based on an adaptively improved GSA. Firstly, this paper considers both the RP capabilities of offshore WT themselves and RP compensation equipment, designing a two-layer “configuration-control” optimization framework for RP. The upper layer establishes an optimization configuration model with the objective of minimizing the total investment cost and operational expenses of the equipment. The lower layer establishes a RP optimization operation model with the objective of minimizing a weighted index that comprehensively considers system network losses, voltage deviations, and RP capacity margins. Then, to address the issue of traditional GSA being prone to local optima, this paper introduces a random factor into the mass calculation, combines elite concepts to selectively synthesize gravitational forces based on fitness values, and assigns larger random numbers to forces corresponding to superior particles. By introducing control parameters to adaptively update particle positions, an adaptively improved GSA is proposed, which is employed to solve the established double-layer RP optimization configuration model for large-scale offshore WF. Finally, simulation analysis is conducted on a large-scale offshore WF constructed using MATLAB R2020a. Compared with the basic GSA algorithm, the proposed method reduces the system loss by 50.59% and the voltage deviation by 64.75%. The research demonstrates that the proposed method can effectively enhance the stability of grid voltage and proves the effectiveness of the improved GSA and the proposed two-layer “configuration-control” optimization model.

1. Introduction

As the global energy structure transitions towards cleaner alternatives, offshore wind power has emerged as a significant focus in renewable energy development [1,2]. By early 2025, China’s offshore wind sector has accumulated more than 40 GW of installed capacity, ranking first globally. However, offshore WF are predominantly connected to onshore power grids via long-distance submarine cables, a unique connection method that presents distinct RP optimization challenges compared to onshore WF. Submarine cables exhibit a strong capacitive effect, with their charging power per unit length exceeding that of overhead lines by more than tenfold [3]. This leads to power frequency overvoltage under light-load conditions and necessitates substantial capacitive RP support during heavy-load operations. Furthermore, the operational environment of offshore WF is complex, characterized by frequent mode switching (e.g., normal grid connection, transient faults, islanding operation), high random volatility (e.g., wind speed fluctuations, wake effects), and stringent maintenance conditions. These factors make RP optimization and configuration a critical technology for ensuring the system operates safely and without interruption [4,5,6].
The high capacitance characteristic of AC submarine cables results in the generation of substantial capacitive charging power. When the WF operates at low power output, the excess capacitive RP produced by the cables cannot be effectively absorbed, leading to a significant rise in voltage along the transmission line [7,8,9]. This voltage increase may exceed the safety limit of 1.1 pu, endangering equipment insulation. Conversely, when the WF operates at full capacity, the charging power of the cables fails to meet the RP demand required for power transmission. Without sufficient compensation, this can cause the voltage at the POI to drop below 0.9 pu, threatening system stability. During normal grid-connected operation, offshore WF must maintain voltage deviation at the POI within ±5% while minimizing network losses. In the event of transient faults, offshore WF are required to provide short-circuit capacity support to facilitate system voltage recovery and prevent large-scale disconnections [10,11]. When an offshore WF is disconnected from the onshore power grid, it must sustain power supply to critical on-site loads. In such scenarios, local emergency power sources (e.g., diesel generators) and grouped-switching reactors are necessary to stabilize voltage. Therefore, given the varying RP demands across different operating conditions, the RP configuration of offshore WF is of paramount importance [12].
Literature [13] points out that by fully tapping the RP potential of DFIGs or full-power converters, it is possible to avoid installing dynamic RP compensation devices on offshore platforms in most scenarios, thereby significantly reducing project construction costs. Literature [14] considers the trade-off between equipment investment costs and long-term operational benefits, employing the “equivalent annual investment value method” to annualize the investment costs of dynamic RP compensation devices. These annualized costs, along with annual network loss expenses, form the objective function. Literature [15] proposes a RP compensation optimization method that accounts for switching frequency, utilizing the GWEO to achieve dual optimization of compensator configuration and switch state control. Literature [16] employs a deep learning model to determine transient voltage stability indicators and proposes a regionally coordinated adaptive hierarchical optimization control method for RP in new energy power stations. Literature [17] presents a method that combines RP zoning with equipment siting and sizing, and which is validated on IEEE 14-bus and IEEE 39-bus systems. Literature [18] introduces a distributed RP resource coordination method based on cooperative game theory and adaptive learning, utilizing the Shapley value for profit configuration and employing meta-learning for model optimization. Literature [19] investigates a RP compensation method for long-distance high-voltage submarine cables to address excessive network losses caused by fixed compensation. Literature [20] divides the power grid into autonomous RP zones using a network Voronoi diagram-based zoning method and independently optimizes the location and capacity of STATCOM within each zone. After validation on the IEEE 14-bus system, this method reduced voltage deviation by 12.7%. Literature [21] achieves millisecond-level RP support through the integration of a MMC with VSG control. Literature [22] proposes a three-tier RP configuration system comprising “provincial main grid-regional distribution network-microgrid” and employs a distributed optimization algorithm to reduce computational complexity. Literature [23] incorporates CVaR into RP configuration and utilizes a scenario generation-based robust optimization model to cope with fluctuations in new energy output, enhancing system resilience. Literature [24] presents a collaborative framework based on a MAS to achieve dynamic RP configuration among new energy power stations, energy storage systems, and interruptible loads. Literature [25] utilizes PMU data to enable cross-regional coordinated control of RP compensation devices, reducing fault recovery time to less than 200 ms. Literature [26] proposes an online identification-based adaptive adjustment method for RP controller parameters, tripling the dynamic response speed. Literature [27] introduces a comprehensive cost model that considers equipment investment, operation and maintenance, and outage losses. The optimized RP configuration reduces the full lifecycle cost of the distribution network by 18%. Literature [28] incorporates energy-saving and emission-reduction benefits of RP configuration into economic evaluations, providing a basis for green finance support.
However, the aforementioned methods are all based on specific operational scenarios and inadequately consider the volatility and randomness of wind power. Moreover, traditional algorithms are prone to getting trapped in local optima and exhibit low efficiency in solving complex nonlinear problems. Additionally, in existing research, the planning stage (configuration) and the operational stage (control) are often optimized separately, without achieving full lifecycle coordination. This may result in suboptimal economic performance or stability of the configured solutions during actual operation [13,14,15,16,17,18,19,20,21,22,23,24,25,26,27,28]. In response to the specific requirements of offshore wind power, integrated research on the “configuration-control” of RP compensation devices has gradually emerged as a hot topic. To this end, this paper proposes a double-layer RP optimal configuration method for large-scale offshore WF based on an adaptively improved GSA. The main contributions are as follows:
(1)
A double-layer “configuration-control” framework model for RP is designed, minimizing full-cycle costs and boosting system stability via upper-level optimization and lower-level coordinated control.
(2)
The upper level sets up an optimization configuration model to minimize equipment and operational costs. The lower level formulates an RP optimization model, considering system losses, voltage fluctuations, and RP capacity margins, aiming to minimize a weighted index of these factors.
(3)
To overcome the local optima issue in traditional GSA, a random factor is added to mass calculation. Elite strategies are used to selectively combine gravitational forces based on fitness, with more randomness for superior particles. Control parameters are introduced for adaptive particle position updates, resulting in an adaptively improved GSA.
(4)
The improved algorithm is used to solve the bi-level optimization model for RP and voltage in large offshore WFs. Simulation analysis in MATLAB on a large offshore WF validates the effectiveness of the improved GSA and the bi-level optimization model.

2. System Model of Offshore WF

2.1. Parametric Model of Submarine Cable

The AC-side equivalent circuit of the grid-connected system for offshore WF is shown in Figure 1.
In Figure 1, the WF is equivalent to an equivalent current source with an internal impedance of Zpoi, an output current of Ipoi and a terminal voltage of Upoi, and then it is merged into a power grid (with an impedance of Zg = jwLg + Rg, a current of Ig and a voltage of Ug) through a π-type submarine cable. The impedance of π submarine cable is Zline = jwLline + Rline, and the admittance to the ground is Yline1 and Yline2 respectively.
Using the voltage and current coupling model of two-port network, the voltage relation of POI for WF can be expressed as [5]:
U p o i I p o i = A B C D 1 Z g 0 1 U g I g
where: Upoi and Ipoi are voltage and current of the WF respectively; Zg, Lg and Rg are the impedance, inductance and resistance of equivalent grid respectively; Ig and Ug are the current and voltage of equivalent grid respectively; Zlin, Lline and Rline are the impedance, inductance and resistance of submarine cable respectively; Yline1 and Yline2 are the admittance to the ground respectively; A, B, C and D are coefficient matrices respectively.
The calculation formulas of coefficient matrix A, B, C and D are as follows [5]:
A = 1 + Y l i n e 2 Z l i n e B = Z l i n e C = Y l i n e 1 + Y l i n e 2 + Y l i n e 1 Y l i n e 2 Z l i n e D = 1 + Y l i n e 1 Z l i n e

2.2. Model of RP Compensation Device

In this paper, SVC is used as RP compensation equipment in WF. SVC is composed of TSC and TCR. SVC realizes smooth regulation through TCR, the instantaneous current, equivalent susceptance and RP absorbed from the system of TCR are as follows [9]:
I T C R = 2 U X R ( cos ψ cos w t )
B T C R = 2 ( π ψ ) + sin 2 ψ π X R
Q T C R = U 2 X T C R = 2 ( π ψ ) + sin 2 ψ π X R U 2
where U is the voltage; XR is the reactor impedance in TCR; ψ is the trigger angle; w is the rated angular velocity of the power supply; I T C R , B T C R and Q T C R are the instantaneous current, equivalent susceptance and RP absorbed from the system of TCR respectively.
The RP compensated by TSC is fixed. When the capacitor is switched on, the reactive power QTSC injected into the system is [10]:
Q T S C = w C T S C U 2
where CTSC is the capacitance of TSC; QTSC is the RP injected into the system.
The RP output by SVC device is [10]:
Q S V C = Q T S C Q T C R

2.3. Model of RP Limit for Wind Turbine

Ignoring the stator resistance, the reactive limit range of the stator of WT can be obtained as follows [12]:
Q s , max = 3 U s 2 2 X s 2 + ( 3 X m 2 X s U s I max ) 2 P s 2 Q s , min = 3 U s 2 2 X s 2 ( 3 X m 2 X s U s I max ) 2 P s 2
where Q s , max is the upper limit of RP on the stator side; Q s , min is the lower limit of RP on the stator side; U s is the stator side voltage; Ps is the active power transmitted from the stator side; Xm, Xs and Im are excitation reactance, stator reactance and maximum current value of rotor-side converter respectively.
Considering the RP limit condition of grid-side converter, the RP limit of WT to power grid is obtained as follows [13]:
Q g , max = Q s , max + P c , max 2 s 1 s 2 P m 2 Q g , min = Q s , min P c , max 2 s 1 s 2 P m 2
where Pm is the mechanical power input by the WT; P c , max and P c , min are the designed maximum and minimum power of the grid-side converter, respectively; s is the slip; Q g , max is the upper limit of RP for WT; Q g , min is the lower limit of RP for WT.

2.4. Grid-Connected Model of Wind Turbine

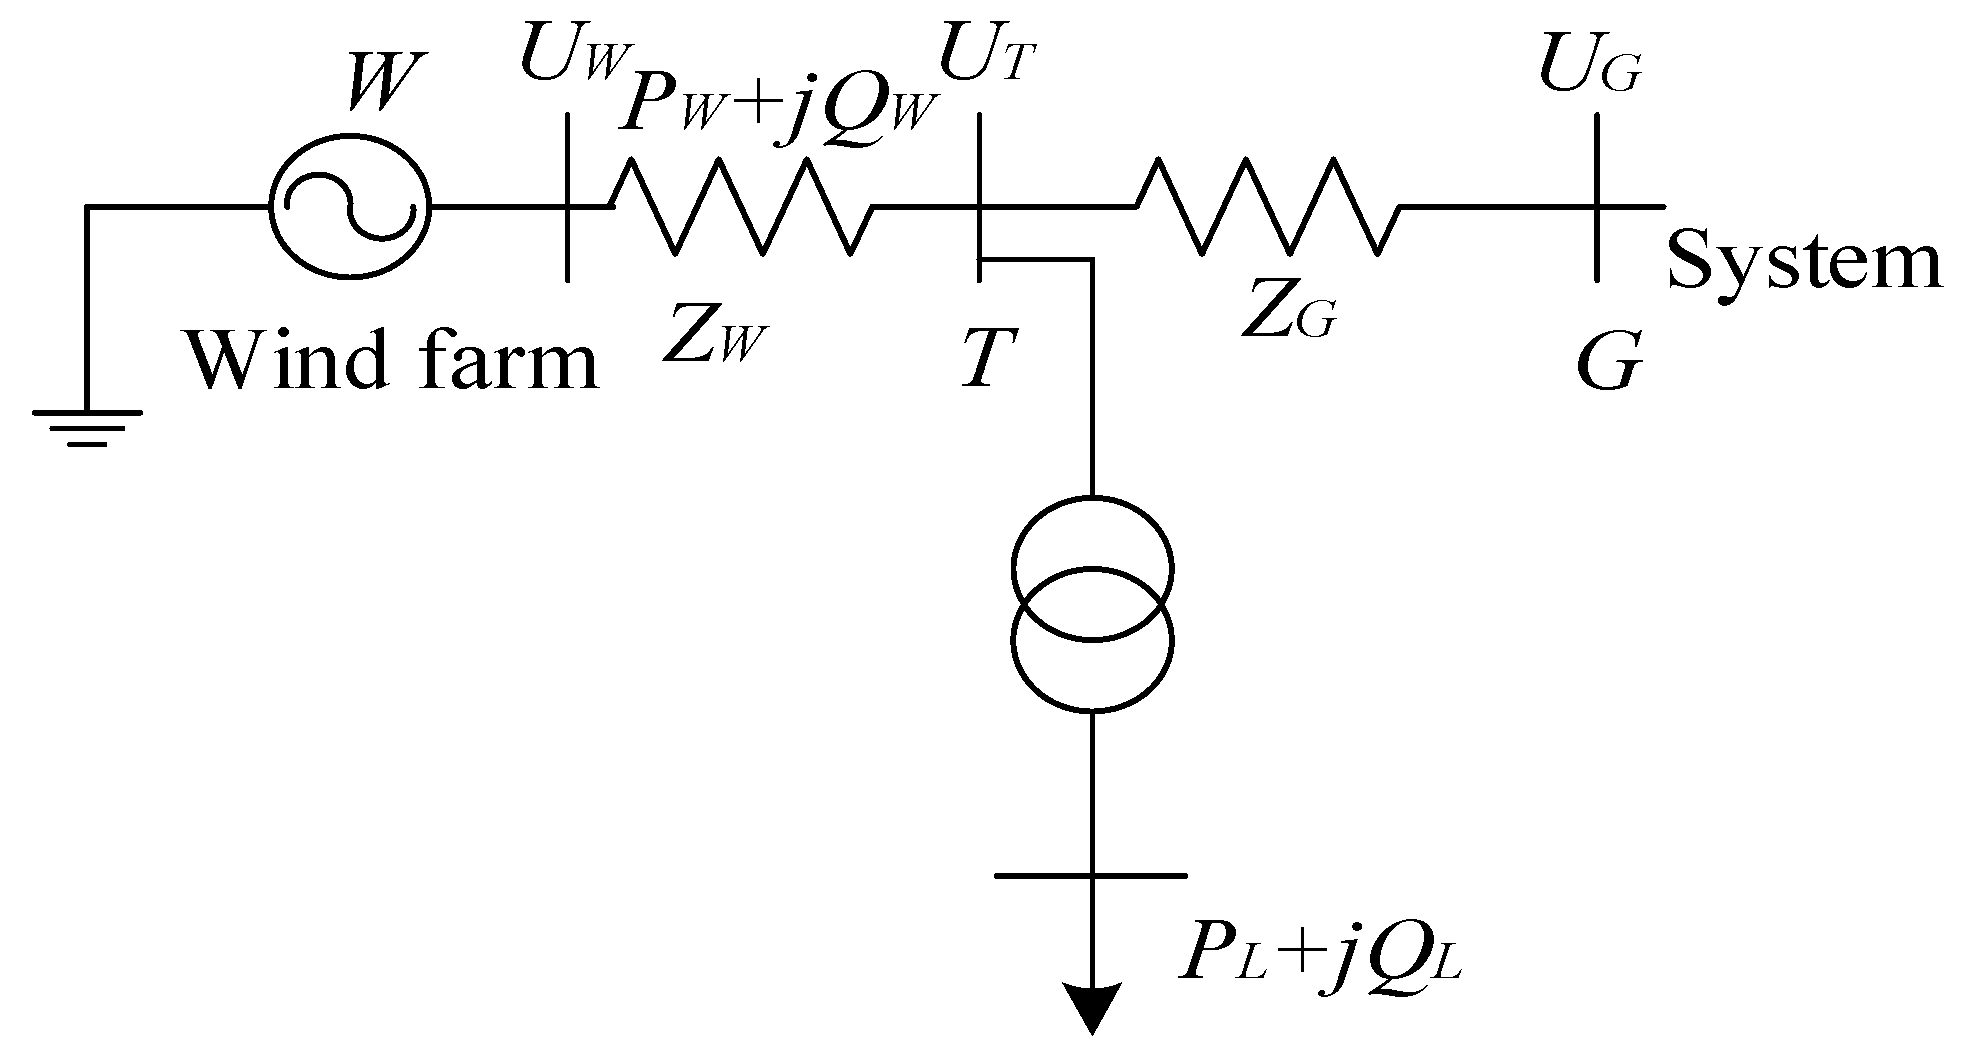
Schematic diagram of WF grid connection is shown in Figure 2.
In Figure 2, T is the substation connected with the grid of the wind farm W; G is the equivalent large-scale system with a higher voltage level; PL and QL are the active and reactive loads of the substation T; PW and QW are the active power and RP outputs of the wind farm; ZW is the equivalent impedance between the WF and the substation T; ZG is the equivalent impedance between the substation T and the equivalent system; UT is the bus voltage of the substation T; UW is bus voltage of the WF; and UG is the equivalent system voltage.

3. Double-Layer “Configuration-Control” Optimization Framework for RP

3.1. Upper RP Optimization Configuration Model

In the upper-level configuration model, the main variables to be determined are the access location and access capacity of RP compensation devices. In this paper, considering the investment cost of RP compensation device and the operation cost of the system, the objective function of the upper model is:
min   F u p = α u p , 1 f u p , 1 + α u p , 2 f u p , 2
f u p , 1 = ( C q , i n v e s t + C q , o p e r a t i o n ) Q C Y o p e r a t i o n
f u p , 2 = 8760 C e E p l o s s
α u p , 1 + α u p , 2 = 1
where Fup is the upper model target; f u p , 1 is the investment cost of RP compensation; f u p , 2 is the operating cost of the WF; α u p , 1 and α u p , 2 are the weight coefficients of the upper model respectively; Ce is the power loss price; Eploss is the expected value of active power loss per hour; C q , i n v e s t stands for investment cost per unit capacity; C q , o p e r a t i o n stands for operating cost per unit capacity; Q C stands for reactive capacity; Y o p e r a t i o n stands for years of operation.

3.2. Lower RP Optimization Control Model

In the lower-level control model, the main variables to be determined are the RP output of WT and various RP compensation devices. In this paper, the system power loss, voltage deviation and RP capacity margin are comprehensively considered, and the objective function of the lower model is:
min   F d o w n = α d o w n , 1 f d o w n , 1 + α d o w n , 2 f d o w n , 2 + α d o w n , 3 f d o w n , 3
f d o w n , 1 = i = 1 N j i G i j ( U i 2 + U j 2 2 U i U j cos θ i j )
f d o w n , 2 = i = 1 N U i U r e f U r e f / N
f d o w n , 3 = i = 1 N Q i , C Q i , C min Q i , C max Q i , C min
α d o w n , 1 + α d o w n , 2 + α d o w n , 3 = 1
where Fdown is the lower model target; f d o w n , 1 is the system power loss; f d o w n , 2 is the voltage deviation; f d o w n , 3 is the RP capacity margin; α d o w n , 1 , α d o w n , 2 and α d o w n , 3 are the weight coefficients of the lower model respectively; N is the total number of system nodes; G i j is the conductance between node i and node j; U i and U j are the voltage of node i and node j respectively; θ i j is the phase angle between node i and node j; U r e f is the reference voltage; Q i , C is the RP output of the RP compensation equipment equipped with node i; Q i , C max is the upper limit of RP compensation capacity of node i; Q i , C min is the lower limit of RP compensation capacity of node i.
It should be noted that for the objective function in Equation (16), since the per-unit value is adopted for calculations in this paper, there is no need for further normalization.

3.3. Normalization of Objective Function Index

As the dimensions of optimization indexes for various objective functions are different, it is necessary to unify the dimensions before transforming them into single objectives, and normalize them according to their value ranges:
f ¯ = f f min f max f min
where f represents the objective function value; f max and f min represent the maximum and minimum values of the objective function f respectively; f ¯ represents the normalized value of the objective function.
For the upper and lower models, the normalized objective functions are:
min   F ¯ u p = α u p , 1 f ¯ u p , 1 + α u p , 2 f ¯ u p , 2
min   F ¯ d o w n = α d o w n , 1 f ¯ d o w n , 1 + α d o w n , 2 f ¯ d o w n , 2 + α d o w n , 3 f ¯ d o w n , 3
where the superscript horizontal line indicates the normalized objective function value.

3.4. The Constraints

The system power balance constraints are:
P i = U i j N U j ( G i j cos θ i j + B i j sin θ i j ) Q i = U i j N U j ( G i j sin θ i j B i j cos θ i j )
where P i and Q i are the active power and RP of node i; B i j is the susceptance between node i and node j.
The node voltage constraint is:
U i , min U i U i , max
where U i , min lower limits of the voltage at node i; U i , max is the upper limits of the voltage at node i.
The constraint for WT to absorb RP is:
Q g i , min Q g i Q g i , max
where Q g i , max is the upper limit of RP for wind turbine i; Q g i , min is the lower limit of RP for wind turbine i; Q g i is the RP output for wind turbine i.
The constraint of RP compensation capacity of compensation nodes is:
Q S V C , i min Q S V C , i Q S V C , i max
where Q S V C , i max is the upper limit of RP for i-th SVC; Q S V C , i min is the lower limit of RP for i-th SVC; Q S V C , i is the RP output for i-th SVC.
The on-load tap-transformer ratio constraint is:
T i , min T i T i , max
where T i , max is the upper limit value of the transformation ratio for the on-load tap-transformer; T i , min is the lower limit value of the transformation ratio for the on-load tap-transformer; T i is the transformation ratio for the on-load tap-transformer.
In order to improve the voltage stability of the POI for WF, the voltage deviation index of the POI is introduced and added to the constraints, as shown below:
U p o i r e f U p o i e r r U p o i U p o i r e f + U p o i e r r
where U p o i is the real-time voltage of the POI for the WF; U p o i r e f is the grid voltage control index issued by superior dispatching; U p o i e r r is the allowable control error.
The constraint of line transmission power is:
U p o i r e f U p o i e r r U p o i U p o i r e f + U p o i e r r
where P l i n e is the transmission power of the line; P l i n e , max is the maximum allowable transmission power of the line.

4. The Improved GSA for Double-Layer Framework Model

4.1. The Basic GSA

Assuming that there are N particles in the n-dimensional search space, the position X i ( t ) of the i-th particle at time t is defined as follows:
X i ( t ) = x i 1 ( t ) , x i 2 ( t ) , , x i k ( t ) , , x i n ( t )
where i = 1, 2, …, N; x i k ( t ) represents the position of the particle i in the k-th dimensional space at time t.
The calculation formula of the mass for particle i at time t is as follows:
m i ( t ) = f i t i ( t ) w o r s t i ( t ) b e s t i ( t ) w o r s t i ( t ) M i ( t ) = m i ( t ) j = 1 N m j ( t )
where Mi(t) represents the mass of particle i at time t; f i t i ( t ) represents the fitness value for particle i at time t; b e s t i ( t ) and w o r s t i ( t ) represent the optimal fitness value and the worst fitness value at time t respectively; m i ( t ) and m j ( t ) are calculated quantities of intermediate process.
At time t, the magnitude of the gravitational force F i j k ( t ) exerted by particle j on particle i at the k-th dimensional space is:
F i j k ( t ) = G ( t ) M i ( t ) × M j ( t ) R i j ( t ) ( x j k ( t ) x i k ( t ) ) G ( t ) = G 0 × e α × t / T max
where R i j ( t ) is the Euclidean distance between particle ij; G(t) represents the gravitational constant at time t; G0 is the initial value; α is the attenuation coefficient; Tmax represents the total number of iterations; M j ( t ) is the mass of particle j at time t; x j k ( t ) is the position of the particle j in the k-th dimensional space at time t.
The resultant force on the k-th dimension for particle i is:
F i k ( t ) = j = 1 , j i N F i j k ( t )
where F i k ( t ) is the resultant force on the k-th dimension of particle i.
At time t, the acceleration, velocity and position formulas of particle i in the k-th dimensional space are as follows:
a i k ( t ) = F i k ( t ) M i ( t ) v i k ( t + 1 ) = v i k ( t ) + a i k ( t ) x i k ( t + 1 ) = x i k ( t ) + v i k ( t ) + v i k ( t + 1 ) 2
where a i k ( t ) is the acceleration of particle i in the k-th dimensional space; v i k ( t ) and v i k ( t + 1 ) are the velocity of particle i in the k-th dimensional space; x i k ( t + 1 ) represents the position of the particle i in the k-th dimensional space at time t + 1.

4.2. The Improved GSA

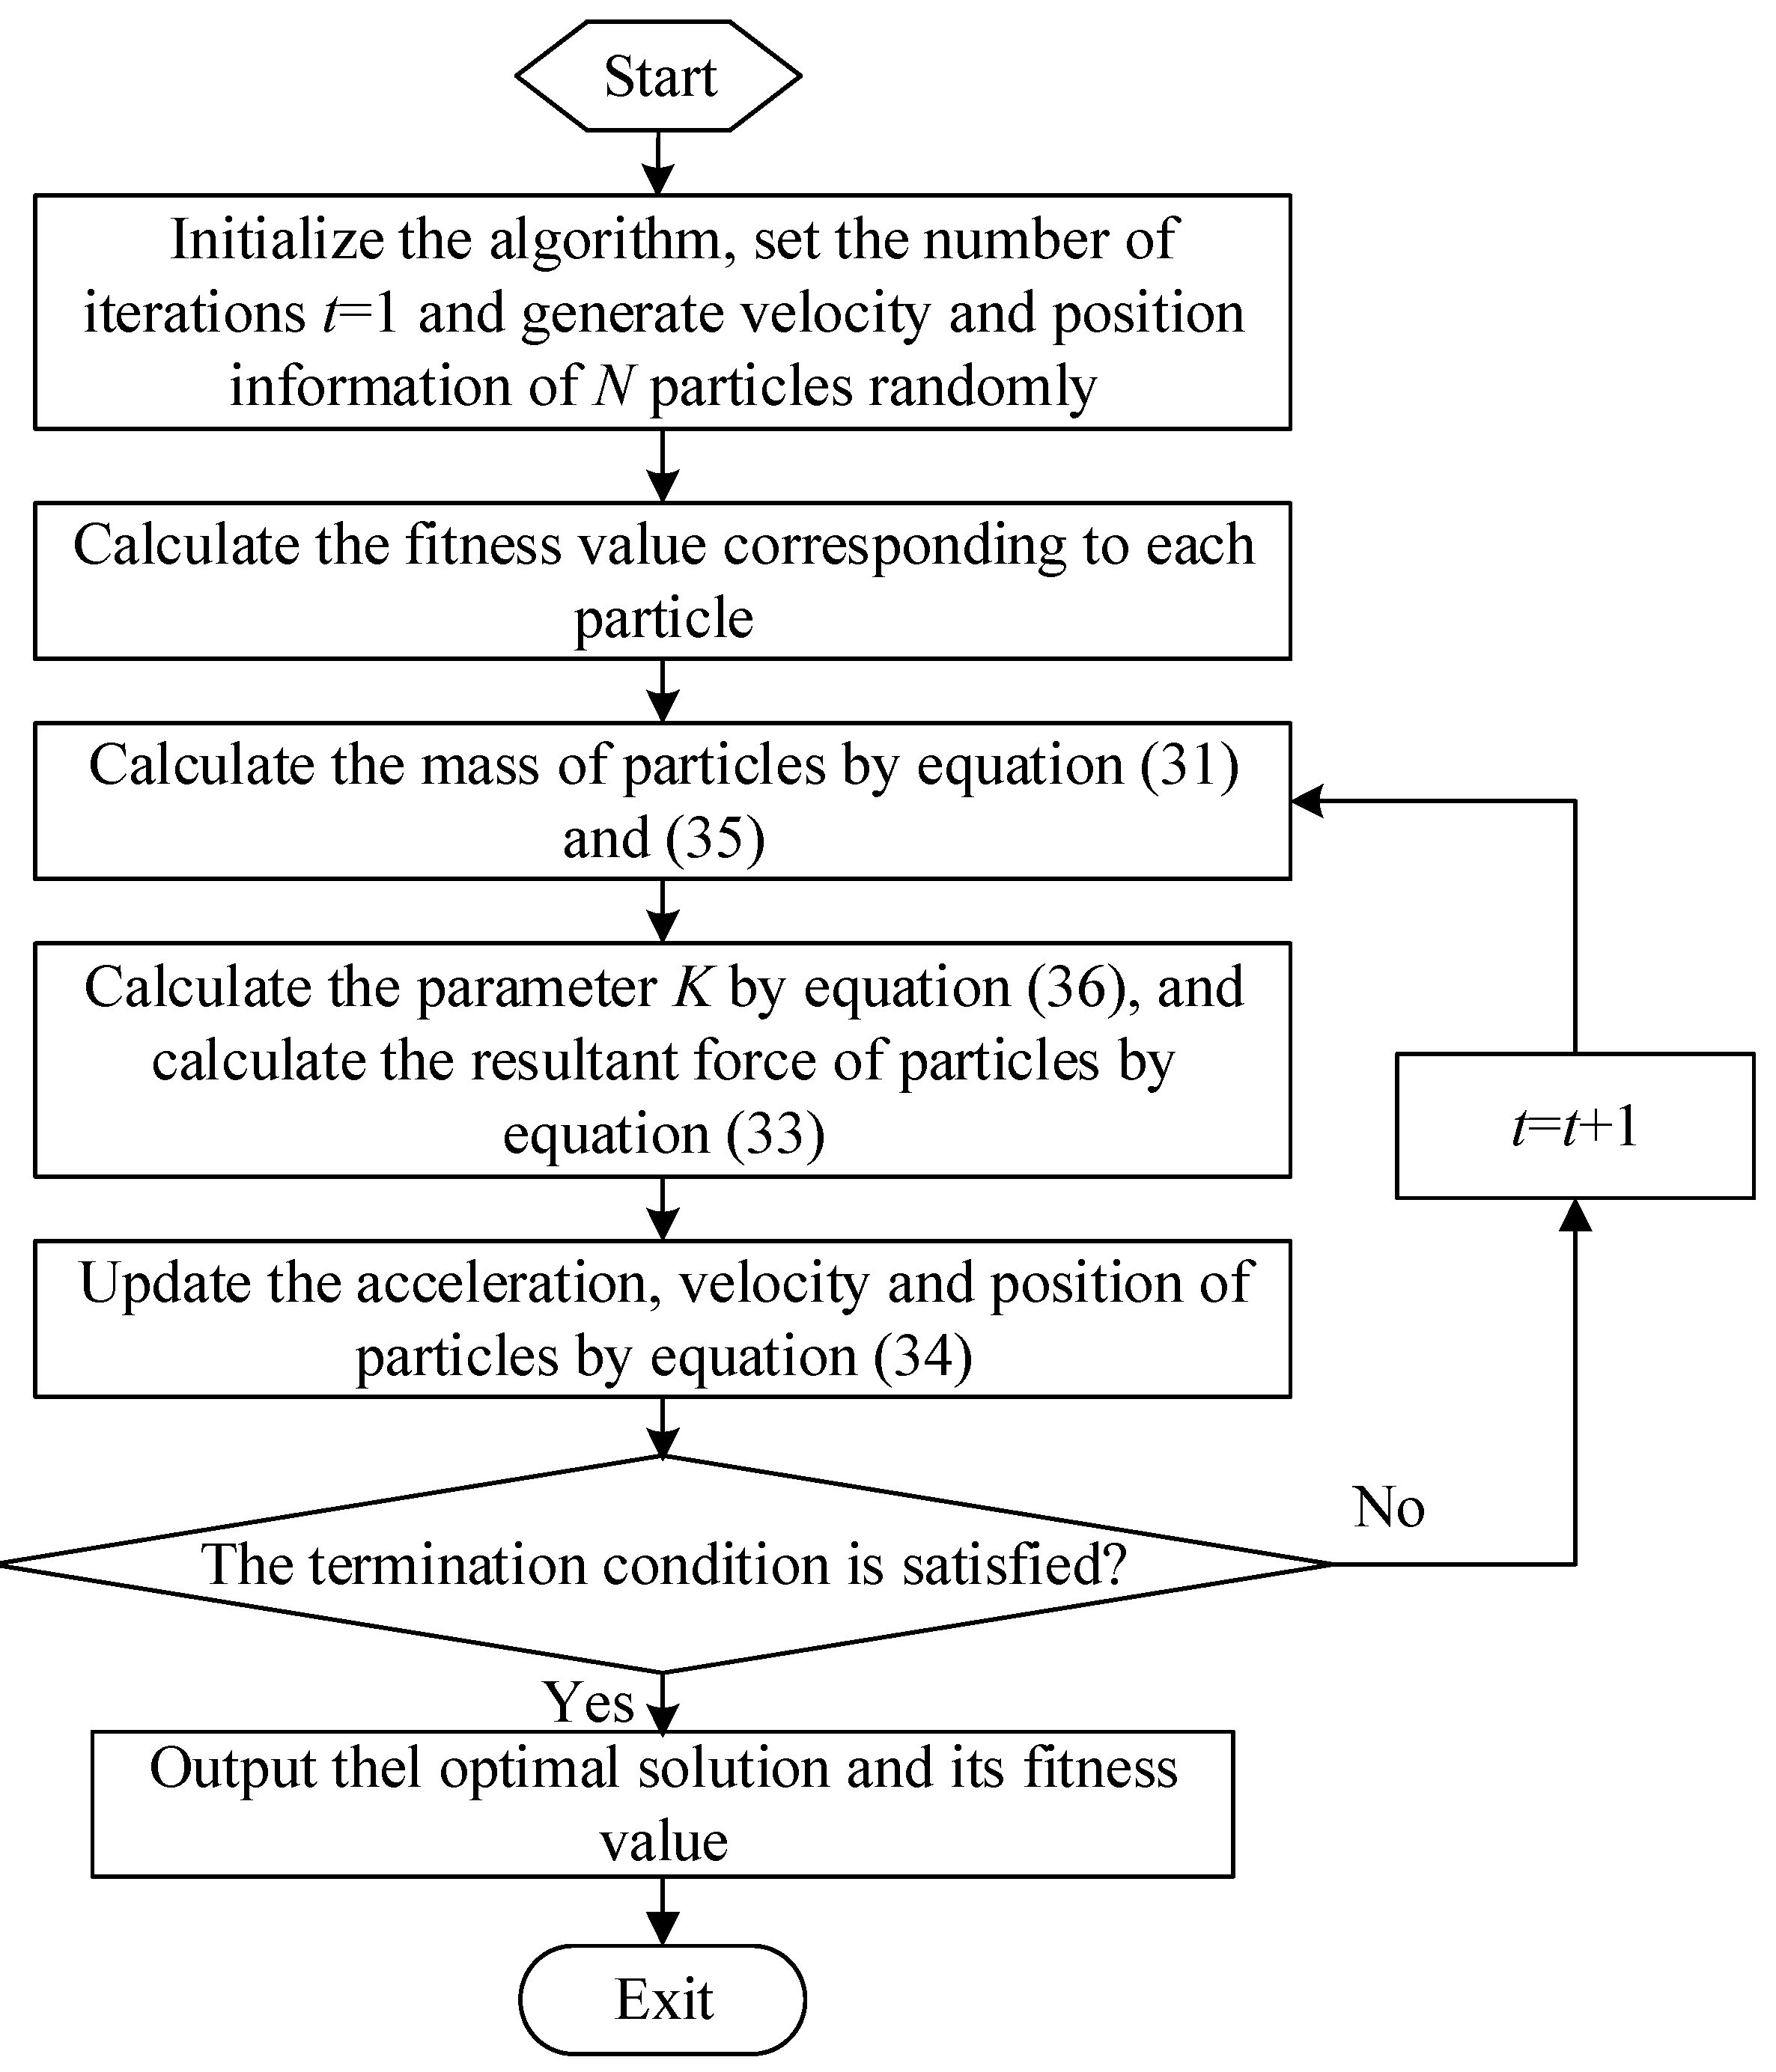
As GSA algorithm is prone to premature convergence, this paper adds random weight to the mass to increase the randomness of the algorithm, which can jump out of the local optimum to a certain extent. The improved quality calculation formula is as follows:
m ¯ i ( t ) = r i m i ( t ) M ¯ i ( t ) = m ¯ i ( t ) j = 1 N m ¯ j ( t )
where M ¯ i ( t ) represents the improved mass of particle i at time t; r (r ∈ [0, 1]) is a random number; m ¯ i ( t ) and m ¯ j ( t ) are calculated quantities of intermediate process.
As each particle is attracted by other particles, when most particles are in a better position, it is difficult for the remaining particles to jump out of this range, and the whole population is easy to fall into local optimum. To solve this issue, this paper uses the idea of elite, combined with fitness ranking, and adaptively selects some forces to synthesize. Firstly, this paper sorts the objective function values in the minimization problem in ascending order, and gets the corresponding particle number b = b 1 , b 2 , , b N ; then, a group of (0, 1) random numbers are generated and sorted in descending order to get p = p 1 , p 2 , , p N ; finally, according to the order of the objective function value from small to large, the better particles are given larger random numbers. In this paper, the number of combined forces is controlled by setting parameter K. If the value of K is too large, the system will easily fall into local optimum. If the value of K is too small, the traction of particles is reduced and the randomness of particles is enhanced, which can effectively make the algorithm jump out of the local optimum, but it is difficult to attract most particles near the optimal position and the stability of the solution is difficult to guarantee. Therefore, in this paper, the value of K is calculated by the following formula to obtain a relatively compromised parameter:
K = f l o o r N × ( cos ( π 2 t + T max T max ) + 1 )
where K is the number of combined forces; floor stands for round-down function.
As the particle’s position stands for a solution to the problem, to address the issue in the basic GSA where the particle position update formula struggles to find better solutions, this paper introduces a contraction factor μ and c into the position update formula. During the early iterations, particles move with larger step sizes, and the contraction factor enables rapid convergence to the vicinity of superior particles. In the later iterations, as the particles’ movement step sizes decrease, the contraction factor assists particles in conducting in-depth searches around the optimal value. The improved position update formula is as follows:
x i k ( t + 1 ) = μ x i k ( t ) + c v i k ( t ) + v i k ( t + 1 ) 2
μ = e 2 t T max
c = 1 t T max + b e t a r n d
where μ and c are the contraction factors; betarnd stands for random number generated by Beta distribution.
The flow chart of improved GSA is shown in Figure 3.
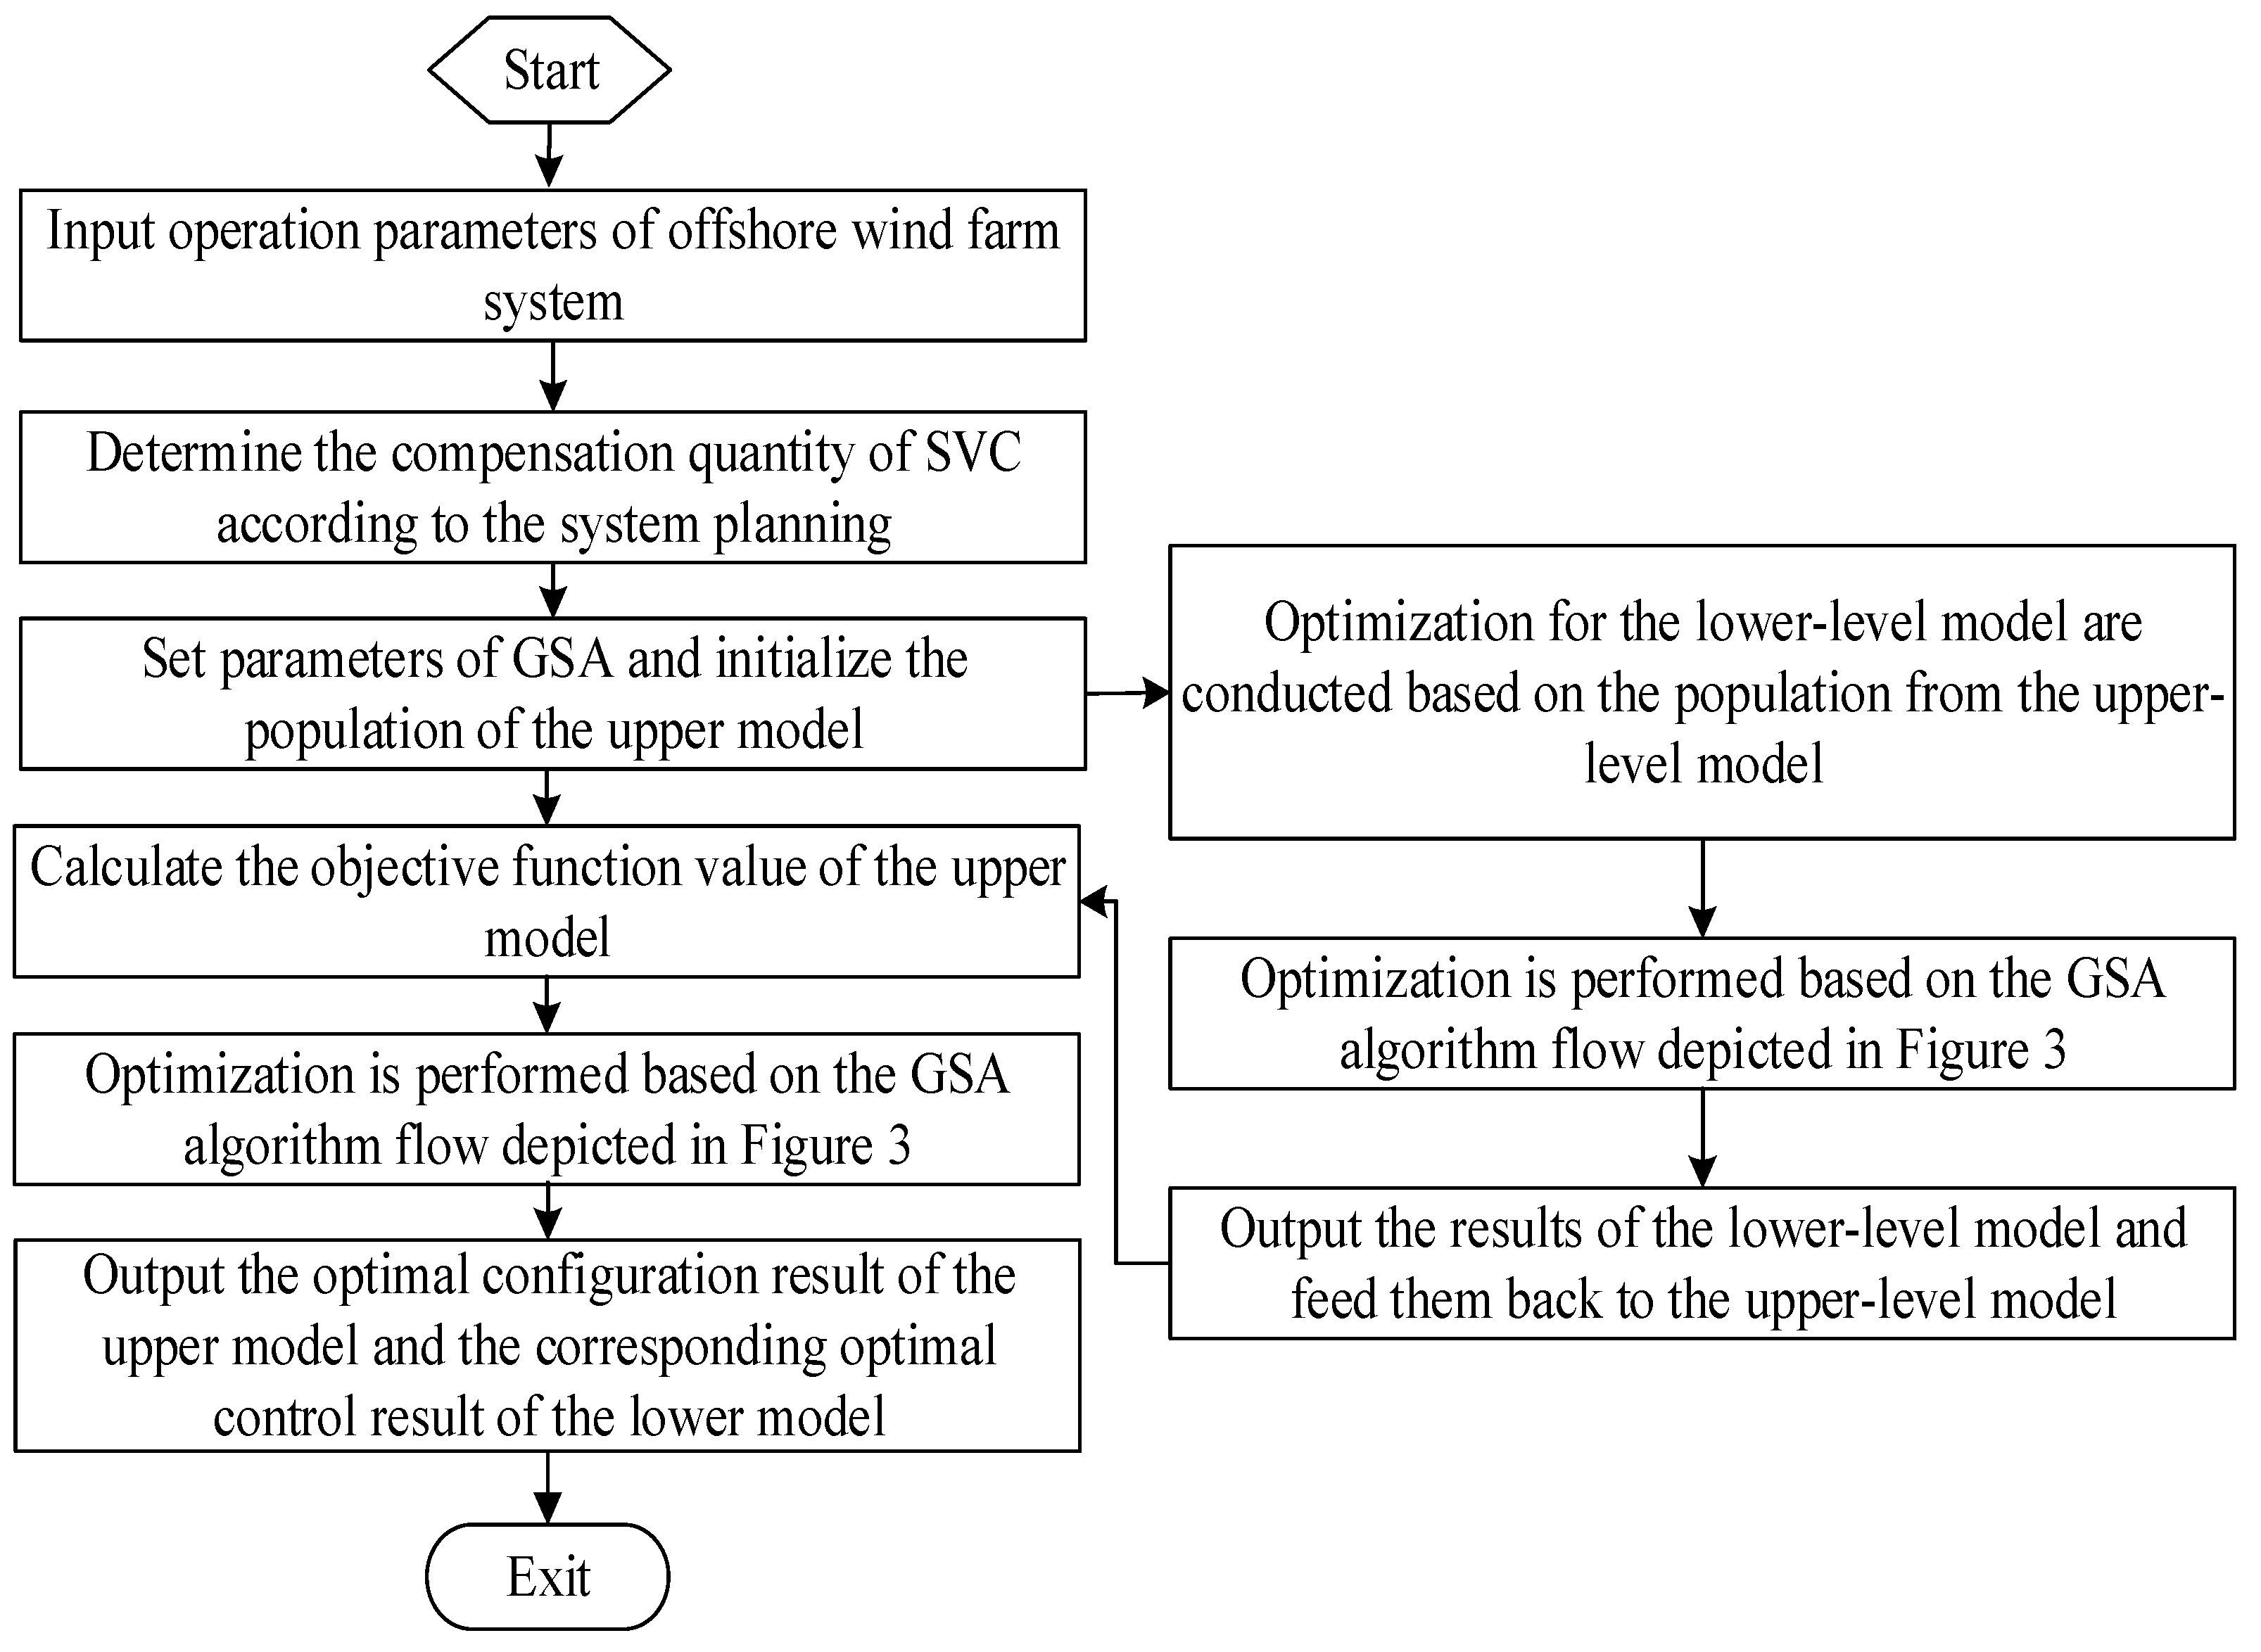
The framework for double-layer RP “configuration-control” model proposed in this paper is shown in Figure 4.

5. Numerical Test and Analysis

5.1. Basic Data and Simulation Conditions

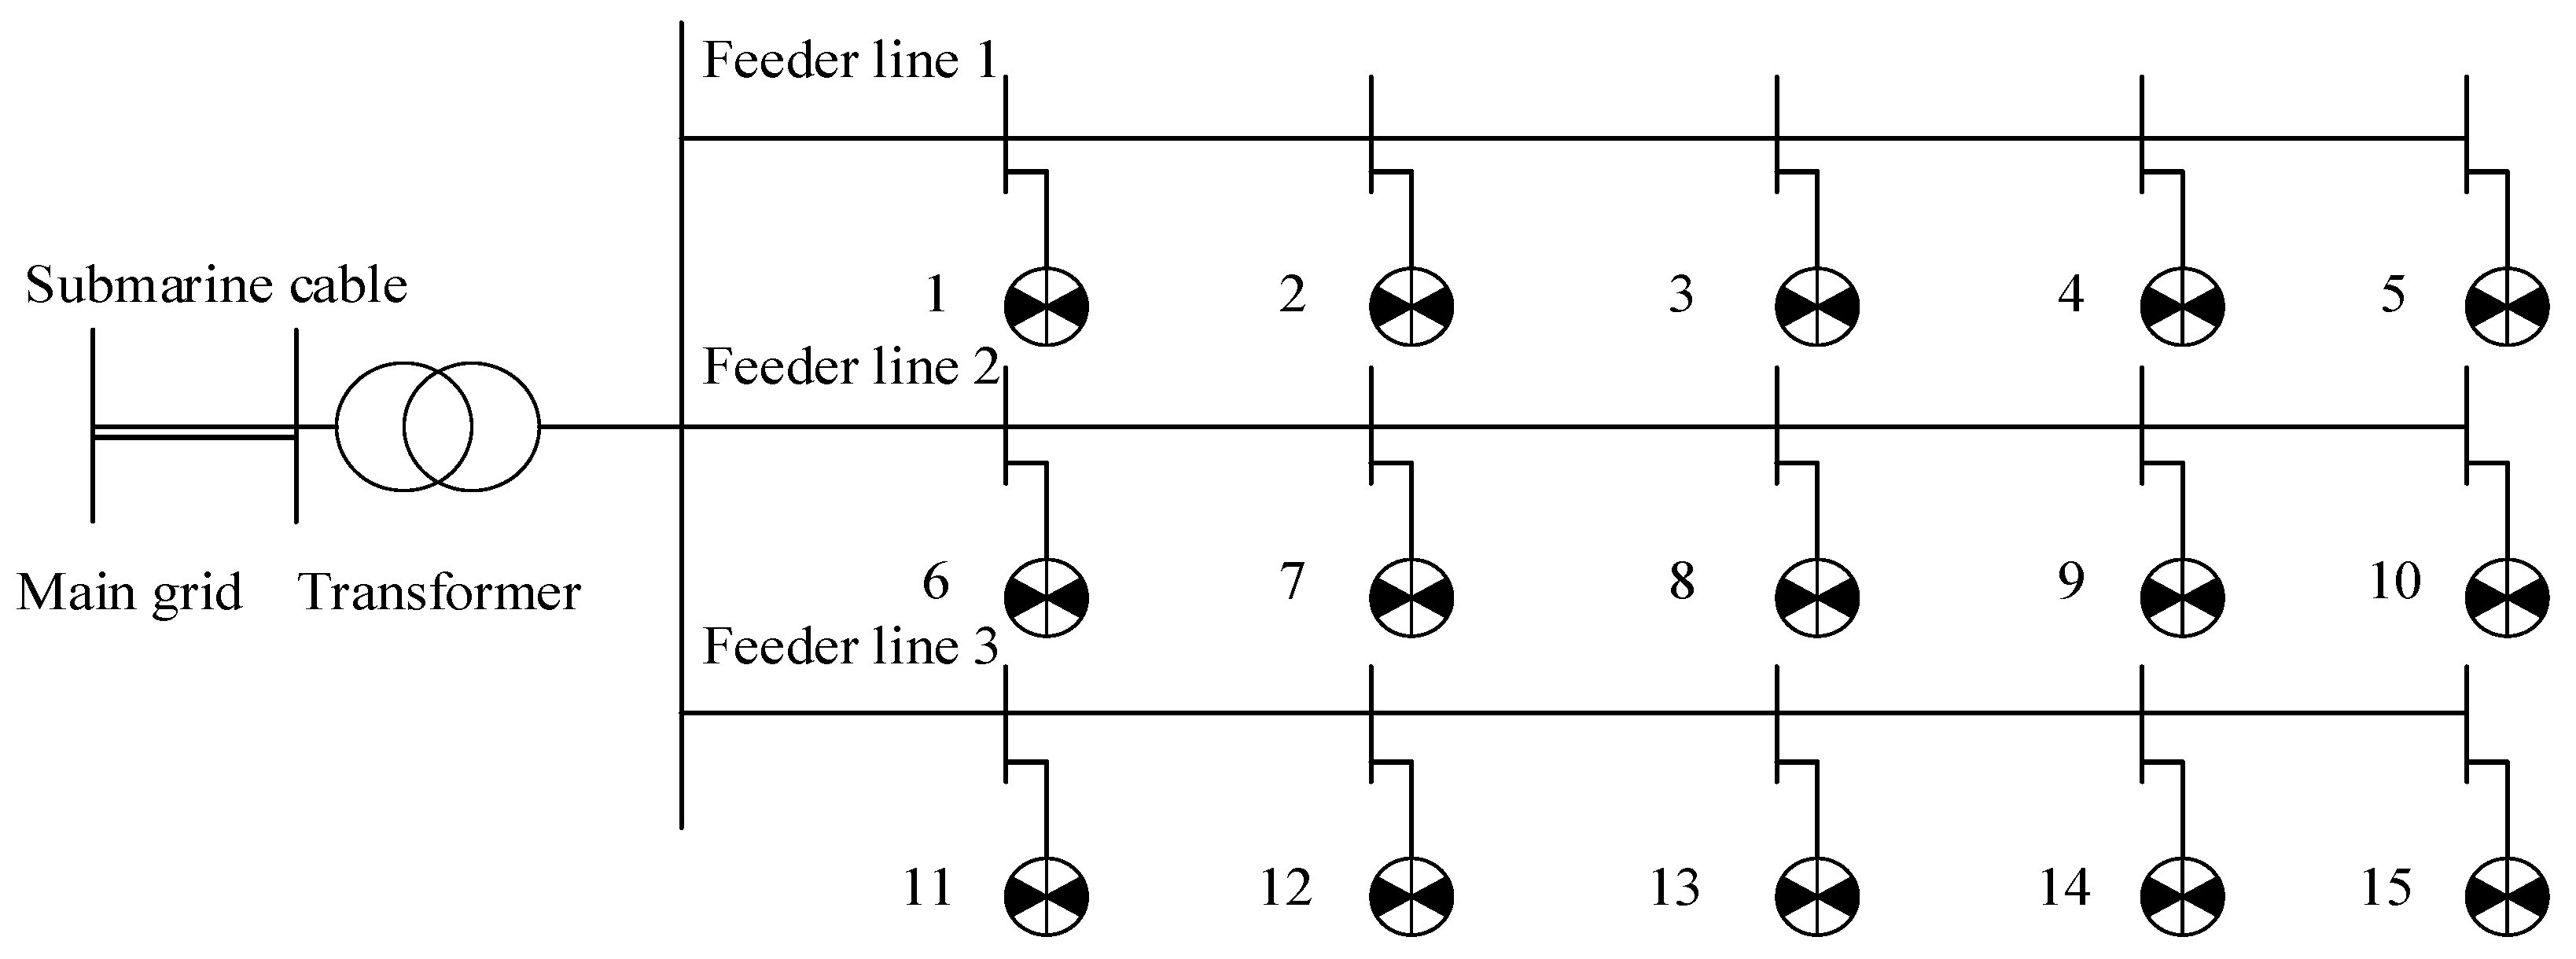
Build a simulated WF with a capacity of 75 MW (each wind turbine has a rated capacity of 5 MW, and with a total of 15 wind turbines, the combined capacity amounts to 75 MW), which is shown in Figure 5. The modeling and simulation of the system were entirely implemented within the MATLAB programming environment. The WF contains three WT feeder lines, with 15 DFIGs, each having a capacity of 5 MW, evenly spaced along these three feeder lines at intervals of 5 km. The rated mechanical power of DFIG is 5 MW, the rated voltage of the stator three phases is 950 V, the rated frequency is 50 Hz, the rated rotor speed is 1170 r/min, and the rated slip rate is 0.2, the detailed parameters of the WF are presented in Table 1. The length of submarine cable is 20 km, the resistance is 0.019 Ω/km, the inductance is 0.255 mH/km, and the capacitance is 0.124 μF/km. In GSA algorithm, G0 is set to 100, α is set to 20, the total number of particles N = 50, and the maximum number of iterations Tmax is 1000. The base capacity is 100 MVA and the base voltage is the rated voltage of different power system components.

5.2. Simulation Results and Analysis

To evaluate the proposed method’s efficacy, its performance is benchmarked against the basic GSA, genetic algorithm (GA), and particle swarm optimization (PSO) algorithm. The planning involves configuring the capacity of RP compensation equipment, specifically installing 5 to 8 SVC with each having a capacity of 5 Mvar, resulting in a total capacity ranging from 25 to 40 Mvar. Figure 6 illustrates the schematic diagram of the SVC configuration results obtained by different algorithms, while Table 2 presents the detailed configuration results obtained by these algorithms.
As can be seen from Figure 5 and Table 2, all four algorithms select nodes 5, 10, and 15 as the SVC configuration points. The primary reason is that nodes 5, 10, and 15, being end nodes, can effectively reduce the flow of RP towards the system’s ends. Additionally, the Basic GSA selects six configuration nodes, resulting in the highest annual system cost. In contrast, GA, PSO, and the method proposed in this paper each select five configuration points, leading to lower annual system costs. Under the same number of node configurations, compared to the GA and PSO algorithms, the proposed method in this paper achieves the lowest annual cost. The main reason is that the improved GSA proposed in this paper, which is an enhancement over the Basic GSA, demonstrates superior optimization performance and yields better results.
Table 3 presents the results of the optimal RP operation for the system under the corresponding optimal configuration scenarios. As shown in Table 3, the system network losses, voltage deviations, and RP margins for Basic GSA are 0.0251, 0.0278, and 0.8714, respectively; for GA, they are 0.0156, 0.0147, and 0.8025, respectively; for PSO, they are 0.0187, 0.0175, and 0.8329, respectively; and for the method proposed in this paper, they are 0.0124, 0.0098, and 0.7566, respectively. Compared with the basic GSA algorithm, the proposed method reduces the system loss by 50.59% and the voltage deviation by 64.75%. It can thus be concluded that, under the corresponding configurations, the proposed method in this paper still yields the best optimization operation results, which aligns with the analytical outcomes shown in Table 2.
Table 4 presents a comparison of the computational efficiency among different algorithms. Since this paper proposes a bi-level RP configuration-control optimization model, the algorithms involve iterative computations for both the upper-level and lower-level models. For Basic GSA, the upper-level model requires 127 iterations, the lower-level model averages 115 iterations, and the total computation time is 121.75 min. For GA, the upper-level model requires 78 iterations, the lower-level model averages 75 iterations, and the total computation time is 73.185 min. For PSO, the upper-level model requires 84 iterations, the lower-level model averages 81 iterations, and the total computation time is 79.56 min. In contrast, the proposed method in this paper requires 73 iterations for the upper-level model, averages 70 iterations for the lower-level model, and has a total computation time of 71.24 min. In terms of computational efficiency, Basic GSA exhibits the highest number of iterations, the longest computation time, and the poorest efficiency, followed by the PSO algorithm and GA. The proposed method in this paper, which employs an improved GSA algorithm in both bi-level models, effectively enhances optimization efficiency, reduces the number of iterations in both levels, and significantly improves computational efficiency, demonstrating the best performance.

6. Conclusions

To mitigate the pervasive power frequency overvoltage in offshore WF caused by submarine cables’ capacitive effects, this paper introduces a novel two-layer RP optimization framework. The core of this approach lies in the synergy between an adaptively improved GSA and a bi-level “configuration-control” model. The upper layer performs optimal planning of RP resources, while the lower layer ensures their real-time coordinated control, collectively achieving full-cycle cost minimization and operational stability. Validated via MATLAB simulations on a large-scale offshore WF, this method demonstrates a 50.59% reduction in system loss and a 64.75% decrease in voltage deviation compared to the basic GSA. These results conclusively validate the superiority of the improved GSA and the efficacy of the proposed co-design framework in enhancing grid voltage stability.
With the increasing number of power electronic devices, new stability issues such as harmonic resonance and transient overvoltage have become prominent. Moreover, after multiple wind farms are aggregated into clusters, traditional control methods may lead to abnormal local voltage fluctuations, and there is a lack of cluster-level collaborative optimization strategies. Due to the limited scope of work in this paper, which results in a lack of in-depth research on the aforementioned issues, overcoming these problems will be the key research focus in the subsequent studies of this paper.

Author Contributions

Conceptualization, Y.L., J.W., F.Z. and F.W.; software, Y.L., J.W., F.Z. and F.W.; investigation, Y.L., J.W., F.Z. and F.W.; writing—original draft preparation, Y.L., J.W., F.Z. and F.W. All authors have read and agreed to the published version of the manuscript.

Funding

This work is funded by The science and technology project of Power China GuiYang Engineering Corporation Limited titled “Research on Key Technologies of Floating Foundations for Deep-Offshore Wind Power and AC Transmission”, with the project number YJ2023-13.

Data Availability Statement

The original contributions presented in this study are included in the article. Further inquiries can be directed to the corresponding author.

Conflicts of Interest

Authors Yu Li, Jianbao Wang and Feng Zhang were employed by the company Power China Guiyang Engineering Corporation Limited. The remaining authors declare that the research was conducted in the absence of any commercial or financial relationships that could be construed as a potential conflict of interest.

Abbreviations

WFwind farms
RPreactive power
GSAgravitational search algorithm
WTwind turbines
ACalternating current
puper unit
POIpoint of interconnection
DFIGsdoubly-fed induction generators
GWEOgrey wolf equilibrium optimizer
STATCOMstatic synchronous compensators
MMCmodular multilevel converter
VSGvirtual synchronous generator
CVaRconditional value at risk
MASmulti-agent system
PMUphasor measurement unit
SVCstatic var compensator
TSCthyristor switched capacitor
TCRthyristor controlled reactor
GAgenetic algorithm
PSOand particle swarm optimization

References

  1. Nishikata, S.; Tatsuta, F. Study on Output Power of Wind Farm Composed of Current-Source Series-Connected Wind Turbines. IEEE Trans. Sustain. Energy 2025, 16, 1827–1836. [Google Scholar] [CrossRef]
  2. Wei, S.; Wang, H.; Fu, Y.; Li, F.; Huang, L. Electrical System Planning of Large-Scale Offshore Wind Farm Based on $N+$ Design Considering Optimization of Upper Power Limits of Wind Turbines. J. Mod. Power Syst. Clean Energy 2023, 11, 1784–1794. [Google Scholar] [CrossRef]
  3. Fu, Y.; Liu, Y.; Huang, L.-L.; Ying, F.; Li, F. Collection System Topology for Deep-Sea Offshore Wind Farms Considering Wind Characteristics. IEEE Trans. Energy Convers. 2022, 37, 631–642. [Google Scholar] [CrossRef]
  4. Xiang, F.; Liao, S.; Zhang, H.; Luo, L. Sub-Synchronous Oscillation Phenomenon Analysis of Grid-Connected Direct Drive-Doubly Fed Hybrid Wind Farms via VSC-HVdc System. IEEE Access 2025, 13, 37966–37978. [Google Scholar] [CrossRef]
  5. Mu, G.; Wu, F.; Zhang, X.; Fu, Z.; Xiao, B. Analytic Mechanism for the Cumulative Effect of Wind Power Fluctuations from Single Wind Farm to Wind Farm Cluster. CSEE J. Power Energy Syst. 2022, 8, 1290–1301. [Google Scholar] [CrossRef]
  6. Ma, Y.; Xie, K.; Zhao, Y.; Yang, H.; Zhang, D. Bi-Objective Layout Optimization for Multiple Wind Farms Considering Sequential Fluctuation of Wind Power Using Uniform Design. CSEE J. Power Energy Syst. 2022, 8, 1623–1635. [Google Scholar] [CrossRef]
  7. Wang, X.; Yang, R.; Shi, Z.; Cai, X.; Shi, X.; Chen, Y. Coordinated Low Voltage Ride-Through of MMC-HVDC Transmission System and Wind Farm with Distributed Braking Resistors. IEEE Access 2022, 10, 87860–87869. [Google Scholar] [CrossRef]
  8. Wu, C.; Zhang, X.-P.; Sterling, M. Wind power generation variations and aggregations. CSEE J. Power Energy Syst. 2022, 8, 17–38. [Google Scholar] [CrossRef]
  9. Raza, M.W.; Raza, M.; Badia, J.G.; Prieto-Araujo, E.; Gomis-Bellmunt, O. Fault Handling Capabilities of Grid-Forming Wind Turbines in Offshore Wind Farms Connected with MMC HVDC System. IEEE Access 2024, 12, 36404–36414. [Google Scholar] [CrossRef]
  10. Stock, A.; Amos, L.; Alves, R.; Leithead, W. Design and Implementation of a Wind Farm Controller Using Aerodynamics Estimated from LIDAR Scans of Wind Turbine Blades. IEEE Control. Syst. Lett. 2021, 5, 1735–1740. [Google Scholar] [CrossRef]
  11. Dong, H.; Zhao, X. Reinforcement Learning-Based Wind Farm Control: Toward Large Farm Applications via Automatic Grouping and Transfer Learning. IEEE Trans. Ind. Inform. 2023, 19, 11833–11845. [Google Scholar] [CrossRef]
  12. Xiang, W.; Tu, R.; Han, M.; Wen, J. Hybrid AC/DC Collection and HVDC Transmission Topology for Large-scale Offshore Wind Farms. CSEE J. Power Energy Syst. 2025, 11, 949–959. [Google Scholar] [CrossRef]
  13. Zou, M.; Wang, Y.; Zhao, C.; Xu, J.; Guo, X.; Sun, X. Integrated Equivalent Model of Permanent Magnet Synchronous Generator Based Wind Turbine for Large-scale Offshore Wind Farm Simulation. J. Mod. Power Syst. Clean Energy 2023, 11, 1415–1426. [Google Scholar] [CrossRef]
  14. Sheng, Y.; Li, C.; Jia, H.; Liu, B.; Coombs, T.A. Investigation on FRT Capability of PMSG-Based Offshore Wind Farm Using the SFCL. IEEE Trans. Appl. Supercond. 2021, 31, 1–4. [Google Scholar] [CrossRef]
  15. Du, C.; Du, X.; Tong, C.; Li, Y.; Zhou, P. Stability Analysis for DFIG-Based Wind Farm Grid-Connected System Under All Wind Speed Conditions. IEEE Trans. Ind. Appl. 2023, 59, 2430–2445. [Google Scholar] [CrossRef]
  16. Mei, M.; Kou, P.; Xu, Y.; Zhang, Z.; Tian, R.; Liang, D. Improving Floating Offshore Wind Farm Flow Control with Scalable Model-Based Deep Reinforcement Learning. IEEE Trans. Autom. Sci. Eng. 2025, 22, 18255–18268. [Google Scholar] [CrossRef]
  17. Lei, Z.; Gao, S.; Zhang, Z.; Yang, H.; Li, H. A Chaotic Local Search-Based Particle Swarm Optimizer for Large-Scale Complex Wind Farm Layout Optimization. IEEE/CAA J. Autom. Sin. 2023, 10, 1168–1180. [Google Scholar] [CrossRef]
  18. Jadidi, S.; Badihi, H.; Zhang, Y. Hybrid Fault-Tolerant and Attack-Resilient Cooperative Control in an Offshore Wind Farm. IEEE Trans. Sustain. Energy 2024, 15, 1365–1379. [Google Scholar] [CrossRef]
  19. Dakic, J.; Cheah-Mane, M.; Gomis-Bellmunt, O.; Prieto-Araujo, E. HVAC Transmission System for Offshore Wind Power Plants Including Mid-Cable Reactive Power Compensation: Optimal Design and Comparison to VSC-HVDC Transmission. IEEE Trans. Power Deliv. 2021, 36, 2814–2824. [Google Scholar] [CrossRef]
  20. Bulut, N.E.; Dandil, E.; Yuzgec, U.; Duysak, A. CMACGSA: Improved Gravitational Search Algorithm Based on Cerebellar Model Articulation Controller for Optimization. IEEE Access 2025, 13, 20847–20870. [Google Scholar] [CrossRef]
  21. Wang, Y.; Gao, S.; Zhou, M.; Yu, Y. A multi-layered gravitational search algorithm for function optimization and real-world problems. IEEE/CAA J. Autom. Sin. 2021, 8, 94–109. [Google Scholar] [CrossRef]
  22. Li, X.; Yang, H.; Li, J.; Wang, Y.; Gao, S. A Novel Distributed Gravitational Search Algorithm with Multi-Layered Information Interaction. IEEE Access 2021, 9, 166552–166565. [Google Scholar] [CrossRef]
  23. Fan, Y.; Zhang, S.; Yang, H.; Xu, D.; Wang, Y. An Improved Future Search Algorithm Based on the Sine Cosine Algorithm for Function Optimization Problems. IEEE Access 2023, 11, 30171–30187. [Google Scholar] [CrossRef]
  24. Zandavi, S.M.; Chung, V.Y.Y.; Anaissi, A. Stochastic Dual Simplex Algorithm: A Novel Heuristic Optimization Algorithm. IEEE Trans. Cybern. 2021, 51, 2725–2734. [Google Scholar] [CrossRef] [PubMed]
  25. Noroozi, M.; Mohammadi, H.; Efatinasab, E.; Lashgari, A.; Eslami, M.; Khan, B. Golden Search Optimization Algorithm. IEEE Access 2022, 10, 37515–37532. [Google Scholar] [CrossRef]
  26. Zhu, J.; Mo, X.; Xia, Y.; Guo, Y.; Chen, J.; Liu, M. Fully-Decentralized Optimal Power Flow of Multi-Area Power Systems Based on Parallel Dual Dynamic Programming. IEEE Trans. Power Syst. 2022, 37, 927–941. [Google Scholar] [CrossRef]
  27. Golla, M.; Reddy, D.V.S.; Thangavel, S.; Padhy, N.P. An Improved Control Strategy for Active Power Injection and Power Quality Enhancement in a Low-Voltage Weak-Grid Integrated PV and Battery System. IEEE Trans. Consum. Electron. 2025, 71, 476–487. [Google Scholar] [CrossRef]
  28. Mahdavi, M.; Siano, P. Impact of Demand-Side Behavior on Line Switching and Reactive Power Management Considering Reconfiguration and Capacitor Costs. IEEE Can. J. Electr. Comput. Eng. 2025, 48, 155–166. [Google Scholar] [CrossRef]
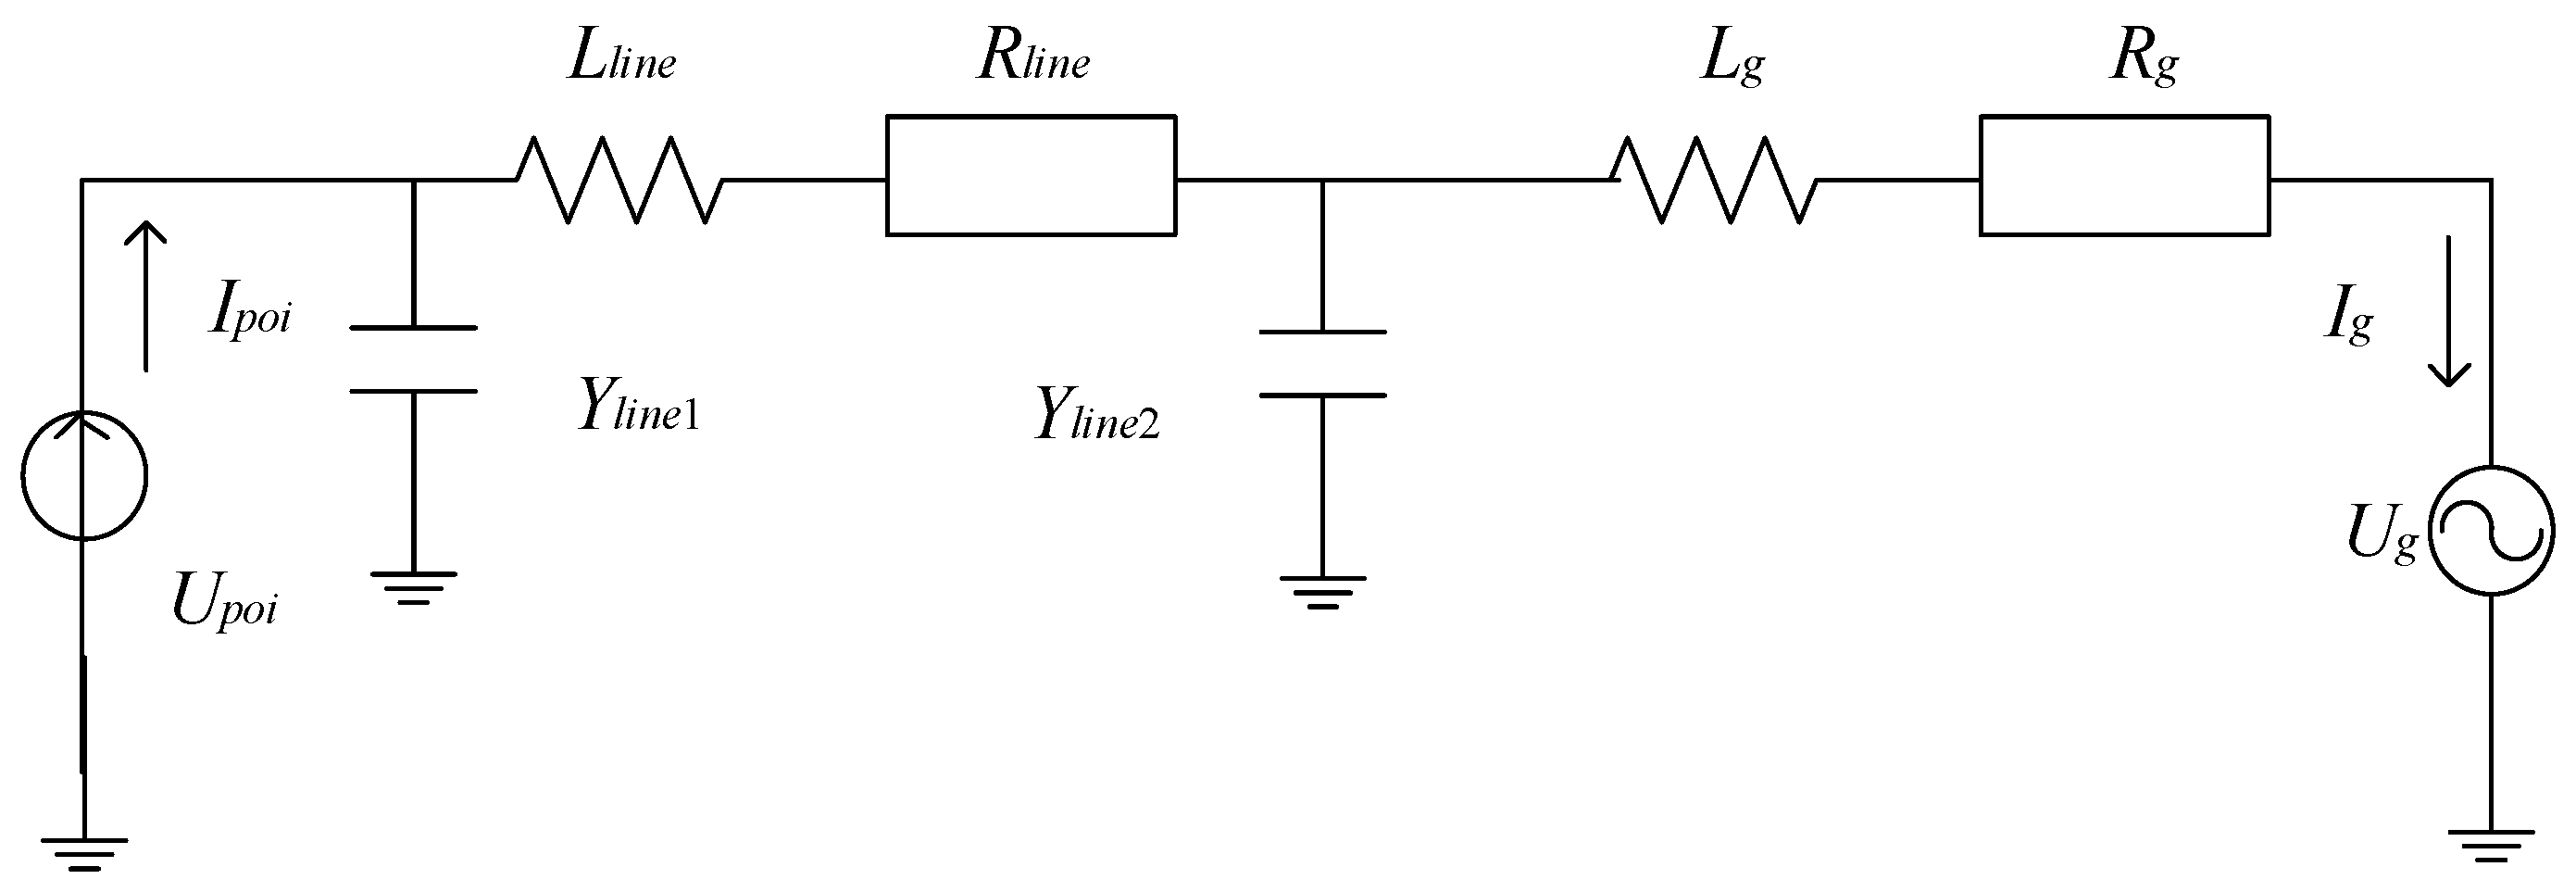
Figure 1. The AC-side equivalent circuit of the grid-connected system for offshore WF.
Processes 13 03408 g001
Figure 2. The Schematic diagram of WF grid connection.
Processes 13 03408 g002
Figure 3. The flow chart of improved GSA.
Processes 13 03408 g003
Figure 4. The framework for double-layer RP “configuration-control” model.
Processes 13 03408 g004
Figure 5. The schematic diagram of the simulated WF.
Processes 13 03408 g005
Figure 6. The schematic diagram of SVC configuration.
Processes 13 03408 g006
Table 1. The parameters of the WF.
ParameterValueParameterValueParameterValue
Rated mechanical power5 MWStator resistance1.5 mΩLine resistance0.132 Ω/km
Rated voltage950 VStator reactance2.0 ΩLine reactance0.130 Ω/km
Rated frequency50 HzRotor resistance1.5 mΩTransformer no-load loss14 kW
Rated speed1170 r/minRotor reactance2.0 ΩTransformer load loss30 kW
Rated slip0.2Mutual reactance1.7 ΩRated capacity100 MVA
Table 2. RP optimization configuration result of upper-level model.
MethodBasic GSAGAPSOThe Proposed Method
Configuration quantity6555
Configuration capacity (Mvar)30252525
Configuration point2, 5, 8, 10,
11, 15
3, 5, 6,
10, 15
2, 5, 10,
12, 15
5, 6, 10,
13, 15
Annual cost (million RMB)1.6711.2561.3811.215
Table 3. RP optimization operation results of lower-level model.
MethodSystem Network Loss (pu)Voltage Deviation (pu)RP Margin (pu)
Basic GSA0.02510.02780.8714
GA0.01560.01470.8025
PSO0.01870.01750.8329
The proposed method0.01240.00980.7566
Table 4. Comparison of computational efficiency.
MethodIteration Times of Upper ModelMean Iteration Times of Lower ModelTotal Calculation Time (min)
Basic GSA127115121.75
GA787573.18
PSO848179.56
The proposed method737071.24
Disclaimer/Publisher’s Note: The statements, opinions and data contained in all publications are solely those of the individual author(s) and contributor(s) and not of MDPI and/or the editor(s). MDPI and/or the editor(s) disclaim responsibility for any injury to people or property resulting from any ideas, methods, instructions or products referred to in the content.