Abstract
This study employs a finite element approach to investigate wellbore stability in interbedded weak formations, such as unconsolidated layers, with a focus on the failure-tendency method, which is derived according to the principle of Mohr–Coulomb theory. The numerical model is successfully verified through analytical solutions for stress distributions around a borehole. Through finite element modeling, the method captures critical shear failure thresholds, exemplifying how variations in horizontal stress anisotropy, orientation of interbedded weak layers, and mechanical properties of layered geological formations impact wellbore stability in stratified formations. Results indicate that the potential unstable regions, aligned in the direction of minimum principal stress, and the range of unstable regions gradually enlarge as the internal cohesive strength decreases. By modeling heterogeneous rock sequences with explicit representation of interbedded weak layers and stress anisotropy, the analysis reveals that interbedded weak layers are prone to shear-driven borehole breakouts due to stress redistribution and relatively lower internal cohesive strength. As compressive stresses concentrate at interfaces between stiff and compliant layers, breakouts are induced at those weak layers along the interfaces; this type of failure is also manifested through a field borehole breakout observation. Simulation results reveal the significant influences of the mechanical properties of layered formations and in situ stress on the distribution of instability regions around a borehole. The study underscores the necessity of layer-specific geomechanical models to predict shear failure in complex layered geological formations and offers insights for optimizing drilling parameters to enhance wellbore stability in anisotropic, stratified subsurface environments.
1. Introduction
Maintaining wellbore stability in weak formations, such as interbedded unconsolidated layers, is particularly challenging due to weak, unconsolidated sediments, complex pressure regimes, mobile salt formations, and the constant risk of water influx. Drilling operations cause the redistribution of stress in rock surrounding a borehole. Depending on mud pressure, in situ stress, and geological conditions, two types of rock failure could occur. They are compressive collapse and tensile fracturing [1]. Borehole breakouts are caused by compressive stress in the surrounding rock, which generates shear failure, identified by compression-induced failures located in diametrically opposed positions aligned with the minimum horizontal stress, indicating the directions of in situ stress. Induced hydraulic fractures are created due to tensile fracturing after the mud pressure is larger than a certain value. Wellbore stability has been studied extensively in drilling-associated activities, especially in the area of oil and gas exploration and production. The stable state of a borehole is affected by multiple factors. Geological conditions usually act as fundamental factors influencing wellbore stability. The properties of the surrounding rock, such as rock strength and joint or nature fracture patterns, play a significant role in determining how well the borehole walls can withstand the acting stress and mud pressure [2,3]. Additionally, the orientation and magnitude of in situ stress determine the extent of stress redistribution in the surrounding rock and thus the corresponding rock failure processes [4,5]; the pore pressure in geological formation contributes to the force balance in the close vicinity of borehole walls and determines the selection and management of mud pressure to prevent fracturing or collapse of a borehole. Though much work has been performed, it is still a complex task to analyze wellbore stability.
Through theoretical, laboratory, and numerical models, the mechanisms behind the different failure types of a borehole are investigated. By simplifying geological conditions and establishing corresponding governing equations, the stress, pore pressure, and temperature distributions around a borehole can be obtained [6]. The displacements and stresses around a circular hole (borehole in petroleum industry) in an infinite elastic solid were first derived by the German engineer Kirsch in 1898 [7]. Most analytical modes on borehole failure analyses are developed based on Kirsch’s solutions. After introducing the theory of poroelasticity by Biot [8], the effects of poroelasticity on wellbore stability were studied extensively. The solution of the stress, displacement, and pore pressure generated by pressurizing a vertical borehole was derived by Detournay and Cheng [9]; the analytical solution is obtained in the Laplace transform space and is then converted to the time domain utilizing an approximate numerical inversion method. Cui et al. [10] studied the poroelastic solution for an inclined borehole; a wellbore stability problem using derived effective stresses and Drucker–Prager criterion was analyzed. Chen [11] performed analytical and numerical analyses on wellbore stability problems in elastoplastic porous formations. Based on the coupled chemo-poro-thermo-mechanical theory [12,13], relatively more complex solutions and analyses on wellbore stability are investigated in the literature. For example, Li et al. [14] studied wellbore stability in a non-hydrostatic stress field utilizing a semi-analytical model and found the thermo-poroelastic process can increase the potential of wellbore shear failure through tangential compressive stress alteration. Ghassemi and Diek [15] considered thermal and chemical osmosis in chemically active rock by extending the theory of thermo-poroelasticity; results indicate thermal osmosis can significantly affect the generated pore pressure and thus wellbore stability. Zhou and Ghassemi [16], using analytical and numerical methods, studied a borehole problem considering chemo-poro-thermoelastic effects in a shale formation; results indicate that the coupling between temperature and salinity causes the variation of pore pressure and has an important impact on wellbore stability. Many studies on theoretical analyses of wellbore stability can also be found in the aforementioned work.
Utilizing laboratory tests, the mechanisms of borehole breakouts are investigated. Laboratory drilling or predrilled hollow cylinder or rectangular prismatic specimens under conventional triaxial or true-triaxial stress conditions are carried out to observe breakout characteristics and the correlation between borehole failure patterns and stress conditions [17]. Different borehole failure patterns, the majority of which are caused by shear failure, have been reported; e.g., spiral-shaped, V-shaped, and slot-shaped breakouts [18,19,20,21]. Haimson and Song [19] conducted a series of laboratory studies on the failure stages of borehole breakouts in limestone and discussed the potential of estimating in situ stress magnitudes through the geometry of breakouts. Lee et al. [21] studied the characteristics of borehole breakouts in sandstones under polyaxial stress conditions; V-shaped breakouts, aligned in the minimum horizontal stress direction, were observed, and different damage patterns leading to the breakouts were revealed, namely intergranular microcracking and intra- and trans-granular microcracking.
For complex geological and operational conditions in field applications, numerical modeling should usually be adopted. The finite element method (FEM) is one of the numerical techniques commonly used in modeling stress, displacement, and pore pressure distributions and thus used in predicting or preventing potential failure zones around a borehole. FEM is particularly suitable for modeling complex geological conditions and coupled chemo-poro-thermo-mechanical problems [16,22]. Many authors have studied FEM modeling to analyze geomechanical stability, focusing on issues such as coupled chemo-poro-thermoelastic effects [2,14,16,23], fracture initiation from wellbore [5], and elastoplastic analyses [11]. Significant associated studies could be found in the aforementioned studies. The boundary element method (BEM) offers computational efficiency in solving infinite domain problems and has advantages in modeling rock discontinuities [24], such as induced hydraulic fracturing initiating from boreholes [25]. For granular and fractured rock formations, the discrete element method (DEM) is an ideal tool to capture particle interactions and to simulate failure mechanisms such as rock collapse and borehole breakouts, especially at micro-scale [21]. To address the issue of wellbore instability during subsea drilling, Sun et al. [26] developed a multi-physics coupled numerical model based on a trial production well in the Shenhu area of the South China Sea and studied the influence of drilling fluid invasion on wellbore stability in gas-hydrate-bearing sediments during drilling. Zhang et al. [23] constructed a thermo-hydro-mechanical (THM) coupled numerical model to examine the influence of different wellbore structures on wellbore stability during marine natural gas hydrate production, simulating stress changes caused by hydrate dissociation to evaluate how borehole design affects stability.
In this study, an evaluation method on shear failure is first proposed according to the principle of the Mohr–Coulomb theory. Subsequently, an FEM model incorporating anisotropic in situ stress and layer-specific mechanical properties (e.g., cohesion strength, friction angle, elastic modulus) is developed and verified. Then, parametric studies on the impacts of stress anisotropy, orientation of interbedded weak layers, and three-dimensional layered formations on wellbore stability are performed. Suggestions on the critical role of layered geological formation and stress anisotropy are provided.
2. Methodology
There are many factors that can influence wellbore stability. A suitable analytical or numerical model should be able to capture the dominating processes during failure analyses. Analytical methods have the advantage of obtaining results efficiently and accurately. Its disadvantage lies in the simplified assumptions that are associated with it. Those assumptions are sometimes not consistent with field situations. In contrast to analytical methods, numerical methods such as FEM could incorporate more detailed geomechanical factors, such as heterogeneity of mechanical properties, the existence of geological discontinuities, and complex drilling operations, where traditional analytical methods may not suffice; they have been widely utilized in wellbore stability analysis in order to evaluate the complex interactions between in situ stresses, drilling operations, and rock properties. In this study, the FEM method is adopted to model complex geological structures around a borehole and to study the impacts of key rock properties on borehole stability. Through discretizing the area of interest into smaller elements, stress, strain, and deformation around a borehole can be simulated. After incorporating rock failure criteria [7], such as Mohr–Coulomb and Hoek–Brown criteria, shear and tensile failures that may lead to borehole collapse or fracturing could be predicted utilizing this method. Due to its flexibility and accuracy in numerical modeling, the FEM method is widely used and is an indispensable tool in designing safe drilling practices, optimizing wellbore trajectory, and mitigating risks associated with wellbore stability.
To investigate factors that may induce shear failure around a borehole, a local stability-evaluation method [27], failure-tendency analysis, is proposed on the basis of the Mohr–Coulomb criterion. A wide range of scenarios are considered to demonstrate the suitability and reliability of the proposed method. Some key factors and processes that influence wellbore stability are studied through the failure-tendency analysis. Homogeneous and isotropic formation rock is assumed considering the relatively low permeability of the rock and short time of drilling operations.
2.1. Stress Field Governing Equations
According to the theory of continuum mechanics, the stress–strain law of isotropic elasticity, often called “Hooke’s law”, has the following form:
where the indices take the values 1, 2, and 3, and repeated indices imply summation; G is the shear modulus; and v is the Poisson’s ratio; they are basic input parameters in simulations. The constitutive equations are expressed in terms of the stress σij and the solid strain εij.
Utilizing the standard Galerkin method of weighted residuals, the constitutive equations (Equation (1)) are discretized in the spatial domain and the weak form is obtained as:
where is the residual term; and are the virtual displacement and the virtual strain; Ω is the solution domain; and Γ is the solution boundary. Detailed procedures to generate the FEM formulation can be found in Gao and Ghassemi [28].
2.2. Shear-Based Failure Evaluation Method
Failure modes around a borehole can generally be classified into two types: tensile and shear failures. Tensile failure is usually evaluated through a comparison between tensile stress and tensile strength of formation rock; its evaluation is relatively easy to implement in FEM simulations. Shear failure is commonly determined through the Mohr–Coulomb failure criterion in rock failure analysis. The criterion is expressed as [7]:
where τ is the critical shear stress acting on the potential shear failure plane; C and φ are mechanical properties of rock, known as internal cohesive strength and frictional angle, respectively; they are key input parameters of the proposed shear-based method; and σn is the normal stress acting perpendicularly on the potential shear failure plane. It should be mentioned that when rock is subjected to a critical compressive stress state, a shear failure plane could be generated, referred to as the potential shear failure plane in this study; its orientation can be determined by the corresponding stress state, as presented in the following.
The normal stress, shear stress acting on the aforementioned potential shear failure plane, can be expressed as the following:
where σ1 and σ3 are maximum principal stress and minimum principal stress, respectively; β is the angle between the direction of maximum principal stress and the normal direction of the failure plane.
The failure-tendency (Tf) on a potential shear failure plane is defined as:
In the above equation (Equation (5)), the term in the numerator represents the “resistance force,” and the term in the denominator stands for the “failure-driving force”; the ratio (Tf) larger than 1.0 indicates a stability state; when the ratio (Tf) is less than 1.0, a potential failure state could be generated. In this study, the failure-tendency (Tf) is utilized to assess the stability state of rock around a borehole.
As shown in Equations (4) and (5), the normal stress, shear stress (σn and τ), and the failure-tendency (Tf) are functions of the angle β. For a given stress condition, the minimum value of the failure-tendency (Tf) is calculated by taking the derivative of Tf with respect to 2β and making the derivative equal zero, which yields the following condition:
After solving β through the above equation and substituting β into Equation (4), the minimum value of failure-tendency (Tf) is obtained through Equation (5). Utilizing the Mohr circle and Mohr–Coulomb failure criterion, simple algebraic operations of Equation (6) reveal that, under a critical stress state,
Similar analyses are performed routinely in the literature, e.g., in Morris et al. [27], Gao et al. [29], and Ge et al. [30]. It should be emphasized that this study focuses on compressional shear failure around a borehole. The combination of shear and tensile failures is a complex process; readers interested in this topic are referred to Ghassemi and Tao [31]. It should be mentioned that the numerical model is assumed to be elastic due to the relatively low permeability of rock (around 0.1~0.01 md).
3. Numerical Analyses
When drilling a well into a geological formation, the in situ stress state would be disturbed, and stress around a borehole would generally experience redistribution due to the removal of stressed rock in the borehole. Depending on the mechanical properties and stress distribution around a borehole, the stability state of the rock surrounding a borehole would be in a stable or unstable status and need to be analyzed during drilling operations. Utilizing the above proposed failure-tendency method, numerical simulations are performed to evaluate stress distribution and stability states around a borehole. Stress distribution around a borehole is compared with analytical solutions to verify the numerical model first. Then, sensitivity analyses are carried out to investigate the impacts of key mechanical properties on wellbore stability. At last, wellbore stability in layered geological formations is studied.
3.1. Model Verification
Using numerical and analytical models, stress distribution in an elastic medium around a vertical borehole has been well-established in the literature [7]. The analytical solution for stress distribution around a vertical borehole is adopted to verify the utilized numerical model, which is under plane strain condition. Analytical solutions on stress distribution around a vertical borehole according to the theory of elastic mechanics can be found in Jaeger et al. [7].
The geometry of the numerical verification case is presented in Figure 1. The size is 5 m by 5 m under plane strain condition; the diameter of the borehole is 0.2 m. Mechanical properties and in situ stress condition are given in Table 1. Figure 2 shows the comparison between numerical results and analytical solutions. The radial stress and hoop stress at θ = 0° and 90° are presented. As can be seen, the numerical results match well with the analytical solution. It should be mentioned that negative stress represents compression in this study.
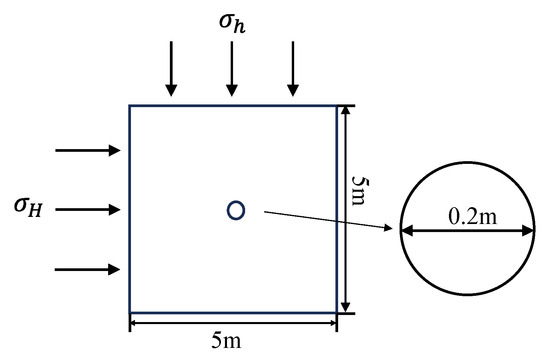
Figure 1.
Illustration of geometry of the utilized numerical model. The size of borehole is enlarged for visualization purpose.

Table 1.
Basic input parameters for verification of stress distribution around a borehole.
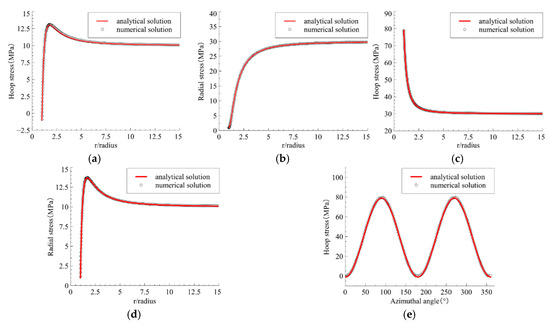
Figure 2.
Comparison between numerical results and analytical solutions. (a) Circumferential (hoop) stress at θ = 0°; (b) radial stress at θ = 0°; (c) circumferential stress at θ = 90°; (d) radial stress at θ = 90°; (e) hoop stress distribution on the borehole surface.
3.2. Influence of Key Mechanical Parameters
Many factors could influence the stability state of a borehole; for example, rock mechanical properties, in situ stress, geological formation characteristics, drilling operations, and so on. Conditions determining the stability status of a borehole can generally be classified into two categories: the first is the stress distribution around a borehole; the second is the mechanical properties of geological formations. Stress conditions in underground formations are usually complex; they can be affected by gravity force, tectonic movement, and many other factors. Mechanical properties of geological formations are also sophisticated in the underground condition. To capture the main characteristics during wellbore stability analyses, simplifications are made in this study. Gravity-force-induced stress and in situ tectonic stress are considered in wellbore stability analyses; the mechanical properties, such as internal cohesive strength and frictional angle, involved in the aforementioned failure-tendency method, are also studied.
3.2.1. Gravity-Force-Induced Stress
Stress induced by gravity force refers to the stress field in the earth’s crust due to the weight of the geological formations. The stress field is a basic stress state in geological structures; it has important influences on the mechanical properties of rock, the evolution of geological structures, and engineering operations. As the depth increases, the gravity-force-induced stress raises. The induced stress manifests itself mainly in compression in the vertical direction; horizontal stresses are also generated due to Poisson’s effect. Vertical and horizontal stresses are calculated separately as follows:
where is the overlying rock pressure; is rock density; is the gravitational acceleration; is the maximum horizontal stress; is the minimum horizontal stress; is the depth of the rock; is the Poisson’s ratio, and is the overlying rock pressure.
The wellbore stability is evaluated in the stress field induced by gravity force only. The depth of the target location is 700 m; the density of rock is assumed as 2400 kg/m3; the vertical and horizontal stresses are calculated as 16.5 MPa and 7.1 MPa, respectively; and the internal cohesive strength and coefficient of friction are set as 8.6 MPa and 30°. No fluid pressure is applied on the borehole surface. Other parameters are the same as those presented in Table 1. Utilizing Equation (5), the failure-tendency (Tf) around a borehole is obtained and presented in Figure 3a. The red circle represents Tf = 2.5. As shown through the contour of failure-tendency, the failure-tendency Tf on the borehole surface is larger than 1.5, which indicates, under the in situ stress induced by gravity force alone, the borehole will be stable. The mechanical properties of rock in geological formations always exhibit heterogeneity. Due to this reason, more scenarios are considered to evaluate the distribution of Tf by reducing the cohesive strength of rock; internal cohesive strength is set separately as C = 5.0 MPa, 4.0 MPa, and 3.0 MPa for each additional scenario. As shown in Figure 3, failure-tendency Tf on the borehole surface decreases as the internal cohesive strength C deceases; the value of it for C = 8.6 MPa, 5.0 MPa, 4.0 MPa, and 3.0 MPa is 1.7, 1.1, 0.98, and 0.82, respectively.
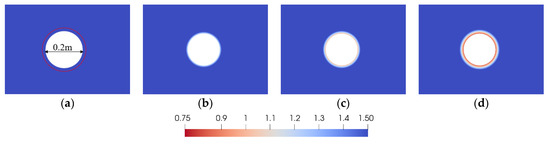
Figure 3.
Failure-tendency distribution around a borehole in the stress field generated by gravity force. (a) Internal cohesive strength C = 8.6 MPa; the red circle represents the failure-tendency Tf = 2.5; (b) C = 5.0 MPa; (c) C = 4.0 MPa; (d) C = 3.0 MPa.
Because the magnitude of horizontal stresses generated by the vertical gravity force is the same, the failure-tendency for a given radius around a borehole has a uniform value in any direction and forms a circular contour, as shown in Figure 3. This type of failure is also referred to as spiral-shaped breakouts [21].
3.2.2. In Situ Stress
Due to the movements of geological structures in tectonically active areas, in situ stress in geological formation is usually different from the stress induced by gravity force; it exhibits apparent anisotropy. Vertical stress is often one of the principal stresses; the rest of the principal stresses are minimum and maximum horizontal (principal) stresses. After drilling a vertical borehole, the generated hoop stress, radial stress, and the corresponding wellbore stability are functions of horizontal stresses. It is due to the anisotropic property of horizontal stresses that the borehole breakouts exhibit variable characteristics; they are functions of both the magnitude and orientation of I -situ stress. It has been confirmed in both theoretical models and practical projects that the compressive failures are in opposed positions on the borehole and aligned with the minimum horizontal principal stress; in other words, the failure regions can be used to indicate the principal stress direction, though how to evaluate the corresponding magnitude is still a challenging task.
Scenarios with different in situ stresses are created to study their influences on wellbore stability. The maximum horizontal stress SHmax is set as 30 MPa; the minimum horizontal stress Shmin is set as 10 MPa and 15 MPa for two scenarios, respectively. The fluid pressure applied on the borehole surface is 7 MPa. All the other parameters are the same as those given in Table 1. As illustrated in Figure 4, the stress difference ΔS between the maximum horizontal stress and minimum horizontal stress (SHmax − Shmin) has a significant influence on failure-tendency distribution; the relatively smaller stress difference ΔS tends to improve the stability state of a borehole for the studied scenarios; the scenario with Shmin = 10 MPa has a larger range of failure zones than that with Shmin = 15 MPa; and, as expected, the orientation of unstable regions (breakouts) is aligned along the direction of Shmin.
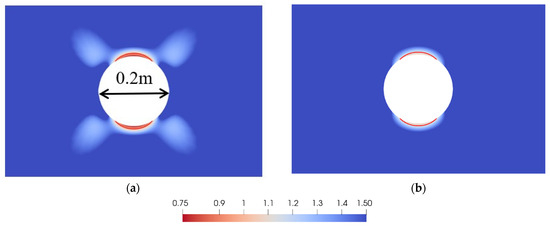
Figure 4.
Effects of in situ stress on failure-tendency distribution around the borehole. (a) Shmin = 10 MPa; (b) Shmin = 15 MPa. The red contour line indicates a failure-tendency equal to 1.0.
The failure-tendency on the surface of the borehole is plotted as a function of azimuthal angle in Figure 5. The unstable regions in Figure 5 are consistent with those indicated through the contour shown in Figure 4. For example, the regions with an azimuthal angle ranging from 59°to 121° in Figure 5a have failure-tendencies less than 1.0, indicating potential unstable regions, which corresponds to the top surface of the borehole shown in Figure 4a. Figure 5 presents the potential unstable regions (Tf < 1) in a straightforward manner.
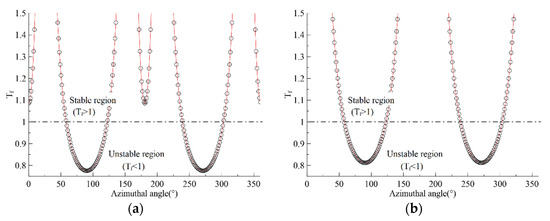
Figure 5.
Failure-tendency plotted as a function of azimuthal angle on the surface of the borehole. (a) Shmin = 10 MPa; (b) Shmin = 15 MPa. Azimuthal angle = 0° indicates the horizontal direction.
3.2.3. Internal Cohesive Strength
Internal cohesive strength is a key parameter to characterize the strength of rock and is also one of the important mechanical properties that determines the stability state of a borehole. In addition to stress states, the internal cohesive strength of rock heavily influences the formation of different types of borehole breakouts. For example, spiral-shaped breakouts are observed in extremely weak sandstones; and V-shaped breakouts are generated by shear failure and are observed in limestones, sandstones, granites [21].
In this section, the influence of internal cohesive strength on wellbore stability is studied considering in situ stress difference (ΔS = SHmax − Shmin > 0). The base case has the following input parameters: SHmax = 30 MPa, Shmin = 10 MPa; pressure applied on borehole surface is 7 MPa; and the internal cohesive strength and coefficient of friction are set as 8.6 MPa and 30°. It is the same case as presented in the previous section; the corresponding failure-tendency distribution is shown in Figure 4a. Three additional cases are modeled based on modifying the internal cohesive strength of the base case; their values are 4.6 MPa, 6.6 MPa, and 10.6 MPa, respectively. Figure 6 presents the failure-tendency distribution for different internal cohesive strengths of rock; the red contour line indicates a failure-tendency equal to 1.0. As illustrated in Figure 6a,b, the failure zones (failure-tendency Tf < 1.0) exist not only on the borehole surface, but also in the close vicinity of the borehole; they form an X-shaped pattern, generated by shear failure; as the internal cohesive strength increases, e.g., from 4.6 MPa to 10.6 MPa, the range of failure zones reduces.
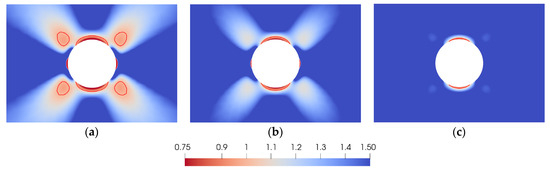
Figure 6.
Effects of internal cohesive strength C on failure-tendency distribution around the borehole. (a) Internal cohesive strength = 4.6 MPa; (b) internal cohesive strength = 6.6 MPa; (c) internal cohesive strength = 10.6 MPa. The red contour line indicates a failure-tendency equal to 1.0.
The failure-tendency on the borehole surface is plotted as a function of azimuthal angle in Figure 7, which shows the azimuthal angles for those potential unstable regions in a straightforward manner and is consistent with the results given through contour in Figure 6. As shown in Figure 7, the unstable regions at angles close to 0° and 180° are much smaller than those with angles close to 90° and 270°; because the maximum horizontal stress is oriented at the azimuthal angle of 0° (and 180°, see Figure 1), it causes stress concentration more severe in regions with azimuthal angles close to 90° and 270°, which is manifested by field observations; as the internal cohesive strength increases, the unstable regions (failure-tendency Tf < 1.0) gradually decrease, e.g., Figure 7c exhibits the least unstable regions.
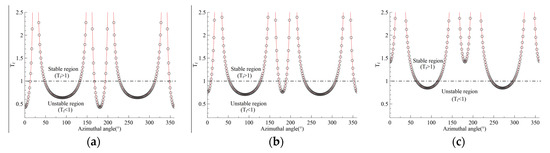
Figure 7.
Failure-tendency (Tf) plotted as a function of azimuthal angle on the surface of the borehole. (a) Internal cohesive strength = 4.6 MPa; (b) internal cohesive strength = 6.6 MPa; (c) internal cohesive strength = 10.6 MPa. An azimuthal angle = 0° indicates the horizontal direction.
3.3. Influence of Layered Geological Formations
Geological formations usually exhibit layered features, especially in sedimentary rock. When a borehole cuts through a layered geological formation, a complex interaction exits between the borehole structure and the layered formation. The stability of the borehole is substantially influenced by the mechanical properties of the individual layers. Each layer in a geological formation can have distinct properties, such as strength and stiffness, which affect the stress and deformation distribution around a borehole. For instance, weak or soft layers could deform more easily, leading to borehole collapse or breakouts. Stress concentration often develops at the boundaries between layers with contrasting mechanical properties. In addition, the presence of interbedded weak layers in a geological formation can also significantly affect wellbore stability; they are often characterized by lower mechanical strength and stiffness compared to the surrounding rock and tend to deform more readily under in situ stress and drilling loads. They usually act as zones of weakness, where shear failure or excessive deformation may occur when a borehole is drilled through these layers. The influence of layered geological formations on wellbore stability is analyzed in this study by incorporating layered geological data into FEM simulations.
3.3.1. Interbedded Weak Layer Intersecting a Borehole in a Two-Dimensional Model
Due to the complexity of geological structures in underground formations, an interbedded weak layer could intersect a borehole in any orientation. As illustrated in Figure 8, θ indicates the angle between the orientation of an interbedded weak layer and the direction of maximum principal stress. By adjusting the angle θ, three scenarios are created with θ = 0°, 45°, and 90°, respectively. The thickness of the interbedded weak layer is 0.08 m. To compare the influence of mechanical strength on failure-tendency distribution, scenarios are built by using different internal cohesive strengths. Table 2 gives the input parameters. There are three groups of scenarios, classified by the internal cohesive strength for geological formation and interbedded weak layer; each group has the same mechanical properties; scenarios in each group differ in the orientation of the interbedded weak layer.
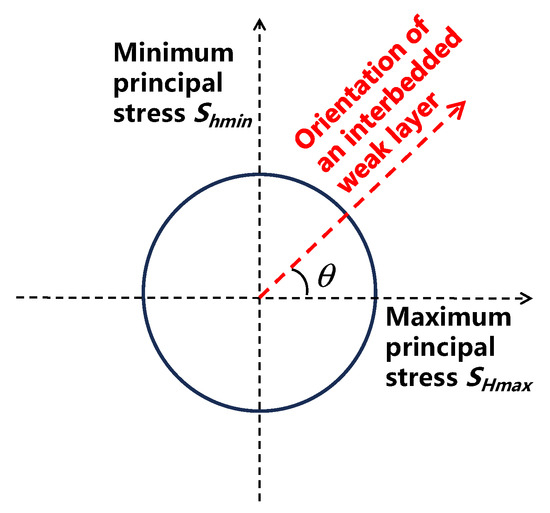
Figure 8.
Illustration of the orientation of an interbedded weak layer intersecting a borehole.
Table 2.
Input parameters for scenarios when an interbedded weak layer intersects a borehole.
The failure-tendency distributions for different scenarios are shown in Figure 9. The red contour line indicates a failure-tendency equal to 1.0. As illustrated, failure-tendency values at locations where the interbedded weak layer intersects the borehole are relatively smaller in all the scenarios, which indicates a higher possibility of failure. The internal cohesive strength has significant influences on the distribution of failure-tendency; scenarios in the first row have the largest values of cohesive strength, while the range of failure-tendency that is less than 1.0 (unstable) is the smallest; the third row has the largest range of unstable zones (failure-tendency Tf < 1.0); the given in situ stress makes the interbedded weak layer at θ = 90° more prone to failure, and it has wider range of unstable zones compared to that at θ = 0°. In scenarios #7, #8, #9 (corresponding to Figure 9g–i), they have the same internal cohesive strength for the interbedded weak layer and the surrounding formation rock; only Young’s modulus is different; simulation results shows that unstable zones (failure-tendency Tf < 1.0) are distributed in a larger range in the interbedded weak layer than in the surrounding geological formation. It could be considered that the discrepancy in unstable zone distribution is caused by the difference in Young’s modulus in scenarios #7, #8, and #9. All the scenarios demonstrate that the weak layers are more susceptible to shear failure due to their relatively lower strength and stiffness.
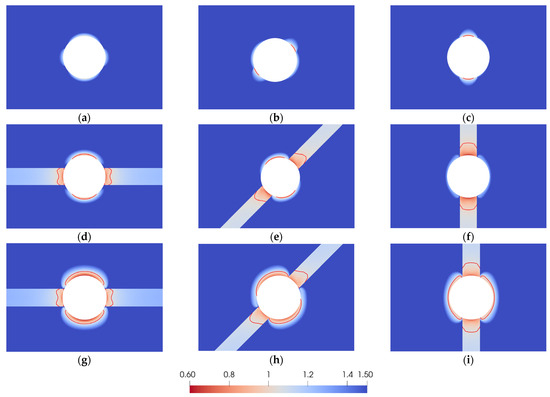
Figure 9.
Failure-tendency distribution around a borehole intersected by an interbedded weak layer. (a–c) Correspond to scenario #1, #2, and #3 in Table 2; (d–f) correspond to scenario #4, #5, and #6; (g–i) correspond to scenarios #7, #8, and #9. The red contour line indicates a failure-tendency equal to 1.0.
3.3.2. Borehole Drilling in Layered Formations in a Three-Dimensional Model
When simulations need to consider more details of a wellbore stability problem, such as borehole spatial orientation, variation in rock properties and geological structures, layering, and the full three-dimensional stress field, a three-dimensional model is usually required. It can capture the true geometry and complex stress distribution in heterogeneous formations. A 3D model is built in this section to simulate the influence of layered formations on wellbore stability. Figure 10 presents the geometry and FEM mesh of the model. As illustrated, there are four layers: red and yellow colors indicate the two interbedded layers, which are called layers #1 and #2, respectively; the top and bottom layers are the surrounding geological formations, and are called layer #3. The mechanical properties and formation parameters are listed in Table 3. The borehole radius is still 0.1 m. The interbedded layers #1 and #2 are “weaker” than the surrounding geological formations (layer #3) in terms of Young’s modulus and internal cohesive strength. Six different scenarios are considered.
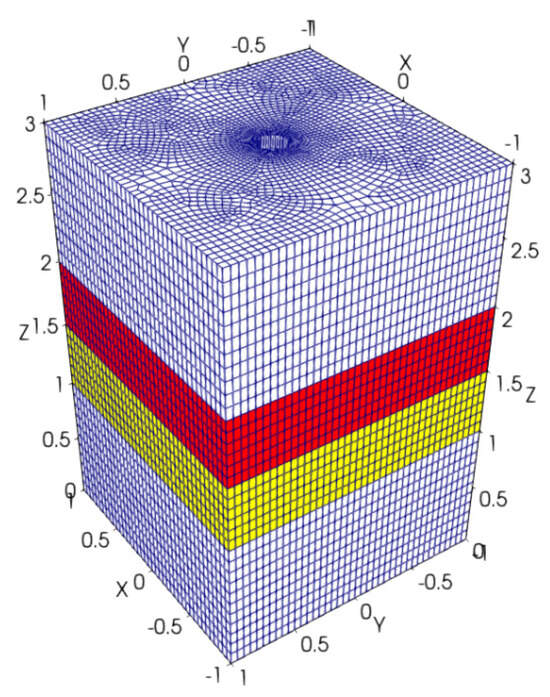
Figure 10.
Geometry and mesh of the 3D borehole model. Red and yellow colors indicate two interbedded layers; the top and bottom layers represent the surrounding geological formations. (Unit: m).
Table 3.
Mechanical properties and formation parameters for 3D modeling of wellbore stability.
Figure 11 shows the surface contour of failure-tendency equal to 1.0, the critical stability state defined through Equation (5), for scenarios listed in Table 3. These scenarios differ in in situ stress Shmin and internal cohesive strength C. The first row of Figure 11 has the internal cohesive strength C of 4.6 MPa, 6.6 MPa, and 8.6 MPa for layer #1, #2, #3, respectively; the second row has C = 1.0 MPa, 4.6 MPa, 8.6 MPa; the first, second, and third columns of Figure 11 have ΔS (SHmax − Shmin) = 5 MPa, 10 MPa, 20 MPa, respectively. As illustrated, the first and second rows have distinct patterns in failure-tendency distribution; instability regions (failure-tendency Tf < 1.0) in the first row are in the diametrically opposed areas aligned in the direction of the minimum horizontal principal stress (x-direction in this study); scenarios in the second row have smaller internal cohesive strength for the interbedded layer #1 and #2, their corresponding instability regions are distributed around the whole borehole surface in layer #1. Figure 12 shows the maximum and minimum principal stresses and the failure-tendency distribution on a horizontal slice at location z = 1.8 m (see the light blue slice in Figure 11d); as illustrated, the red contour line with Tf = 1.0 circles the whole borehole surface. As the stress difference ΔS increases from 5 MPa in the first column to 20 MPa in the third column, the failure zones extend from layers #1 and #2 to layer #3 (surrounding geological formation); instability regions are confined in layers #1 and #2 when the stress difference ΔS = 5 MPa; after increasing ΔS to 10 MPa (second column) and 20 MPa (third column), they occur in layer #3. The failure-tendency pattern on the cross-section plane in layer #1 in Figure 11f is similar to that shown in Figure 4a and Figure 6a. Results in Figure 11 suggest that the internal cohesive strength and in situ stress have a significant influence on wellbore stability, and the failure-tendency method could be used as an effective way to investigate their influences.
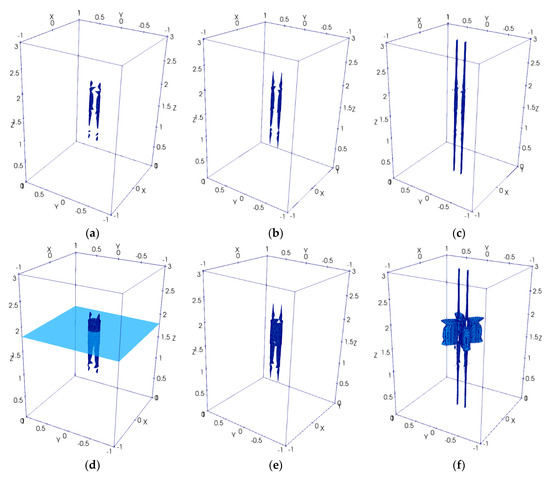
Figure 11.
Contour surface for failure-tendency equal to 1.0. (a–c) Correspond to scenario #1, #2, and #3 in Table 3; (d–f) correspond to scenario #4, #5, and #6. The slice in (d) with light blue color indicates the location z = 1.8 m.
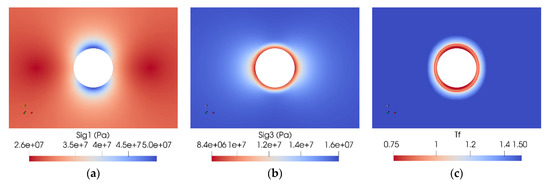
Figure 12.
Stress and failure-tendency distribution on the slice shown in Figure 11d with light blue color at the location z = 1.8 m. (a) Maximum principal stress; (b) minimum principal stress; (c) failure-tendency. The red contour line indicates a failure-tendency equal to 1.0. The results are from scenario #4.
4. Discussion
Utilizing the proposed failure-tendency method, some key parameters that impact wellbore stability are studied thoroughly in previous sections. The selection of mechanical parameters is essential for accurate wellbore stability analysis; however, limitations and challenges still exist in obtaining these parameters. Rock properties can vary significantly over short distances, especially in a complex geological environment. Even within a single borehole, the mechanical properties could have substantial variation due to factors like change in depositional environment, geological structure movement, cementation, or fracturing. Laboratory testing of core samples is the most direct way to obtain rock mechanical properties, but tests are still not able to fully capture this variability. Difficulty in obtaining rock mechanical properties usually leads to over-simplified or inaccurate predictions of rock behaviors. Simulations in this study are intended for investigating the dominating factors influencing wellbore stability and for obtaining the general trends and mechanisms of borehole failure patterns. It should be mentioned that the values of the given mechanical properties and in situ stress in current simulations are not from a particular project or for a typical rock type; they are chosen within the general range for commonly encountered rock [7], e.g., sandstone, granite, and interbedded mud rock. They are used for illustrating the usage of the proposed method and for performing the sensitivity analyses of important parameters.
Underground rock often exhibits complex and non-linear behaviors, particularly under high stress, which could induce plastic deformation [11], strain softening, and cracking [21]. In addition, the interaction between drilling fluids (mud) and rock is complex. For example, the invasion of drilling fluid into weaker layers with high porosity or permeability could alter rock strength and lead to pore pressure and temperature changes [16]. As presented in methodology section, the proposed failure-tendency method relies on relatively simple elastic solutions, which can be obtained with less computational cost and easy-to-use numerical algorithms; also, it requires less inputof rock parameters and could yield qualitative conclusions for evaluating practical applications. Such a way of treatment has been commonly used in evaluating geomechanical problems, especially in areas related to investigating underground geological formations or structures [27,29,30], where “right judgment” might be as important as precise digits.
There are mainly two different mechanical failures in borehole instability, shear failure and tensile failure, each related to how the surrounding rock responds to the stresses induced by drilling operations. Borehole breakouts often occur in high-stress regions, while lost circulation events (tensile) are less frequent but more critical when they take place. Studies on shear failure are more common than on tensile failure because factors influencing shear failure are more complex, including inherent stress conditions of subsurface formations, rock mechanical properties, and operational practices. For underground geological formations, in situ stress is in compression, and the redistribution of stresses around a borehole during drilling often leads to increased shear stresses. Drilling fluids are designed to provide sufficient hydrostatic pressure to prevent collapse (shear failure) but not so much as to cause fractures. The safe mud window is between the collapse pressure and fracture pressure. Since the margin for avoiding shear failure is narrower in many cases, especially in tectonically active areas where high stress anisotropy exists or in formations with interbedded weak layers, shear failure is more frequently encountered. In the results presented through Figure 11, the interbedded weak layers (layers #1 and #2) have distinct failure patterns compared to those in the surrounding geological formations (layer #3) with regard to both the range and extent of failure zones. In addition, scenarios in each column in Figure 11 have different horizontal stress contrast (ΔS) and the corresponding failure-tendency distributions are different; the larger the stress contrast, the greater range of the failure-tendency distribution.
Utilizing FEM modeling and the proposed shear-based failure-tendency method, the impacts of in situ stress, rock mechanical properties, and the orientation of interbedded weak layers on borehole stability are analyzed; the distribution of unstable regions on the borehole surface exhibit strong responses to those factors, which could be classified into two categories: one is the mechanical properties of surrounding rock; the other is the stress state around the borehole. The demonstrated results suggest that measurements to improve borehole stability could be carried out from the aspects of enhancing rock strength and reducing stress concentration around a borehole.
Layered formations are commonly encountered in depositional geological environments. Each layer has different mechanical properties and can behave differently under stress alteration. If one layer is stronger and another is weak, the stress distribution around the borehole would be uneven, thus leading to different failure patterns in adjacent layers, as shown in Figure 11. Also, interbedded formations, such as shale, salt, or mud rock, are usually weak zones. They could experience shear slip or separation, causing borehole instability problems. Figure 13 shows the drilled core samples in layered sandstone formations with interbedded mud layers in Qaidam Basin, China. The muddy sandstone core samples break up naturally after collection and the corresponding borehole sections experience breakouts; they are interbedded between relatively stronger sandstones. During drilling operations, borehole breakouts first occur in the relatively weaker mud layer, causing drilling problems. Geomechanical modeling to account for each layer’s properties is of vital importance in investigating borehole failure mechanisms. In this study, the layered formations are modeled through FEM (see Figure 8 and Figure 10), which can effectively account for stress anisotropy and property heterogeneity. Even though significant progress has been made in solving wellbore stability problems, it is still a challenging task. For example, when layers have different fracture and collapse pressures, selection of the right mud weight would not be easy. It would be tricky to balance between preventing shear failure in weak layers and avoiding tensile failure in stronger ones; also, some layers might be reactive to drilling fluids, like swelling shales, while others are not; this can cause differential swelling and stress.
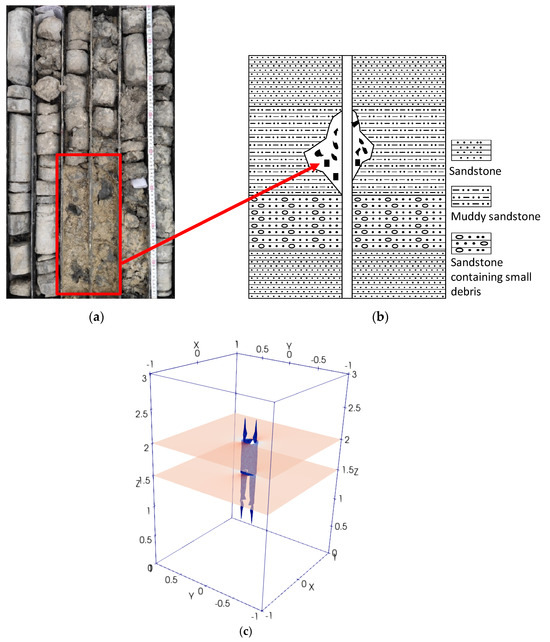
Figure 13.
Borehole drilled in layered formations: (a) core samples from a borehole drilling through interbedded weak layers in Qaidam Basin, China; (b) borehole collapse in underconsolidated muddy sandstone interbedded by surrounding sandstone; (c) simulated failure in interbedded weak layer, which corresponds to Figure 11e.
5. Conclusions
Based on the Mohr–Coulomb theory, a failure-tendency method is proposed to study the borehole stability problem. Layered geological formations, tectonic stress anisotropy, and variations of rock mechanical properties are considered in an FEM-based numerical model. This finite element analysis of wellbore stability demonstrates that stress anisotropy and interbedded mechanical contrasts significantly influence failure patterns; the failure-tendency method predicts unstable regions occurring in diametrically opposed positions aligned with the minimum horizontal stress, and this phenomenon is consistent with field observations; and shear failure evaluated through the failure-tendency method dominates in weak interbedded layers due to stress redistribution around the borehole. Numerical results also reveal the critical role of layer-specific properties and bedding plane orientations in dictating localized instability, as compressive stresses concentrate at interfaces between stiff and compliant layers, promoting breakouts; a field borehole breakout observation manifests this type of borehole failure. In addition, simulation results indicate that the proposed failure-tendency method can effectively account for the impacts when explicitly considering stress anisotropy and interbedded weak layers in an FEM model and that it is a reliable technique to efficiently evaluate wellbore stability problems. This study underscores the necessity of integrating anisotropic geomechanical models with sufficient geological data to predict failure risks and design adaptive drilling strategies for layered formations, ultimately enhancing wellbore integrity in complex subsurface environments. Future work should incorporate poroelastic, thermal, and chemical effects to refine predictive accuracy.
Author Contributions
Conceptualization, Y.H., Q.G., D.F., D.Z., A.G. and H.W.; Methodology, Y.H., Q.G., D.F., D.Z. and A.G.; Software, Q.G., Z.Z. and H.G.; Validation, Q.G., Z.Z. and H.G.; Formal analysis, Y.H., Q.G., D.F., A.G., Z.Z. and H.G.; Data curation, Y.H. and Q.G.; Writing—original draft, Y.H. and Q.G.; Writing—review & editing, Y.H., Q.G., D.F., D.Z., A.G. and H.W.; Visualization, Y.H., Q.G., Z.Z. and H.G.; Supervision, Q.G. All authors have read and agreed to the published version of the manuscript.
Funding
Yuanhong Han, Qian Gao, Desheng Zhou would like to acknowledge the National Key Research and Development Program of China (2022YFC2904301), the National Natural Science Foundation of China (NSFC Grant Nos. 52174029, U23B2089), the Key Research and Development Program of Shaanxi (Program Nos. 2023-YBSF-544, 2024SF-YBXM-622), and the Key Laboratory of Coal Resources Exploration and Comprehensive Utilization, Ministry of Natural Resources (Grant No. SMDZ-KF2025-6) for providing financial support.
Data Availability Statement
Data will be available from the corresponding author upon request.
Conflicts of Interest
The authors declare no conflicts of interest.
References
- Fjær, E.; Holt, R.M.; Horsrud, P.; Raaen, A.M.; Risnes, R. Petroleum Related Rock Mechanics, 2nd ed.; Elsevier: Amsterdam, The Netherlands, 2008. [Google Scholar]
- Li, X.; Feng, Y.; El Mohtar, C.S.; Gray, K. Transient modeling of borehole breakouts: A coupled thermo-hydro-mechanical approach. J. Pet. Sci. Eng. 2019, 172, 1014–1024. [Google Scholar] [CrossRef]
- Zhang, W.; Gao, J.; Lan, K.; Liu, X.; Feng, G.; Ma, Q. Analysis of borehole collapse and fracture initiation positions and drilling trajectory optimization. J. Pet. Sci. Eng. 2015, 129, 29–39. [Google Scholar] [CrossRef]
- Li, Y.; Weijermars, R. Wellbore stability analysis in transverse isotropic shales with anisotropic failure criteria. J. Pet. Sci. Eng. 2019, 176, 982–993. [Google Scholar] [CrossRef]
- Ma, T.; Wang, H.; Liu, Y.; Shi, Y.; Ranjith, P. Fracture-initiation pressure model of inclined wells in transversely isotropic formation with anisotropic tensile strength. Int. J. Rock Mech. Min. Sci. 2022, 159, 105235. [Google Scholar] [CrossRef]
- Cheng, A.H.-D. Poroelasticity; Springer International Publishing: Cham, Switzerland, 2016. [Google Scholar]
- Jaeger, J.C.; Cook, N.G.W.; Zimmerman, R.W. Fundamentals of Rock Mechanics, 4th ed.; Blackwell Publishing Ltd.: Malden, MA, USA, 2007. [Google Scholar]
- Biot, M.A. General Theory of Three-Dimensional Consolidation. J. Appl. Phys. 1941, 12, 155–164. [Google Scholar] [CrossRef]
- Detournay, E.; Cheng, A.-D. Poroelastic response of a borehole in a non-hydrostatic stress field. Int. J. Rock Mech. Min. Sci. Geomech. Abstr. 1988, 25, 171–182. [Google Scholar] [CrossRef]
- Cui, L.; Abousleiman, Y.; Cheng, A.H.-D.; Roegiers, J.-C. Time-Dependent Failure Analysis of Inclined Boreholes in Fluid-Saturated Formations. J. Energy Resour. Technol. 1999, 121, 31–39. [Google Scholar] [CrossRef]
- Chen, S. Analytical and Numerical Analyses of Wellbore Drilled in Elastoplastic Porous Formations. Ph.D. Thesis, The University of Oklahoma, Norman, OK, USA, 2012. [Google Scholar]
- McTigue, D.F. Thermoelastic response of fluid-saturated porous rock. J. Geophys. Res. 1986, 91, 9533–9542. [Google Scholar] [CrossRef]
- Kurashige, M. A thermoelastic theory of fluid-filled porous materials. Int. J. Solids Struct. 1989, 25, 1039–1052. [Google Scholar] [CrossRef]
- Li, X.; Cui, L.; Roegiers, J.-C. Thermoporoelastic modelling of wellbore stability in non-hydrostatic stress field. Int. J. Rock Mech. Min. Sci. 1998, 35, 584. [Google Scholar] [CrossRef]
- Ghassemi, A.; Diek, A. Porothermoelasticity for swelling shales. J. Pet. Sci. Eng. 2002, 34, 123–135. [Google Scholar] [CrossRef]
- Zhou, X.; Ghassemi, A. Finite element analysis of coupled chemo-poro-thermo-mechanical effects around a wellbore in swelling shale. Int. J. Rock Mech. Min. Sci. 2009, 46, 769–778. [Google Scholar] [CrossRef]
- Haimson, B. Micromechanisms of borehole instability leading to breakouts in rocks. Int. J. Rock Mech. Min. Sci. 2007, 44, 157–173. [Google Scholar] [CrossRef]
- Zoback, M.D.; Moos, D.; Mastin, L.; Anderson, R.N. Well bore breakouts and in situ stress. J. Geophys. Res. 1985, 90, 5523–5530. [Google Scholar] [CrossRef]
- Haimson, B.; Song, I. Laboratory study of borehole breakouts in Cordova Cream: A case of shear failure mechanism. Int. J. Rock Mech. Min. Sci. Geomech. Abstr. 1993, 30, 1047–1056. [Google Scholar] [CrossRef]
- Haimson, B.; Lee, H. Borehole breakouts and compaction bands in two high-porosity sandstones. Int. J. Rock Mech. Min. Sci. 2004, 41, 287–301. [Google Scholar] [CrossRef]
- Lee, H.; Moon, T.; Haimson, B.C. Borehole Breakouts Induced in Arkosic Sandstones and a Discrete Element Analysis. Rock Mech. Rock Eng. 2016, 49, 1369–1388. [Google Scholar] [CrossRef]
- Ghassemi, A.; Tao, Q.; Diek, A. Influence of coupled chemo-poro-thermoelastic processes on pore pressure and stress distributions around a wellbore in swelling shale. J. Pet. Sci. Eng. 2009, 67, 57–64. [Google Scholar] [CrossRef]
- Zhang, H.; Cheng, Y.; Li, Q.; Yan, C.; Han, X. Numerical analysis of wellbore instability in gas hydrate formation during deep-water drilling. J. Ocean Univ. China 2018, 17, 8–16. [Google Scholar] [CrossRef]
- Ghassemi, A.; Zhou, X.; Rawal, C. A three-dimensional poroelastic analysis of rock failure around a hydraulic fracture. J. Pet. Sci. Eng. 2013, 108, 118–127. [Google Scholar] [CrossRef]
- Zhang, X.; Jeffrey, R.; Bunger, A.; Thiercelin, M. Initiation and growth of a hydraulic fracture from a circular wellbore. Int. J. Rock Mech. Min. Sci. 2011, 48, 984–995. [Google Scholar] [CrossRef]
- Sun, J.; Ning, F.; Lei, H.; Gai, X.; Sánchez, M.; Lu, J.; Li, Y.; Liu, L.; Liu, C.; Wu, N.; et al. Wellbore stability analysis during drilling through marine gas hydrate-bearing sediments in Shenhu area: A case study. J. Pet. Sci. Eng. 2018, 170, 345–367. [Google Scholar] [CrossRef]
- Morris, A.; Ferrill, D.A.; Henderson, D.B. Slip-tendency analysis and fault reactivation. Geology 1996, 24, 275–278. [Google Scholar] [CrossRef]
- Gao, Q.; Ghassemi, A. Finite element simulations of 3D planar hydraulic fracture propagation using a coupled hydro-mechanical interface element. Int. J. Numer. Anal. Methods Geomech. 2020, 44, 1999–2024. [Google Scholar] [CrossRef]
- Gao, Q.; Cheng, Y.; Fathi, E.; Ameri, S. Analysis of Stress-Field Variations Expected on Subsurface Faults and Discontinuities in the Vicinity of Hydraulic Fracturing. SPE Reserv. Eval. Eng. 2016, 19, 54–69. [Google Scholar] [CrossRef]
- Ge, J.; Jerath, S.; Ghassemi, A. Semianalytical modeling on 3D stress redistribution during hydraulic fracturing stimulation and its effects on natural fracture reactivation. Int. J. Numer. Anal. Methods Geomech. 2020, 44, 1184–1199. [Google Scholar] [CrossRef]
- Ghassemi, A.; Tao, Q. Thermo-poroelastic effects on reservoir seismicity and permeability change. Geothermics 2016, 63, 210–224. [Google Scholar] [CrossRef]


Disclaimer/Publisher’s Note: The statements, opinions and data contained in all publications are solely those of the individual author(s) and contributor(s) and not of MDPI and/or the editor(s). MDPI and/or the editor(s) disclaim responsibility for any injury to people or property resulting from any ideas, methods, instructions or products referred to in the content. |
© 2025 by the authors. Licensee MDPI, Basel, Switzerland. This article is an open access article distributed under the terms and conditions of the Creative Commons Attribution (CC BY) license (https://creativecommons.org/licenses/by/4.0/).