Abstract
The correct management of high-moisture organic waste (HMOW) is crucial to minimize its environmental impact and take advantage of its potential as a valuable resource, thus linking it to the circular economy, sustainable production and recycling. Processes such as anaerobic digestion, composting and, more recently, biodrying have been applied to support the sustainable management of HMOW. However, the latter has not yet been well characterized, so this study focuses on elucidating the behavior of microbial populations and their relationship with physical and chemical conditions during biodrying. In a greenhouse, a semi-static pile with an initial water content of 88%, composed of orange peel waste (80%), sugarcane bagasse (16.5%) and mulch (3.5%) was biodried for 50 days. Biodrying went through three stages: (1) the mesophilic stage, when different microbial populations decompose some organic matter, causing a temperature increase from 25 to 40 °C; (2) the thermophilic stage, in which the highest microbial counts were found, most of which corresponded to the highest temperatures reached and maintained between 40 and 62 °C, and, consequently, to the greatest decrease in water content (from 78 to 41%); and (3) the cooling phase, when the temperature dropped to 23–25 °C. The aeration and mainly the microbial activity were responsible for most of the water evaporation. Microbial activity in biodrying of HMOW ended on day 32, when the humidity was lower than 30% and the water activity (aw) was below 0.8. After that, moisture loss was carried out only by convection and radiation. Obtained biodried organic waste (10% water-content) could be used as an alternative fuel in many industries.
1. Introduction
1.1. Overview of Organic Waste
Studies on sustainable waste management technologies carried out around the world focus on the management of organic waste produced in high volumes in each country, with the aim of providing alternatives for the valorization and sustainable management of resources. In Mexico, almost 76 million tons of organic waste (on a dry basis) are generated annually, with corn, sorghum, sugarcane, wheat, barley, cotton, maguey, orange and coffee waste being the most important [1]. Given the growing concern about food security and sustainability, circular economy issues and valorization of fruits, vegetables and their by-products [2], these wastes can be reused as livestock feed or as construction materials, processed through composting or anaerobic digestion for biogas production or disposed of in landfills and/or in controlled and uncontrolled disposal sites [3].
Inadequate management of organic waste is a source of contamination and health risks due to the pollutants present in biogas and leachate emissions generated by the decomposition of waste. Biogas causes bad odors and air pollution, while leachates can infiltrate the subsoil, causing chemical and microbiological contamination of aquifers and surface water bodies [4]. Other undesirable effects are eutrophication of water bodies, formation of particulate matter, formation of environmental toxins (causing adverse effects on the health of nearby human/animal populations) and the occupation of land (agricultural or urban) for their disposal, among others [5].
A new alternative for the management of high moisture organic waste (HWOW) is biodrying, which aims to remove water from the mass of waste by using the heat generated by microbial populations during the aerobic degradation of organic substances [6]. The biodrying process allows for a considerable reduction in the volume and weight of waste, facilitating its transport, storage and final disposal. In addition, this process increases the calorific value of the waste by reducing the water content, allowing biodried waste to be used as an alternative fuel.
1.2. Physical and Chemical Parameters During Biodrying
During biodrying, parameters such as the initial moisture content, waste porosity, oxygen availability and the temperature reached inside the pile are key elements that affect microbial growth and define the development and duration of the biodrying process. This bioprocess is favored through the incorporation of structuring materials that improve air movement inside the waste piles, favoring gas exchange between the pile and the outside [7]. Several authors have studied the effect of materials such as cornstalks [8], sawdust [9] and pruning residues [10] as structuring agents to give porosity to food HMOW, favoring the biodrying process.
There is an important relationship between water removal and bioheat generation, elevated waste matrix temperature and air flow, as reported by Xin et al. [11]. However, although moisture removal can be used as an indicator of efficiency in the biodrying process [12], at high levels it can also inhibit the reproduction of microorganisms and chemical reactions such as enzymatic or non-enzymatic browning [2]; since it is an aerobic process, high moisture content can limit O2 transport within the pile, while low moisture values limit microbial activity [13].
pH and electric conductivity (EC) are factors that influence the activity of microorganisms, and it is important to analyze them during the development of biodrying. According to Hao et al. [14], pH in biopiles decreases due to ammonia volatilization and organic acid formation, while Wang et al. [15] found that pH increases with ammonium accumulation during the thermophilic phase. A neutral pH is considered optimal for organic degradation. On the other hand, EC reflects the concentration of salts in the substrate to be biodried, increasing during water removal, and could act as an inhibitor of the microbial community, altering the development of the bioprocess.
1.3. Microbial Populations During Organic Waste Biodrying
Some works have already been reported on the study of microbial populations that develop during the biodrying of different types of organic wastes; several of them have focused on sludge biodrying.
Zhang et al. [16] demonstrated that aeration is one of the key factors affecting the biodrying of water treatment sludge, but it did not significantly affect the evolution of microbial community diversity. They found that degradation of easily degradable components in dissolved organic matter (DOM) occurs in the thermophilic stage and that over the course of DOM degradation, the microbial community changes considerably. They also found that the phyla Firmicutes and Proteobacteria were dominant in the thermophilic stage and the genus Ureibacillus (phylum Firmicutes) was the primary thermophilic bacterium. In addition, in the mesophilic stage, the initial microbial community changed significantly and was subsequently stabilized, and the genus Parapedobacter (phylum Bacteroidetes) became dominant, followed by Streptomyces (phylum Actinobacteria), Pedobacter (phylum Bacteroidetes) and Olivibacter (phylum Bacteroidetes).
Other authors [17] have studied the succession of the microbial community during the biodrying process applied to anaerobically digested sludge; they found that aerobic microorganisms (Pseudomonadaceae) replaced the initial anaerobic population (Anaerolinaceae), as the richness of the bacterial phylotype tended to decrease throughout the process; they reported that some genera such as Clostridium and Bacillus are related to the degradation of organic matter.
Biodrying of sludge from wastewater treatment plants has been reported, and it has been observed that the number of bacteria decreased drastically after the temperature increased markedly, and, conversely, the microbial diversity increased when the pile cooled down. During the thermophilic stage, the most dominant bacterial genera were Bacillus, Acinetobacter, Virgibacillus, Rhodobacter and Tetrasphaera. In the cooling stage, the most abundant bacterial genus was Fonticula, and at the end of biodrying, Sphingobacterium was the predominant genus, followed by Flavobacterium [18].
During the study of fungal succession in sewage sludge biodrying, it was found that Ascomycota persisted throughout the bioprocess, only varying in number in each stage; in turn, the three dominant fungal genera were Batrachochytrium, Candida and Fusarium. Fungi of the order Saccharomycetales predominated during the thermophilic stage, and Sordariales predominated at the end of biodrying [19]. Subsequently, changes in fungal biodiversity in the biodrying of sludge from a landfill and beer lees were investigated. Fungal diversity decreased after biodrying, while the richness of this community increased in the mesophilic stage and decreased as the process progressed. Ascomycota and Basidiomycota were the dominant phyla throughout the process, while Pichia was the dominant genus in the thermophilic stage [20].
Guzmán Juárez [21] analyzed the microbial population during the biodrying process applied to garden waste. The results show that the abundance of bacteria, molds and yeasts is within the range of those reported for the composting process (106 to 109 CFU/mL). The number of aerobic mesophilic bacteria increased during the first few days, then decreased and finally increased again at the end of the thermophilic stage. On the other hand, the number of thermophiles decreased as the temperature decreased. The number of molds and yeasts increased again at the end of the thermophilic stage of the process.
On the other hand, it has been reported that during the thermophilic stage of kitchen waste biodrying, the process inactivated pathogenic microorganisms, increased bacterial diversity and decreased fungal diversity, which potentially improved nutrient metabolism (amino acids, carbohydrates, lipids and vitamins), facilitating substrate degradation and energy release [22]. The type and abundance of microorganisms will largely depend on the type of waste subjected to biodrying, but the biodrying method also influences it, since the temperature gradient during the process is not the same in a reactor (condition in which most experiments have been reported), as in biodrying in waste piles with natural (passive) aeration most of the time. This work aimed to characterize the biodrying process, with particular emphasis on elucidating the behavior of microbial populations in the biodrying of a semi-static pile formed by a mixture of orange peel waste, grass and shredded wood.
2. Materials and Methods
2.1. Pile Start-Up
To carry out this study, agro-industrial organic solid waste from a juice extraction company (orange peel) and a sugar mill (sugarcane bagasse) were used, as well as mulch (shredded wood) obtained from a compost production plant located in the north of Mexico City. The experimental biopile used in this work was studied in a greenhouse located in an open space under the environmental and climatic conditions of Mexico City, in the facilities of the Interdisciplinary Professional Unit of Biotechnology at the National Polytechnic Institute of Mexico. The biopile was placed on natural soil without vegetation cover. Using 372.6 kg of a mixture of organic waste (79.7% orange peel waste, 16.7% sugarcane bagasse and 3.6% mulch), a semi-static pile measuring 1.65 m wide, 1.85 m long and 0.90 m high was formed (Figure 1), which was manually turned once a week for a period of 50 days, specifically on days 4, 11, 18, 26, 32, 39 and 46. Manual turning consists of turning the pile with the use of shovels, with the objective of aerating the organic matter to improve the oxygenation conditions of the pile.
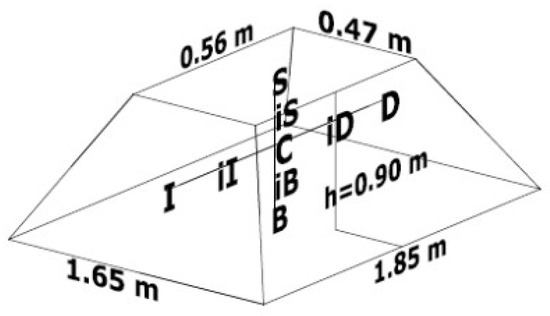
Figure 1.
Initial pile dimensions and location of the thermocouples: center (C); upper (S); base (B); upper midpoint (iS); base midpoint (iB); left (I); right (D); left midpoint (iI); right midpoint (iD).
2.2. Measurement of Physicochemical Parameters in the Pile
To monitor the pile’s moisture content, three samples of material (5 g fresh weight) were taken weekly from points S (center of the upper horizontal face) and C (geometric center at 0.45 m depth). The determination was carried out using the gravimetric method according to NOM-021-RECNAT-2000 [23]; briefly, samples were dried in an oven (60 °C) for 24 h and then were cooled in a desiccator and finally weighed in an analytical balance, and moisture content was calculated by taking the difference between the fresh and dry weights.
The pile’s temperature was monitored daily by taking temperatures at three different times throughout the process. For this purpose, thermocouples connected to an Opto 22® data acquisition system (Opto 22, Temecula, CA, USA) were used, located at five different points of the biopile: iS, C, iB, iI and iD.
The pH determination was carried out on a sample taken from points C and S of the biopile. The process was carried out in triplicate (10 g fresh weight in 90 mL of distilled water) using the potentiometric method.
The determination of O2 and CO2 in the biopile was carried out weekly using four tubes located proportionally on the central vertical axis (iS, C, iB, B) that served as sampling ports for the model 350-S TESTO gas emission analyzer (Testo SE & Co. KGaA, Lenzkirch, Germany).
2.3. Microbiological Characterization
The plate counting technique in petri dishes was used to determinate the number of viable cells in samples, every other day throughout the 50-day process, using decimal dilutions according to Official Mexican Standard NOM-110-SSA1-1994 [24]. Mesophilic and thermophilic bacteria were counted on agar with incubation at 37 °C and 55 °C, respectively, for 48 h. In the case of molds and yeasts, the count was performed on potato dextrose agar at 28 °C for 96 h. Microorganisms from three dilutions were cultured in triplicate. The calculation of CFU/g was performed on a wet basis following Official Mexican Standard NOM-092-SSA1-1994 [25]. Mesophilic and thermophilic bacteria were isolated from the plates used to count microorganisms on trypticase soy agar and molds on potato dextrose agar; for this purpose, they were inoculated in inclined tubes by simple streaking, and the bacteria were also subjected to Gram staining. All culture media were Bioxon brand (BD Bioxon®, Becton Dickinson of Mexico, Cuautitlan, Mexico).
3. Results and Discussion
3.1. Microbial Populations During the Biodrying Process
The waste used to form the biodrying pile was shown to have a high initial microbial load (Figure 2). Of the three substrates, bagasse had the highest mesophilic microbial load with 109 CFU/g fresh sample, while orange waste and mulch had the lowest load (3 × 10⁷ CFU/g). The highest population of thermophiles was found in the mulch, with 3 × 10⁷ CFU/g, while the orange waste and bagasse only had between 2 and 1.4 × 10⁶ CFU/g, respectively. Yeasts were numerous in the bagasse (5 × 10⁷ CFU/g), followed by mulch and orange waste with 107 CFU/g. Finally, the mold population was the lowest, with the mulch contributing 3 × 10⁶ CFU/g and the orange waste and bagasse showing no fungal load.
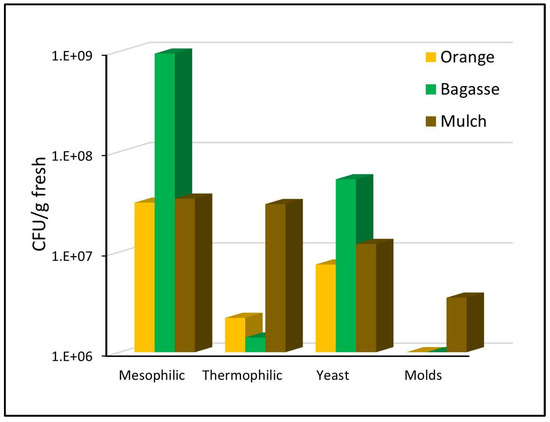
Figure 2.
Initial microbial load in the waste that forms the pile.
According to the proportions of waste used in the pile’s formation, the microbial load contributed by each of them was determined. The initial load of mesophiles in the pile was 1.85 × 10⁸ CFU/g fresh (corresponding to 91% of the total populations); the yeast load was 1.5 × 10⁷ CFU/g fresh (7.5% of the total); the load of thermophiles was 3 × 10⁶ CFU/g fresh (1.5% of the total); and the initial mold load was 1.2 × 10⁵ CFU/g fresh (0.1% of the total populations).
Likewise, it was determined that bagasse waste contributed 86% of the mesophiles to the pile (Figure 3), orange waste contributed 13.4% and mulch contributed only 0.7% of this type of microbial population. The highest proportion of thermophiles was contributed by orange waste with 57%, while mulch contributed 35% and bagasse contributed only 7.6%. The yeast population was contributed in its highest proportion, 58%, by the bagasse, followed by a 39% contribution by the orange waste, and the mulch only contributed 3%. Finally, the mold population was only contributed to by the mulch waste.
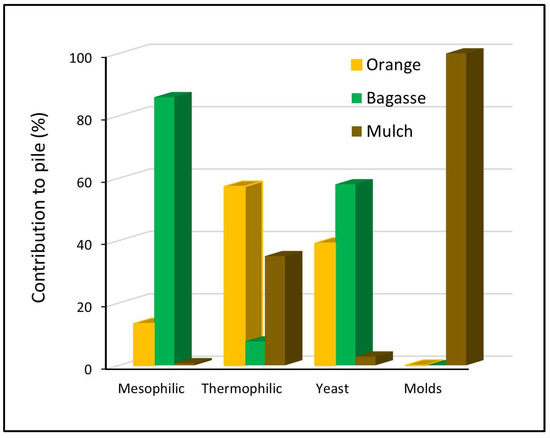
Figure 3.
Percentages of microbial populations that contribute waste to the pile.
Table 1 compiles information on the plate count performed in different biodrying and composting studies. It is observed that the growth ranges of the different microbial populations throughout the process depend on the type of waste and the type of bioprocess. The organic waste used in this work for biodrying started with a mesophilic count of 107 CFU/g fresh (tens of millions) and ended at 109 CFU/g fresh (billions). It was identical to that reported by Guzmán Juárez [21] but higher than that reported by Malinowski and Wolny [26] (starting at 105 and ending at 106) and lower compared to the data of Zhang et al. [27] (starting at 108 and ending at 1010).

Table 1.
Initial and final microbial counts of waste subjected to biodrying and composting.
The count of the thermophilic population along the bioprocess in this study was also of the same order of magnitude (initial millions to final billions) as the range reported by Guzmán Juárez [21], but higher than the data reported by Malinowski and Wolny [26], and lower than the results of Zhang et al. [27]. In addition, initial and final counts of fungi (molds and yeasts) during the biodrying (initial millions to final hundreds of millions) were lower by one order of magnitude compared to the data reported by Guzmán Juárez [21] and Zhang et al. [27], but greater by three orders of magnitude than the data reported by Malinowski and Wolny [26].
Comparing data shown in Table 1, the changes in microbial count reported during biodrying (changes of one to three orders of magnitude) [21,26,27] are lower than during composting (changes of three to five orders of magnitude) [28,29] since, in the latter, biological activity must be maintained for a long time to achieve humification of the waste. However, biodrying aims to reduce moisture in the waste within a short period to obtain a stabilized residue while preserving organic carbon for energy recovery to be used as alternative fuel.
The results about the counts of different microbial populations, determined through the CFU/g fresh count, are presented in Figure 4. All populations showed an upward trend over time, due to the consumption of organic matter (hemicellulose and cellulose) by microorganisms for their cellular growth [30]. At the end of biodrying, microbial populations tended to decrease but remained at higher values than the initial values.
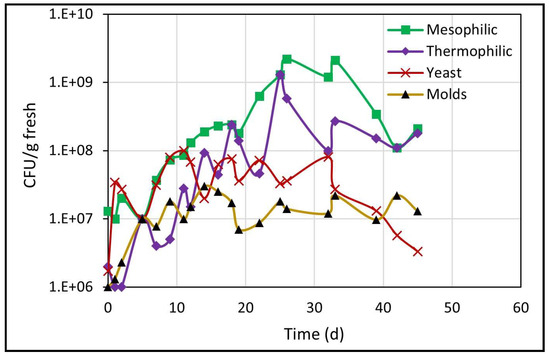
Figure 4.
Development of different microbial populations during biodrying.
The data obtained experimentally coincides with those mentioned by other authors [19] in terms of the fact that most common microorganisms in an organic matter degradation process are mesophilic and thermophilic bacteria (in this work, the initial percentage of both populations was 92.5%), which predominate over fungi due to their ability to grow on complex substrates and their greater tolerance to high temperatures. In this abundance of species, they found that molds and yeasts represented only 0.05% of all the microorganisms analyzed (in this work, the initial load of yeasts and molds was 7.6%). However, collectively, fungi are responsible for the decomposition of many complex polymers in organic waste and enable bacteria to continue the decomposition process once most of the cellulose has been exhausted [31].
As seen in Figure 4, the yeast count increased immediately from 106 to 108 on day 11, at a growth rate of 0.27 d−1, but the next count dropped and remained ranging around 107 until day 32, and thereafter the population count dropped constantly until 3.3 × 10⁶ at the end of biodrying. In addition, the molds population increased from one to 30 million (1 × 10⁶–3 × 10⁷) within the first 14 days, with no subsequent rebound until the end of biodrying.
During the next period from 5 to 26 days of biodrying, mesophilic and thermophilic microorganisms (the most numerous bacterial community) increased steadily. Mesophilic microorganisms increased from cents of millions (108) to billions (109), and that count remained until day 33 and subsequently dropped again to cents of millions (108) through the end of the process. In addition, thermophilic microorganisms increased steadily from millions (106) on day 2 to billions (109) on day 25, and thereafter the count decreased again and was maintained in the range of cents of millions (108) until day 45.
On the other hand, from the cultures carried out at the end of the process (from days 26 to 46), for the plate count, the following microorganisms were isolated from the biodrying pile: 13 strains of aerobic mesophilic bacteria (12 Gram negative: 7 cocci and 5 bacilli), 11 strains of aerobic mesophilic bacteria (12 Gram negative: 7 cocci and 5 bacilli), 11 strains of aerobic thermophilic bacteria (10 Gram positive: 6 cocci and 4 bacilli) and 8 strains of molds. These results reflect the persistence of a high degree of microbial diversity in the biodrying pile in the cooling stage. Some working groups have found that in this biodrying stage, the concentration of organic matter decreases until it remains constant, as it has been consumed in previous stages, so that mesophilic organisms may recolonize the waste matrix and in turn may be able to degrade recalcitrant lignified material [32,33]. For example, Sphingobacterium can degrade fatty acids and some other complex organic compounds, Flavobacterium degrades lignin [18] and Pseudomonas has the ability to control biological agents.
The morphology of the bacterial strains isolated in this work coincides with that of mesophilic bacteria, all of them Gram-negative bacilli, such as Sphingobacterium, Flavobacterium and Pseudomonas that various authors have found in the biodrying process [9,13,17,18,32]. However, it cannot be asserted that these are the genera involved, since no biochemical tests have been performed to confirm this.
According to the literature, Gram-negative bacteria are characteristic of the thermophilic stage in biodrying, and a dominant phylum in this phase is Proteobacteria, of which the genera Acinetobacter and Comamonas are characteristic [9]. Although no Gram-positive bacilli were found, it has been reported that these are also characteristic of the thermophilic stage, as some belong to the phylum Firmicutes with genera such as Bacillus, Ureibacillus, Bacillales and Geobacillus [9,13,16,17,19,32].
3.2. Pile Temperature and Its Relationship to Microbial Populations
In biodrying, microbial activity generates metabolic heat, which is key to the increase in waste pile temperature. The pile temperature is also influenced by aeration and by the ambient temperature inside the greenhouse. According to the results obtained, it was evident that the pile biodrying process went through the three stages described in the literature [34]. The mesophilic stage of the process occurred from days 0 to 4, showing a gra-dual increase in temperature (18 to 40 °C), then the temperature increased until reaching the thermophilic stage from days 5 to 28 (from 40 to 62 °C), and finally the cooling stage occurred from days 28 to 50 (40 to 25 °C), as seen in Figure 5. On days 11, 18, 26, 32 and 39, a decrease in temperature occurred because on these days the pile was turned, causing it to cool.
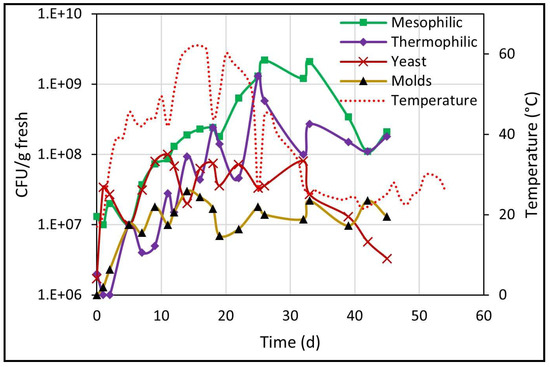
Figure 5.
Behavior of the temperature in the center of the pile related to the growth of microbial populations.
The pile’s temperature behavior during the three stages (Figure 5) partially coincides with the mathematical model developed by Orozco et al. [35], where it was also reported that microbial heat provided only 13% of the heat necessary for water evaporation, with the rest of the energy for moisture loss being provided by solar radiation.
It is important to note that during the thermophilic stage (40 to 62 °C for 15 days), the necessary temperature and time conditions were reached to eliminate the load of possible pathogens present in the pile, which, according to Ocaña et al., can be eliminated at 50–65 °C for 45–60 min [33]. The plate count showed the presence of all four microbial populations during all three biodrying stages regardless of temperature, as well as the increase in CFU/g fresh values throughout the entire process.
For further details on the results, each of the microbial populations and their relationship to pile temperature are analyzed below (Figure 6 and Figure 7).
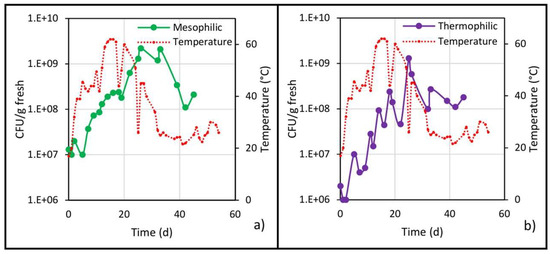
Figure 6.
Populations of (a) mesophilic and (b) thermophilic bacteria and temperature evolution in the center of the pile.
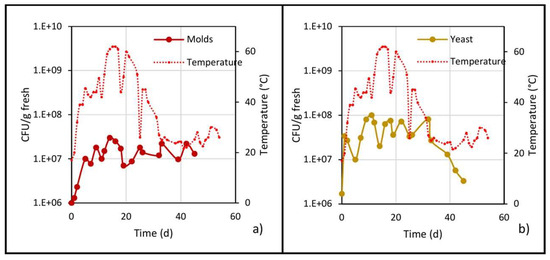
Figure 7.
Microbial populations of (a) molds and (b) yeast, and the evolution of temperature in the center of the pile.
The mesophilic population increased at the beginning of biodrying (Figure 6a) and then decreased as the pile temperature increased, until reaching a minimum value on the fourth day. After the first turning (and hereafter the temperature values were above 40 °C), this population tended to increase, an unexpected behavior since mesophiles develop preferentially between 25 and 40 °C [30].
Although a decrease in mesophiles during the thermophilic stage (40 to 60 °C) and a subsequent increase in the cooling stage (40 to 25 °C) have been reported [21], no similar behavior was observed in the present work in both biodrying stages. On the contrary, on day 26 (end of the thermophilic stage), the highest mesophile value was reached with 2.2 × 10⁹ CFU/g fresh, after which the microbial count decreased even though the pile temperature fell from 40 to 25 °C; this decrease was due (as explained below) to the moisture decrease in the material.
The initial population of thermophiles (108 CFU/g fresh) decreased during the mesophilic stage (0 to 4 days) due to both the low pH value and the fact that its development temperature had not yet been reached (Figure 6b). In the thermophilic stage (5 to 28 days), the microbial count increased steadily, but with decreases in the population before each turning (performed every 7 days) due to a reduction in available oxygen, which in turn is consumed by the microorganisms. Then, when turning was done, the waste pile was cooled and oxygenated, again causing an increase in the microbial population. The behavior of the thermophilic population in the present work is contrary to that reported by Guzmán Juárez [21], since at temperatures below 40 °C, not only did the thermophilic count not decrease in the referred work, but it increased; on the other hand, the results presented here show a greater similarity with the composting process in the behavior of the thermophilic population [28]. Continuing with the thermophilic population, on day 25, the highest count was reached with 1.3 × 10⁹ CFU/g fresh (three orders of magnitude above the minimum), then from day 25 until the end of biodrying, the pile temperature was decreasing, and the population trend was also downward, and by day 39, the thermophilic population stabilized at an average value of 1.4 × 10⁸ CFU/g fresh.
As shown in Figure 7a, the mold population increased in the mesophilic stage and continued doing so until reaching a maximum of 1.5 × 10⁷ CFU/g fresh on day 14, and then practically remained at this value until day 45. Likewise, the mold population was reduced prior to each turning due to a reduction in oxygen, and after turning, when oxygenation of the pile occurs, the population increased again.
Regarding the yeast population, the behavior was very similar to that of the mold population (Figure 7b): in the mesophilic stage, it increased from 106 to 107, reaching a maximum of 108 on day 10; during the thermophilic stage, the population showed ups and downs but remained at an average value of 1.5 × 10⁷; and in the cooling stage, the population decreased until reaching a value of 1.5 × 10⁶ CFU/g fresh.
As described in the previous paragraphs, mesophilic, mold and yeast populations prevailed during the thermophilic stage, a behavior corroborated by different authors. It is well known that mesophiles, fungi and yeasts can grow up to a temperature of 50 °C [30], and this temperature was not reached until the middle of the thermophilic stage, which would explain why they could develop to this point; it is also explained by Matsushita et al. [36], who note that thermo-adaptation involves changes in enzymatic activity and regulation, thus allowing development during the thermophilic stage. Moreover, several authors [19,20,37] have found the presence of thermophilic fungi growing between 45 °C and 60 °C, precisely the range of the thermophilic stage of the biodrying in this work.
3.3. Pile Moisture and Its Relationship to Microbial Populations
In the present work, the pile’s initial moisture content was 88%. By day 50, 89% of the initial content had been removed, resulting in a moisture content of 9.5% at the end of biodrying. This low moisture level would allow the use of the material as biofuel; in addition, it has a higher calorific value due to biodrying. Table 2 shows how the initial and final moisture levels differ depending on the nature of the waste and the biodrying conditions (type of aeration, process in piles or reactors, process time, environmental conditions, etc.). The duration of biodrying will depend on the final moisture level required, which must meet the specifications required for each type of application of the biodried material [38].
Table 2.
Different biodried wastes and their moisture contents.
Figure 8 shows that the highest evaporation rates occurred during the thermophilic stage, since this is when microbial activity is highest, and, therefore, more metabolic heat is generated. From days 4 to 32, the removal percentage gradually increased from 3% to its highest value of 10% reached between days 25 and 32, and then in the cooling stage, evaporation was reduced to a value of 1%.
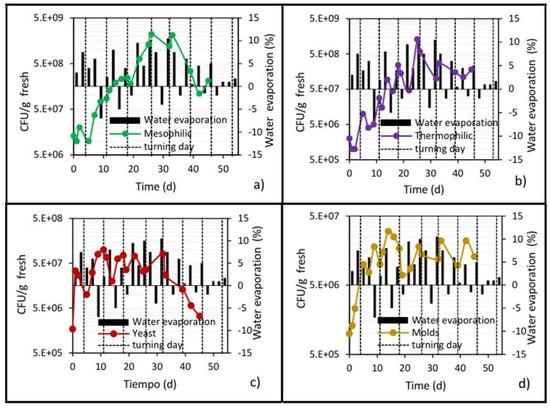
Figure 8.
Development of microbial populations and water removal in the center of the pile. (a) Mesophilic bacteria; (b) Thermophilic bacteria; (c) Yeast; and (d) Molds.
Likewise, episodes of “negative evaporation” occurred, reflected in slight increases in the moisture content of the waste pile, the trend of which can be seen more clearly in Figure 9. This phenomenon is attributed to the condensation of steam inside the pile after turning, because the ambient temperature is 15 to 20 °C lower than the pile temperature [35].
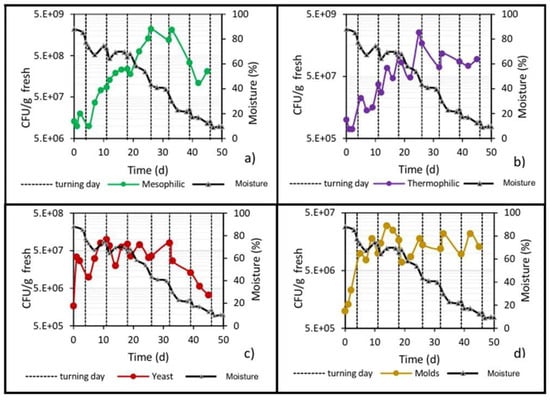
Figure 9.
Development of microbial populations and reduction of moisture in the center of the pile. (a) Mesophilic bacteria; (b) Thermophilic bacteria; (c) Yeast; and (d) Molds.
Figure 9 shows the behavior of the pile’s moisture content in relation to the microbial populations throughout the bioprocess. A gradual loss of moisture can be observed, reaching levels of 40% by day 26 of biodrying. This value is an important threshold [40], because below 35–40%, the microbial populations are under water stress conditions, and at lower moisture values, the microbial populations significantly reduce their growth to practically zero. Orozco et al. [35], in their mathematical model of biodrying behavior, also assert that microbial growth ceases completely when the waste pile reaches 35–40% moisture content, which coincides with the beginning of the cooling stage because there is no longer any microbial heat generation. From that moment on, the pile gradually cools by convection, despite the incident solar radiation, which is never sufficient to heat the center of the pile during the entire biodrying process (the highest temperature that can be reached by solar radiation inside the pile is 23 to 25 °C).
Derived from the above and based on the results of this work, it can be stated that at moisture content values below 35–40%, the microbial population can enter a state of dormancy (to survive) and, therefore, either stop growing or begin to lose viability due to the low water content in the pile. Mesophiles, thermophiles and yeasts decreased their viable count practically after day 30 (40% moisture content), while molds retained their maximum population level. Guzmán Juárez [21] also reported this behavior of microbial populations at moisture levels below 30–35%.
However, it is known that only free water, referred to as water activity (aw), is available for microbial growth [41]. Thus, knowing the critical value of aw in the pile and its relationship to the moisture value allows knowing when microbial growth can be inhibited. To know this critical value, an adsorption isotherm that Omaña et al. [42] developed from a pile composed of 80% orange waste was taken as a reference. This isotherm (obtained at 20 °C) relates the water content in the waste (Xw, dry basis) with the (aw) through Smith’s model: Xw = 0.022–0.498 [log(1-aw)]. With this model, it was estimated that a pile moisture content in the range of 30–35% corresponds to an aw value of 0.80–0.82. On the other hand, it has been reported that the minimum aw values for microbial growth of bacteria, yeasts and fungi are 0.9, 0.88 and 0.8, respectively [43]. It follows, therefore, that when the waste pile’s moisture content is less than 30–35%, microbial activity will be practically zero. The above explains why no significant increase in the plate count was seen after day 30 and towards the end of biodrying; the moisture content was not sufficient to maintain microbial activity, the mold population went into dormancy and the mesophiles, thermophiles and yeasts lost biological viability, reducing their populations.
3.4. The pH of the Pile and Its Relationship to Microbial Populations
Figure 10 shows the pH behavior of the pile during biodrying, where a clear relationship with the stages of the bioprocess and the microbial activity can be observed. It is well known that most fungi (molds and yeasts) prefer a neutral-to-acidic environment (pH < 7.5) [44]; therefore, on days 0 to 4 (the so-called mesophilic stage), when the pH was between 3 and 4, the initial water content was high and O2 was present, the yeast and mold populations showed an immediate increase in plate counts (Figure 10c,d). Such and other bacterial communities acted by oxidating lignocellulosic compounds, and the precursor substances (polyphenol and quinone-like) of organic acids [45] could be responsible for a slight decrease in the initial pH of the waste (pH 3.6 to 3).
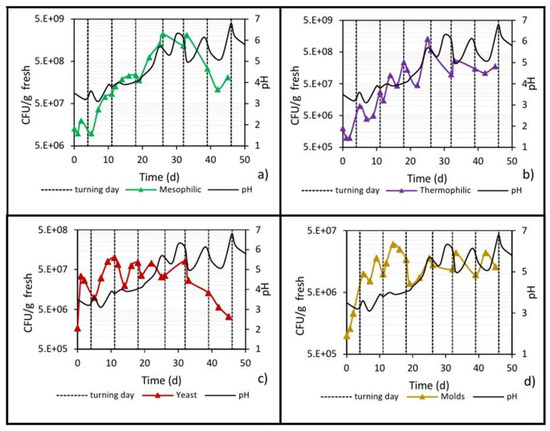
Figure 10.
Development of microbial populations and evolution of pH in the center of the pile. (a) Mesophilic bacteria; (b) Thermophilic bacteria; (c) Yeast; and (d) Molds.
Although inside the biopile the environment was still slightly acidic during the cooling stage (day 26 until the end), the low water content limited the growth of the mold population, which showed ups and downs that were reflected in the pH variations, while the yeasts count decreased from 107 to 106 when pH values were between 5 and 6.
Subsequently, into the thermophilic stage (up to day 26), an increase in pH was observed until reaching a value of 5.7, which continued fluctuating between 5 and 6.5 during the cooling stage (from day 26 until the end), in which microbial growth ceased. The behavior of this parameter is similar to that reported in the work of Wu et al. [9], who attribute it to the fact that during these stages, ammonia is released, and mineralization of organic nitrogen occurs, causing the neutralization of the organic acids initially formed and subsequently causing a gradual increase in pH [40].
In the same graph (Figure 10a), the direct positive relationship between pH behavior and the mesophilic microbial count can be seen. The increase in the mesophilic population in the thermophilic phase caused the pH to increase. In the cooling stage, there was a net decrease, by one order of magnitude, in the mesophilic population, which could explain the decreases in the pH from 6.5 to 5 but not the increase in the opposite direction from 5 to 6.5.
Similarly, when the thermophilic population increased, the pH also increased (Figure 10b), while, even though the cooling stage showed a net reduction in the plate count of almost one order of magnitude, there were slight ups and downs in the thermophilic population, which partially explains the ups and downs in the pH value, as was also previously analyzed.
In relation to the yeast and mold populations (Figure 10c,d), they showed the highest plate counts when the pH was between 3 and 4 (0 to 17 days), results that agree with what is expected for these types of microbial populations [20,35]. The mold population during the cooling stage (up to day 26) showed ups and downs that were reflected in the pH variations; on the other hand, the yeasts were more sensitive to pH values between 5 and 6, causing a drastic decrease in the population by one order of magnitude (from 107 to 106).
3.5. Influence of O2 and CO2 Concentrations on Microbial Populations
Measurements of O2 and CO2 concentrations in the waste pile before and after each turning revealed significant changes (Figure 11). The O2 level in the pile at the beginning was 19%, which decreased until reaching a value of 12% recorded immediately before the first turning (day 4). After manual turning and because of the aeration of the pile, the O2 concentration increased again to a level of 17%. On the other hand, CO2 levels in the same initial period (0 to 4 days) showed the expected behavior and were contrary to that of oxygen; i.e., before turning, a value of 6% was recorded (its previous rise from 0 to 6% was not recorded), which decreased to 2.5% after turning. The function of turning is to accelerate both mass transfer (O2 input and CO2 and water vapor outputs), as well as heat transfer.
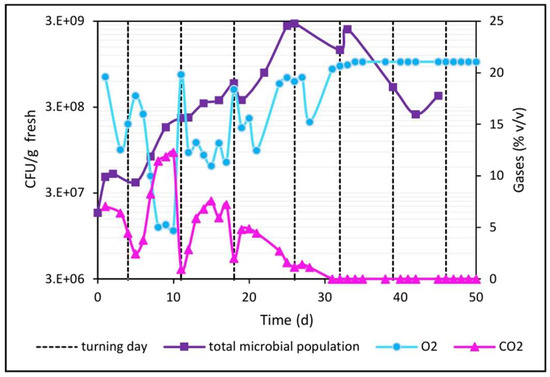
Figure 11.
Development of the microbial population and profile of the contents of O2 and CO2 in the center of the pile.
Prior to the second turning (day 11), the lowest O2 values were obtained (5%) due to the O2 consumption rate of the total microbial population, which achieved a significant exponential growth of almost one order of magnitude (107 to 108) in a short period of time (days 4 to 11); after the turning, the O2 level rose again to 20% as expected, while in this same period, the CO2 presented the highest values (13%), in accordance with the stoichiometry of aerobic respiration; i.e., one mole of CO2 is produced for each mole of oxygen consumed. After the turning, the CO2 dropped to practically 0%, as was also expected.
Before the third turning (period from days 11 to 18), the O2 consumption rate decreased compared to the previous period, thus resulting in oxygen levels not as low as the previous ones, and on the order of 11% (now the microbial population increased only 3 times in the same 7 days of the previous period, indicating a reduction in the microbial growth rate); also, now the CO2 values only increased to 7.5% in accordance with lower oxygen consumption in this time period. After the third turning (day 18), the O2 and CO2 concentrations, as expected, increased (18%) and decreased (2%), respectively.
From days 18 to 21, the oxygen consumption rate continued to decrease (O2 dropped from 18 to 13%; CO2 rose from 2 to 5%), because at the same time, microbial growth also continued to gradually decrease (it only increased from 3 to 6 × 10⁸ CFU/g fresh). In addition, on day 21, an unexpected phenomenon was observed, because without turning, the oxygen level slowly rose until day 26, reaching a value of 19% (and the CO2 slowly decreased from 5 to 1%). This may be due to the fact that microbial growth continues to decrease, and the resulting low oxygen consumption is now balanced by the constant O2 inflow through the porosity of the pile, causing the O2 level to stabilize at 13% as a result of this equilibrium (day 21). Then, as the pile’s moisture level was reduced to 60% (and continued to drop), this could have increased the pile’s porosity by day 21, causing a higher inflow and outflow of gases, and as the oxygen consumption had already been neutralized, now a greater O2 inflow caused the slow increase in the levels of this gas until day 26 (and the same occurred for CO2, which dissipates outside the pile more easily, dropping from 5 to 1%).
After the fourth turning (day 26), O2 and CO2 levels (19% and 1%, respectively) began to be governed mainly by a total microbial population with a clear downward trend. The decreasing moisture contributed to increasing the pile’s porosity, which favored the exchange of gases with the outside. After turning, O2 consumption was even lower than in the immediately preceding period, because the meager microbial growth caused a minimum O2 consumption rate until reaching 16% by day 28, which reached a level of 21% by day 32, only to reach equilibrium with atmospheric oxygen levels. Complementarily, the level of CO2 generation experienced minimal variations until reaching 0% by day 32.
From the fifth turning of the pile (day 32), a 32% moisture level (corresponding to an aw of 0.8 according to the orange waste adsorption isotherm) was insufficient to sustain microbial growth, so the oxygen and CO2 concentrations no longer varied and were balanced with the atmospheric values (21% and 0%, respectively) until the end of biodrying. This shows that with moisture levels below 30–32% in the waste, no microbial growth is sustained, and therefore O2 and CO2 levels in the pile will be equal to atmospheric values. In other words, when gas levels in the pile are equal to ambient levels, it indicates that microbial growth has ended.
4. Discussion
During the first stage (mesophilic phase: days 1 to 4) of biodrying, the moisture and oxygen level were favorable for fungi growth. At this phase, yeasts and molds were metabolically active (growth rates of 0.27 and 0.18 d−1, respectively) and, together with other bacteria, oxidized lignocellulosic compounds and precursor substances (polyphenols and quinones) to organic acids [45]. Overall, the fungi were responsible for the decomposition of many complex polymers in the organic residues and allowed the bacteria, responsible for most of the decomposition and heat generation in biodrying, to continue the bioprocess. The yeast population in the biopile increased from the beginning until day 11 (from 106 to 108 CFU/g fresh). Similarly, the molds population increased a little more than an order of magnitude from the beginning until day 15 (from 106 to 1.4 × 10⁷ CFU/g fresh). Although the molds population showed the lowest growth rate of 0.18 d−1, the molds population remained practically at the same order of magnitude until the end of biodrying.
During the thermophilic phase (days 5 to 28), the moisture of the biopile dropped from 73 to 41% (Figure 9), and the oxygen supplied when the pile was aerated by manual turning helped to maintain the viability of microorganisms. The yeast and mold counts remained the same as in the mesophilic phase, but mesophilic and thermophilic communities increased at growth rates of 0.22 d−1 and 0.25 d−1, respectively. When moisture was less than 43%, conditions were insufficient to maintain microbial metabolism, growth was already null and the mesophilic and thermophilic microorganisms count decreased.
Finally, the last stage was the cooling phase of the pile, when there was no more metabolic heat generation, and the pile was cooled mainly by convection. During the period from day 28 to the end of the process, there was no longer microbial growth or oxygen consumption, and the microbial population could go into a state of latency to preserve its viability. At this stage, the yeast count decreased, but molds maintained their viability. The count of mesophilic microorganisms fell to 108, but the count of thermophilic microorganisms remained at 108, going into a state of latency. The low metabolic activity was evidenced by a decrease in temperature and corroborated by no more oxygen consumption from day 31 to the end (see Section 3.5). The moisture continued to decrease, reaching 10%, and the biodried waste obtained was a stabilized material that could be used as an alternative fuel with a calorific value around 15,500 kJkg−1 [12,46].
Nowadays, energy-oriented conversion technologies are gaining attraction in developed and developing countries to valorize wastes for a renewable energy source, reduce dependency on fossil fuel and keep safer disposal at landfills [47]. Since it is an economic and environmentally friendly method [48], biodrying has been applied in Europe in the last two decades to dry MSW before incineration, and the latter has been applied to obtain refuse derived fuel (RDF) from MSW. In developing countries, agroindustrial and green solid waste can represent an environmental problem (due to the generation of odors and gases during its decomposition) but also an economic one because of the costs of its management and/or disposal. However, biodrying could be a low-cost technology to recover valuable resources from such types of waste.
5. Conclusions
The total microbial population of the waste pile was composed of 91% mesophiles, 7.5% yeasts, 1.5% thermophiles and only 0.1% molds (all contributed by the mulch waste). The mesophilic and thermophilic bacterial populations grew practically during the entire biodrying process (0 to 32 days), showing an increase from 106 to 109 CFU/g fresh, while the yeast and mold populations only grew during the first 15 days (increasing from 106 to 107.5), precisely when the pH values were 3 to 4, and then remained with ups and downs until the end of biodrying. The growth of microbial populations ceased completely when the pile’s moisture level reached values of 30–35% (day 32) because the corresponding aw (0.80–0.82) is insufficient to maintain cellular metabolic activity, and therefore there is no O2 consumption or CO2 generation, so the levels of these gases in the waste pile were equal to the atmospheric ones (21 and 0%, respectively).
During the thermophilic stage of biodrying (days 4 to 28), the most significant temperature changes occurred (40 to 62 °C). The highest water removal rates (8 to 10%) also occurred during this stage, causing the pile’s moisture content to decrease from 78 to 40%; oxygen consumption was the highest, although it gradually decreased later, and the pH changed completely from 3.5 to 6.3.
During the cooling stage (days 28 to 50), pile conditions gradually became more ba-lanced with ambient conditions. Microbial populations continued fluctuating with ups and downs, but they no longer grew, so O2 consumption and CO2 generation were zero until reaching atmospheric levels of 21% and 0%, respectively; the temperature slowly decreased from 40 to 23–25 °C; the average water removal rate decreased, so the moisture level slowly decreased from 40 to 10%; and finally, the pH fluctuated with ups and downs between 5 and 6.3.
Author Contributions
Conceptualization, F.R.-M. and B.P.-G.; methodology, M.d.L.M.-R., F.R.-M. and B.P.-G.; formal analysis, A.G.-H. and C.O.-Á.; investigation, F.R.-M. and A.G.-H.; resources, F.R.-M.; data curation, C.O.-Á. and A.G.-H.; writing—original draft preparation, C.O.-Á. and A.G.-H.; writing—review and editing, C.O.-Á., F.R.-M. and B.P.-G.; supervision, M.d.L.M.-R., F.R.-M. and B.P.-G.; project administration, F.R.-M. and B.P.-G.; funding acquisition, F.R.-M. All authors have read and agreed to the published version of the manuscript.
Funding
This research was funded by Secretaría de Investigación y Posgrado del Instituto Politéc-nico Nacional, grant number SIP 20180146 and SIP 20241607.
Data Availability Statement
Data are contained within the article.
Conflicts of Interest
The authors declare no conflicts of interest.
References
- Valdez Vázquez, I.; Acevedo Benítez, J.A.; Hernández Santiago, C. Distribution and potential of bioenergy resources from agricultural activities in Mexico. Renew. Sustain. Energy Rev. 2010, 14, 2147–2153. [Google Scholar] [CrossRef]
- Tan, C.H.; Hii, C.L.; Borompichaichartkul, C.; Phumsombat, P.; Kong, I. Valorization of fruits, vegetables, and their by-products: Drying and bio-drying. Dry. Technol. 2022, 40, 1514–1538. [Google Scholar] [CrossRef]
- Vargas Corredor, Y.A.; Pérez Pérez, L.I. Aprovechamiento de residuos agroindustriales en el mejoramiento de la calidad del ambiente. Rev. Fac. Cienc. Básicas 2018, 14, 59–72. [Google Scholar] [CrossRef]
- Cárdenas Moreno, P.R.; Piña-Guzmán, A.B.; Robles-Martínez, F. Estimación del biogás generado en sitios de disposición final del Estado de México. Rev. Int. Contam. Ambient. 2021, 37, 27–38. [Google Scholar] [CrossRef]
- Mancini, E.; Arzoumanidis, I.; Raggi, A. Evaluation of potential environmental impacts related to two organic waste treatment options in Italy. J. Clean. Prod. 2019, 214, 927–938. [Google Scholar] [CrossRef]
- Maia, G.D.; Horta, A.C.L.; Felizardo, M.P. From the conventional to the intermittent biodrying of orange solid waste biomass. Chem. Eng. Process. Process Intensif. 2023, 188, 109361. [Google Scholar] [CrossRef]
- Yang, B.; Zhang, L.; Jahng, D. Importance of Initial Moisture Content and Bulking Agent for Biodrying Sewage Sludge. Dry. Technol. 2014, 32, 135–144. [Google Scholar] [CrossRef]
- Yuan, J.; Zhang, D.; Li, Y.; Chadwick, D.; Li, G.; Li, Y.; Du, L. Effects of adding bulking agents on biostabilization and drying of municipal solid waste. Waste Manag. 2017, 62, 52–60. [Google Scholar] [CrossRef] [PubMed]
- Wu, Z.Y.; Cai, L.; Krafft, T.; Gao, D.; Wang, L. Biodrying performance and bacterial community structure under variable and constant aeration regimes during sewage sludge biodrying. Dry. Technol. 2017, 36, 84–92. [Google Scholar] [CrossRef]
- Mohammed, M.; Ozbay, I.; Durmusoglu, E. Biodrying of green waste with high moisture content. Process Saf. Environ. Protect. 2017, 3, 420–427. [Google Scholar] [CrossRef]
- Xin, L.; Li, X.; Bi, F.; Yan, X.; Wang, H.; Wu, W. Accelerating food waste com-posting course with biodrying and maturity process: A pilot study. ACS Sustain. Chem. Eng. 2021, 9, 224–235. [Google Scholar] [CrossRef]
- Contreras-Cisneros, R.M.; Orozco-Álvarez, C.; Piña-Guzmán, A.B.; Ballesteros-Vásquez, L.C.; Molina-Escobar, L.; Alcántara-García, S.S.; Robles-Martínez, F. The Relationship of Moisture and Temperature to the Concentration of O2 and CO2 During Biodrying in Semi-static Piles. Processes 2021, 9, 520. [Google Scholar] [CrossRef]
- Cai, L.; Chen, T.-B.; Zheng, S.-W.; Liu, H.-T.; Zheng, G.-D. Decomposition of lignocellulose and readily degradable carbohydrates during sewage sludge biodrying, insights of the potential role of microorganisms from a metagenomic analysis. Chemosphere 2018, 201, 127–136. [Google Scholar] [CrossRef]
- Hao, Z.; Jahng, D. Variations of organic matters and extracellular enzyme activities during biodrying of dewatered sludge with different bulking agents. Biochem. Eng. J. 2019, 147, 126–135. [Google Scholar] [CrossRef]
- Wang, K.; Wang, Y.Y.; Chen, T.B.; Zheng, G.D.; Cao, M.K.; Cai, L. Adding a recyclable amendment to facilitate sewage sludge biodrying and reduce costs. Chemosphere 2020, 256, 127009. [Google Scholar] [CrossRef] [PubMed]
- Zhang, J.; Cai, X.; Qi, L.; Shao, C.; Lin, Y.; Zhan, J.; Wei, Y. Effects of aeration strategy on the evolution of dissolved organic matter (DOM) and microbial community structure during sludge bio-drying. Appl. Microbiol. Biotechnol. 2015, 99, 7321–7331. [Google Scholar] [CrossRef] [PubMed]
- Li, X.; Dai, X.; Yuan, S.; Li, N.; Liu, Z.; Jin, J. Thermal analysis and 454 pyrosequencing to evaluate the performance and mechanisms for deep stabilization and reduction of high-solid anaerobically digested sludge using biodrying process. Bioresour. Technol. 2015, 175, 245–253. [Google Scholar] [CrossRef] [PubMed]
- Cai, L.; Chen, T.B.; Gao, D.; Yu, J. Bacterial communities and their association with the bio-drying of sewage sludge. Water Res. 2016, 90, 44–51. [Google Scholar] [CrossRef]
- Cai, L.; Krafft, T.; Chen, T.B.; Lv, W.Z.; Gao, D.; Zhang, H.Y. New insights into biodrying mechanism associated with tryptophan and tyrosine degradations during sewage sludge biodrying. Bioresour. Technol. 2017, 244, 132–141. [Google Scholar] [CrossRef] [PubMed]
- Liu, T.; He, J.; Cui, C.; Tang, J. Exploiting community structure, interactions and functional characteristics of fungi involved in the biodrying of storage sludge and beer lees. J. Environ. Manage. 2019, 232, 321–329. [Google Scholar] [CrossRef] [PubMed]
- Guzmán Juárez, C.A. Caracterización Microbiológica de Una Pila de Biosecado. Bachelor’s Thesis, National Polytechnic Institute, Mexico City, Mexico, 2016. [Google Scholar]
- Cao, M.K.; Guo, H.T.; Zheng, G.D.; Chen, T.B.; Cai, L. Microbial succession and degradation during kitchen waste biodrying, highlighting the thermophilic phase. Bioresour. Technol. 2021, 326, 124762. [Google Scholar] [CrossRef]
- DOF. NORMA Oficial Mexicana NOM-021-RECNAT-2000; DOF: Mexico City, Mexico, 2000. [Google Scholar]
- DOF. NORMA Oficial Mexicana NOM-110-SSA1-1994; DOF: Mexico City, Mexico, 1994. [Google Scholar]
- DOF. NORMA Oficial Mexicana NOM-092-SSA1-1994; DOF: Mexico City, Mexico, 1994. [Google Scholar]
- Malinowski, M.; Wolny Koładka, K. Microbiological and Energetic Assessment of the Effects of the Biodrying of Fuel Produced from Waste. Ecol. Chem. Eng. S 2017, 24, 551–564. [Google Scholar] [CrossRef][Green Version]
- Zhang, D.Q.; He, P.J.; Yu, L.Z.; Shao, L.M. Effect of inoculation time on the bio-drying performance of combined hydrolytic–aerobic process. Bioresour. Technol. 2009, 100, 1087–1093. [Google Scholar] [CrossRef] [PubMed]
- Chroni, C.; Kyriacou, A.; Georgaki, I.; Manios, T.; Kotsou, M.; Lasaridi, K. Microbial characterization during composting of biowaste. Waste Manag. 2009, 29, 1520–1525. [Google Scholar] [CrossRef]
- Sudharsan Varma, V.; Das, S.; Sastri, C.V.; Kalamdhad, A.S. Microbial degradation of lignocellulosic fractions during drum composting of mixed organic waste. Sustain. Environ. Res. 2017, 27, 265–272. [Google Scholar] [CrossRef]
- Tortora, G.J.; Funke, B.R.; Case, C.L. Microbiology: An Introduction, 13th ed.; Pearson Education: Upper Saddle River, NJ, USA, 2019. [Google Scholar]
- Trautmann, N.; Olynciw, E. Compost Microorganisms; Cornell Waste Management Institute, Cornell University: Ithaca, NY, USA, 1996. [Google Scholar]
- Liu, T.; Cui, C.; He, J.; Tang, J. Insights into the succession of the bacterial microbiota during biodrying of storage sludge mixed with beer lees: Studies on its biodiversity, structure, associations, and functionality. Sci. Total Environ. 2018, 664, 1088–1100. [Google Scholar] [CrossRef] [PubMed]
- Bernal, P.M.; Sommer, S.G.; Chadwick, D.; Qing, C.; Guoxue, L.; Michel, F.C. Chapter Three—Current Approaches and Future Trends in Compost Quality Criteria for Agronomic, Environmental, and Human Health Benefits. In Advances in Agronomy; Sparks, D.L., Ed.; Elsevier: Cambridge, UK, 2017; Volume 144, pp. 143–233. [Google Scholar]
- Orozco Álvarez, C.; Díaz Megchun, J.; Macías Hernández, M.; Robles Martínez, F. Efecto de la frecuencia de volteo en el biosecado de residuos sólidos orgánicos. Rev. Int. Contam. Ambient. 2019, 35, 979–989. [Google Scholar] [CrossRef]
- Orozco Álvarez, C.; Molina Carbajal, E.; Díaz Megchún, J.; Osorio Mirón, A.; Robles Martínez, F. Desarrollo de un modelo matemático para el biosecado de residuos sólidos orgánicos en pilas. Rev. Int. Contam. Ambient. 2019, 35, 79–90. [Google Scholar] [CrossRef]
- Matsushita, K.; Azuma, Y.; Kosaka, T.; Yakushi, T.; Hoshida, H.; Akada, R.; Yamada, M. Genomic analyses of thermotolerant microorganisms used for high-temperature fermentations. Biosci. Biotechnol. Biochem. 2016, 80, 655–668. [Google Scholar] [CrossRef] [PubMed]
- Powell, A.J.; Parchert, K.J.; Bustamante, J.M.; Ricken, B.J.; Hutchinson, M.I.; Natvig, D.O. Thermophilic fungi in an aridland ecosystem. Mycologia 2012, 104, 813–825. [Google Scholar] [CrossRef]
- Zawadzka, A.; Krzystek, L.; Stolarek, P.; Ledakowicz, S. Biodrying of Organic Fraction of Municipal Solid Wastes. Dry. Technol. 2010, 28, 1220–1226. [Google Scholar] [CrossRef]
- Colomer Mendoza, F.J.; Herrera Prats, L.; Robles Martinez, F.; Gallardo Izquierdo, A.; Piña Guzmán, A.B. Effect of airflow on biodrying of gardening wastes in reactors. J. Environ. Sci. 2013, 25, 865–872. [Google Scholar] [CrossRef] [PubMed]
- De Queiroz Ribeiro, N.; Pereira Souza, T.; Martinez Abreu Soares Costa, L.; Castro, C.P.; Souza Dias, E. Microbial additives in the composting process. Cienc. Agrotec. 2017, 41, 159–168. [Google Scholar] [CrossRef][Green Version]
- Park, Y.W. Moisture and Water Activity. In Handbook of Processed Meats and Poultry Analysis; Nollet, L.M., Toldra, F., Eds.; CRC Press: Boca Raton, FL, USA, 2008; pp. 35–70. [Google Scholar]
- Omaña, M.; Cortes, F.; Isáza, C.; García, A. Isotermas de sorción de agua en residuos de extracción de jugo de naranja. Rev. Bioagro 2010, 8, 61–67. [Google Scholar]
- Safefood 360°, Inc. Water Activity (aw) in Foods. 2014. Available online: https://www.safefood360.com/resources/Water-Activity.pdf (accessed on 15 November 2024).
- Tuomela, M. Biodegradation of lignin in a compost environment: A review. Bioresour. Technol. 2000, 72, 169–183. [Google Scholar] [CrossRef]
- Zhu, N.; Zhu, Y.; Kan, Z.; Li, B.; Cao, Y.; Jin, H. Effects of two-stage microbial inoculation on organic carbon turnover and fungal community succession during co-composting of cattle manure and rice straw. Bioresour. Technol. 2021, 341, 125842. [Google Scholar] [CrossRef]
- Ballesteros Vásquez, L.C.; Robles Martínez, F.; Contreras Cisneros, R.M.; Piña Guzmán, A.B.; Osorio Mirón, A. Residuos agrícolas y agroindustriales biosecados como alternativa energética. Rev. Int. Investig. Innovación Tecnol. (RIIIT) 2022, 10, 18–31. [Google Scholar]
- Tun, M.M.; Juchelková, D. Drying methods for municipal solid waste quality improvement in the developed and developing countries: A review. Environ. Engine Res. 2019, 24, 529–542. [Google Scholar] [CrossRef]
- Ab Jalil, N.A.; Basri, H.; Ahmad Basri, N.E.; Abushammala, M.F.M. The potential of biodrying as pre-treatment for municipal solid waste in Malaysia. J. Adv. Rev. Sci. Res. 2015, 7, 1–13. [Google Scholar]


Disclaimer/Publisher’s Note: The statements, opinions and data contained in all publications are solely those of the individual author(s) and contributor(s) and not of MDPI and/or the editor(s). MDPI and/or the editor(s) disclaim responsibility for any injury to people or property resulting from any ideas, methods, instructions or products referred to in the content. |
© 2025 by the authors. Licensee MDPI, Basel, Switzerland. This article is an open access article distributed under the terms and conditions of the Creative Commons Attribution (CC BY) license (https://creativecommons.org/licenses/by/4.0/).