Abstract
The combustion calculation domain of a water jacket heating furnace was established, and the fuel consumption and air consumption were optimized based on FLUENT. The amount of air consumption is based on the theoretical value of combustion, an air excess coefficient of 1.2 is taken, and the fuel consumption rate is set at 110, 130, 150, 170, and 190 m3/h. A comparative analysis of the calculation results shows that when the fuel consumption rate is 170 m3/h, the fuel combustion in the fire tube is the most intense, the combustion temperature is the highest, and the average temperature on the inner wall of the fire tube is the highest. Based on the optimal fuel consumption rate of 170 m3/h, the air consumption continues to be optimized. The air consumption was characterized by the air excess coefficient, which was 1.05, 1.10, 1.15, 1.20, 1.25, and 1.30, respectively. The comparative analysis of the calculation results shows that the flame temperature and diffusion combustion are the highest in the fire tube when the air excess coefficient is 1.25, but the average temperature of the inner wall of the fire tube is low, and the heat transfer effect is not optimal, while the air coefficient is 1.15.
1. Introduction
At present, a water jacket heating furnace is the main heat exchange equipment used in an oil field, and its internal combustion heat transfer process has been the focus of scholars. But most studies have only analyzed external heat transfer, such as heat radiation, in field or laboratory bench tests. With the continuous development of computer and numerical simulation technology, the method of studying the internal combustion conditions of heating furnaces based on simulation software platform has been rapidly developed, and has been widely used by many scholars. For example, Patankar S V et al. [1] proposed turbulent combustion models including diffusion flame model, average reaction rate and probability distribution function transport equation. Based on this, subsequent researchers began to consider turbulent combustion when solving practical problems of heat transfer. When calculating the Prandtl number and Schmidt number, Paul A et al. [2] adopted Laplacian transformation combined with the unsteady numerical simulation calculation method, analyzed the change law of physical property parameters such as temperature during heating, and obtained the special phenomenon of stratification of hot matter. Based on the principle of heat exchange and heat conduction, Luo X et al. [3] established a mathematical model of heat transfer in the calculation domain of the combustion zone, analyzed its temperature variation rule through the calculation results, and determined the objective function. The model is optimized step by step by the known parameters and the optimal solution is obtained to optimize the furnace temperature curve. Xing P et al. [4], based on the heat transfer theory, used three-dimensional CFD/FEM technology to construct a finite element analysis model describing the airflow characteristics of the furnace and the bottom of the furnace. The close relationship between the heat transfer characteristics of the furnace heating object and the lining structure is analyzed. The quantitative relationship between the operating factors such as the heating temperature in the furnace, the air volume in the furnace and the flow rate of the cooling water on the furnace heating object is proposed, and the relevant mathematical model is constructed. Established a three-dimensional model to numerically simulate the heating furnace based on the combustion state in the furnace and the structural characteristics of the heating furnace [5,6]. The results show that the fluid flow rate and viscosity in the tube have an obvious influence on the co-choked heat transfer, and the influence on the multi-field coupling effect is not obvious. Yang Jing et al. [7] calculated and analyzed the physical parameters of coil heat transfer temperature, velocity, and pressure based on the simulation software, and obtained that the increase in the temperature difference between the inlet and outlet of the coil is directly proportional to the inlet velocity of the container. This law can be used as the direction to optimize the inner coil of heating furnace. Liu Xuehu [8] used numerical methods to set different wall temperatures to simulate and calculate the temperature distribution characteristics in the combustion area such as the fire tube. It is found that the flame is mainly in the middle and rear of the burning area, the part near the U-shaped pipe is easy to burn, and it needs to be reinforced to ensure the safety of the equipment. From the perspective of heat transfer, Zhang Xupeng et al. [9] searched for the factors affecting heat loss in tubular heating furnaces, analyzed that refractory materials, construction quality, flame impact, and heat transfer characteristics all had effects on heat loss, and used numerical simulation to analyze the optimal parameters. Studied the tube-type heating furnace, established the numerical calculation model of flow and heat transfer in the furnace [10,11], simulated the heat transfer and flue gas flow process in the furnace, and compared the results with the actual design data to verify the reliability of the model. Xiao Yao [12] installed a heat load equalization device in the fire tube heating furnace, compared the changes in combustion field and temperature field in the furnace before and after installation, analyzed the causes and rules of burning damage caused by uneven combustion in the fire tube, and gave suggestions on preventing fire tube burning. Tang Zhen et al. [13] found that no matter the amount of fuel and air coefficient of the water jacket furnace under the rated load, the heat transfer in the furnace did not change significantly. However, when the air coefficient α corresponding to the fuel quantity just meets the complete combustion, the heat loss of the exhaust smoke of the heating furnace is minimum and the heating efficiency is the highest. Based on the FLUENT 16.0 software, simulated and analyzed the transient reversing phenomenon in the high-temperature combustion condition of the heating furnace [14,15,16,17], and found that reducing oxygen content and preheating air temperature in advance could shorten the minimum reversing time, but the impact of load changes on the minimum reversing time was negligible.
To sum up, fuel consumption and air ratio have a great influence on the combustion of a water jacket heating furnace. In this paper, based on the operating status of the water jacket heating furnace in the oilfield field [18,19], the FLUENT 16.0 software was used to optimize the fuel consumption and air ratio, the change rule of the combustion physical property parameters of the heating furnace under different working conditions was simulated, and the best operating parameters were analyzed and compared, providing theoretical support for the operation of the on-site heating furnace.
2. Simulation Setup
2.1. Physical Model of the Fire Tube
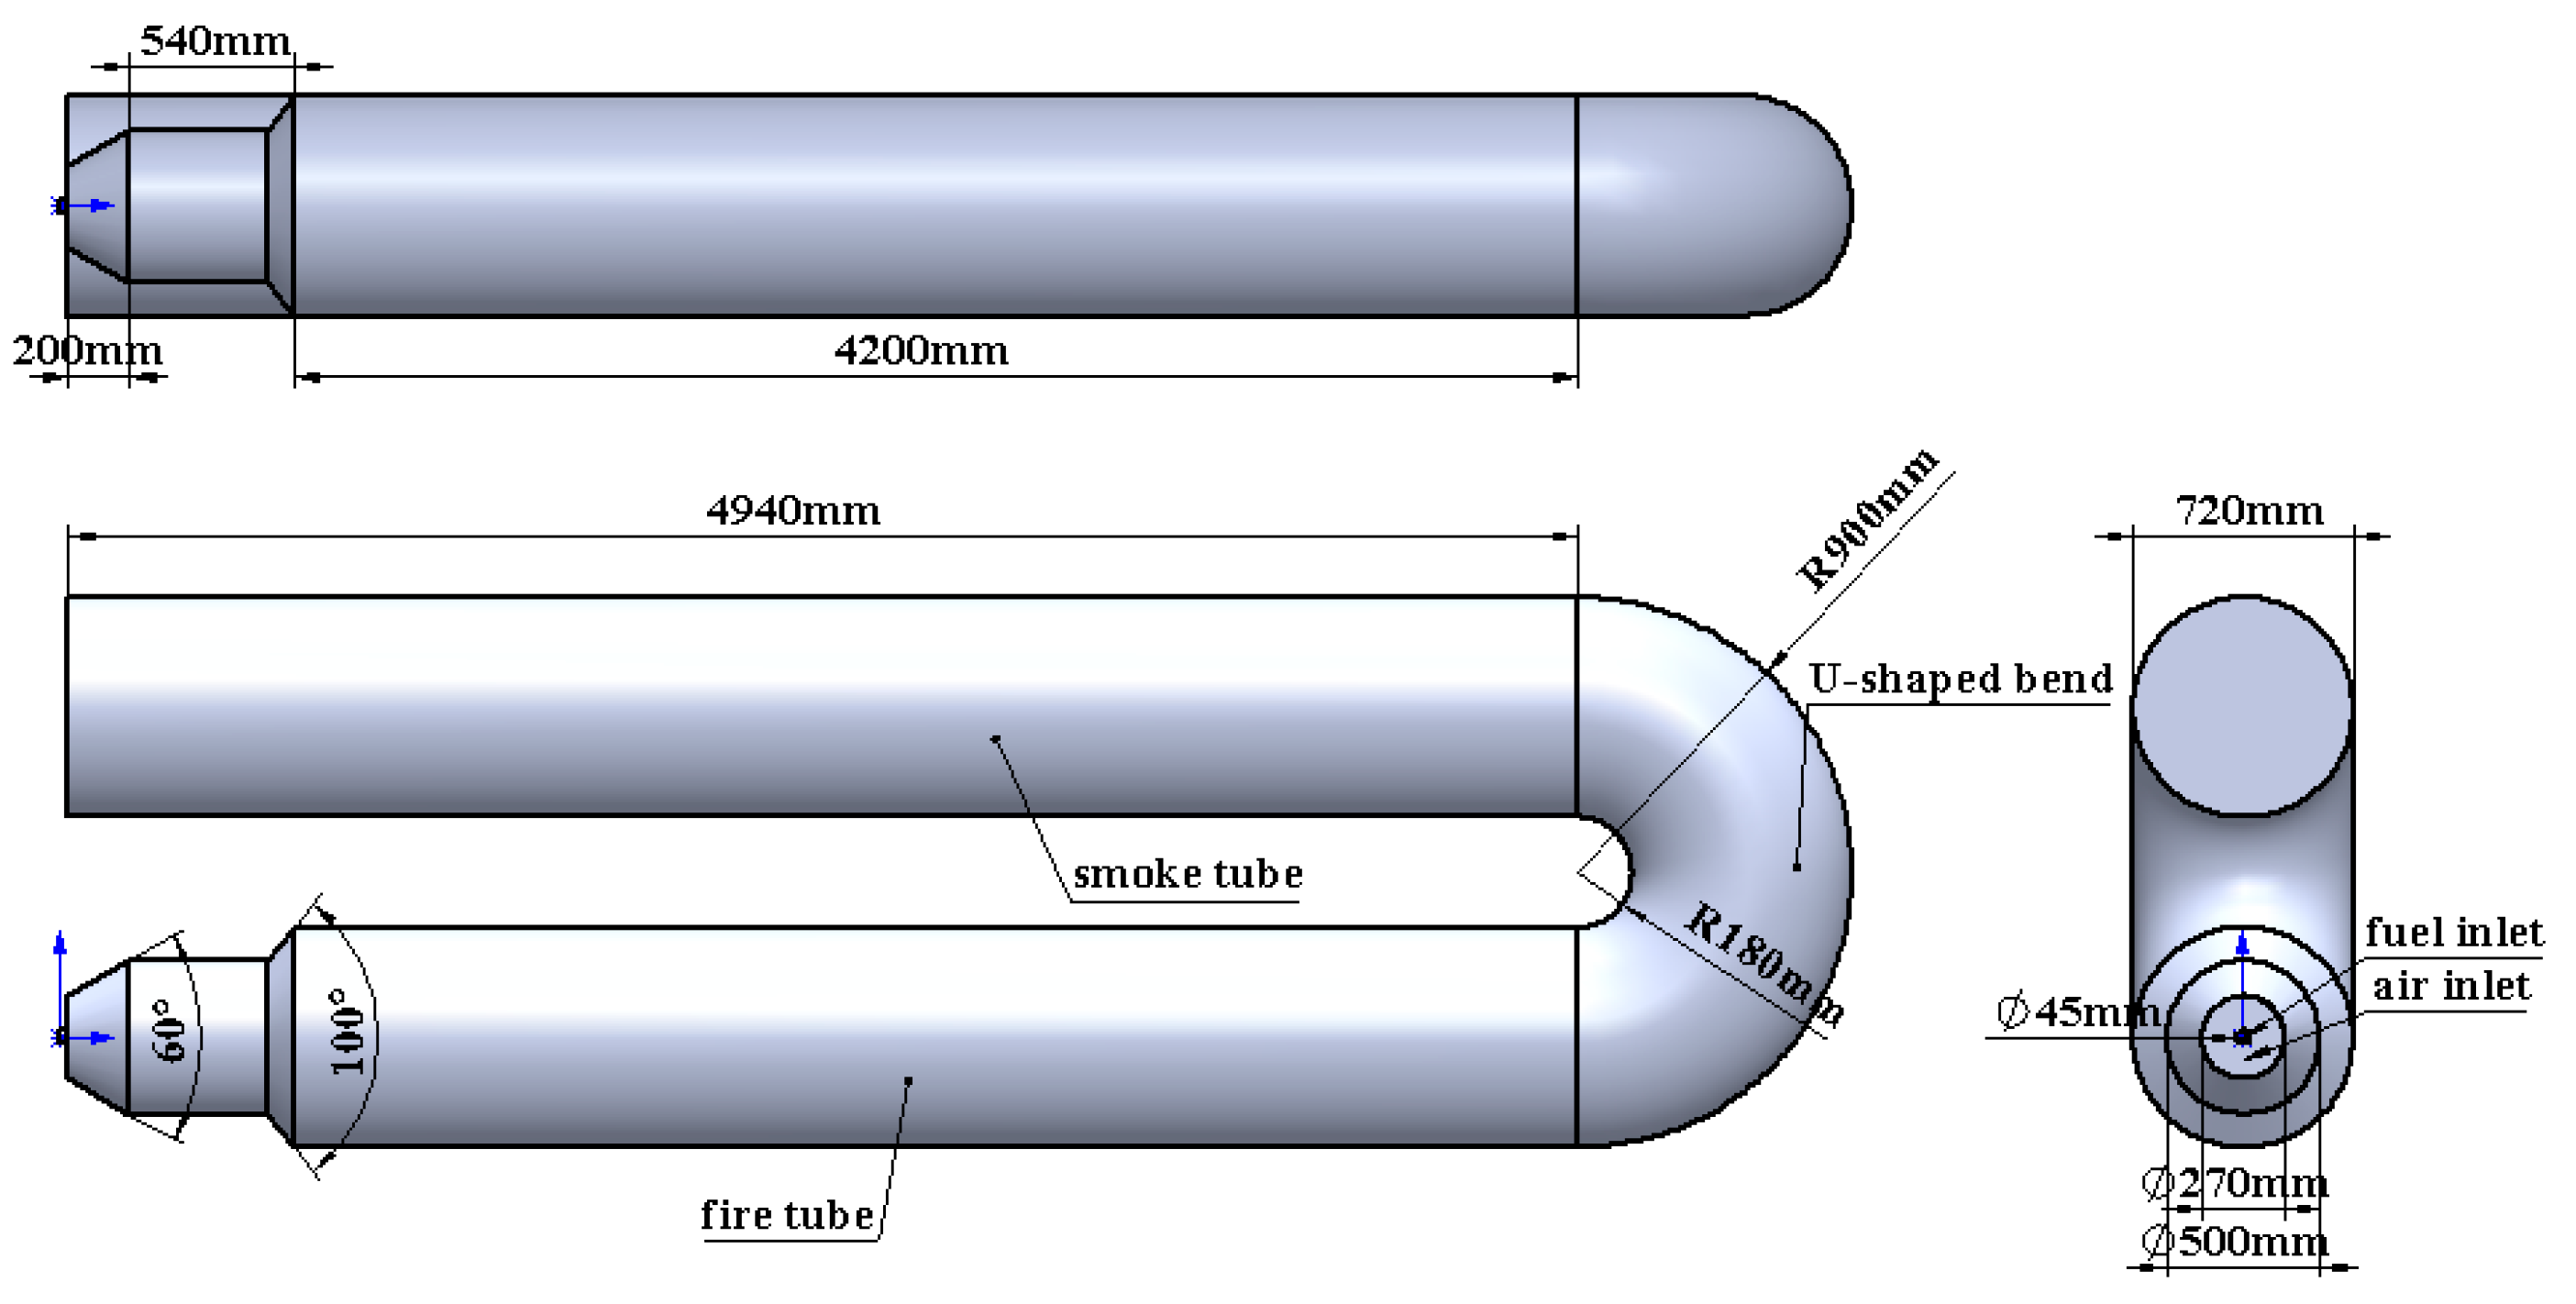
The structure of a water jacket heating furnace used in an oilfield is shown in Figure 1. The combustion area is the fire tube part, including fire tube and smoke tube. As shown, the burner structure of the heating furnace is a ring burner, and the gas and combustion-supporting air are directly injected into the fire tube by the fuel inlet and the air inlet, respectively, for diffusion combustion. The simplified physical model is obtained by using the SolidWorks 2016 software, and the key geometric dimensions and calculation domain are marked.
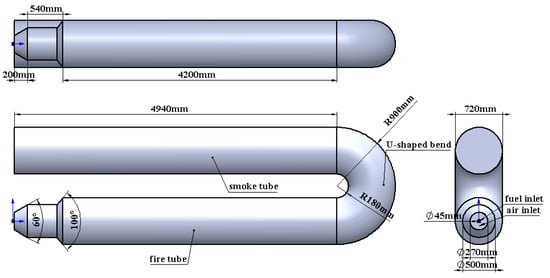
Figure 1.
Physical model.
2.2. Mesh Division and Independence Verification
- Grid division
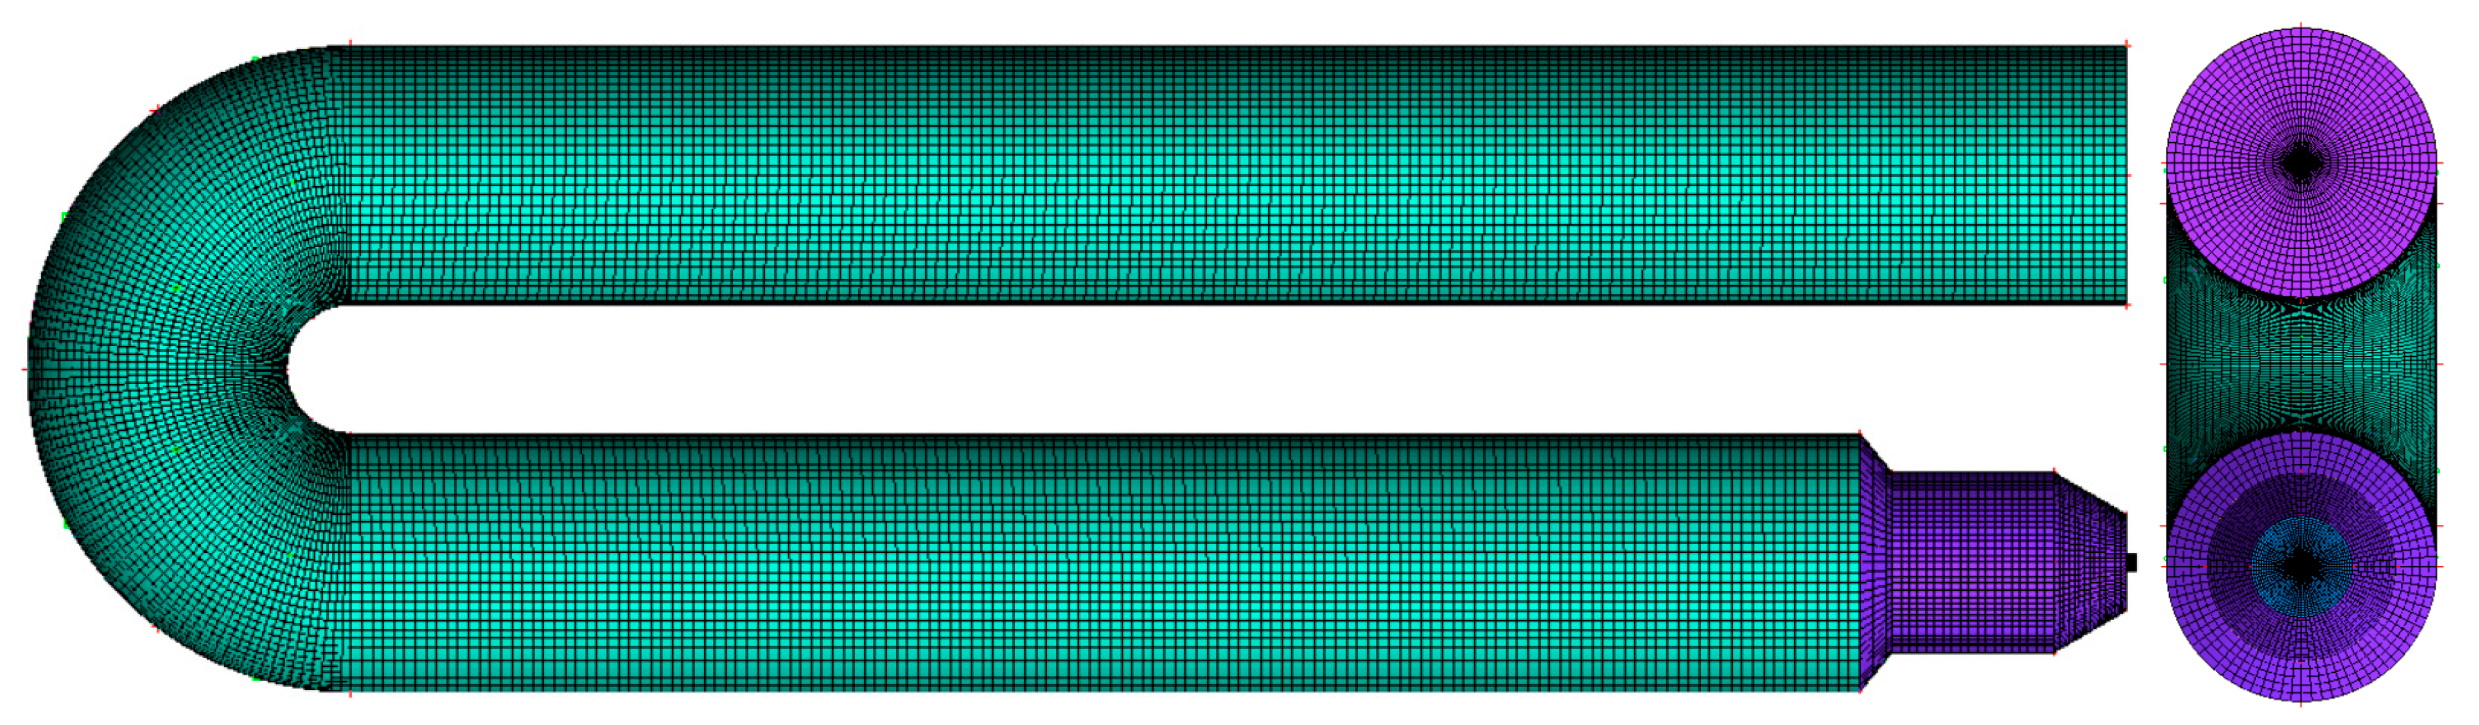
The ICEM 16.0 software was used for the structural meshing of the physical model. Due to the large difference between the structure size of the fire tube and the burner, it is necessary to locally encrypt the burner mesh and improve the quality mesh to adapt to the complex and changeable flow field here. At the same time, in order to improve the calculation accuracy, the O-type division of the circular surface structure grid is adopted. In addition, the U-shaped tube at the junction of the smoke tube and the fire tube can be encrypted to improve the mesh quality. The final mesh generation results are shown in Figure 2, and the generated mesh quality is above 0.55.
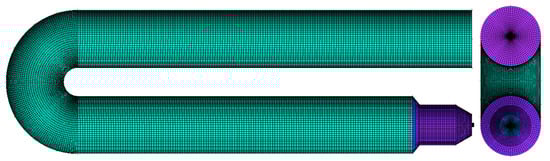
Figure 2.
Structured mesh of the computational domain.
- 2.
- Mesh independence verification
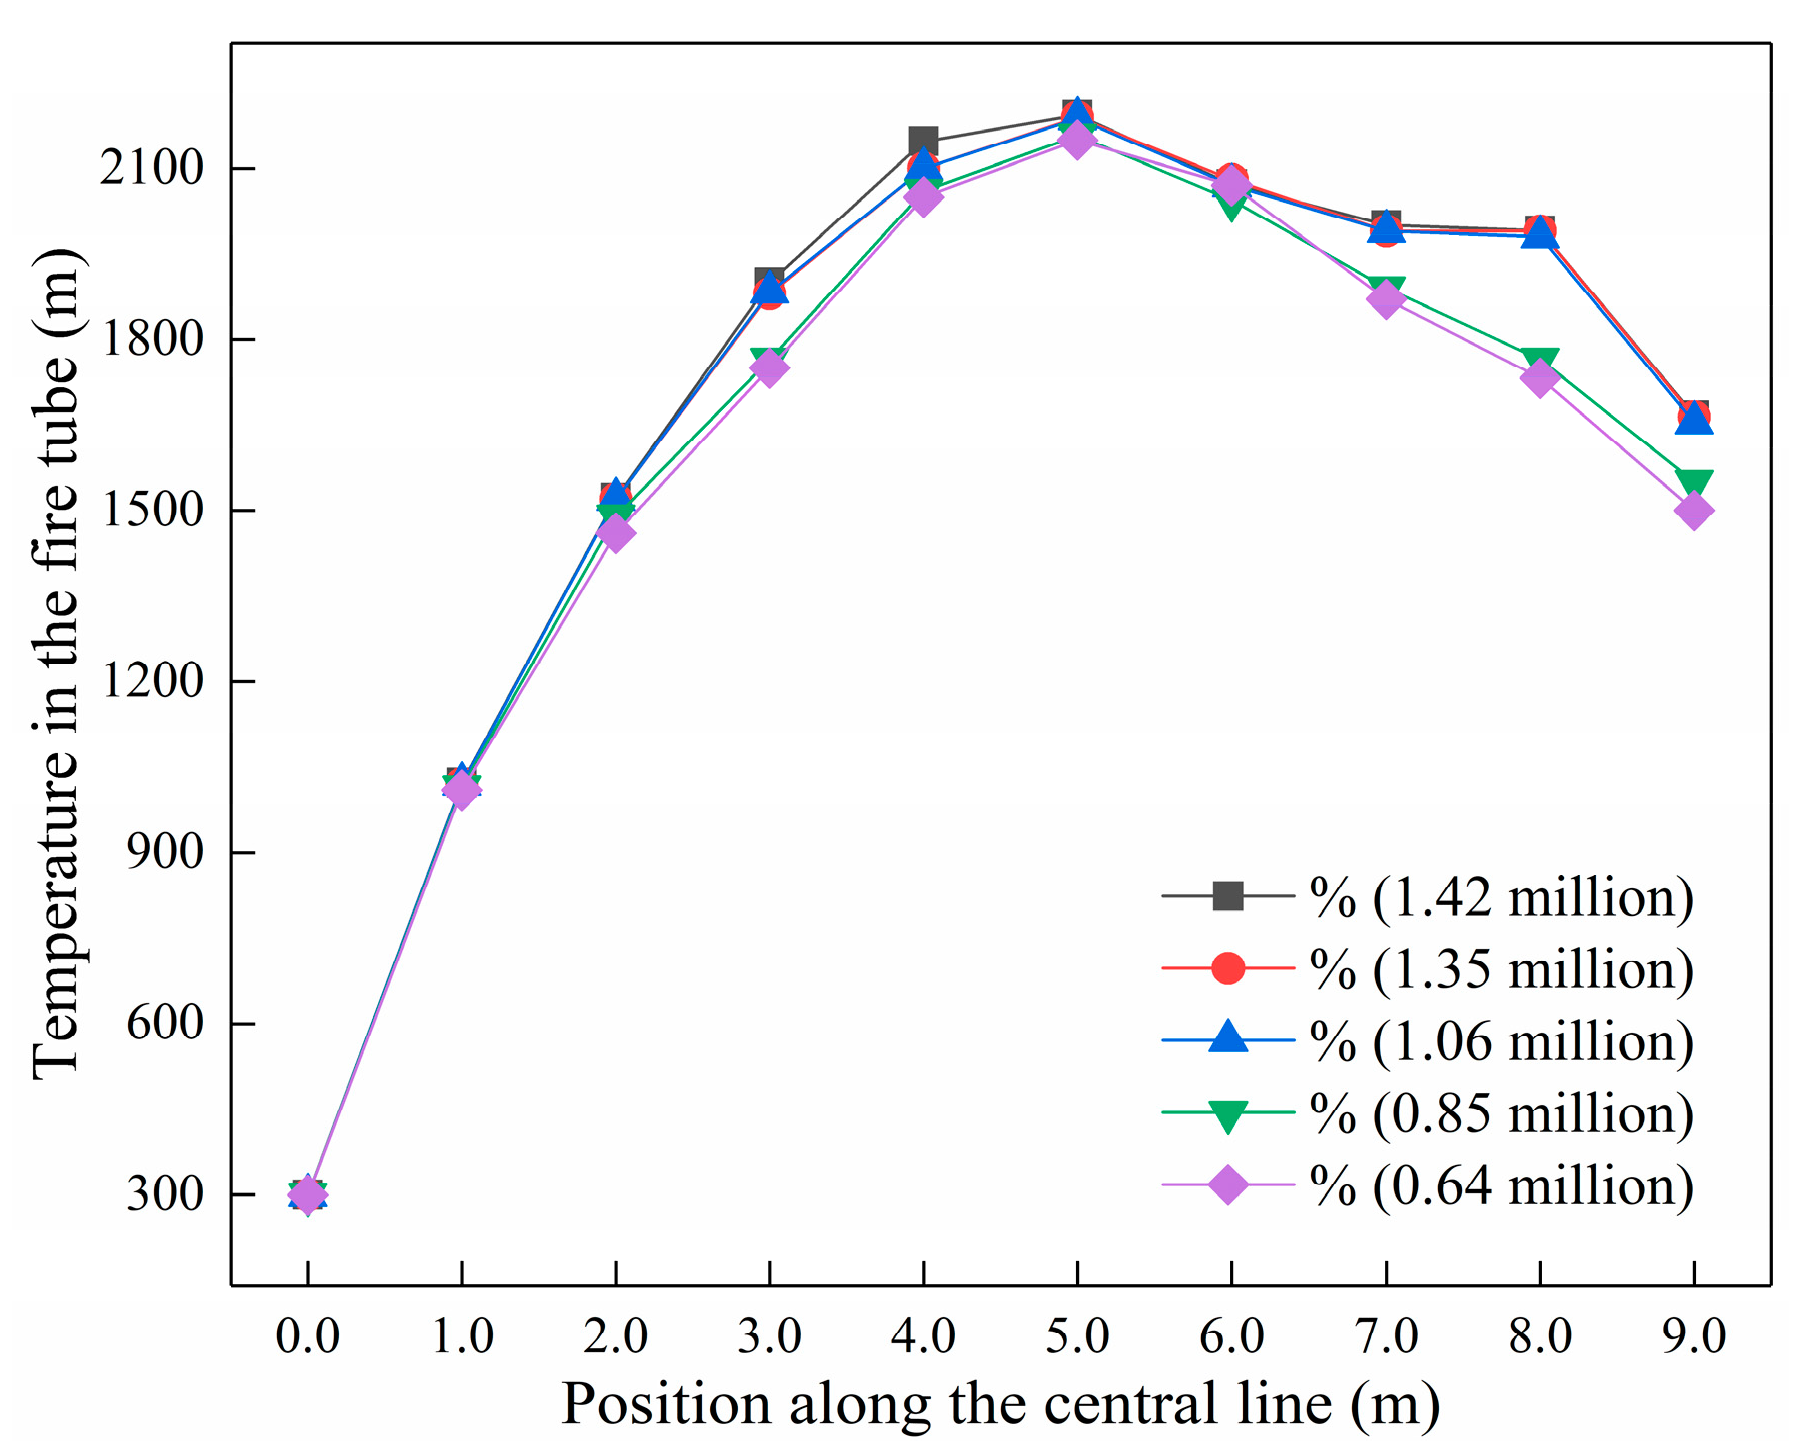
The quality (size) of meshing will affect the results of numerical simulation [20]. In order to reduce the calculation error caused by the mesh, this paper selects five models with different number of mesh nodes: 0.64 million, 0.85 million, 1.06 million, 1.35 million, and 1.42 million for the trial calculation. The temperature changes on the center line in the fire tube under different mesh nodes are compared and analyzed, as shown in Figure 3. It is found that the temperature of 0.64 million and 0.85 million grids varies greatly, and their maximum temperature is lower than that of the other two meshes, and that the temperature along the center line of the smoke tube is too low, which is significantly different from the actual operating temperature. The temperature of 1.06 million, 1.35 million, and 1.42 million meshes can reach the peak temperature requirements, which is basically consistent with the trend of actual operating temperature. However, the mesh files of 1.35 million and 1.42 million are larger, and the convergence time is longer. Therefore, the selection of 1.06 million mesh is more suitable for the numerical simulation calculation in this paper.
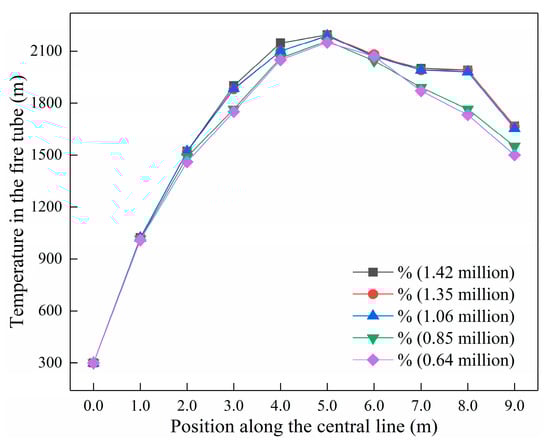
Figure 3.
Variation on center line temperature in the fire tube for different mesh nodes.
2.3. Subsection
- Boundary conditions
The inlet boundary condition is set as the velocity inlet, which is the air velocity inlet and the fuel gas velocity inlet, respectively, with specific values provided in Section 3.1 and Section 3.2. The outlet boundary condition is set as the pressure outlet, and the model outlet is the smoke pipe outlet. Because the natural gas in the fire tube is fueling slightly positive pressure combustion, the static pressure value is set to 0.1 KPa. The fluid speed set on the wall of the tube is equal to that on the wall, and there is no slip. The heat transfer simulation was not considered in the simulation, because the boundary conditions, calculation model, and assumption conditions of the equipment were consistent throughout the simulation, so it was considered that the heat loss of the equipment was the same during the heat transfer process. In order to simplify the calculation, an adiabatic wall is selected to study the combustion situation in the fire tube to analyze the thermal efficiency. The wall material is customized according to the actual parameters. Among them, the thermal conductivity of steel is 32 W/ (m·K), the density is 7900 kg/m3, the specific heat capacity is 0.5 × 10⁻³ J/(kg·K), and the Poisson ratio is 0.28.
- 2.
- Computational models
Since fuel gas and air enter the fire tube from different air intakes before ignition to start diffusion combustion, the non-premixed diffusion combustion EDM model is adopted in this paper [21,22]. There are four solving options in the software: SIMPLE, SIMPLEC, PISO, and Coupled. The four methods are selected, respectively, to numerically simulate and find that the SIMPLEC algorithm results fit the actual situation. Meanwhile, the Second-Order Upwind format is chosen to solved each parametric equation. The pressure interpolation is in the Second Order format [23].
Select the steady state simulation calculation, and in order to improve the calculation accuracy, set the residual error is less than 10−6. At the same time, ensure that the number of calculation steps is sufficient to avoid the phenomenon of calculation stop caused by insufficient calculation steps. When the residual curve shows a trend of continuous decline with the increase in the number of iteration steps and finally stabilizes at a lower value (reaching the set convergence standard, and the residual is less than 10⁻6), it indicates that the calculation is converging well, and the calculation can be considered complete in this state.
- 3.
- Hypothetical conditions
The combustion heat transfer process of the heating furnace is very complicated, so the following assumptions are put forward before the numerical simulation: (1) Only the combustion process in the fire tube is considered, and no other chemical reactions are generated; (2) the inside of the fire tube is a stable combustion and heat transfer process, and the furnace is completely closed without suction and escape wind; (3) the gases involved in the combustion reaction are incompressible fluids; (4) the radiation heat transfer process furnace smoke and flame for the gray body, do not consider the refraction and scattering phenomenon in the furnace.
3. Analysis of Calculation Results
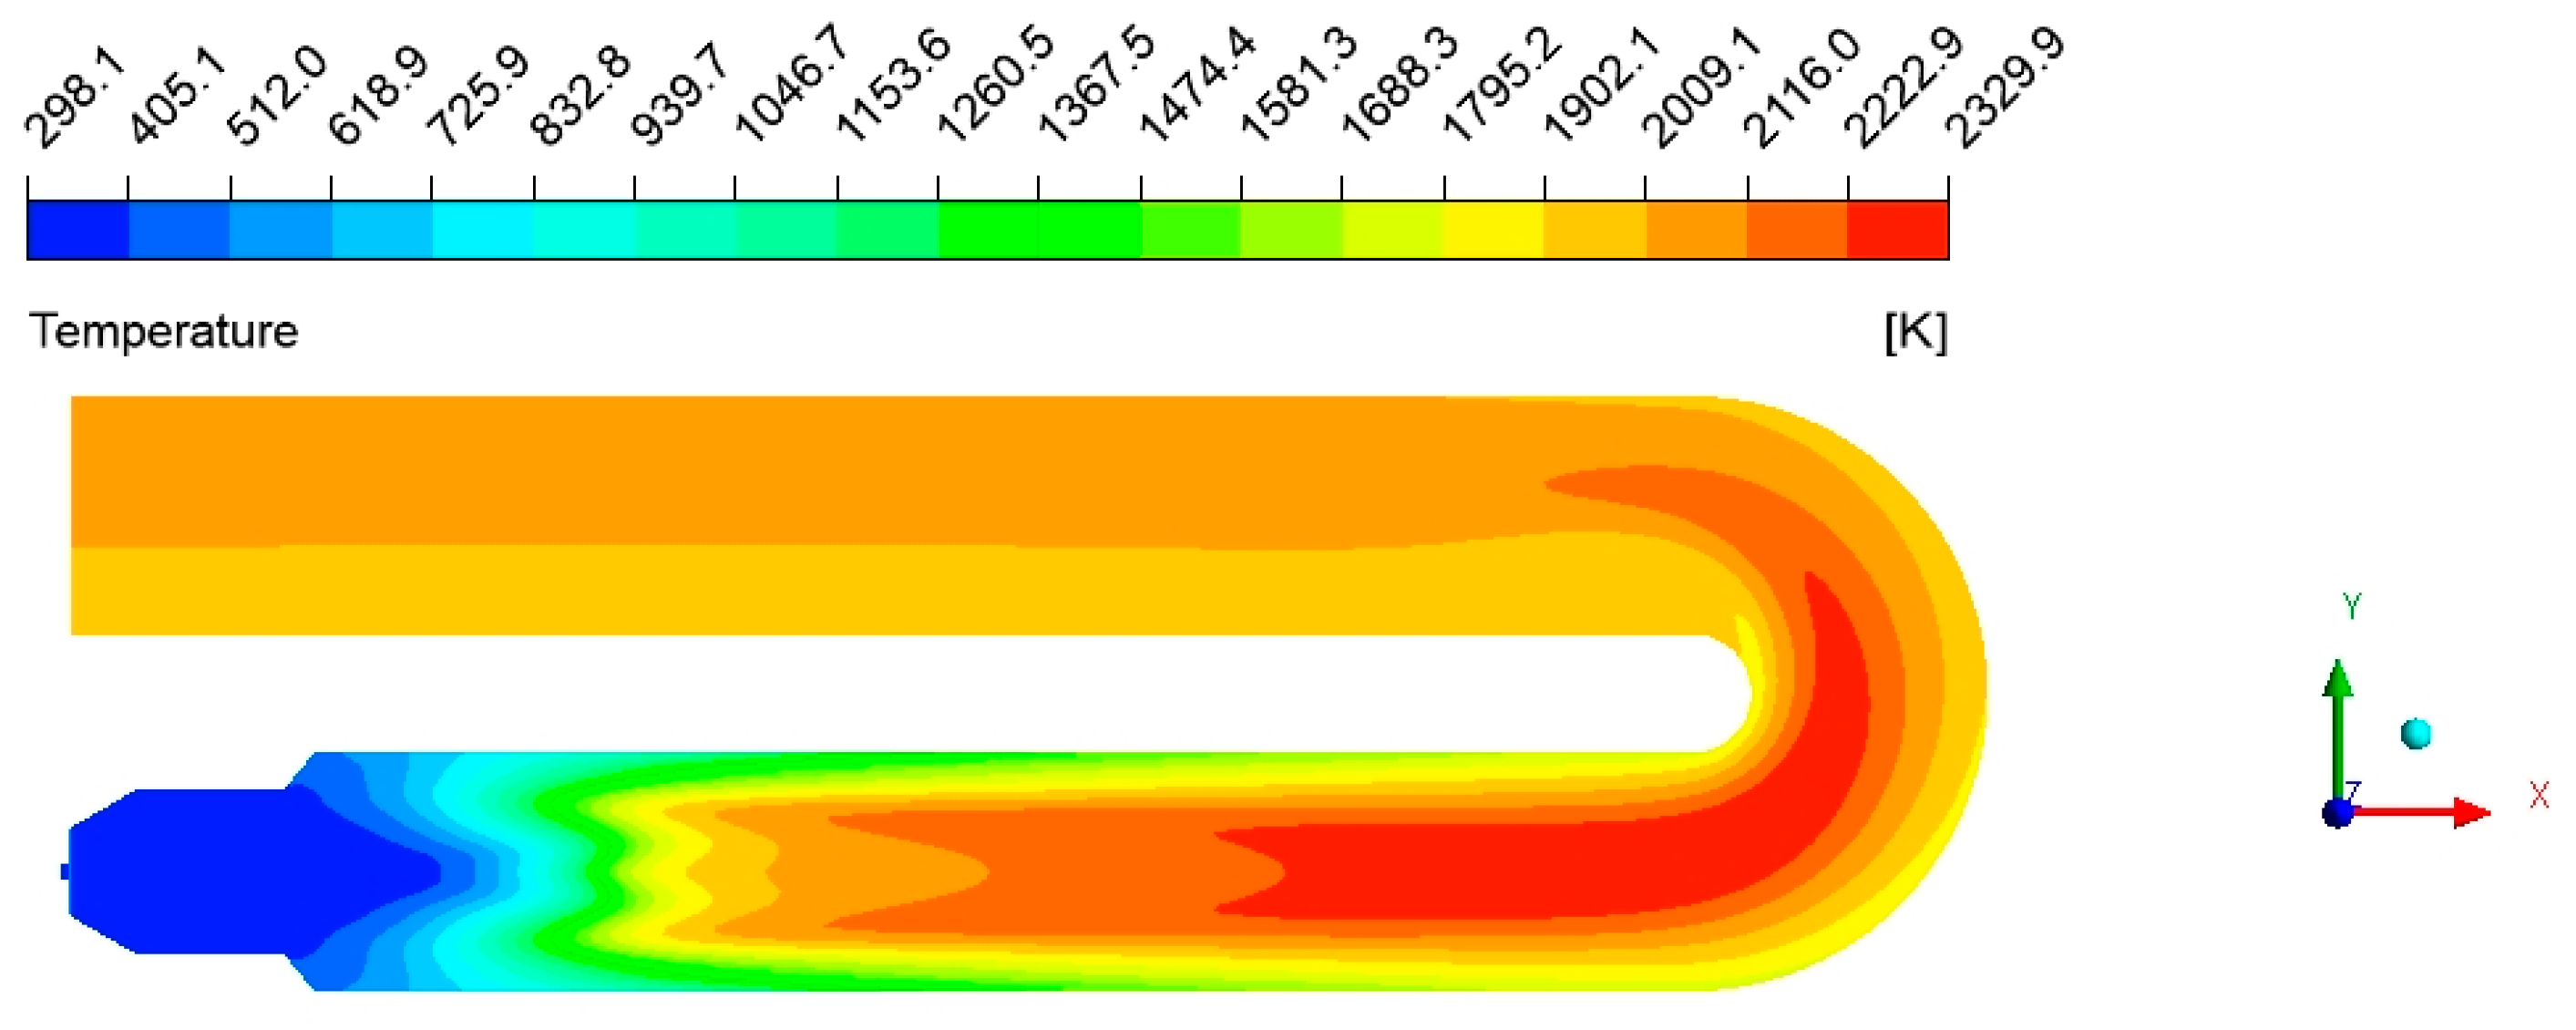
In this paper, the fuel consumption rate of a water jacket heating furnace in an oil field is 170 m3/h, the fuel inlet velocity is 29 m/s, the air consumption is based on the theoretical combustion value, the air excess coefficient is 1.2, and the air inlet velocity is 10 m/s. The simulation results are shown in Figure 4 and Figure 5. It is found that the main combustion area of diffusion combustion in the fire tube is in the rear part of the fire tube, and the high-temperature area on the inner wall of the fire tube is mainly in the position of the smoke tube. Improving the diffusion combustion rate can make the fuel burn rapidly, reduce the distance of diffusion combustion in the fire tube, increase the high-temperature interval in the fire tube, and thus improve the heating efficiency.
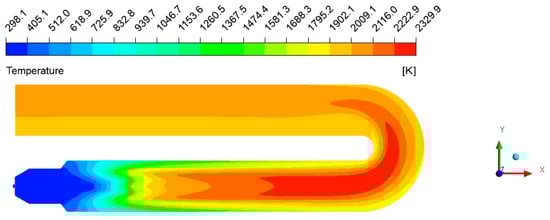
Figure 4.
Temperature cloud image of XY cross-section in fire tube.
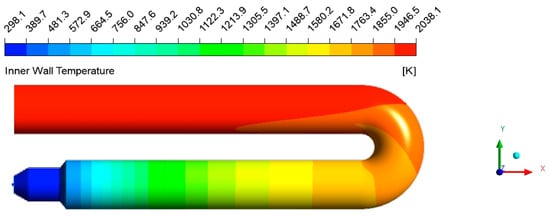
Figure 5.
Temperature cloud picture of the inner wall of the fire tube.
3.1. Optimization of Fuel Dosage
Too much fuel will cause the fuel to burn inadequately and cause waste. Too little fuel will reduce the thermal efficiency and will not meet the heating demand on site. In order to study the influence law of different fuel dosages on the velocity field, temperature field, and O2 and CH4 concentration field in the fire tube, the fuel dosage of 110 m3/h, 130 m3/h, 150 m3/h, 170 m3/h, and 190 m3/h is selected for numerical simulation calculation. The air consumption in this section is based on the theoretical value of combustion, and the amount of air excess coefficient 1.2 is taken.
3.1.1. Analysis of Velocity Field Characteristics
Figure 6 shows the velocity cloud image of XY cross-section in the fire tube under different fuel dosages. At the fuel inlet, the fuel inlet speed increases with the increases in the fuel dosage, and the air dosage takes 1.2 times the corresponding fuel dosage, and will also increase in equal proportion. However, the size of the combustion air inlet is large, and the increase in intake speed is not obvious. There is a symmetrical reflux zone near the wall in the inlet section of the fire tube, and the reflux zone speed increases with the increases in the fuel dosage.
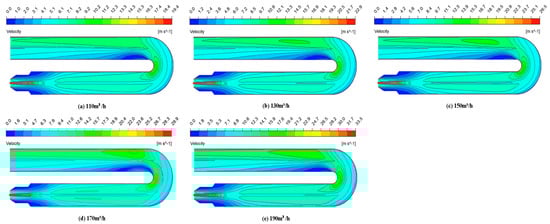
Figure 6.
Velocity distribution in fire tube with XY cross-section under different fuel dosages.
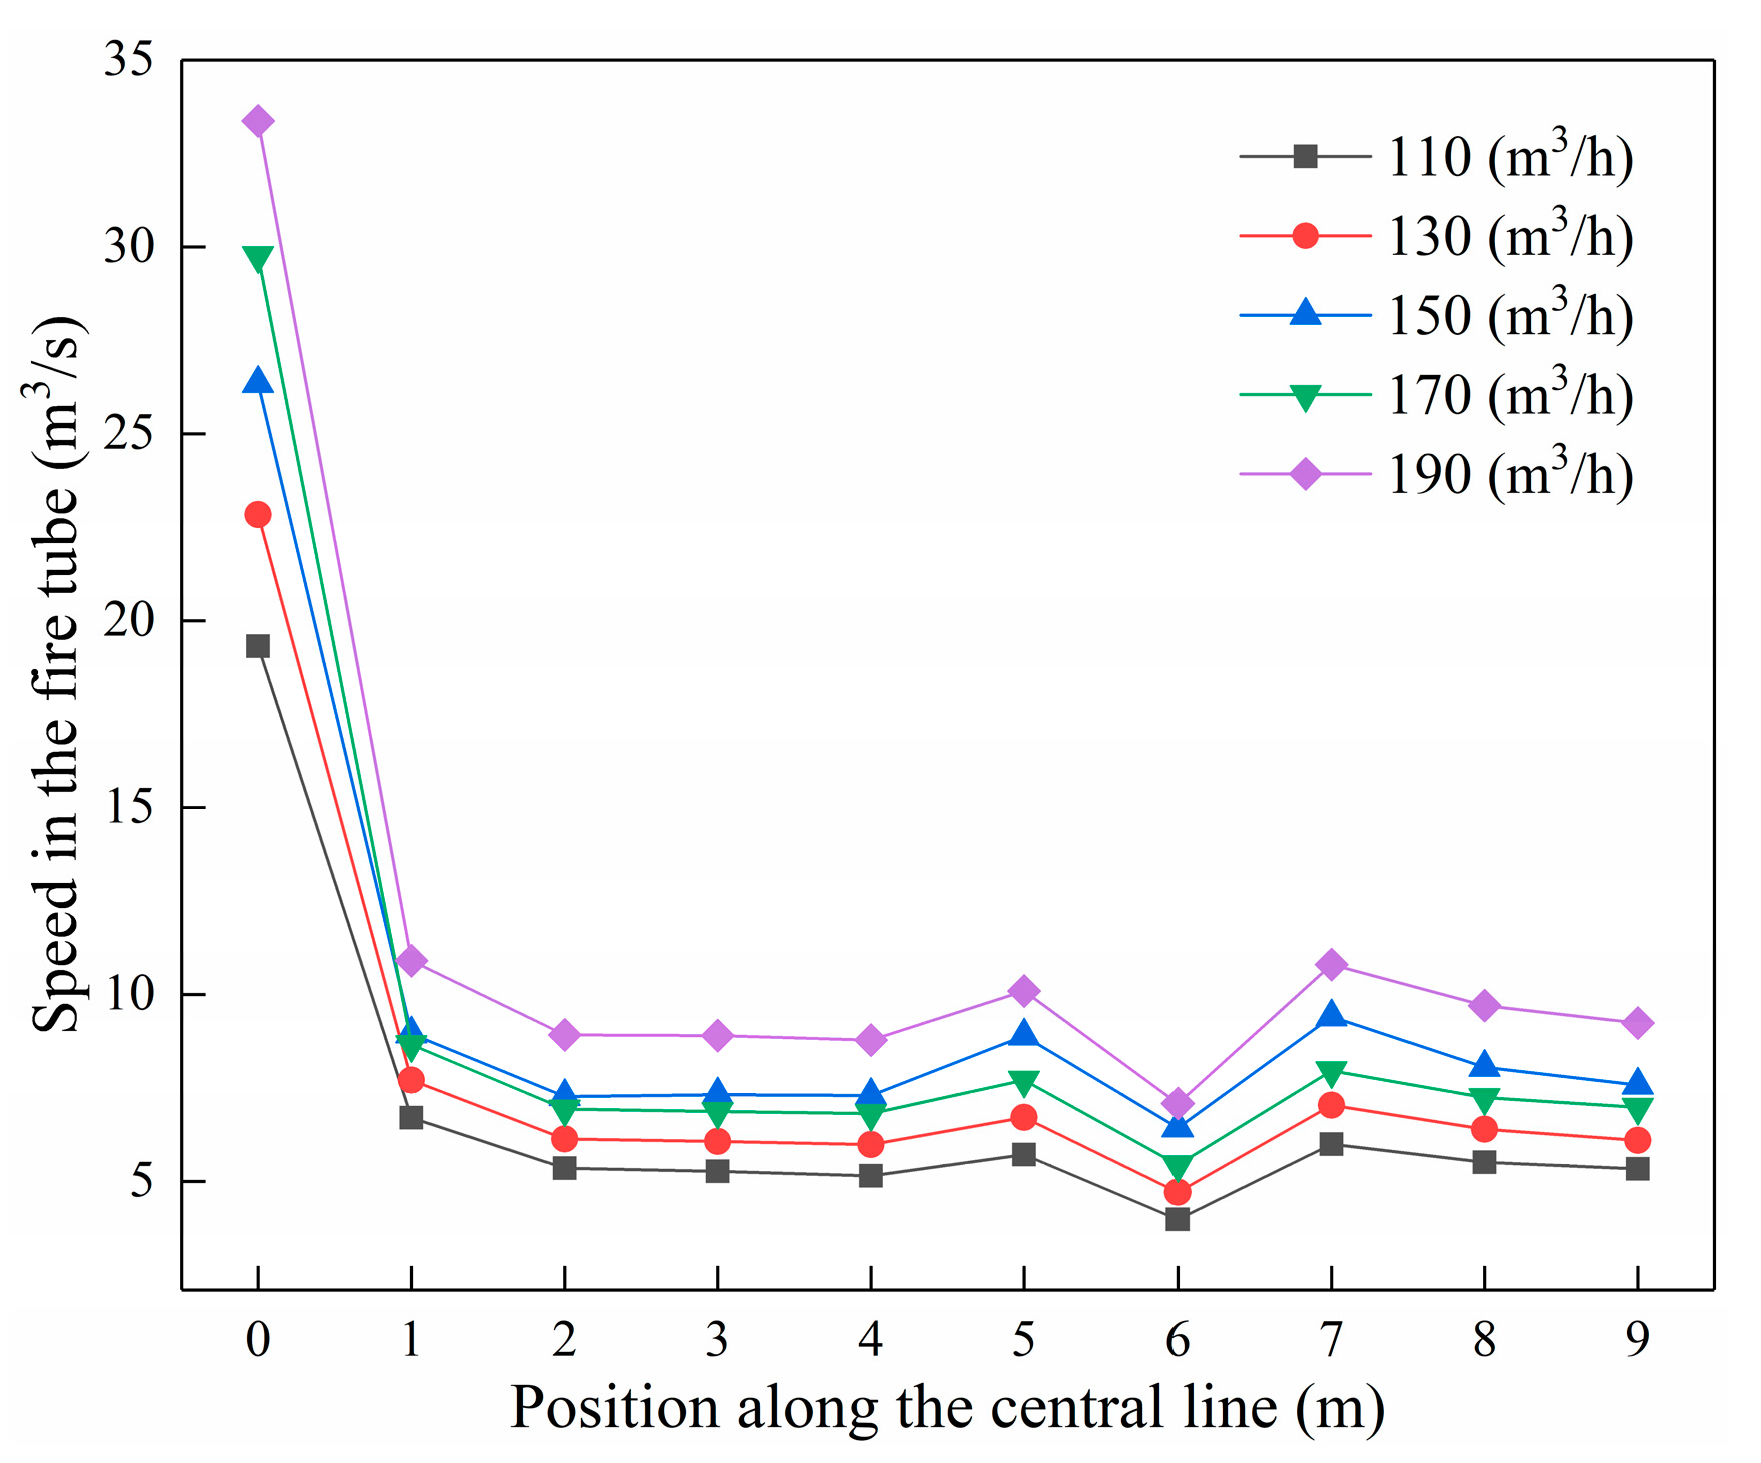
Figure 7 shows the change trend of the speed on the center line in the fire tube under different fuel consumption rates. The speed on the center line in the fire tube plunged between 0 and 2 m, and then gradually stabilized, and returned to a stable state after a small decrease between 5 and 7 m. However, when the fuel consumption rate is 170 m3/h, the feed speed is about 3 m/s faster than that of 150 m3/h, while the flue gas velocity in the whole fire tube is slightly lower than 150 m3/h. In contrast, the diffusion combustion speed is faster and the combustion is more full when the fuel consumption rate is 170 m3/h, which makes the flue gas velocity in the pipe slower. The gas remains in the fire tube for a long time.
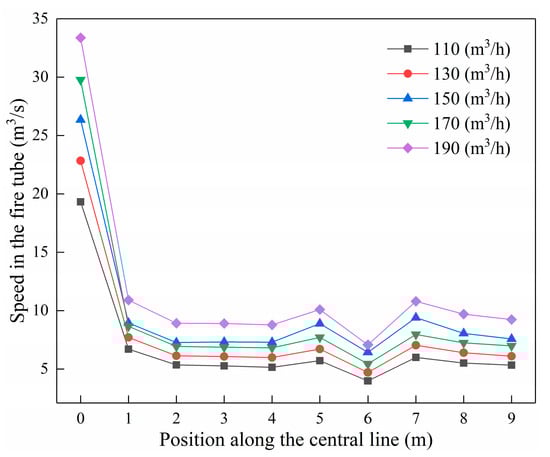
Figure 7.
Variation on the center line velocity in the fire tube under different fuel dosages.
3.1.2. Analysis of Temperature Field Characteristics
- Influence on the temperature field in the fire tube
Figure 8 shows the temperature cloud image of XY cross-section in the fire tube under different fuel dosages. The temperature gradient in the front section of the fire tube for five different fuel dosages is large, and the high-temperature area is in the middle and back section of the fire tube. With the increases in the fuel dosage, the maximum temperature in the fire tube first increases and then decreases, and the highest temperature is 2329.9 K when the fuel dosage is 170 m3/h. When the fuel dosage is 170 m3/h, the red cone area in the fire tube is the shortest, indicating that the diffusion combustion in the fire tube is more intense under this amount.
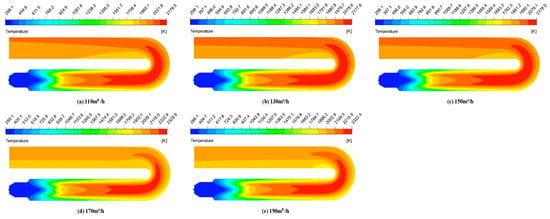
Figure 8.
Temperature distribution in the fire tube with XY cross-section under different fuel dosages.
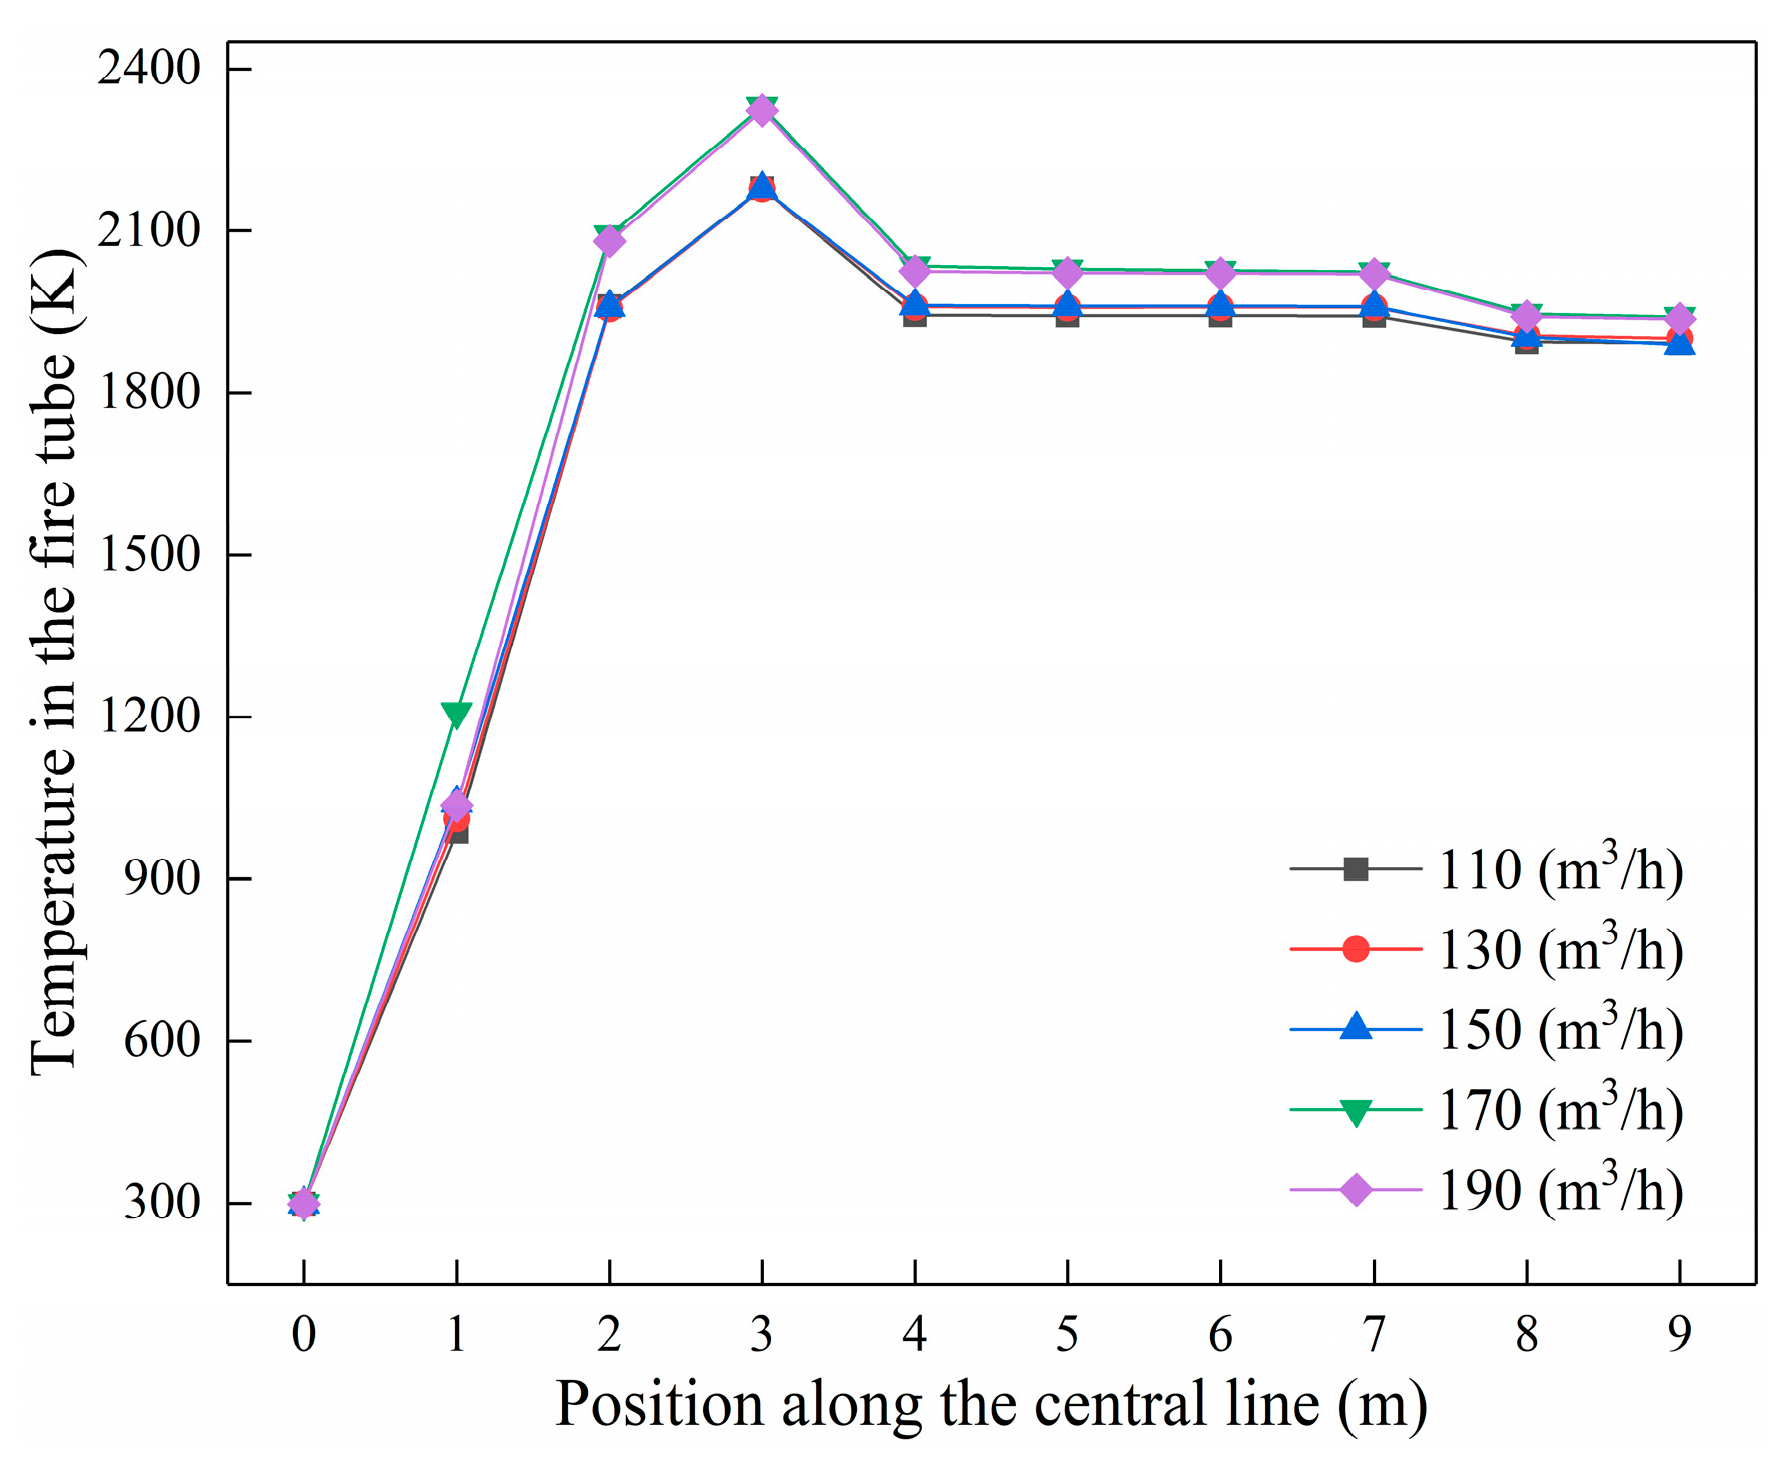
Figure 9 shows the temperature variation trend on the center line in the fire tube under different fuel dosages. The temperature of the central axis in the fire tuber increases sharply from 0 to 3 m, and the fuel and combustion air are diffused and burned violently in this section. The temperature reaches a peak at about 3 m, and then the temperature decrease gradually levels off. When the fuel consumption is 170 m3/h, the temperature of the center line in the fire tube is higher than that of other fuels, and the temperature in the smoke pipe is almost the same as that of the heat emitted at 190 m3/h, indicating that the fuel is fully burned under the fuel consumption.
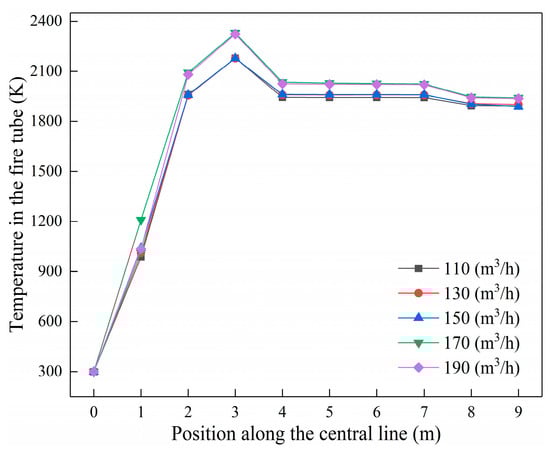
Figure 9.
Variation on the center line temperature in the fire tube under different fuel dosages.
- 2.
- Influence on the inner wall temperature of the fire tube
Figure 10 shows the temperature cloud image on inner wall of fire tube under different fuel dosages. The high-temperature area on the inner wall of the fire tube with five kinds of fuel dosages is mainly concentrated in the U-shaped joint and the chimney part. The maximum temperature on the inner wall of the fire tube increases with the increases in the fuel dosage.
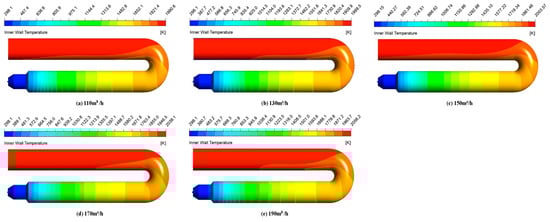
Figure 10.
Temperature distribution on the inner wall of fire tube with XY cross-section under different fuel dosages.
Figure 11 shows the variation trend of the mean temperature on the inner wall of the fire tube under different fuel dosages. With the increases in fuel dosage, the average temperature of the inner wall of the fire tube first increases and then decreases. With the increase in fuel consumption, the average temperature of the inner wall of the fire tube first increases and then decreases. When the fuel consumption rate is 170 m3/h, the average temperature of the inner wall of the fire tube is about 1596 K, and the radiation heat transfer effect of combustion heat in the fire tube is the best.
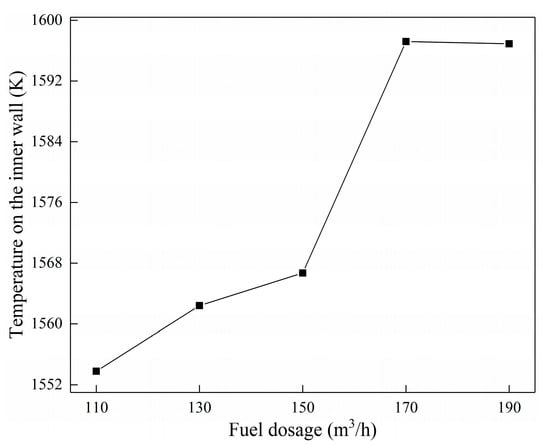
Figure 11.
Average temperature distribution on the inner wall of fire tube under different fuel dosages.
3.1.3. Analysis of Concentration Field Characteristics
- O2 concentration field
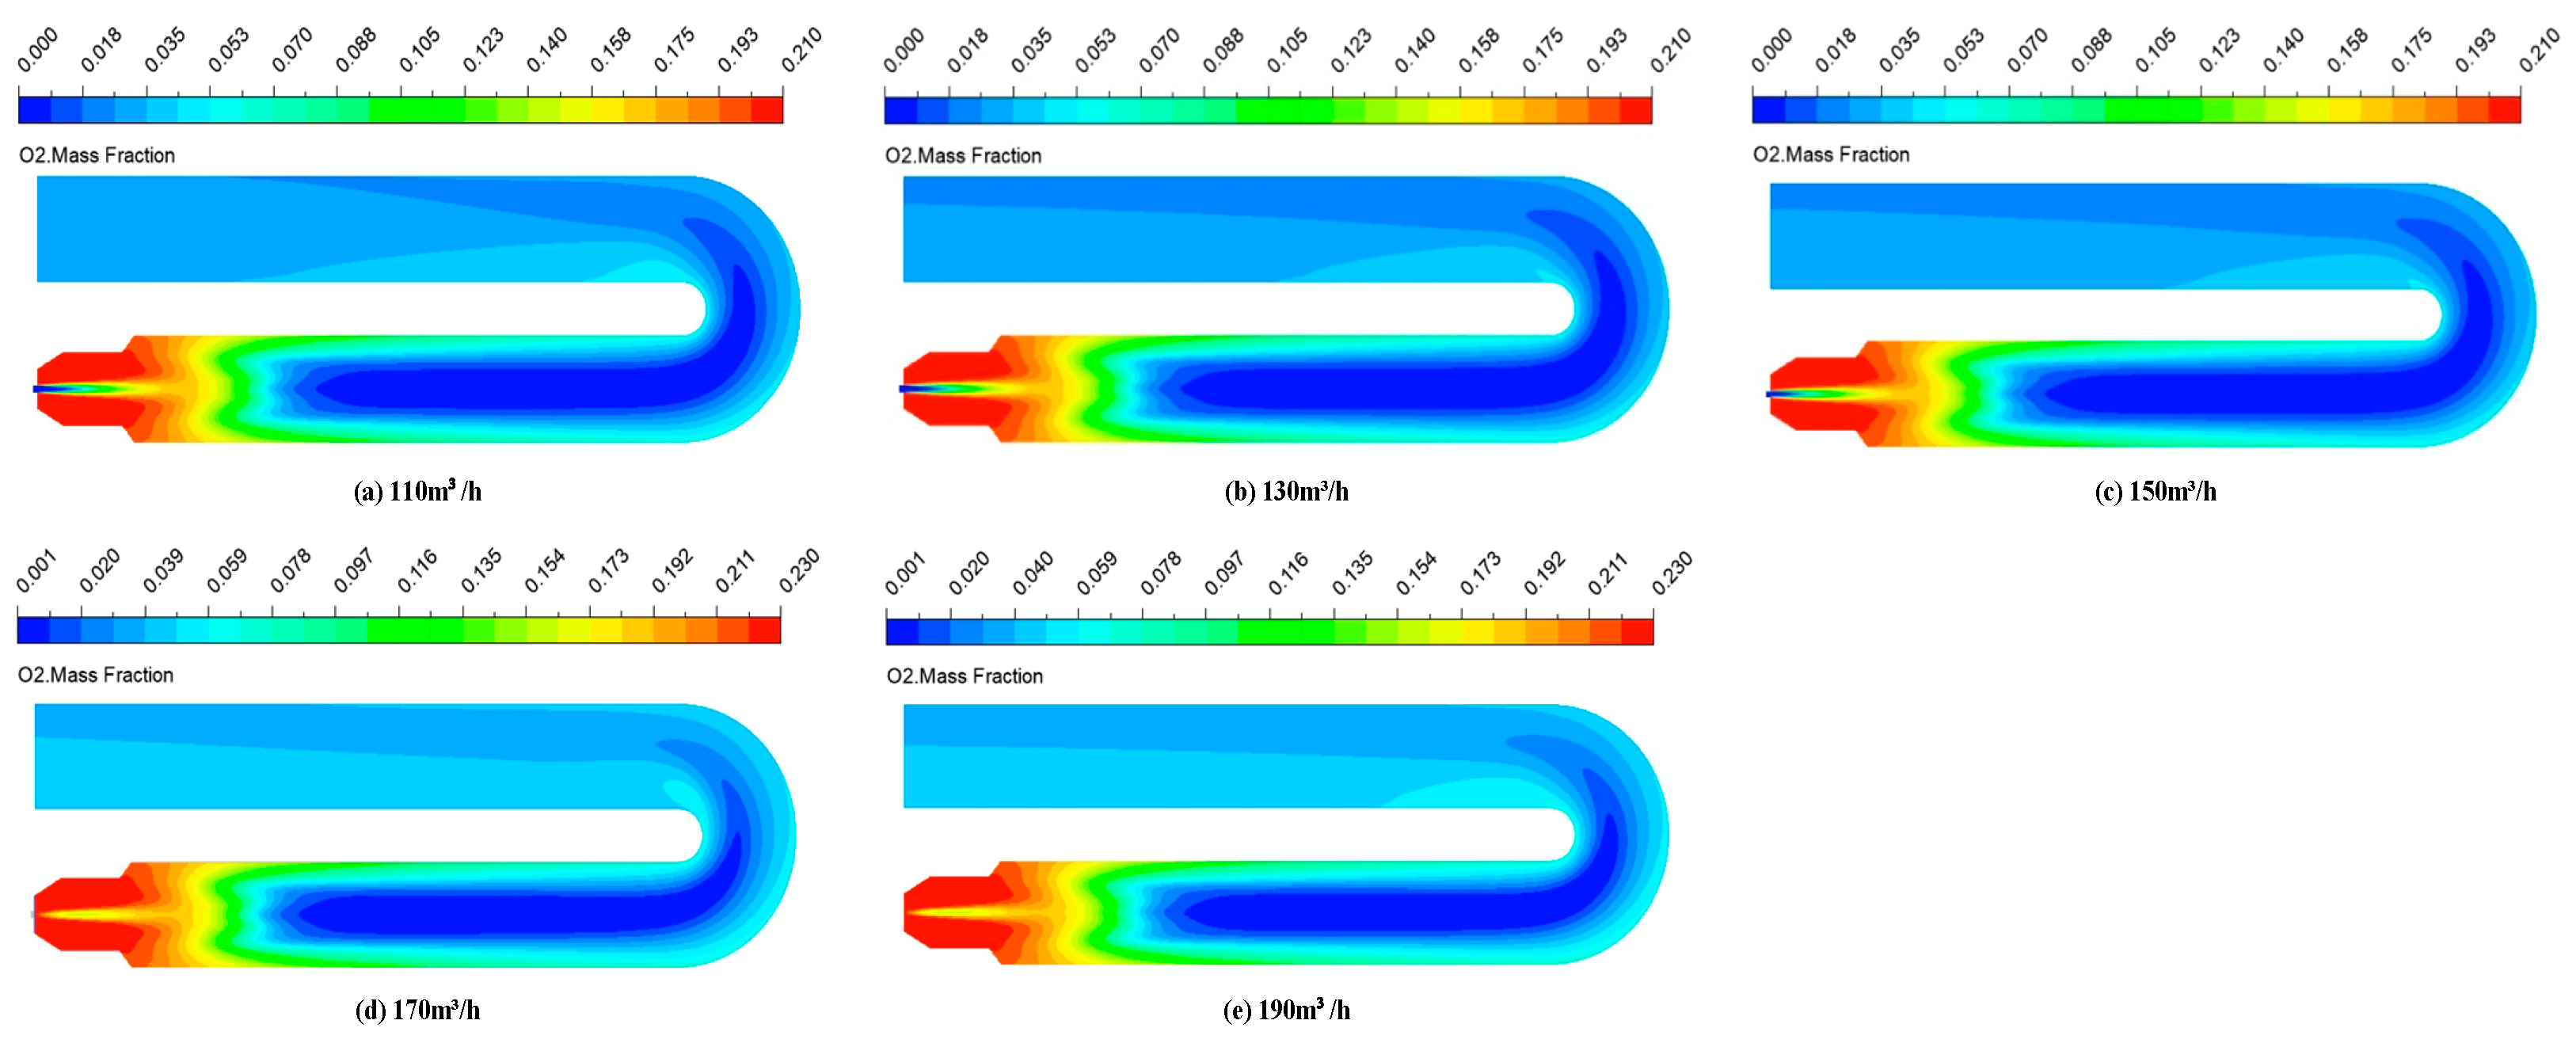
Figure 12 shows the cloud image of the O2 concentration in the XY section of fire tube under different fuel dosages. With the increases in the fuel dosage, the low-oxygen-concentration area in the fire tube decreases first and then increases. The low O2 concentration zone is the smallest when the fuel amount is 170 m3/h, indicating that the combustion speed in the fire tube is the fastest when the fuel amount is 170 m3/h.

Figure 12.
O2 concentration distribution in fire tube with XY cross-section under different fuel dosages.
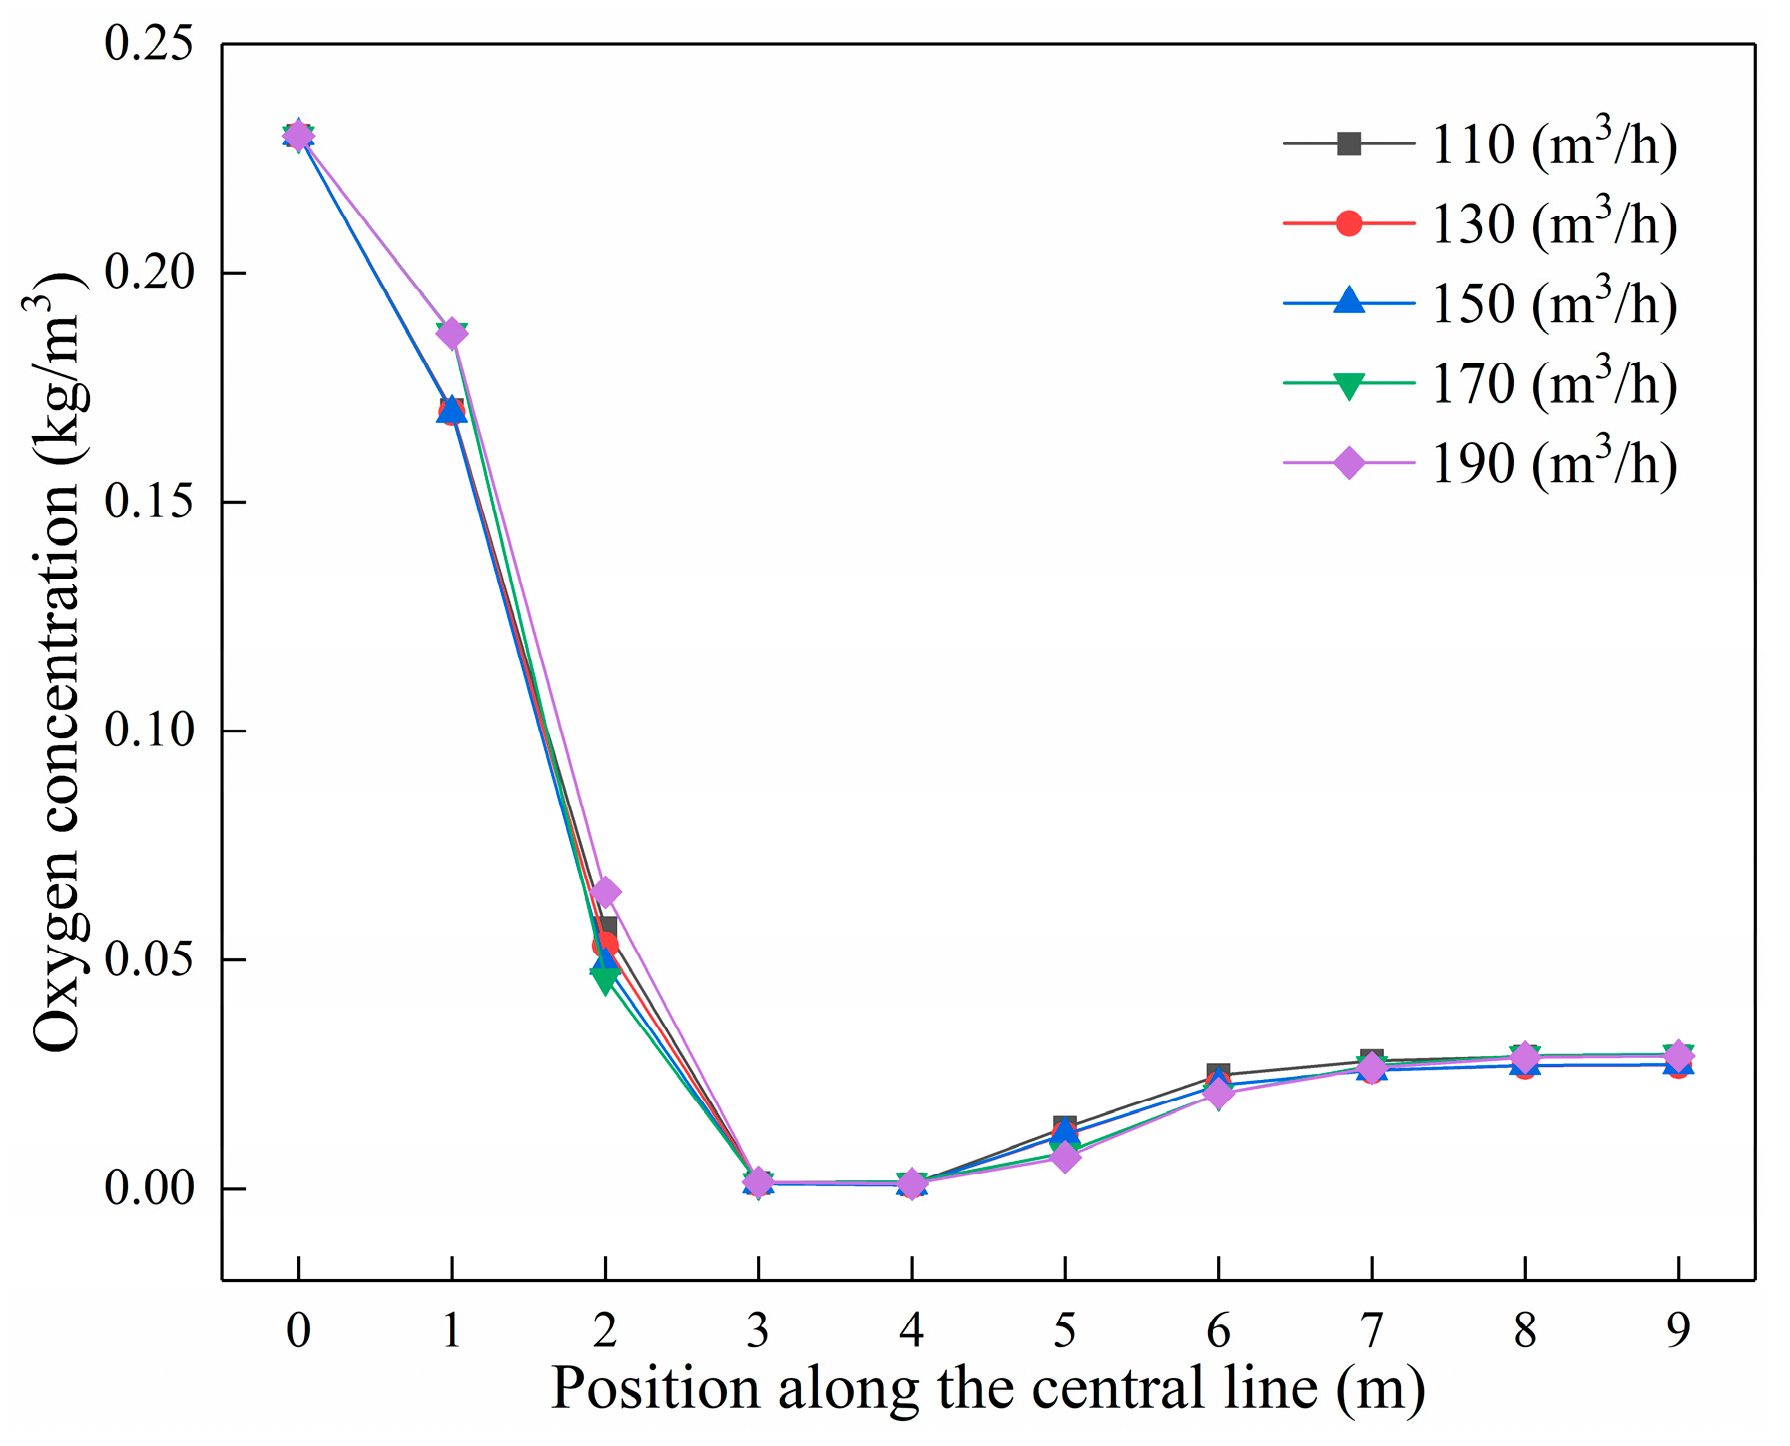
Figure 13 shows the variation trend of oxygen concentration on the center line in the fire tube under different fuel consumption. The O2 concentration of the five different fuels dropped sharply in the range of 0~3 m in the fire tube, and the low-oxygen-combustion zone concentrated in the range of 3~5 m. At this time, the fuel combustion was the most intense and the oxygen concentration was the lowest when the fuel consumption rate was 170 m3/h. At this time, the oxygen concentration is relatively higher when the fuel consumption is 170 m3/h, which indicates that the combustion effect is indeed the best in the main combustion zone.
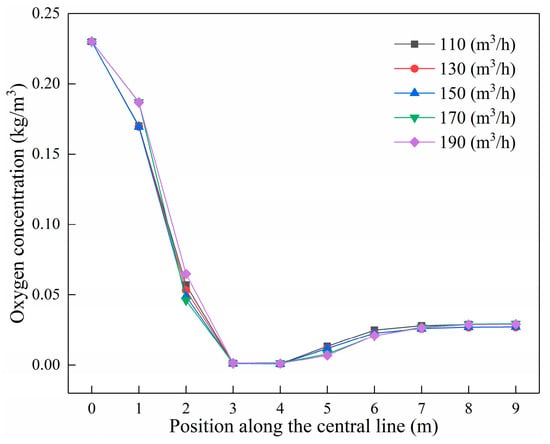
Figure 13.
Variation on the center line of O2 concentration in the fire tube under different fuel dosages.
- 2.
- CH4 concentration field
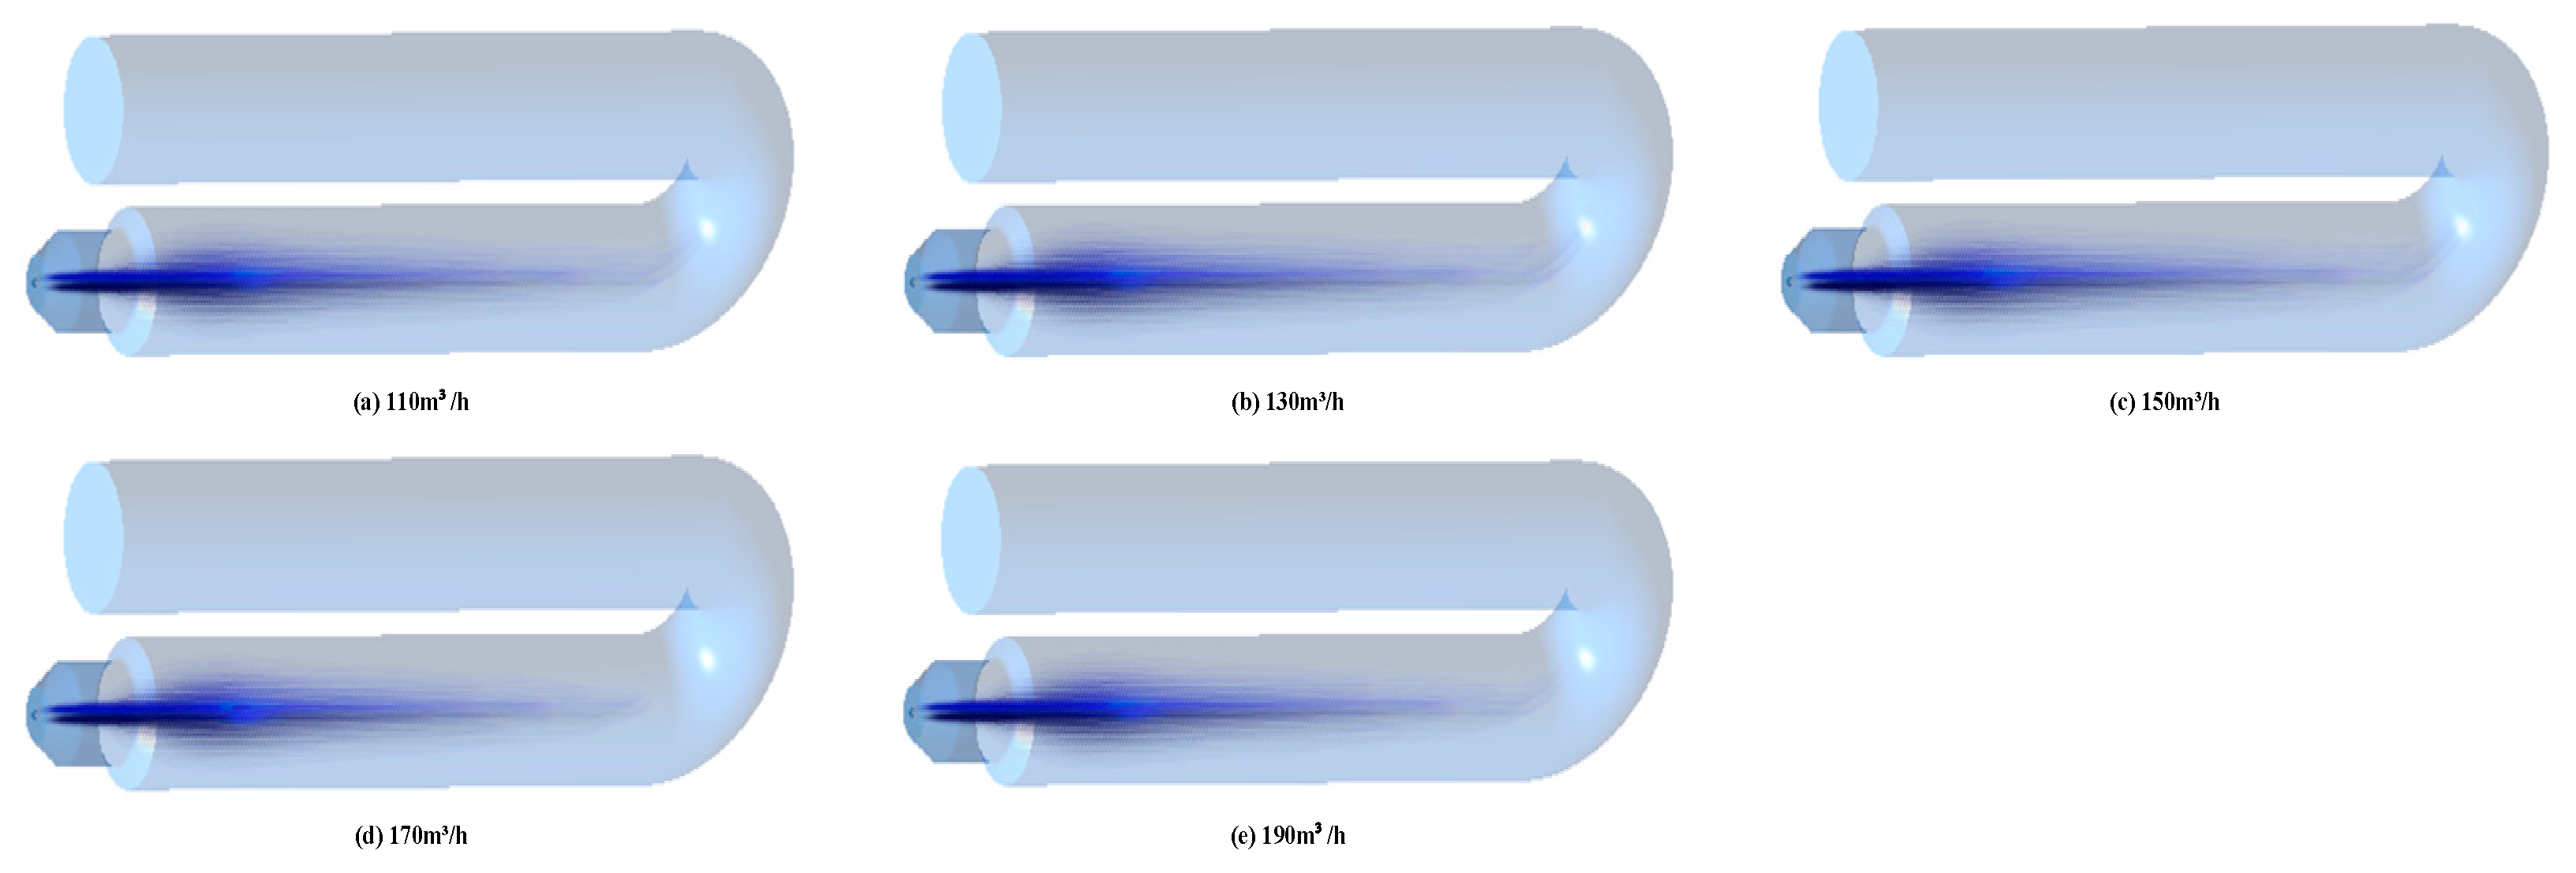
Figure 14 shows the cloud image of CH4 diffusion combustion concentration under different fuel dosages. The overall law of five different fuel dosages is basically the same in the fire tube. The fuel burns as it spreads, spreading almost all the way down the tube. This indicates that the diffusion combustion rate in the heating tube is slow, so the combustion will occur in the entire fire tube. With the increase in fuel consumption, the blue zone of fuel diffusion in the fire tube decreases first and then increases. When the fuel dosage is 170 m3/h, the blue zone is the shortest. At this dosage, the combustion is more intense, and the fuel can react faster.
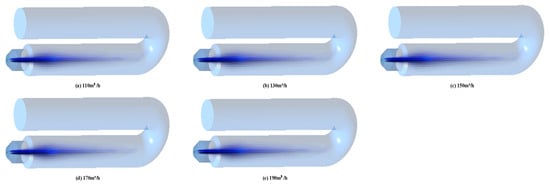
Figure 14.
CH4 concentration distribution in fire tube under different fuel dosages.
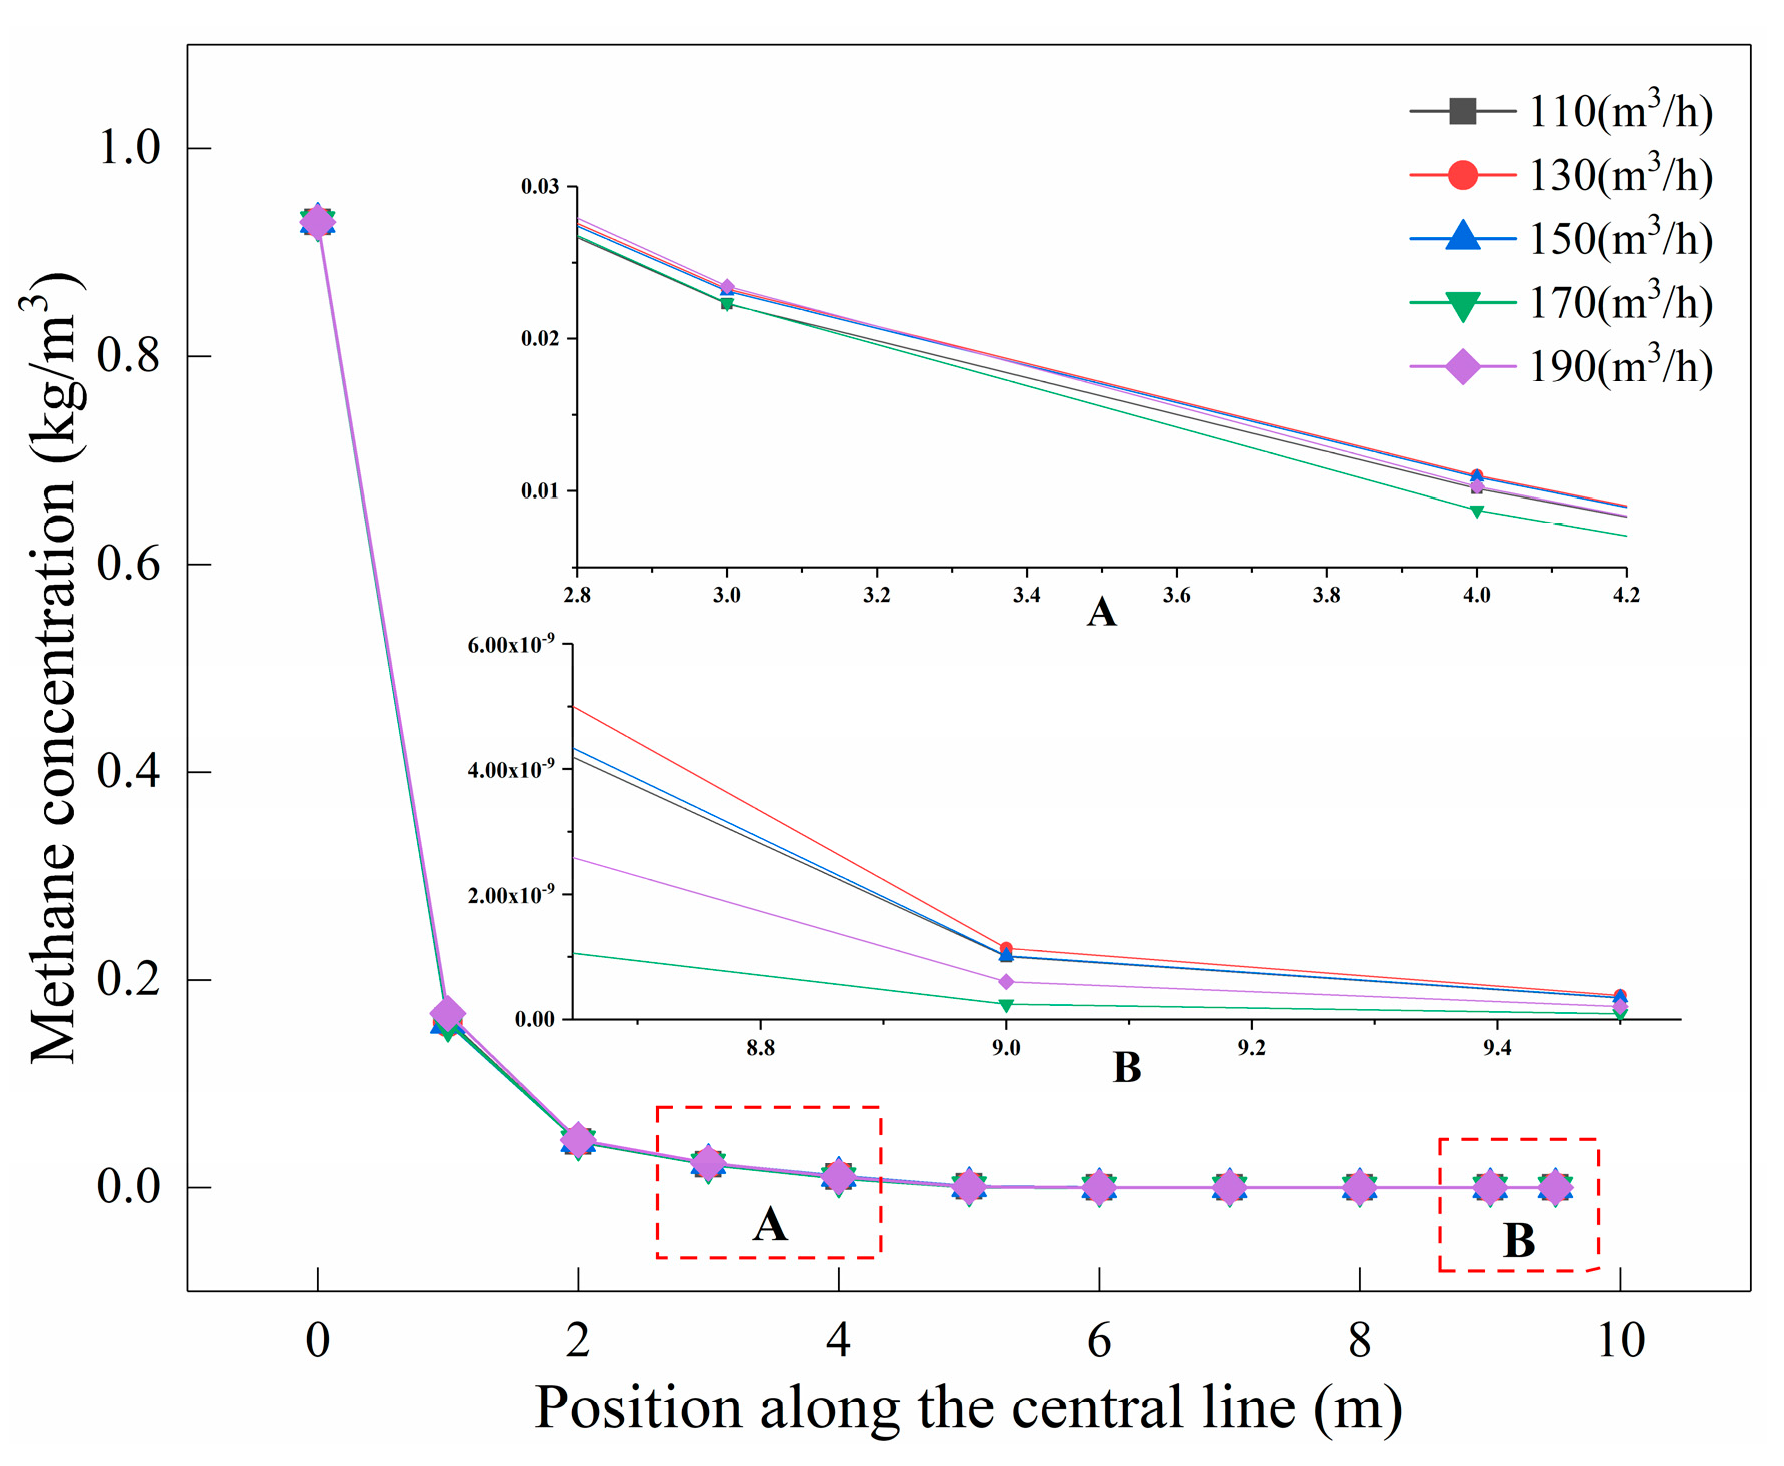
Figure 15 shows the variation trend of fuel combustion concentration on the center line in the fire tube under different fuel dosages. Part A of the figure shows the change in fuel concentration in the main combustion interval. It can be seen that when the fuel dosage is 170 m3/h, the fuel combustion speed and fuel concentration in the main combustion zone are the fastest. Part B in the figure shows the change in fuel concentration at the tail of the smoke tube. It can be seen that when the fuel dosage is 170 m3/h, the fuel combustion in the fire tube is the most full and the fuel utilization rate is the highest.
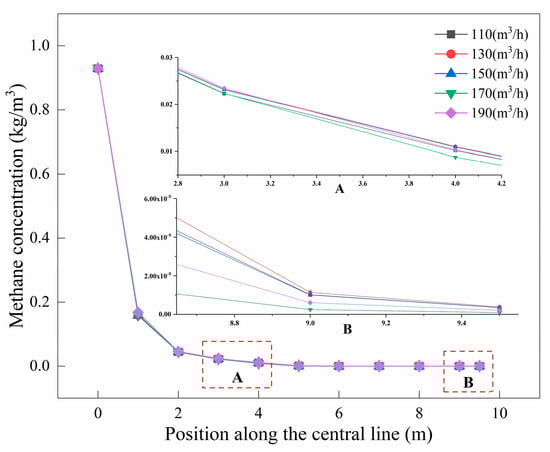
Figure 15.
Variation on the center line of CH4 concentration in the fire tube under different fuel dosages.
Combined with the temperature field, velocity field, and CH4 and O2 concentration field analysis in the fire tube, it is found that when the fuel consumption is 170 m3/h, the combustion temperature in the fire tube is the highest at 2329.9 K, the fuel combustion is relatively full, and the average temperature on the inner wall of the fire tube is the highest 1597.2 K, the combustion effect is good, and the heat supply is the most.
3.2. Optimization of Air Dosage
When the excess air coefficient is less than 1, the fuel combustion is incomplete, the heat of the fuel cannot be fully released, and the wall surface of the combustion chamber cannot reach the required temperature. However, the excess air coefficient is too large to increase the smoke gas volume, the smoke gas flow rate becomes faster, taking away more heat, and the heat transfer efficiency is reduced. At the same time, the increase in air dosage accelerates the oxidation rate of the air side wall surface of the pyrotechnic tube, which will reduce the service life of the pyrotechnic tube and increase the risk of safety production.
In this section, the optimal fuel consumption of 170 m3/h after optimization in Section 3.1 was used, and the air excess coefficients of 1.05, 1.10, 1.15, 1.20, 1.25, and 1.30 were, respectively, used to simulate combustion, so as to study the influence of different air consumption on combustion in the fire tube.
3.2.1. Analysis of Velocity Field Characteristics
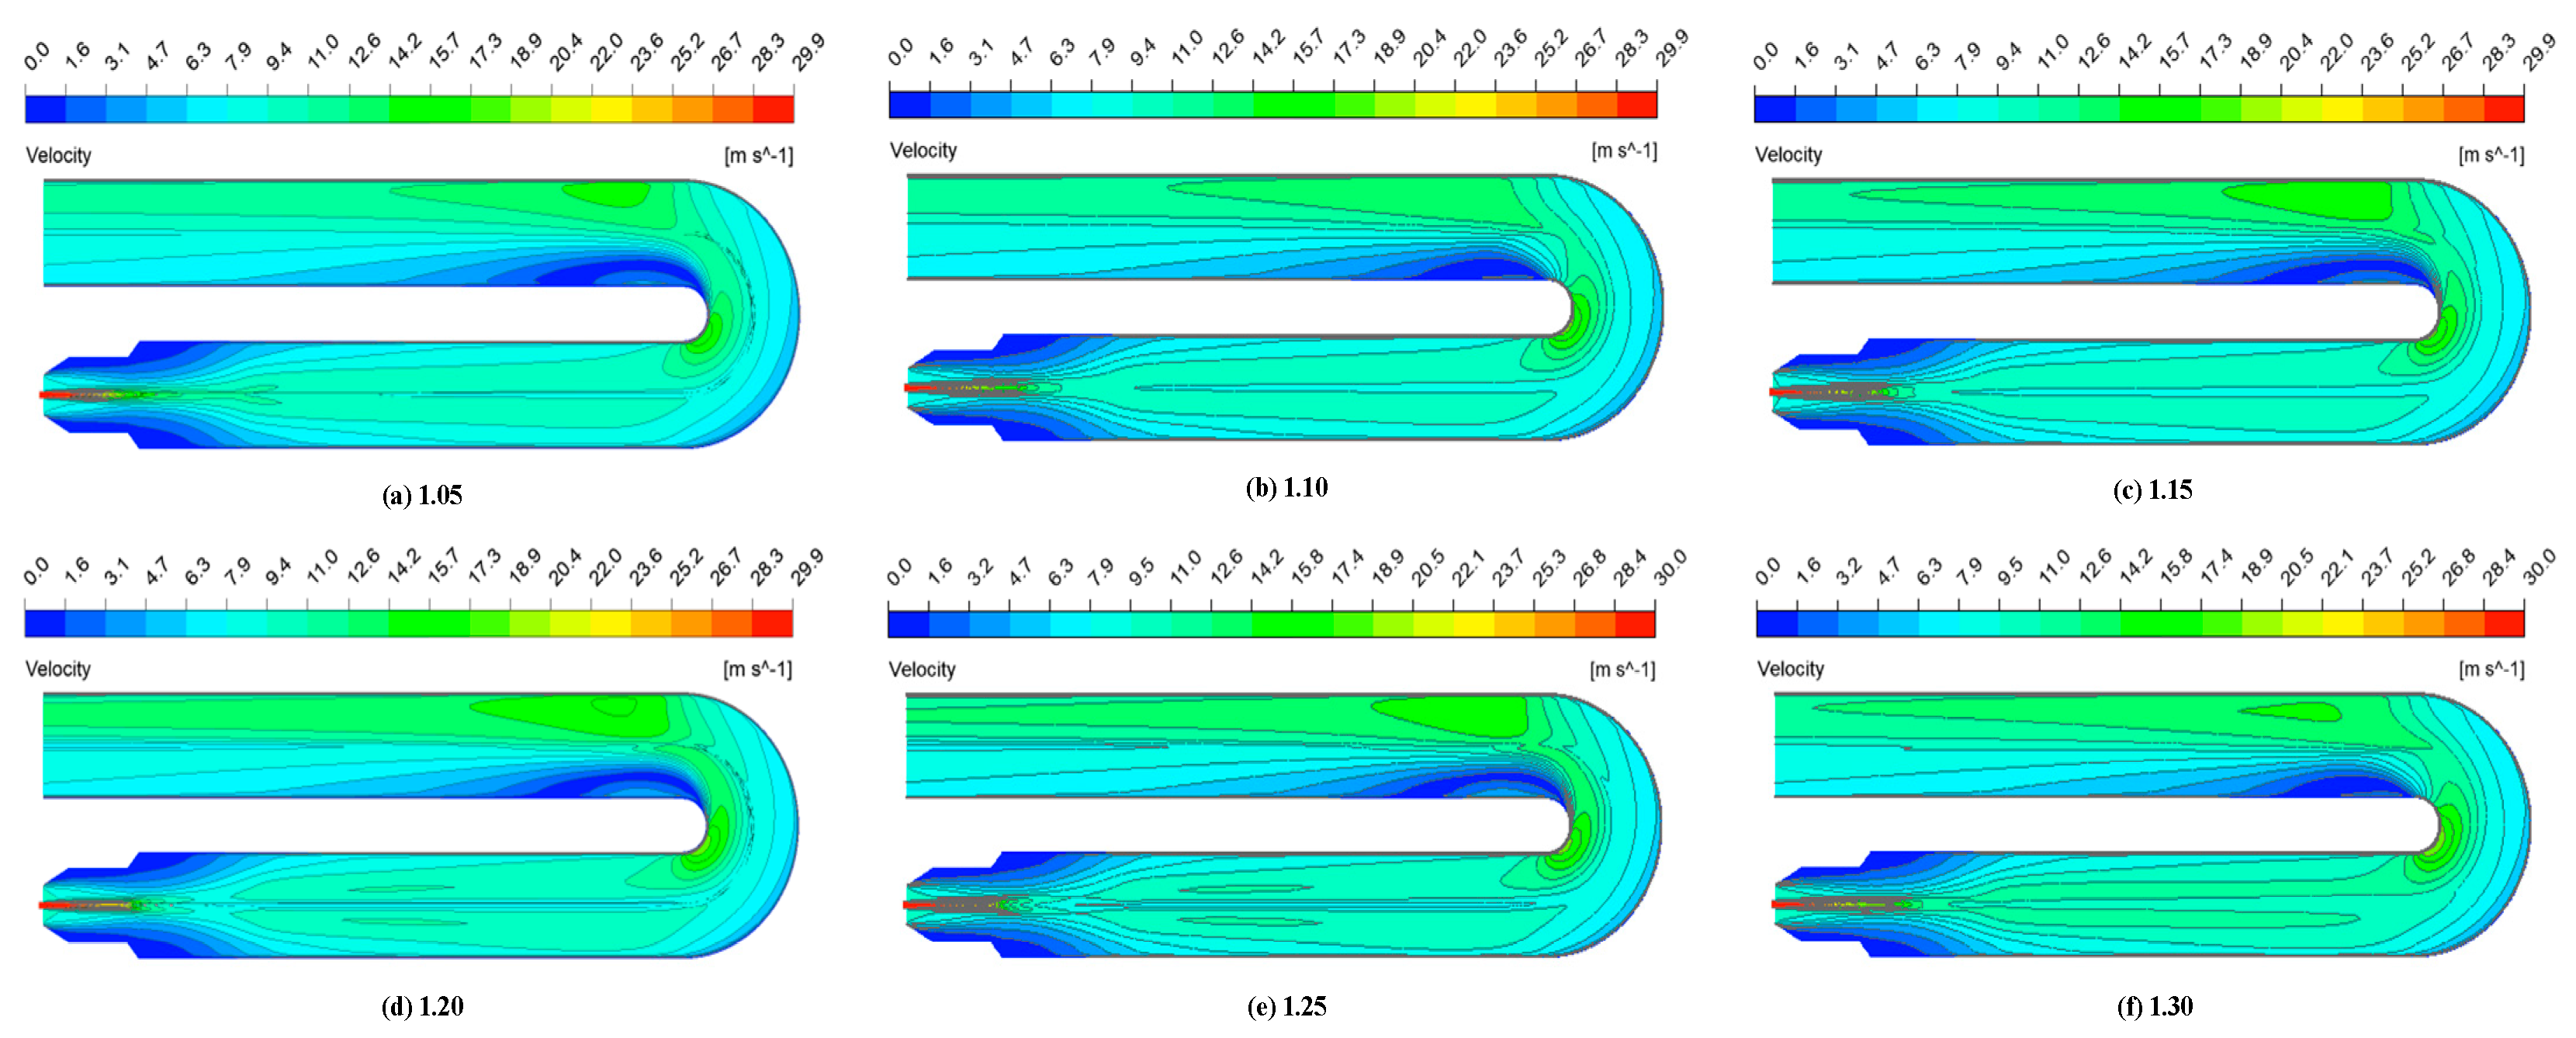
Figure 16 shows the velocity cloud image of XY section in the fire tube under different air dosages. Changing the amount of air has almost no effect on the maximum speed of the inlet in the fire tube, because the inlet diameter of the combustion air is relatively large, and the gas inlet speed is much larger than the inlet speed of the combustion air. However, the diffusion combustion rate in the fire tube increases with the increase in the amount of air, and the reflux zone in the fire tube is more obvious with the increase in the amount of air.
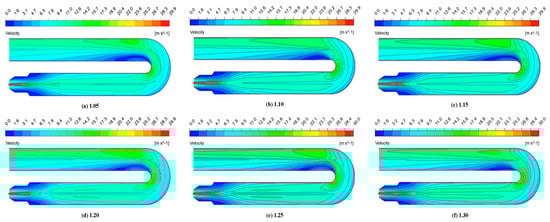
Figure 16.
Velocity distribution in fire tube with XY cross-section under different air dosages.
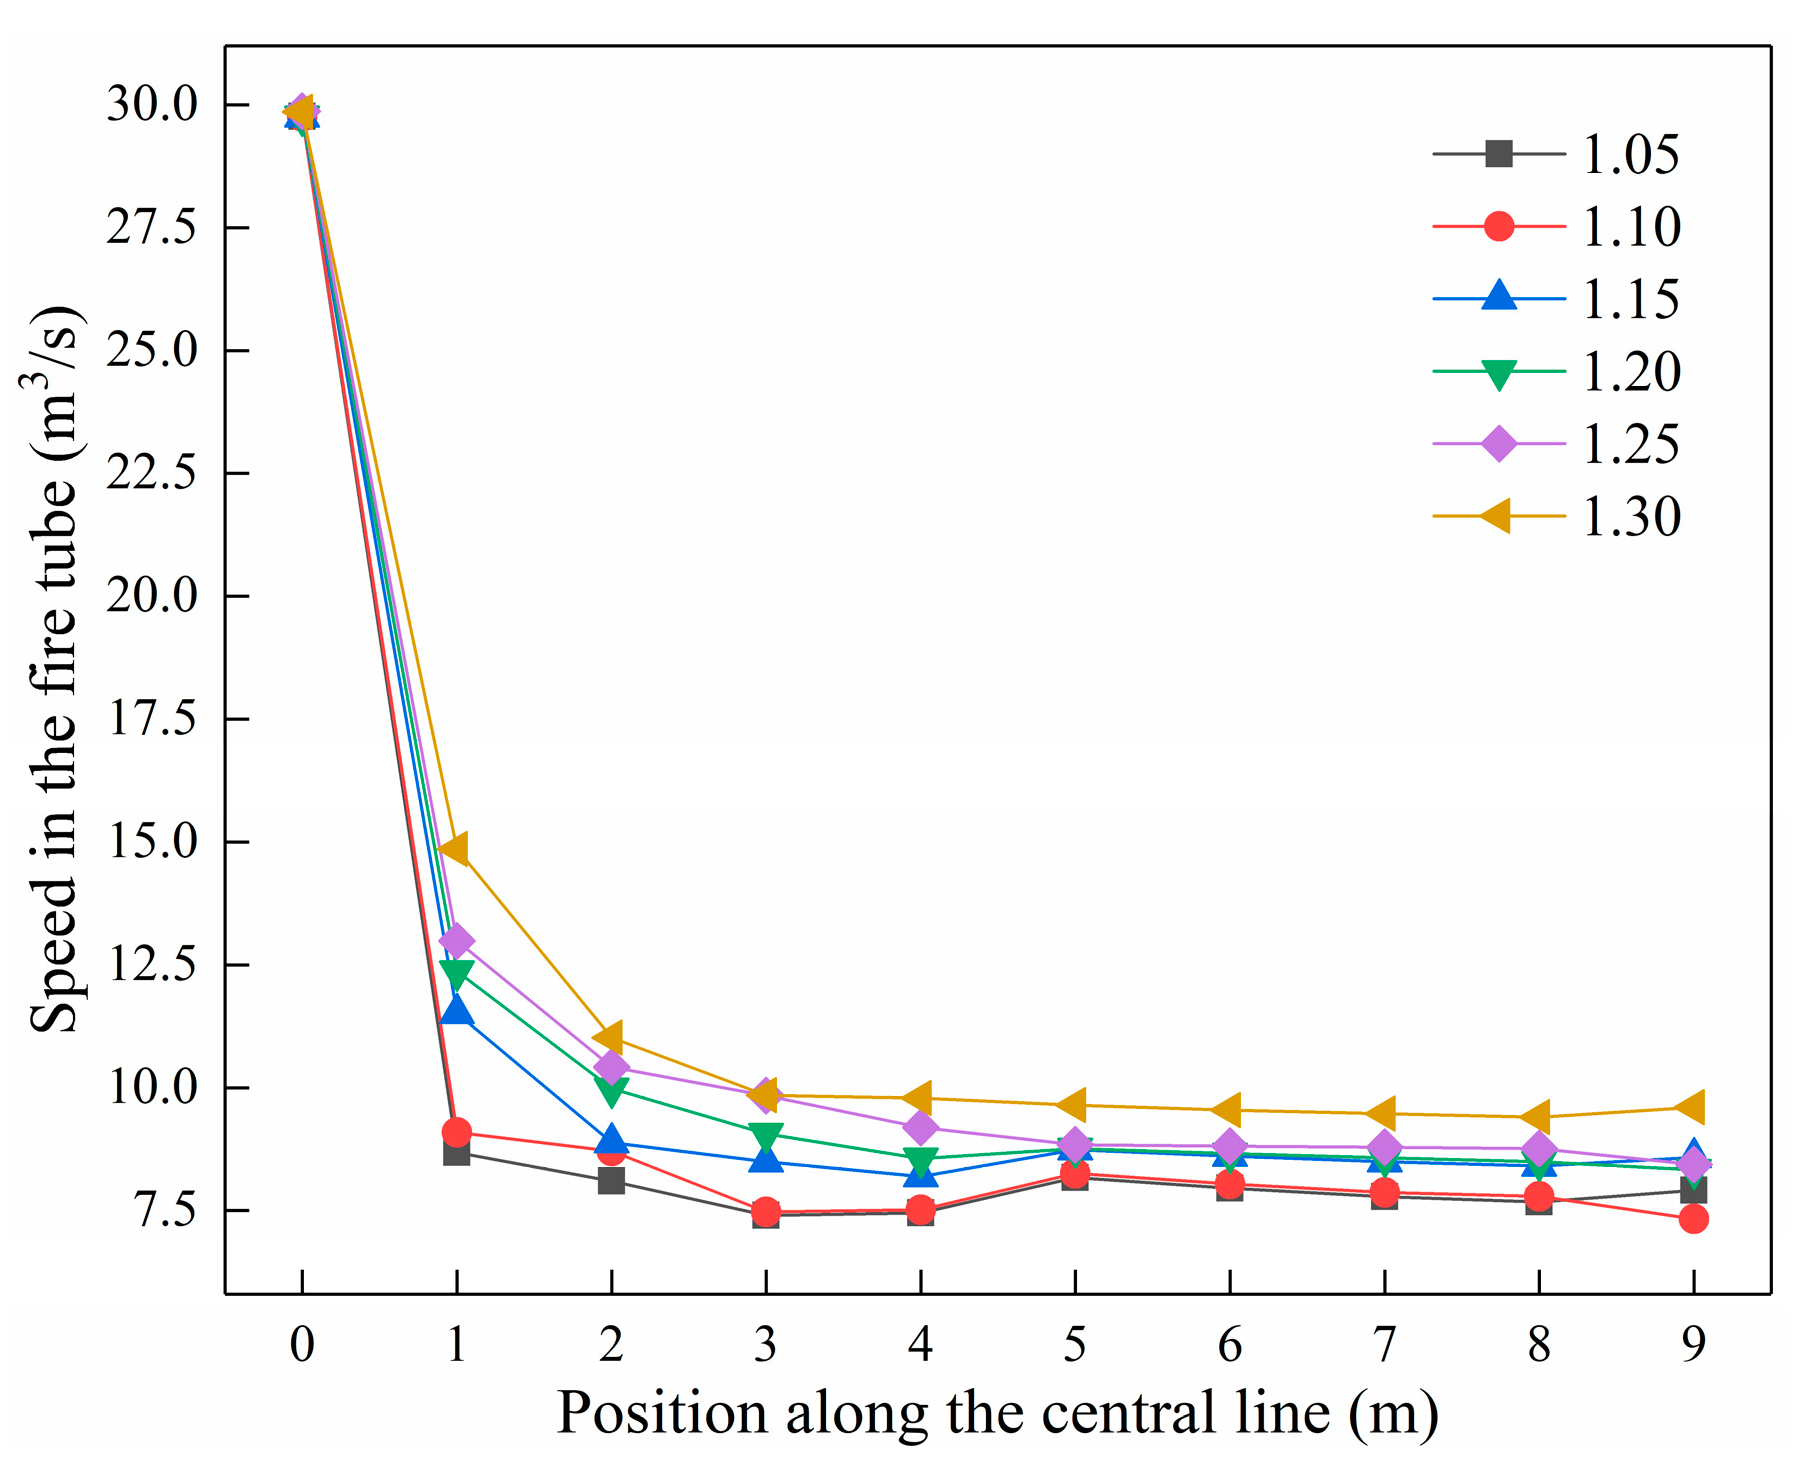
Figure 17 shows the change trend of the speed on the center line in the fire tube under different air dosages. The speed on the center line in the fire tube plunged between 0 and 2 m, and then gradually stabilized. With the increases in air dosage, the flue gas velocity in the smoke tube is also gradually increasing. The smoke gas flow speed will bring more heat from the fire tube out of the heating furnace and reduce the heat transfer effect of the tube wall.
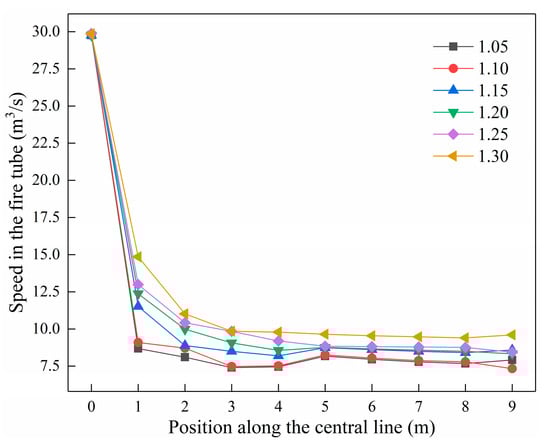
Figure 17.
Variation on the center line velocity in the fire tube under different air dosages.
3.2.2. Analysis of Temperature Field Characteristics
- Influence on the temperature field in the fire tube
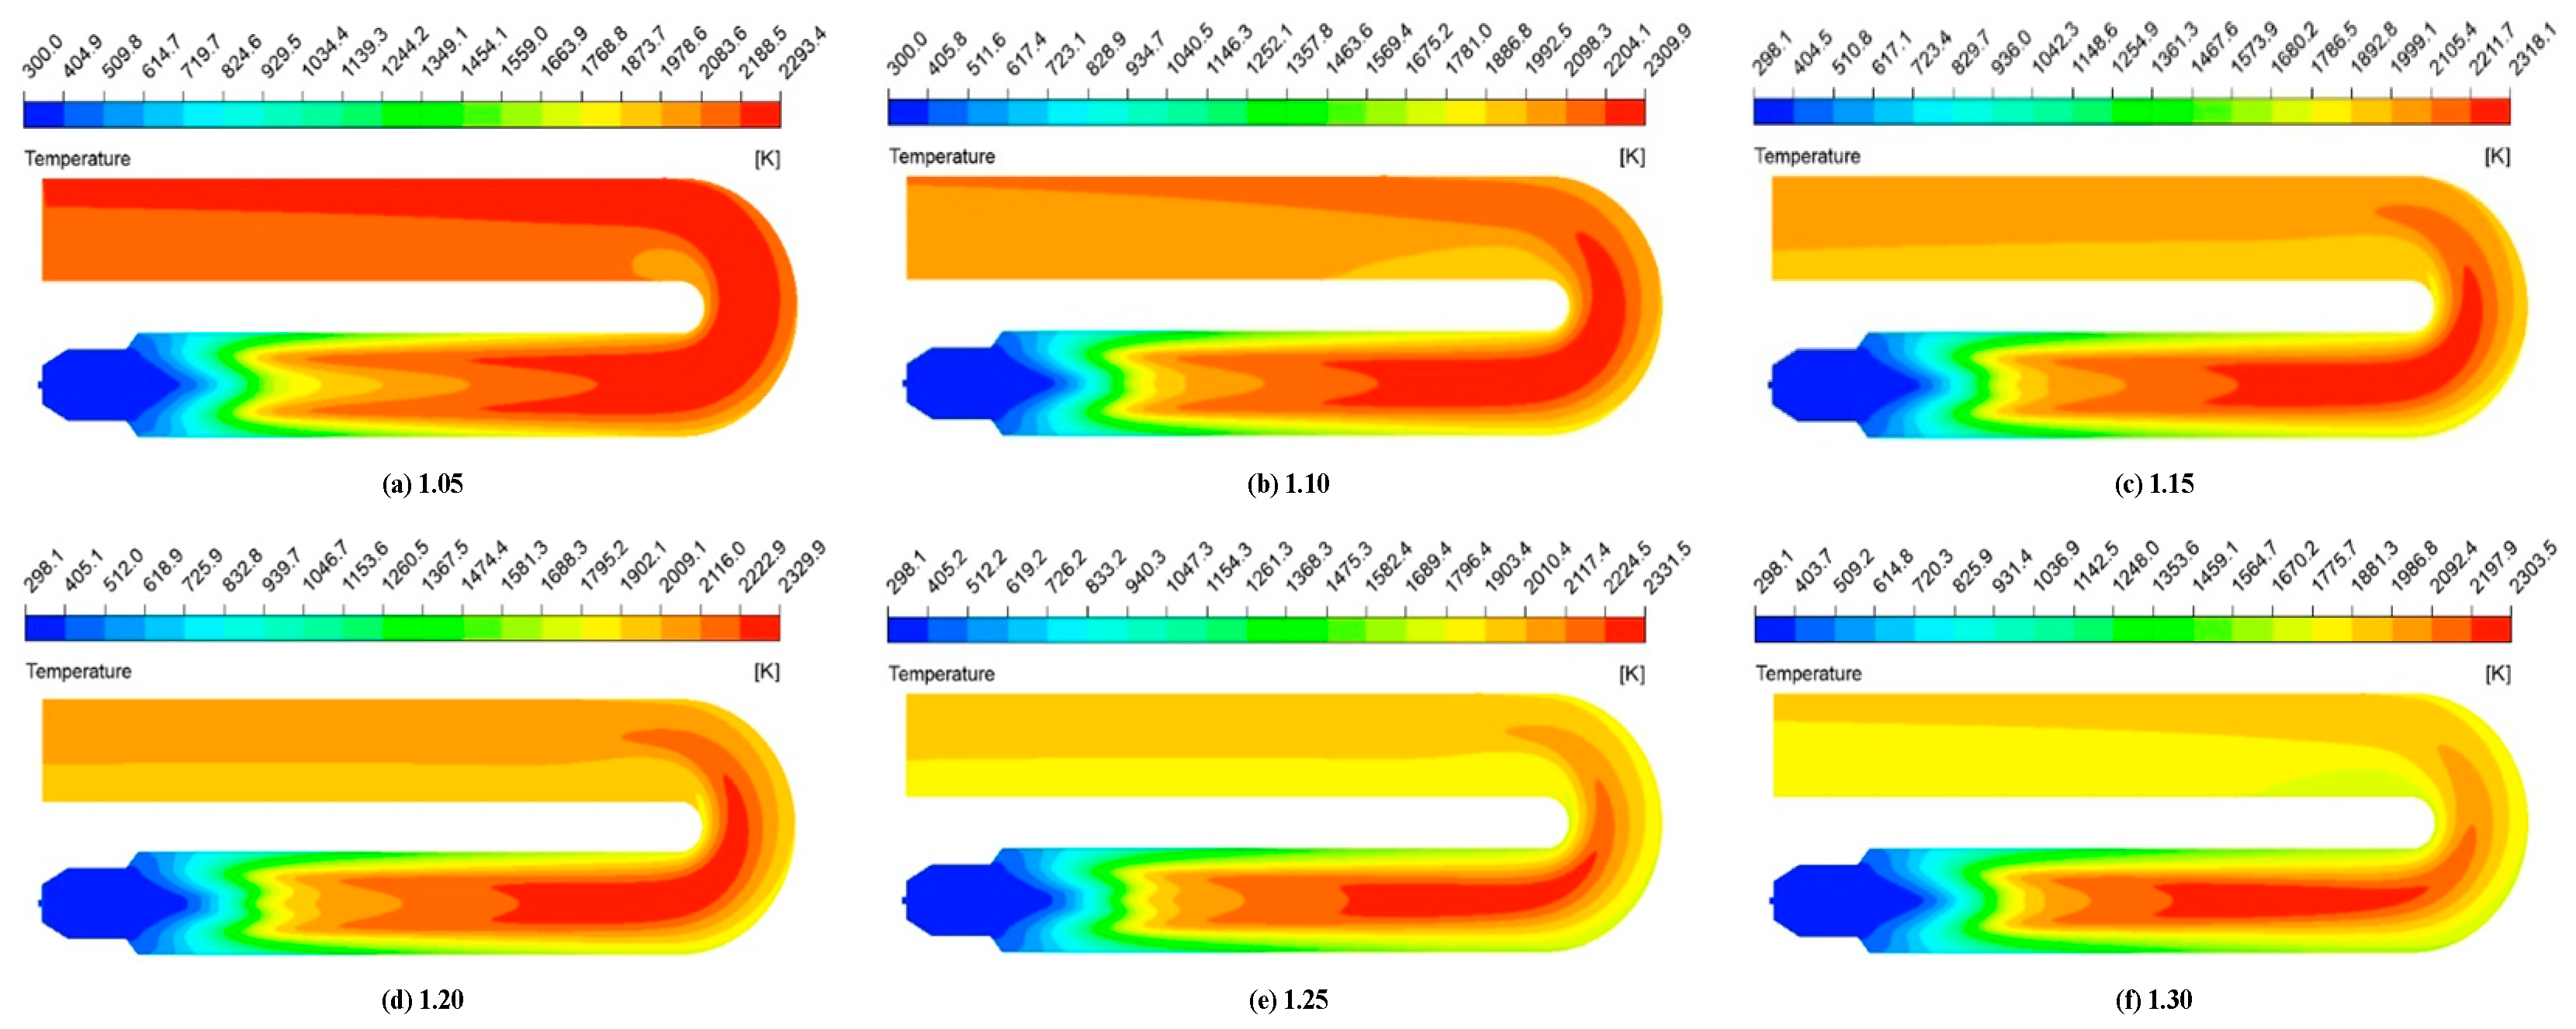
Figure 18 shows the temperature cloud image of XY cross section in the fire tube under different air dosages. The temperature is distributed symmetrically along the center line of the fire tube, the temperature gradient is large in the front part of the fire tube, and the main combustion zone is concentrated in the rear part of the fire tube. The temperature in the flue tube varies by layer. The lower smoke tube’s upper temperature is high. Inside the fire tube, the highest temperature is achieved with an increase in the amount of air, which decreases after first increasing; the dosage of air is 1.25, and the highest temperature is 2331.5 K. At the same time, with the increase in the air consumption, the red cone area in the fire tube becomes shorter and shorter, indicating that the more intense the combustion, the faster the combustion speed.
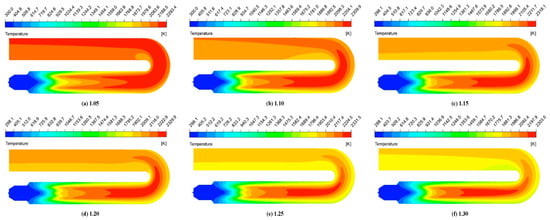
Figure 18.
Temperature distribution in fire tube with XY cross-section under different air dosages.
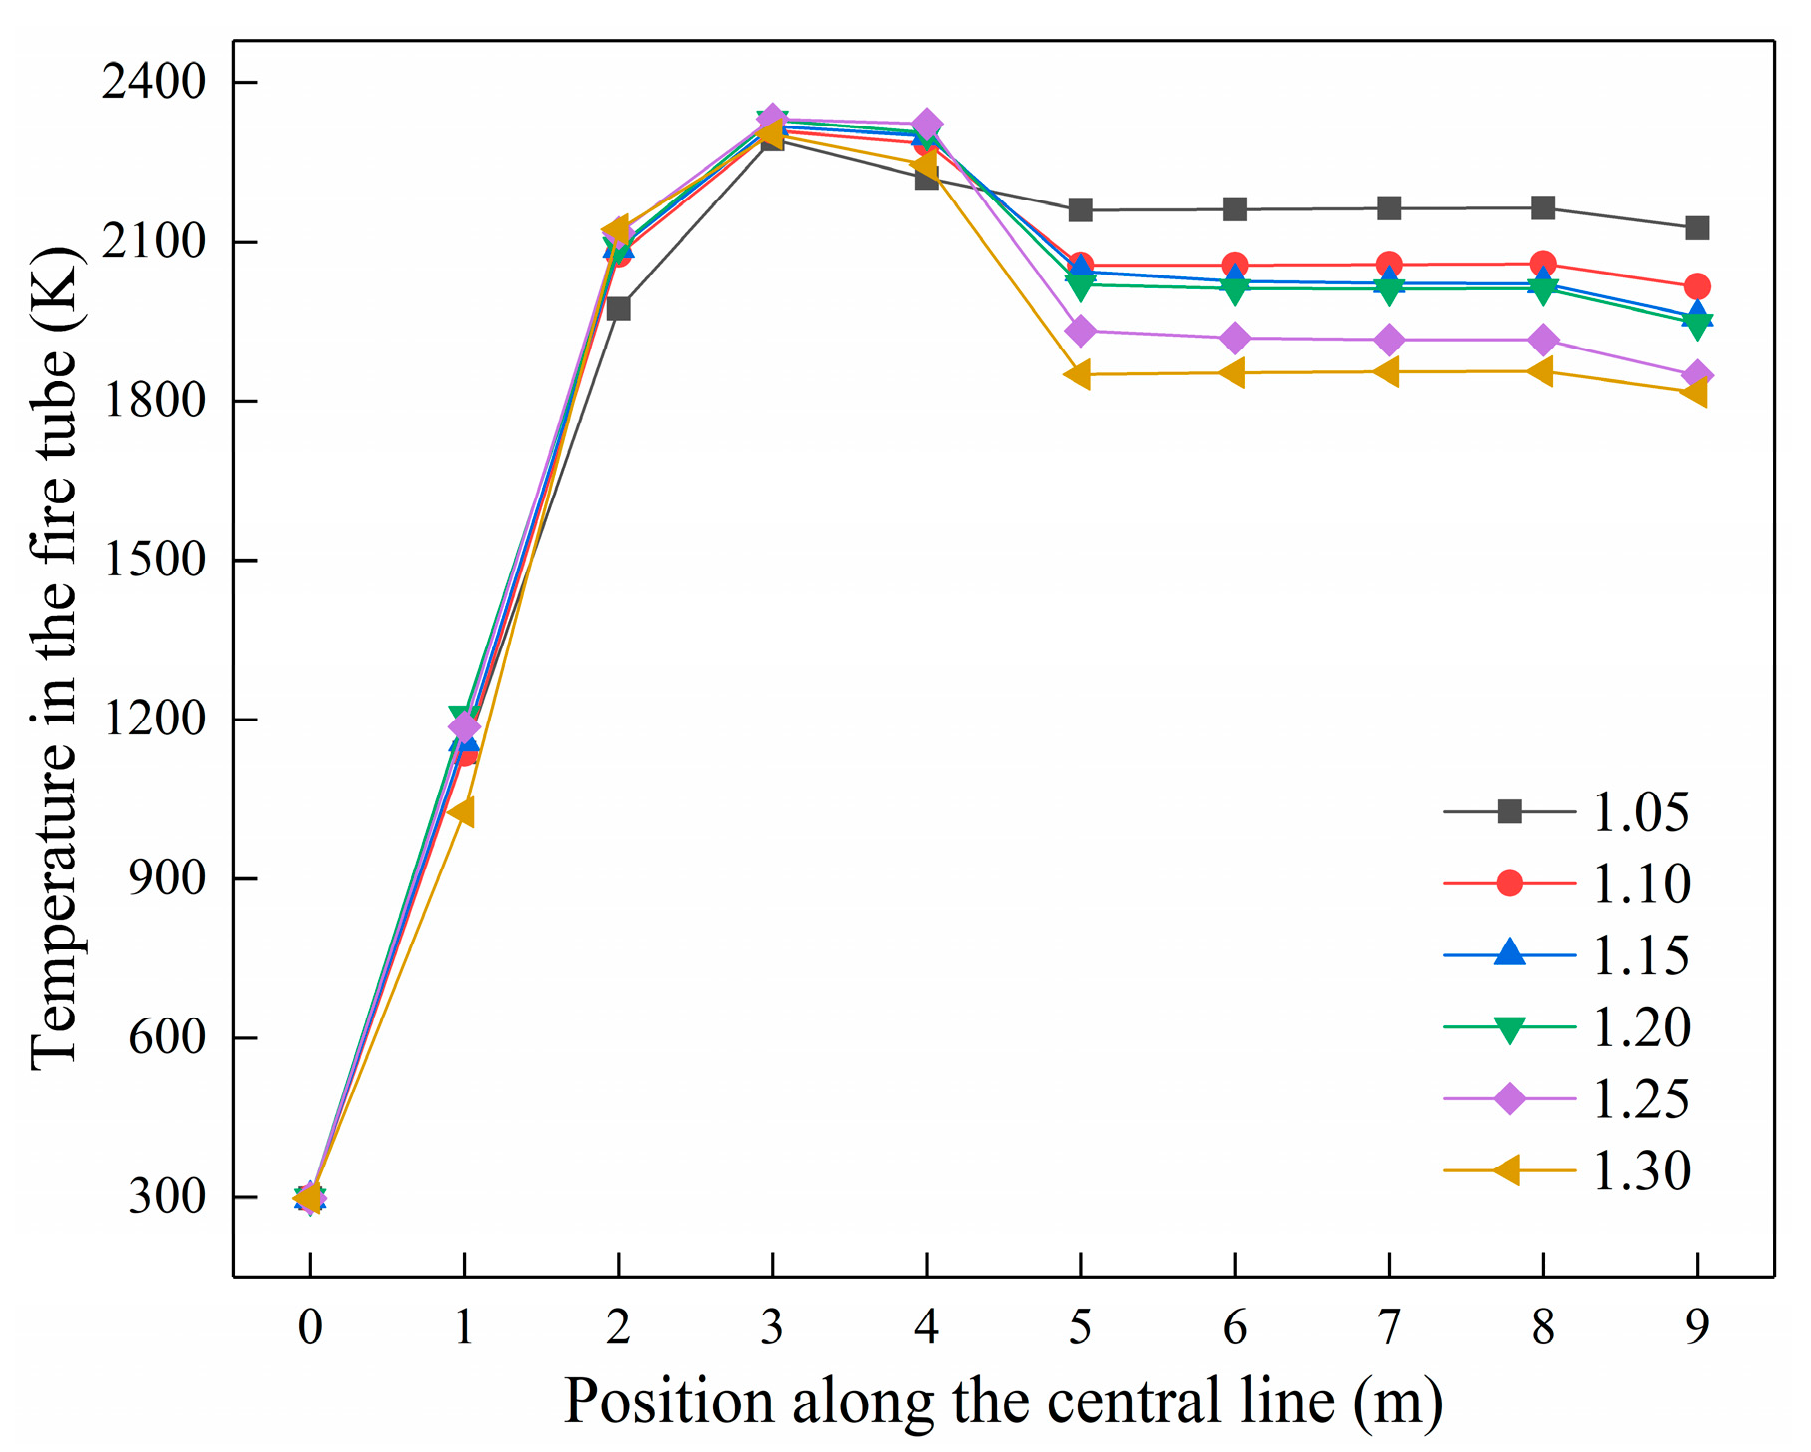
Figure 19 shows the temperature variation trend on the center line in the fire tube under different air dosages. The temperature on the center line of the fire tube increases rapidly in the range of 0–3 m, indicating that the fuel diffusion and combustion are most intense at this distance in the fire tube. At around 3 m, the temperature peaks and most of the fuel has finished reacting. The temperature at 3–5 m decreases, and the temperature in the smoke tube becomes stable. When the excess air dosage is 1.25, the combustion temperature in the fire tube is the highest, indicating that the fuel is burned most fully under the air dosage and more heat energy can be released. At the same time, it is found that when the air coefficient is 1.3, the temperature in the smoke tube is the lowest, indicating that the more air there is, the higher the temperature in the fire tube will be.
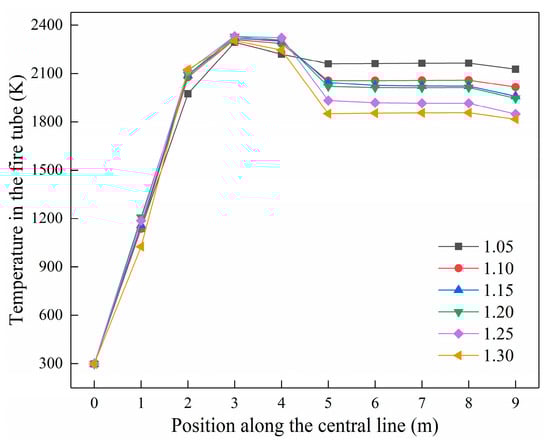
Figure 19.
Variation on the center line temperature in the fire tube under different air dosages.
- 2.
- Influence on the inner wall temperature of the fire tube
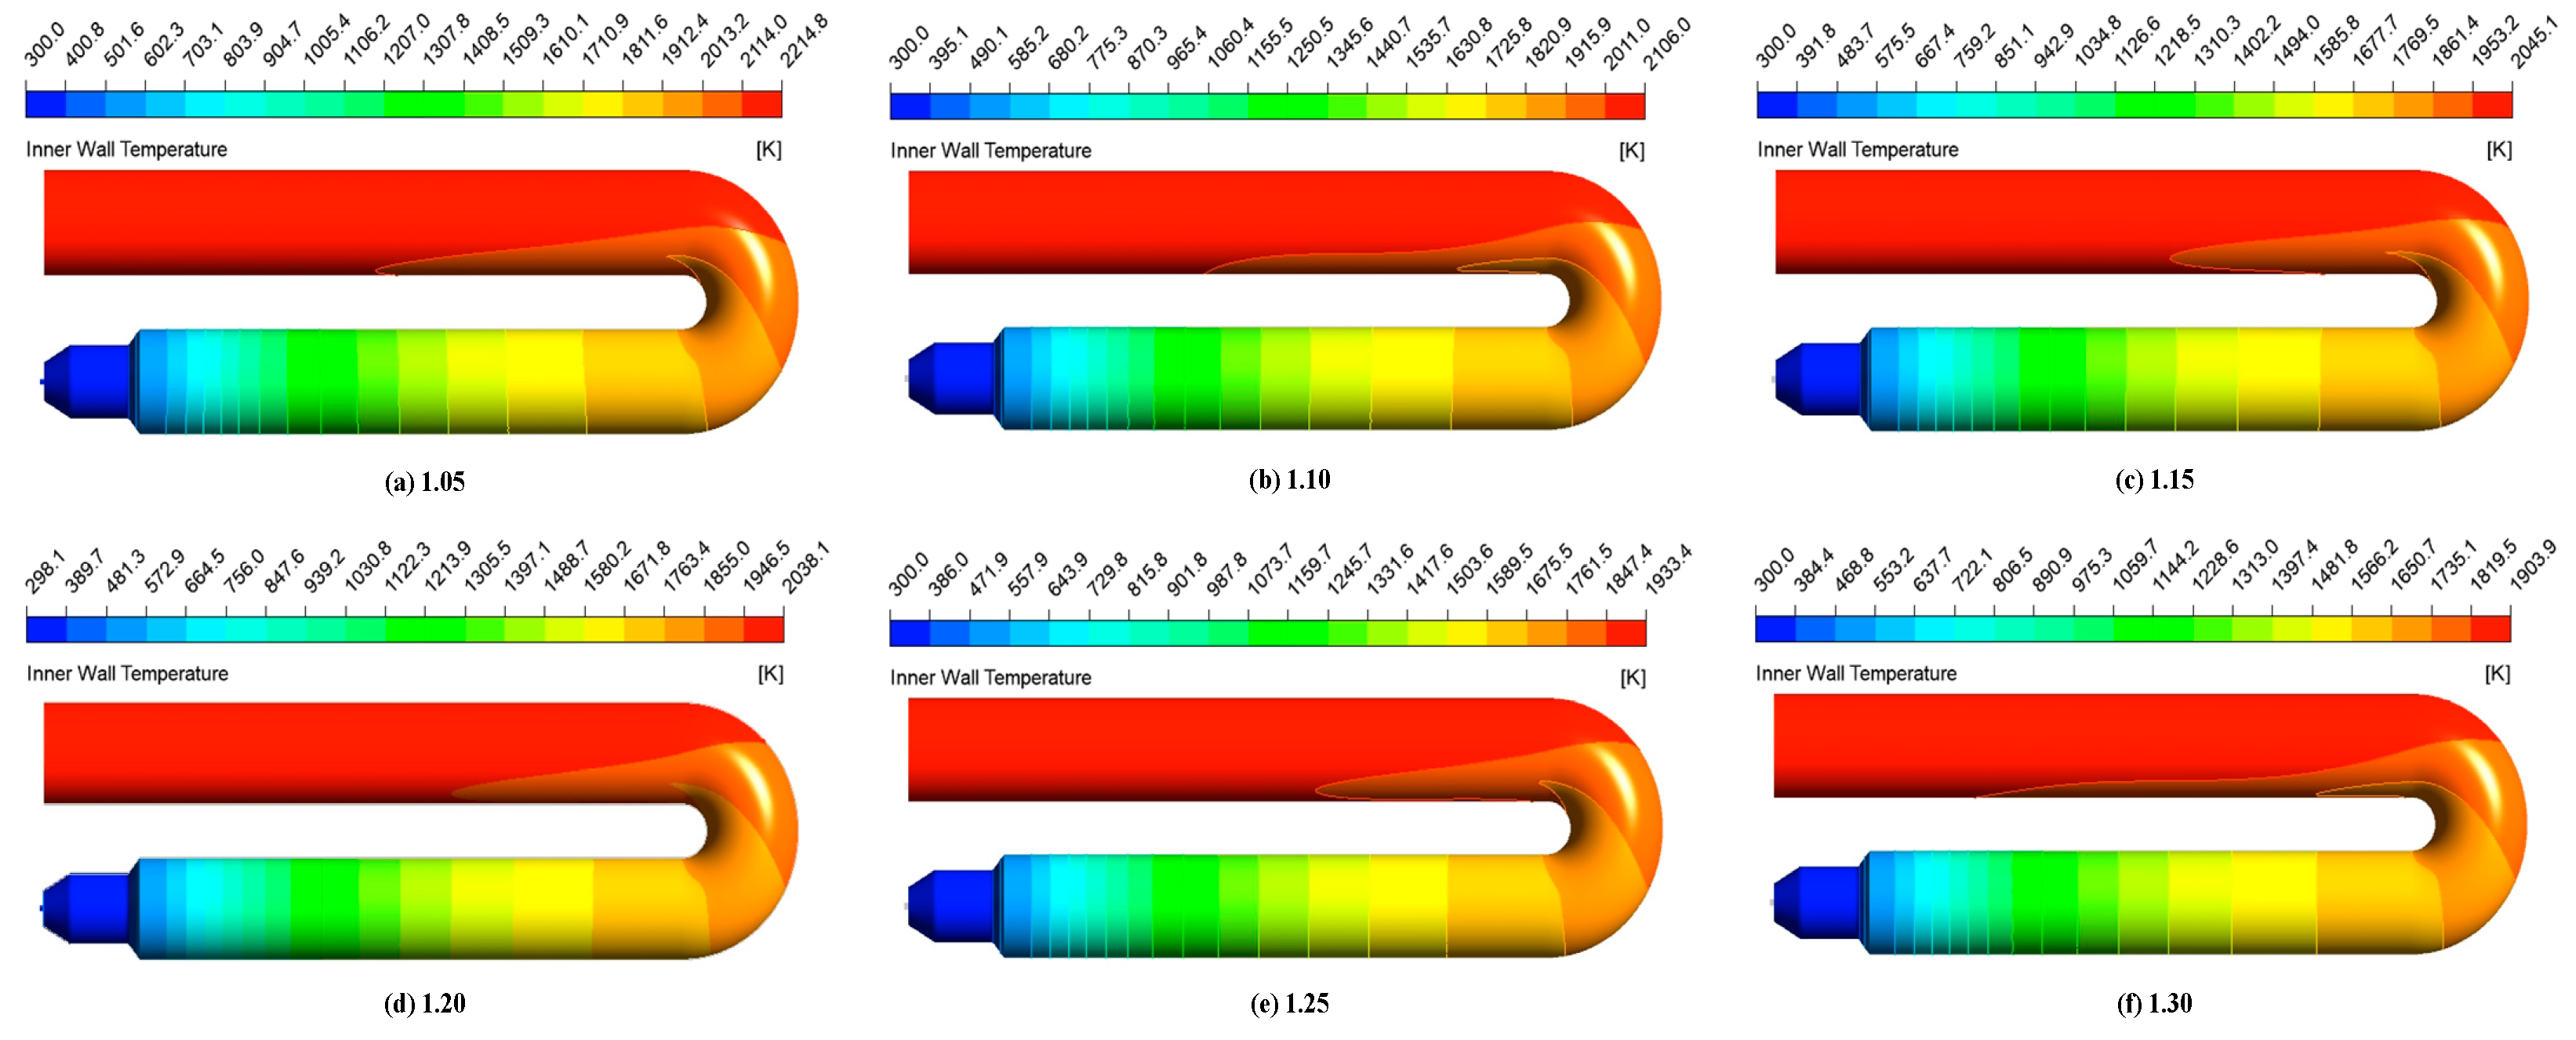
Figure 20 shows the temperature cloud image on the inner surface of the fire tube under different air dosages. The high-temperature area on the inner surface of the fire tube with five kinds of air dosages is mainly in the U-shaped joint and the chimney part. With the increase in the excess air coefficient, the maximum temperature on the inner wall of the fire tube decreases, indicating that the excess air coefficient has an effect on the heat transfer of the smoke gas in the fire tube.
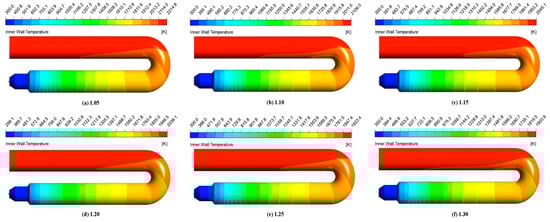
Figure 20.
Temperature distribution on the inner wall of fire tube with XY cross-section under different air dosages.
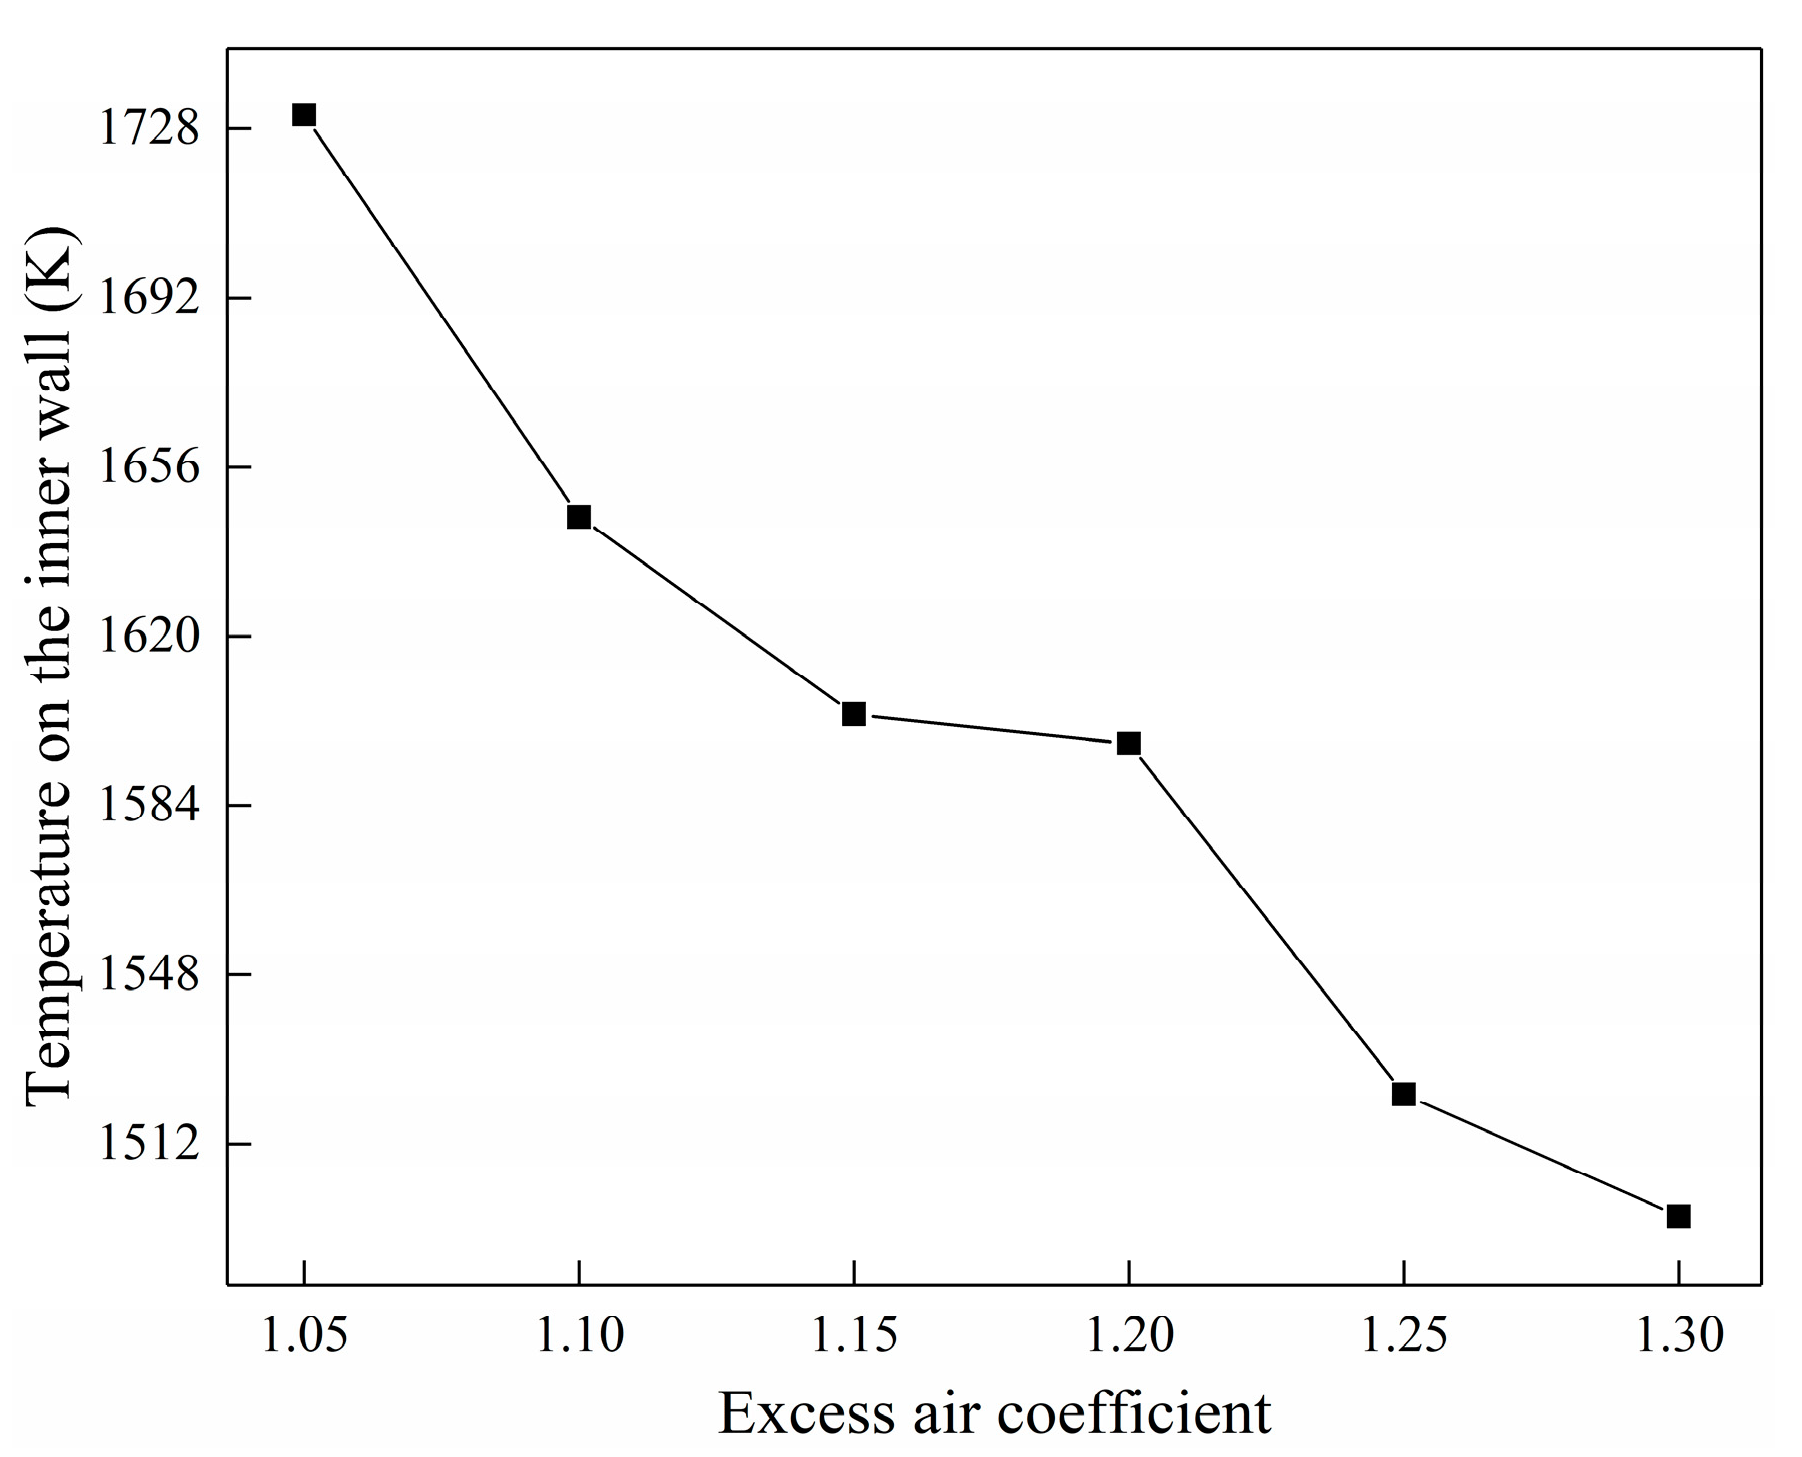
Figure 21 shows the variation trend of the mean temperature on the inner surface of the fire tube under different air dosages. The average temperature on the inner surface of the fire tube decreases with the increases in air dosage, and the higher the excess air coefficient in the fire tube, the lower the heat transfer efficiency of the smoke gas.
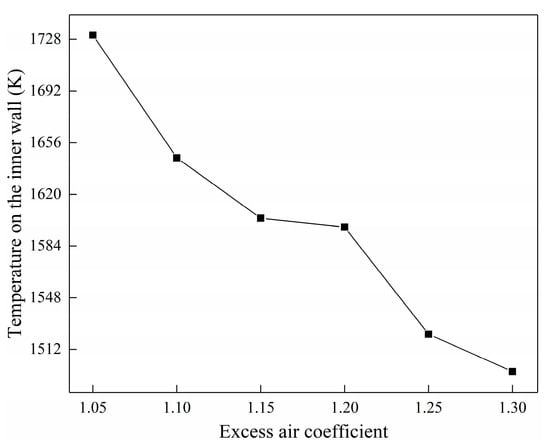
Figure 21.
Average temperature distribution on the inner wall of fire tube under different air dosages.
3.2.3. Analysis of Concentration Field Characteristics
- O2 concentration field
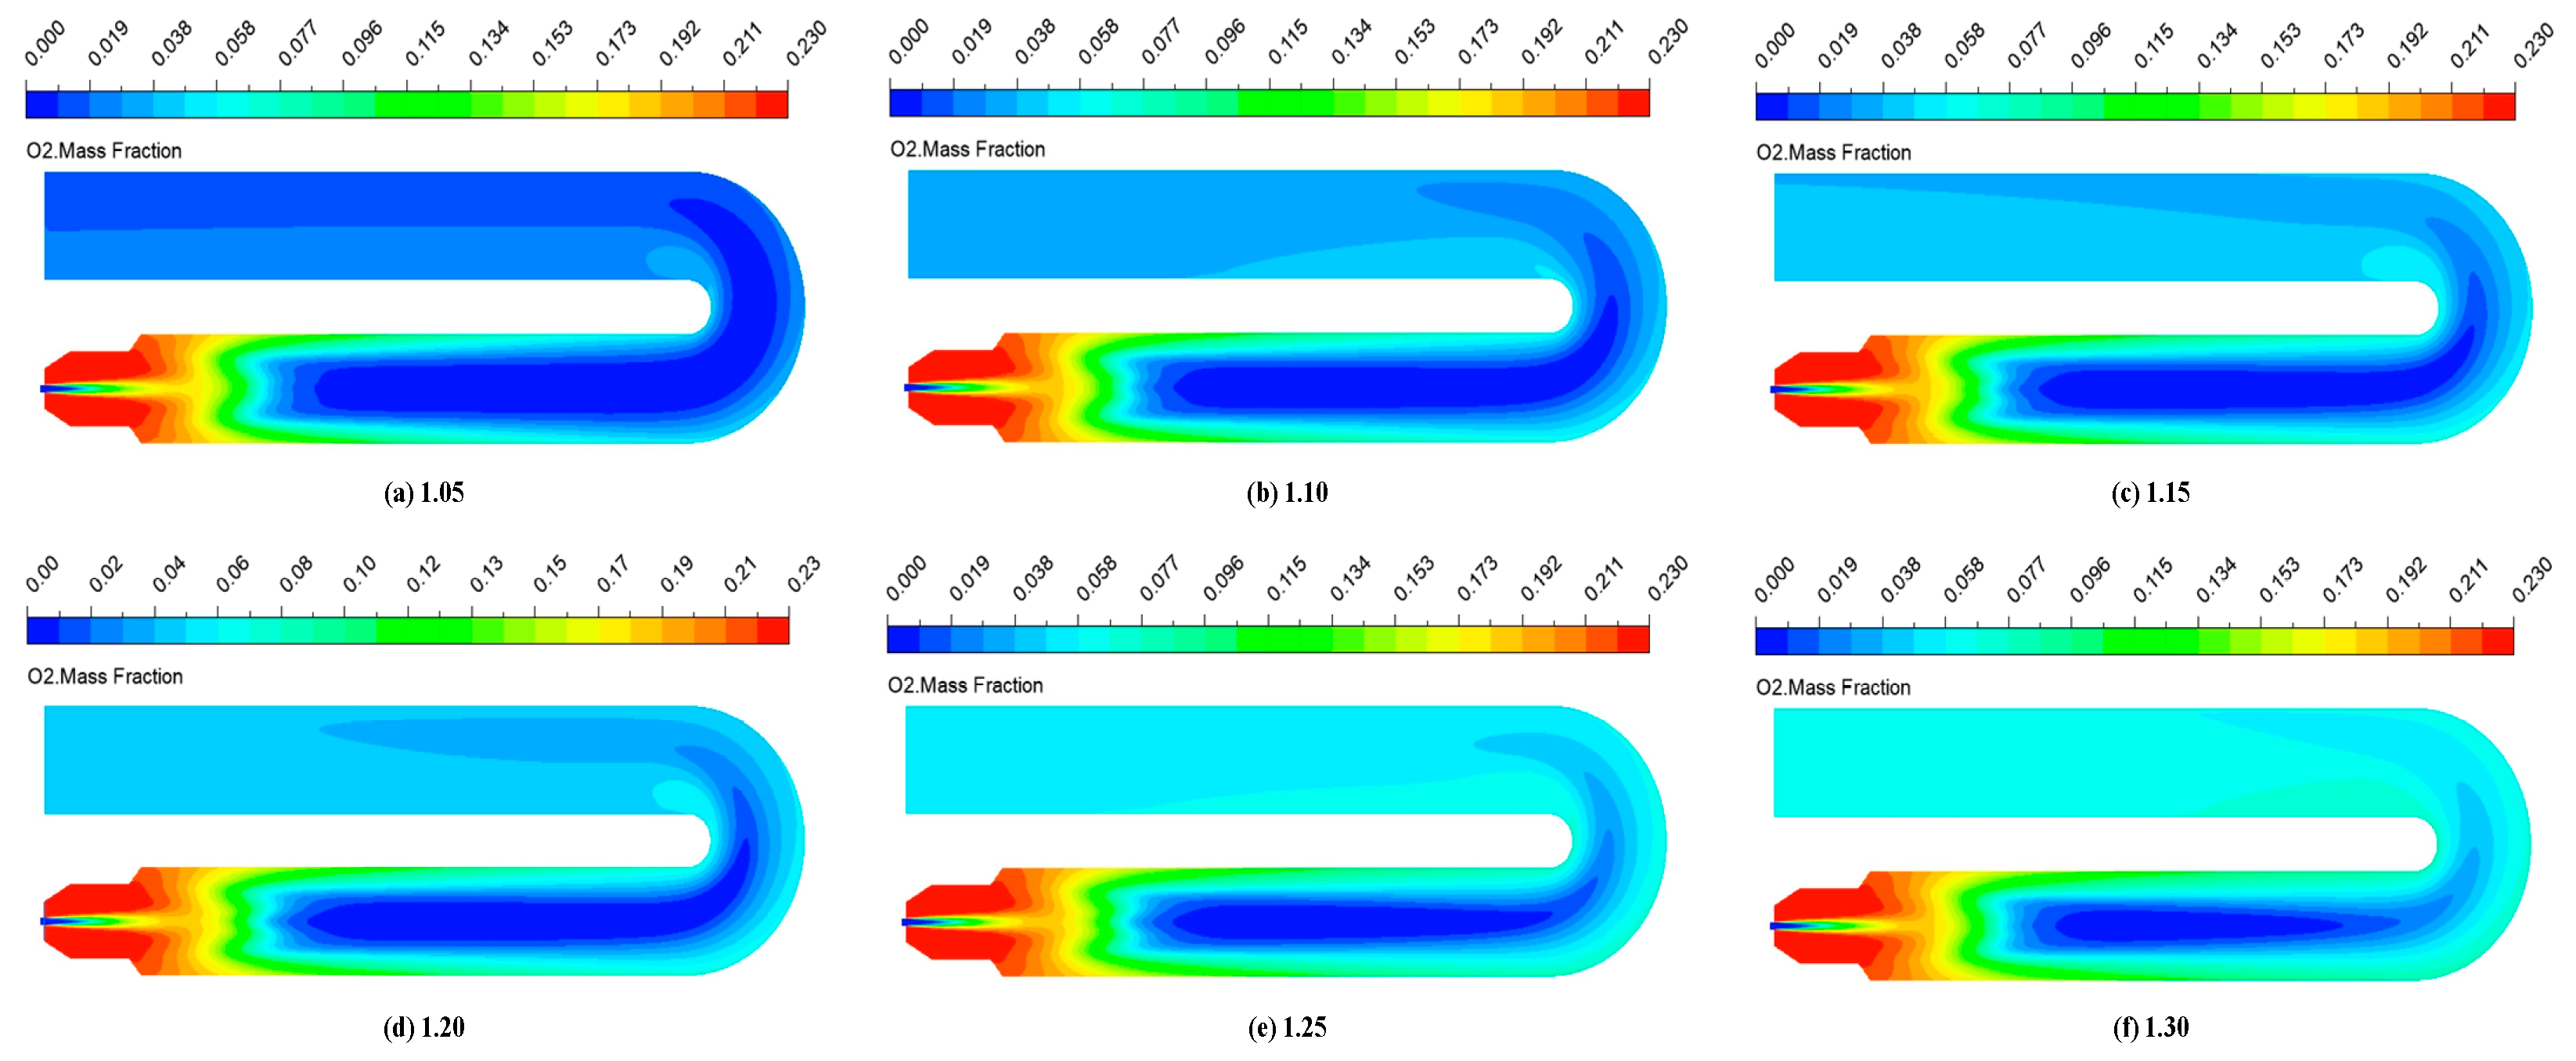
Figure 22 shows the cloud image of the O2 concentration in the XY section of the fire tube under different air dosages. With the increase in air dosage, the low-oxygen-concentration area in the fire tube gradually decreases, indicating that the larger the air dosages, the more intense the fuel combustion in the fire tube.
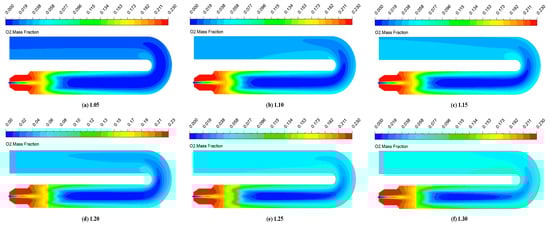
Figure 22.
O2 concentration distribution in fire tube with XY cross-section under different air dosages.
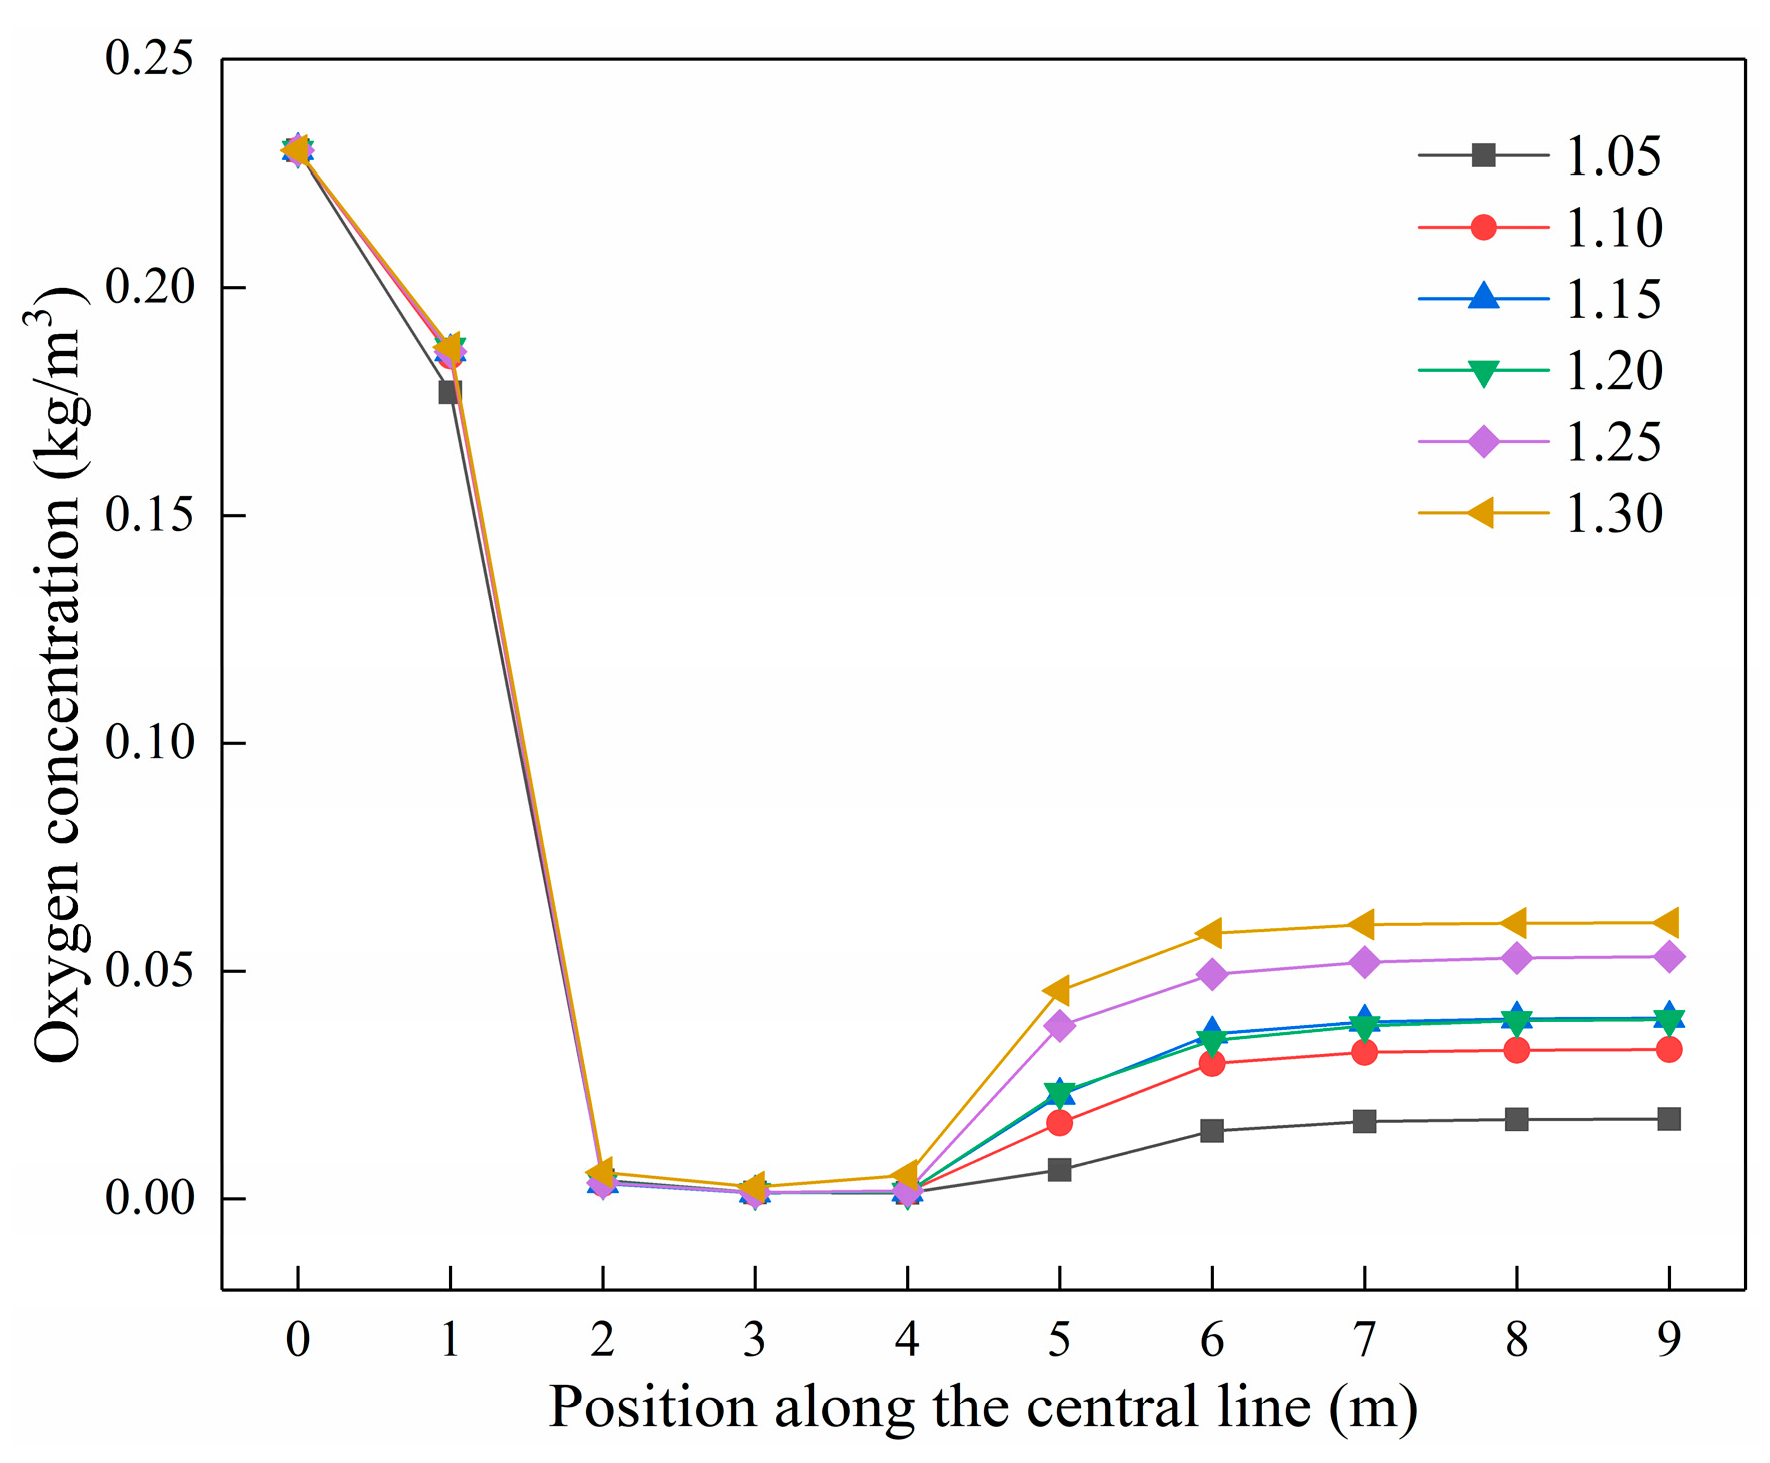
Figure 23 shows the change in O2 concentration on the center line in the fire tube under different air dosages. The O2 concentration drops sharply at 1–2 m of the fire tube, and the O2 concentration is the lowest at 2–4 m of the fire tube. Then, the O2 concentration in the fire tube increases slightly, and the O2 concentration in the smoke tube tends to be stable. With the increase in air dosage, the smoke tube O2 concentration increases gradually, and the temperature in the smoke tube in Figure 19 decreases with the increase in the air dosage, and thus, it is verified that if the air excess coefficient is to high, this will increase the amount of smoke, thus taking away more heat and reducing the heat transfer efficiency.
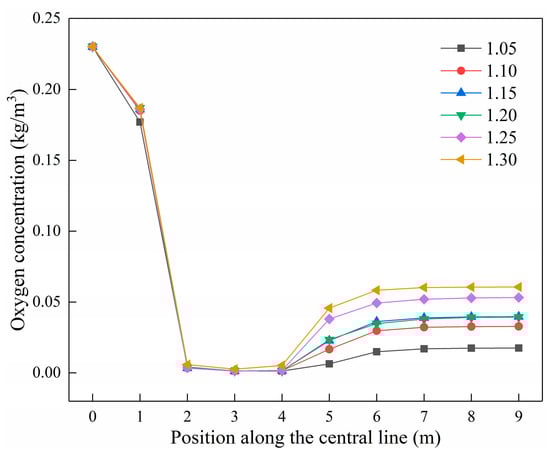
Figure 23.
Variation on the center line of O2 concentration in the fire tube under different air dosages.
- 2.
- CH4 concentration field
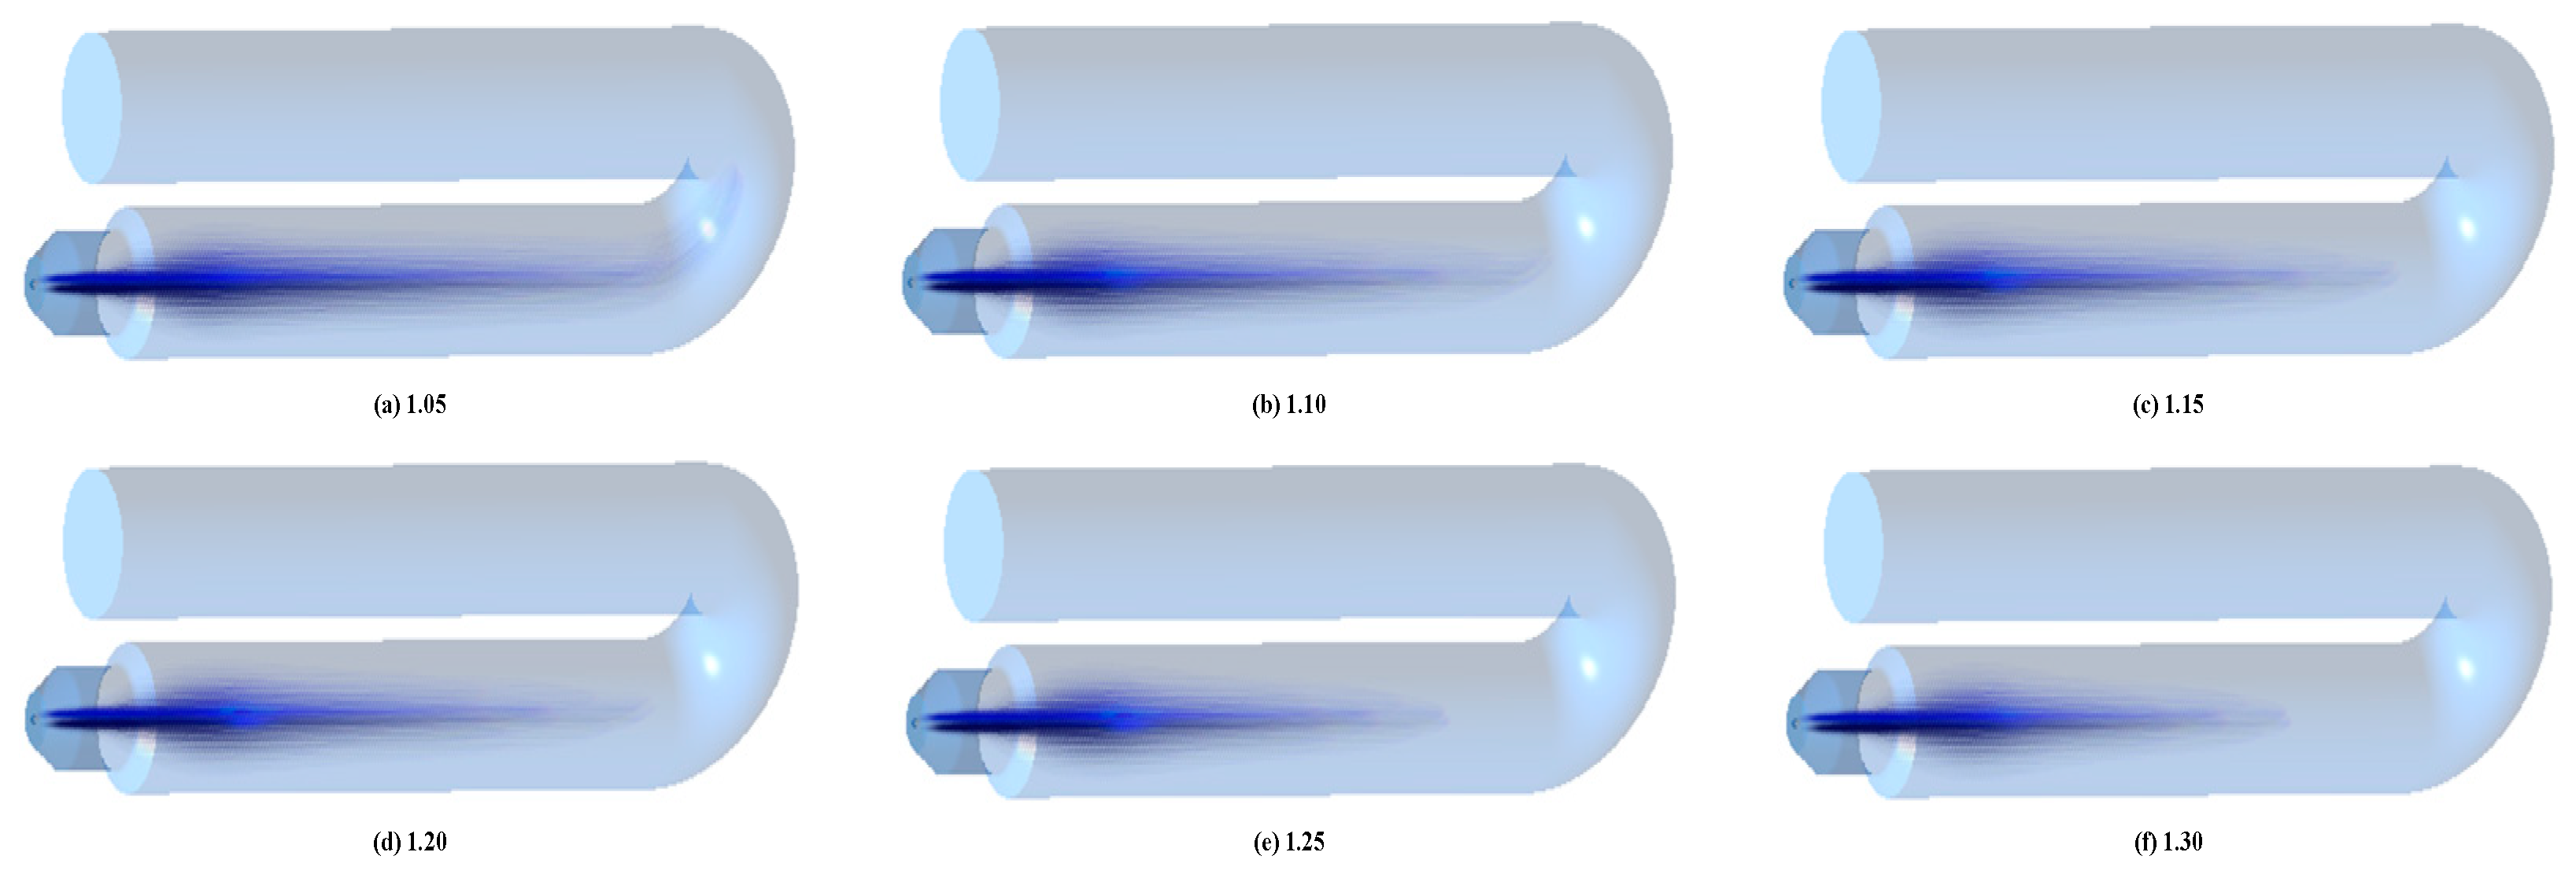
Figure 24 shows the cloud image of CH4 diffusion combustion concentration in the fire tube under different air dosages. The overall law of the five different fuel consumption is basically the same. CH4 burns as it diffuses in the fire tube, spreading almost throughout the fire tube. When the amount of air is low, CH4 diffuses to the tail of the fire tube, and the fuel cannot be completely burned due to the low temperature of the tail of the fire tube, resulting in fuel waste. When the amount of air increases, the area of methane diffusion in the fire tube becomes shorter, indicating that the greater the amount of air, the more intense the diffusion combustion, and the methane can be burned in a large amount in a short distance.
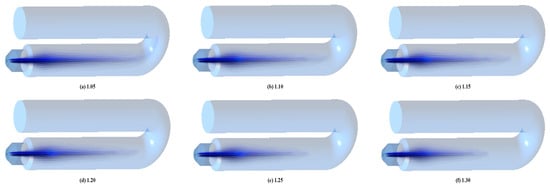
Figure 24.
CH4 concentration distribution in fire tube under different air dosages.
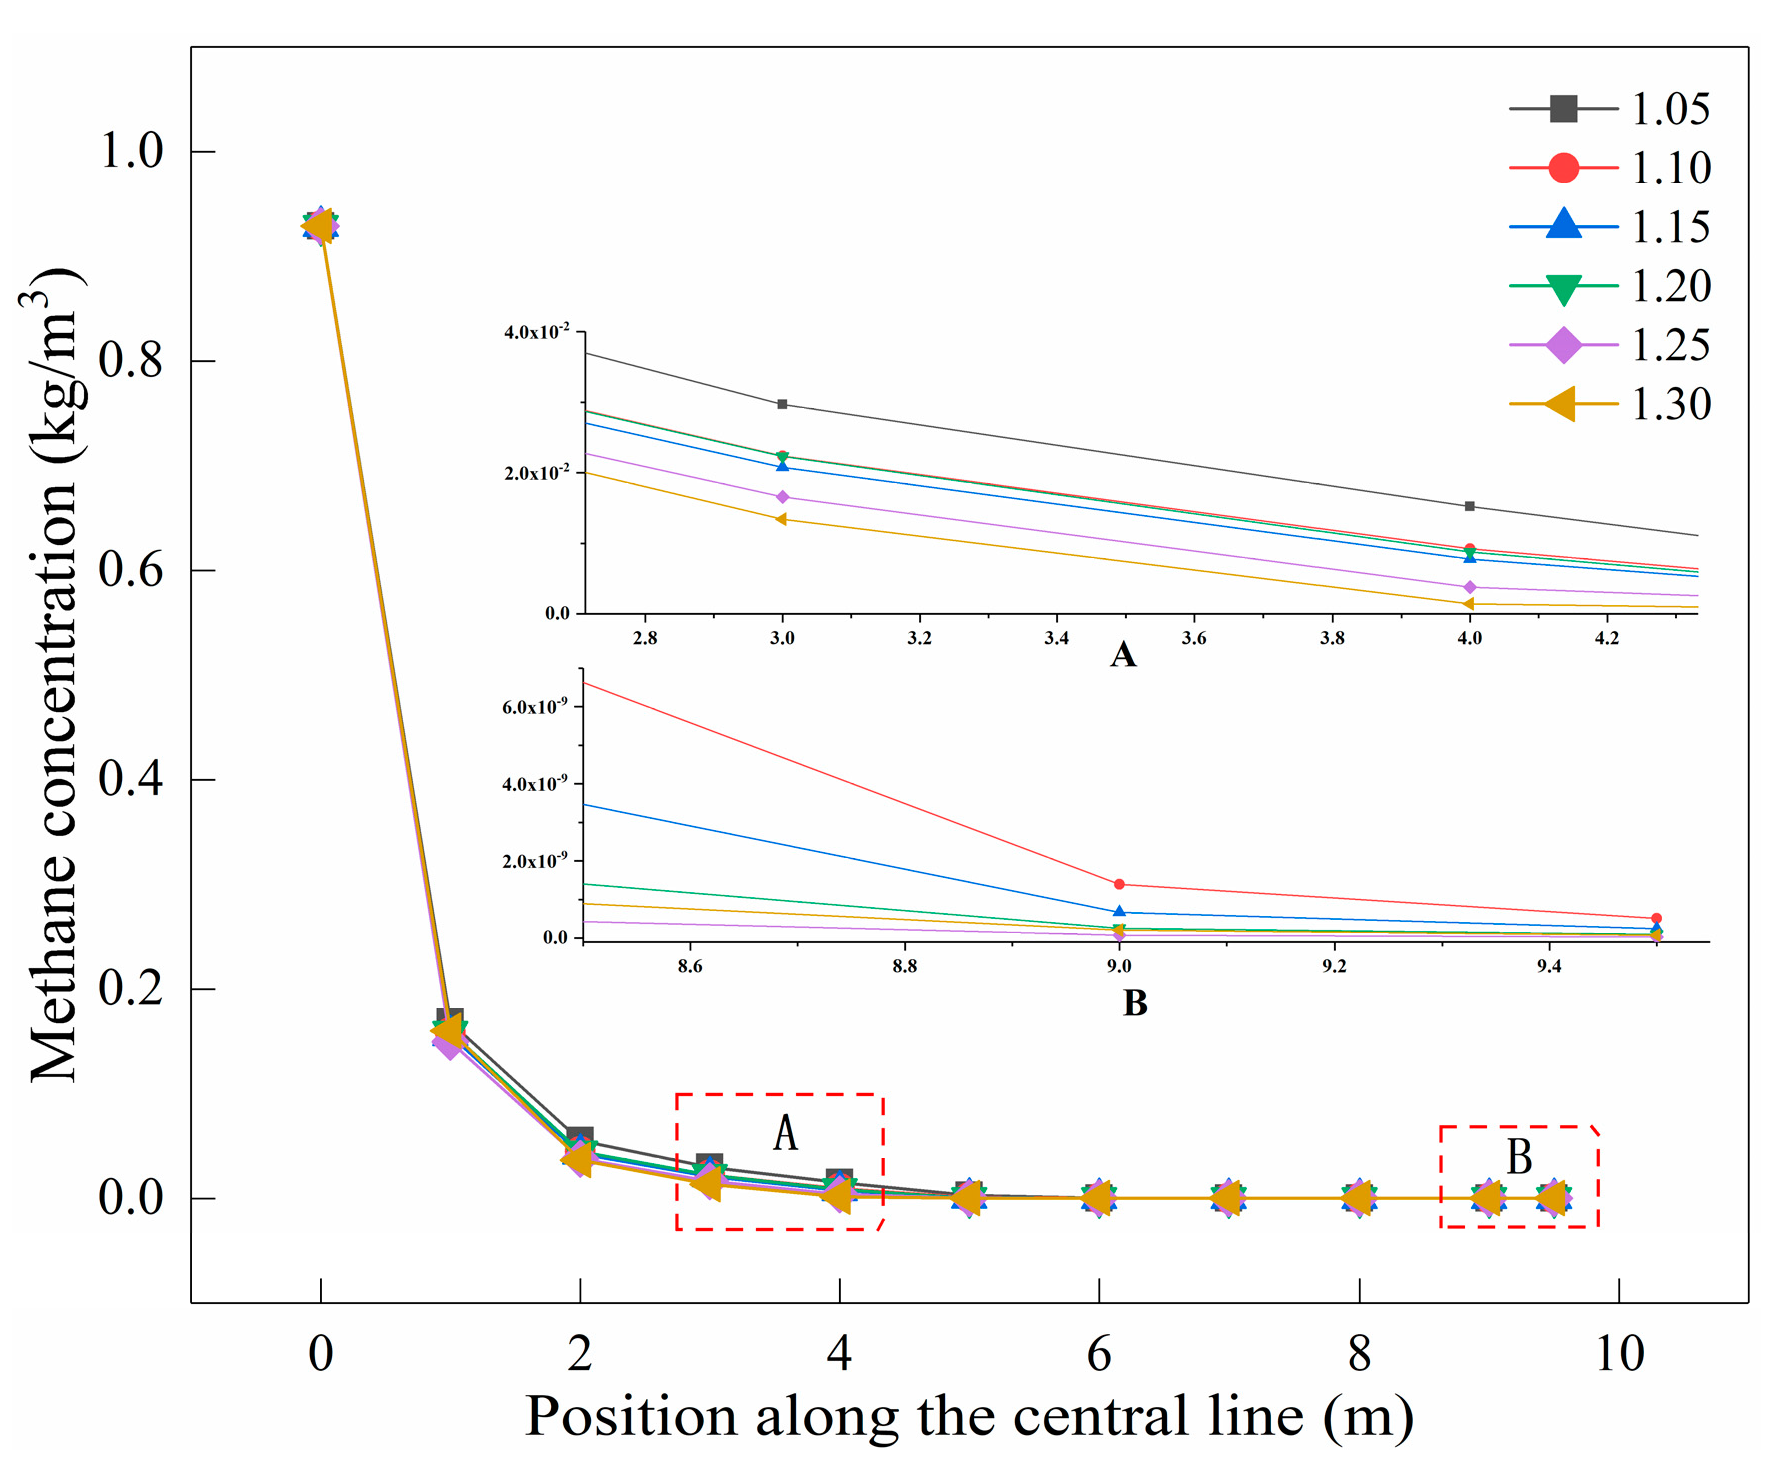
Figure 25 shows the variation trend of fuel combustion concentration on the center line of the fire tube under different air dosages. Part A of the figure shows the change in fuel concentration in the low-oxygen-combustion section. It can be seen that when the air coefficient is 1.3, the fuel concentration is the lowest in the low-oxygen combustion section. Under the same fuel, the air coefficient of 1.15 is lower than 1.2 in the low-oxygen-combustion zone, and the combustion effect is better. Part B of the figure shows the change in fuel concentration at the tail of the smoke tube. It can be seen that when the air coefficient is 1.25, the fuel combustion in the fire tube is the highest and the fuel utilization rate is also the highest.
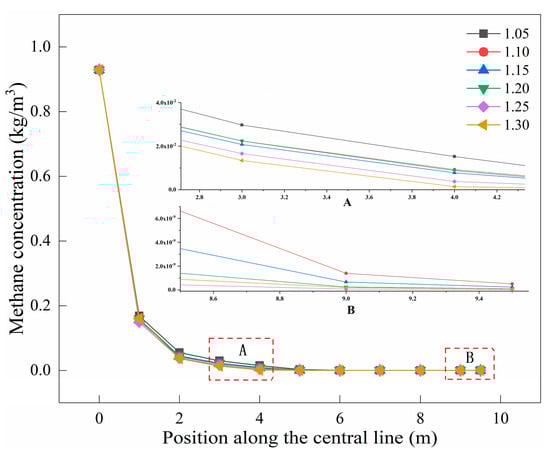
Figure 25.
Variation on the center line of CH4 concentration in the fire tube under different air dosages.
Combined with the analysis of the temperature field, velocity field, and CH4 and O2 concentration field in the fire tube, it is found that when the amount of air is 1.25, the combustion temperature in the fire tube is the highest at 2331.5 K, the diffusion combustion effect is the best, and the combustion distance in the fire tube is relatively short. However, when the amount of air is 1.15, the average temperature of the wall surface of the tube is relatively higher than 1603.5 K, and the heat transfer effect is the best.
4. Conclusions
- The fuel dosage can improve the heating efficiency of the fire tube heating furnace. The fuel consumption was set at 110 m3/h, 130 m3/h, 150 m3/h, 170 m3/h, and 190 m3/h for the simulation and comparative analysis. It was found that when the fuel dosage is 170 m3/h, the fuel combustion in the fire tube is the most intense, the fuel combustion temperature is the highest, and the average temperature of the inner wall of the fire tube is the highest under the fuel dosages, so the thermal efficiency is the highest when the fuel dosage is 170 m3/h.
- The air dosage can increase the fuel diffusion combustion speed and significantly improve the heating efficiency. In this paper, the air dosage is represented by the excess air coefficient, which adopts values of 1.05, 1.10, 1.15, 1.20, 1.25, and 1.30 for the simulation and comparative analysis. It is found that when the excess air coefficient is 1.25, the flame temperature in the fire tube is the highest, and the fuel combustion is the most intense. However, when the excess air coefficient is 1.25, the inner wall temperature of the fire tube is low, and the heat transfer effect is not good. When the air coefficient is 1.15, the inner wall temperature of the fire tube is the highest and the heat transfer effect is the best, so the air coefficient is 1.15 and the heat efficiency is the highest.
- In terms of improving thermal efficiency, this paper gives priority to optimizing operation parameters. A simulation analysis is carried out based on the actual operation parameters of an on-site heating furnace, and it is optimized that when the fuel consumption is 170 m3/h, the air consumption is based on the theoretical value of combustion, and the air excess coefficient is 1.15, the comparison is made with the actual operation parameters of the original site. The diffusion combustion speed is 2.25 m/s faster, the average temperature of the inner wall of the fire tube is 12 K higher, the heat transfer effect is the best, and the maximum combustion temperature in the fire tube is reduced by 11 K, reducing the risk of high temperature.
Author Contributions
Basic data by Y.T.; analytical form by J.W.; numerical simulation experiments and article written by M.L.; validation by C.L. All authors have read and agreed to the published version of the manuscript.
Funding
This work was funded by the Natural Science Foundation Projects of Chongqing City (No. cstc2021jcyj-msxmX0978).
Data Availability Statement
Data are contained within the article.
Conflicts of Interest
The authors declare no conflicts of interest.
References
- Patankar, S.V.; Spalding, D.B. A calculation procedure for heat, mass and momentum transfer in three-dimensional parabolic flows. Int. Heat Mass Transf. 1972, 15, 1787–1806. [Google Scholar] [CrossRef]
- Paul, A.; Deka, R.K. Unsteady natural convection flow past an infinite cylinder with thermal and mass stratification. Int. J. Eng. Math. 2017, 2017, 8410691. [Google Scholar] [CrossRef]
- Luo, X.; Wang, Z.; Deng, W. Optimization Model Design for Temperature Curve of Reflow Furnace. J. Phys.: Conf. Ser. 2021, 1802, 022020. [Google Scholar] [CrossRef]
- Xing, P.; Xiaogang, M. Analysis of flow and heat transfer characteristics of blast furnace heating gas. Ironmak. Steelmak. 2022, 49, 429–439. [Google Scholar]
- Qiaozhen, L. Multi-Field Coupling Mechanics Analysis of Furnace Tube for Heating Furnace. Ph.D. Thesis, Northeast Petroleum University, Daqing, China, 2011. [Google Scholar]
- Liu, J.; Zhu, Y.; Zhou, H. Numerical simulation study on combustion characteristics and NOx emission of COREX gas swirl burner and boiler. Fuel 2023, 352, 129128. [Google Scholar] [CrossRef]
- Yang, J.; Zhang, C.; Yang, L.; Dai, S. Numerical simulation of coil heat transfer. Sci. Technol. Eng. 2011, 31, 7793–7796. [Google Scholar]
- Xuehu, L. Simulation study on combustion Heat Transfer Characteristics of water jacket Furnace. Pet. Chem. Equip. 2013, 16, 27–29. [Google Scholar]
- Zhang, X.; Yang, J. Discussion on Influencing Factors of heat loss in tubular heating furnace. Qilu Petrochem. Ind. 2015, 43, 317–320. [Google Scholar]
- Mengjiao, C. Numerical Simulation of Combustion and Heat Transfer in Tubular Heating Furnace. Ph.D. Thesis, Dalian University of Technology, Dalian, China, 2015. [Google Scholar]
- Huang, Y.; Bao, X.; Duan, L. Experimental and numerical investigation on heat transfer of supercritical CO2 in a horizontal U-tube under thermal boundary of immersed tube. Int. Commun. Heat Mass Transf. 2022, 138, 106364. [Google Scholar] [CrossRef]
- Xiao, Y. Experimental Study on Heat Load Distribution in Fire Cylinder Furnace. Ph.D. Thesis, Beijing University of Chemical Technology, Beijing, China, 2016. [Google Scholar]
- Tang, Z.; Zheng, W.; Hu, X.; Yang, X.; Li, W. Efficient operation analysis of water-jacket furnace in Shengli Oilfield Joint Station. Energy Conserv. Pet. Petrochem. Ind. 2017, 7, 15–17. [Google Scholar]
- Li, S.; Wang, Y. Transient simulation and minimum commutation time of high temperature air combustion in oil field water jacket furnace. J. East China Univ. Sci. Technol. (Nat. Sci. Ed.) 2019, 1, 1–12. [Google Scholar]
- Yuan, T.; Wang, C.; Feng, Q.; Sun, Y.; Fan, G.; Chen, M.; Che, D. Computational fluid dynamics simulation on oxy-fuel combustion performance of a multiple-burner furnace firing coking dry gas. Appl. Therm. Eng. 2024, 252, 123728. [Google Scholar] [CrossRef]
- Yao, G.; Han, X.; Tang, H.; Qu, J. Numerical and Experimental Study on Preheating Burner Characteristics for Peak Shaving. Processes 2024, 12, 346. [Google Scholar] [CrossRef]
- García, A.M.; López, Y.; Amell, A.A. Numerical analysis of oxygen enrichment in a self-recuperative radiant-tube burner. Int. J. Heat Mass Transf. 2024, 223, 125154. [Google Scholar] [CrossRef]
- Huang, M.; Li, R.; Xu, J.; Cheng, S.; Deng, H.; Zhang, B.; Rong, Z.; Li, Y. Effect of thermal input, excess air coefficient and combustion mode on natural gas MILD combustion in industrial-scale furnace. Fuel 2021, 302, 121179. [Google Scholar] [CrossRef]
- Lu, J.; Yang, S.; Wang, H. Investigation of the oxygen-methane combustion and heating characteristics in industrial-scale copper anode refining furnace. Energy 2024, 298, 131278. [Google Scholar] [CrossRef]
- Dong, L.; Huang, S.; Qian, B.; Wang, K.; Gao, N.; Lin, X.; Shi, Z.; Lu, H. Numerical Simulation of Hydrogen–Coal Blending Combustion in a 660 MW Tangential Boiler. Processes 2024, 12, 415. [Google Scholar] [CrossRef]
- Kim, N.; Guahk, Y.T.; Ko, C.-B. Numerical simulation of an industrial radiant tube burner using OpenFOAM. Fuel Commun. 2024, 19, 100119. [Google Scholar] [CrossRef]
- Knoll, M.; Gerhardter, H.; Hochenauer, C.; Tomazic, P. Influences of turbulence modeling on particle-wall contacts in numerical simulations of industrial furnaces for thermal particle treatment. Powder Technol. 2020, 373, 497–509. [Google Scholar] [CrossRef]
- Kiedrzyńska, A.; Lewtak, R.; Świątkowski, B.; Jóźwiak, P.; Hercog, J.; Badyda, K. Numerical study of natural gas and low-calorific syngas co-firing in a pilot scale burner. Energy 2020, 211, 118552. [Google Scholar] [CrossRef]


Disclaimer/Publisher’s Note: The statements, opinions and data contained in all publications are solely those of the individual author(s) and contributor(s) and not of MDPI and/or the editor(s). MDPI and/or the editor(s) disclaim responsibility for any injury to people or property resulting from any ideas, methods, instructions or products referred to in the content. |
© 2025 by the authors. Licensee MDPI, Basel, Switzerland. This article is an open access article distributed under the terms and conditions of the Creative Commons Attribution (CC BY) license (https://creativecommons.org/licenses/by/4.0/).