Article

A Numerical Study on the Flow Field and Classification Performance of an Industrial-Scale Micron Air Classifier under Various Outlet Mass Airflow Rates

1
Faculty of Vehicle and Energy Engineering, Phenikaa University, Yen Nghia, Ha Dong, Hanoi 12116, Vietnam
2
Vietnam Institute of Agricultural Engineering and Post-Harvest Technology, No. 60 Trung Kinh, Trung Hoa, Cau Giay, Hanoi 11350, Vietnam
3
Advanced Technology Joint Stock Company, No. 32, Plot B, Lot 11, Dinh Cong, Hoang Mai District, Hanoi 11717, Vietnam
*
Author to whom correspondence should be addressed.
Processes 2024, 12(9), 2035; https://doi.org/10.3390/pr12092035
Submission received: 30 August 2024 / Revised: 13 September 2024 / Accepted: 19 September 2024 / Published: 21 September 2024
(This article belongs to the Section Separation Processes)

Abstract

:
In this study, the gas−particle flow field in a real-size industrial-scale micron air classifier manufactured by Phenikaa Group using 3D transient simulations with the FWC-RSM–DPM (Four-Way Coupling-Reynold Stress Model-Discrete Phase Model) in ANSYS Fluent 2022 R2 and with the assistance of High-Performance Computing (HPC) systems is explored. A comparison among three coupling models is carried out, highlighting the significant influence of the interactions between solid and gas phases on the flow field. The complex two-phase flow, characterized by the formation of multiple vortices with different sizes, positions, and rotation directions, is successfully captured on the real-size model of the classifier. Additionally, analyzing the effects of the vortices on the flow field provides a comprehensive understanding of the gas–solid flow field and the classification mechanism. The effect of the outlet mass airflow rate is also investigated. The classifier’s Key Performance Indicators (KPIs: d50, K, η, ΔP) and the constrained condition of the particle size distribution curve of the final product are used to evaluate the classification efficiency. The contributions of this work are as follows: (i) a simulation analysis of a real-size industrial-scale classifier is conducted that highlights its advantages over a lab-scale one; (ii) a comparison is conducted among three coupling models, showing the advancement of four-way coupling in providing accurate results for simulations of interactions between the gas phase and particles; and (iii) the particle size distribution curve performances of a classified product under different simulation models and outlet airflow rates are addressed, from which optimal parameters can be selected in the design and operation processes to achieve the required efficiency of an air classifier.

1. Introduction

Powder is currently extensively utilized in various industries, including construction materials, the chemical sector, medicine, and artificial stone production. A crucial component of the powder preparation process is the technology used for powder classification [1]. There are many different classification principles [2], such as gravitational, centrifugal, dry, and wet classification. Currently, air classifiers are widely used in powder material production. An air classifier is an important factor in the powder-producing industry that determines the material sizes used. The selection of the type of air classifier depends on the requirements of the classification products, as well as technological and economic factors. For example, a simple air classifier-cyclone has some advantages, such as simple operation, low investment and operating costs, and effectiveness in classifying coarse particles. Unlike cyclones, rotor-type classifiers provide good classification efficiency and can classify products with high fineness. They have a wide range of capacities and can adjust the operating parameters to control the product’s fineness. It is possible that commercially available air classifiers may not entirely meet practical requirements. To improve classification performance and address specific industrial problems, a variety of air classifiers have been developed. Powder production efficiency is directly affected by the performance of the classifier. Therefore, many projects have been carried out through extensive theoretical research, including other aspects of air classifiers. These efforts have yielded significant findings that form the foundation for optimizing classifiers.
Along with the development of computer science, numerical research has made significant progress. To predict the performance of devices (e.g., pumps) using a dataset of device parameters, Ref. [3] proposed a prediction method called KAN (the Kolmogorov-Arnold Network). Large language models (LLMs) are assessed as potential solutions to enhance the interaction between humans and machines (e.g., robots) [4]. To date, many researchers have applied numerical simulation methods to study the flow field characteristics of classifiers. Regarding computational fluid dynamics (CFD), a turbulence model named standard k-ε was found to be inadequate for highly swirling flows, as it resulted in excessively high turbulence viscosities and unrealistic tangential velocity profiles [5]. Both the RNG k-ε model and the Reynolds Stress Model (RSM) were proposed for turbulent modeling, but the RSM has superior accuracy when simulating the flow field within an abruptly changing classification zone [1]. Investigating the RSM and standard k-ε and RNG k-ε models [6,7] revealed that the results predicted using the RSM are in greater concordance with experimental data. The RSM has been demonstrated to be the most accurate model for high swirling flows [8,9,10,11,12] and anisotropic turbulence [13] in air classifiers. However, the RSM is more expensive and time-consuming than the standard k-ε and RNG k-ε models because convergence is very difficult to achieve. A combination of the DEM (Discrete Element Method) and CFD has recently been proven to be effective in simulating various solid-gas two-phase flow systems [14,15,16,17,18,19,20,
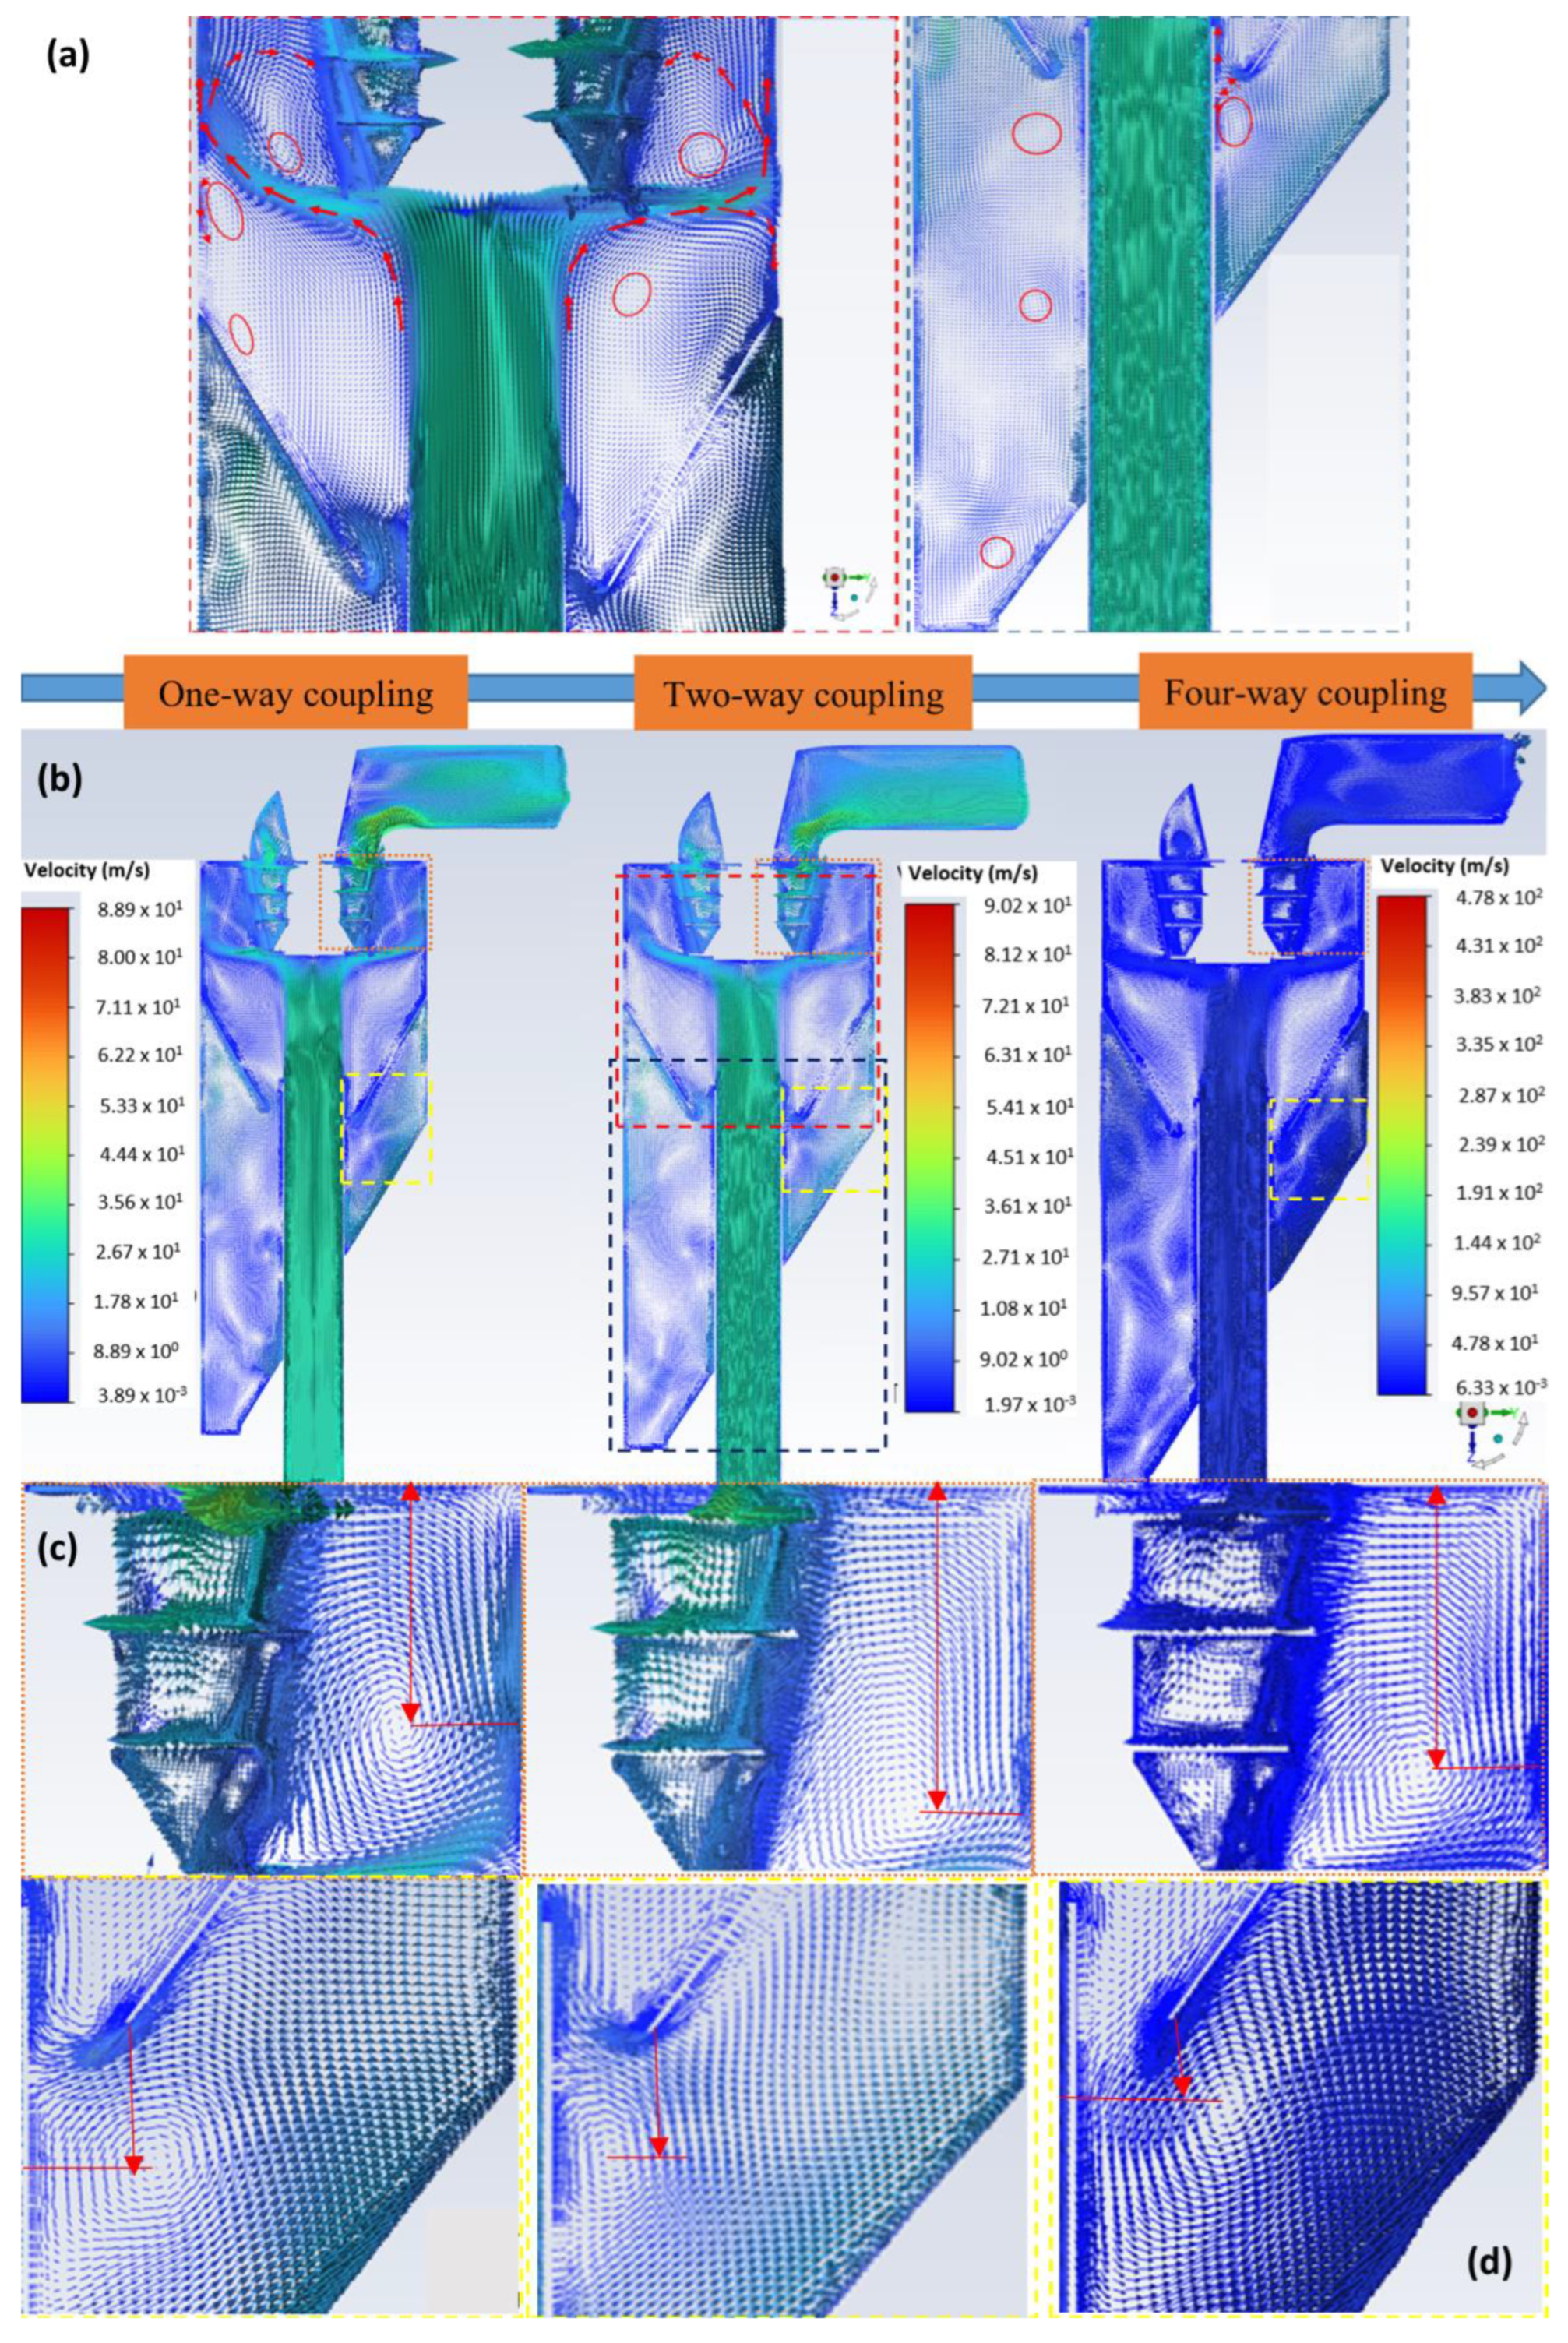
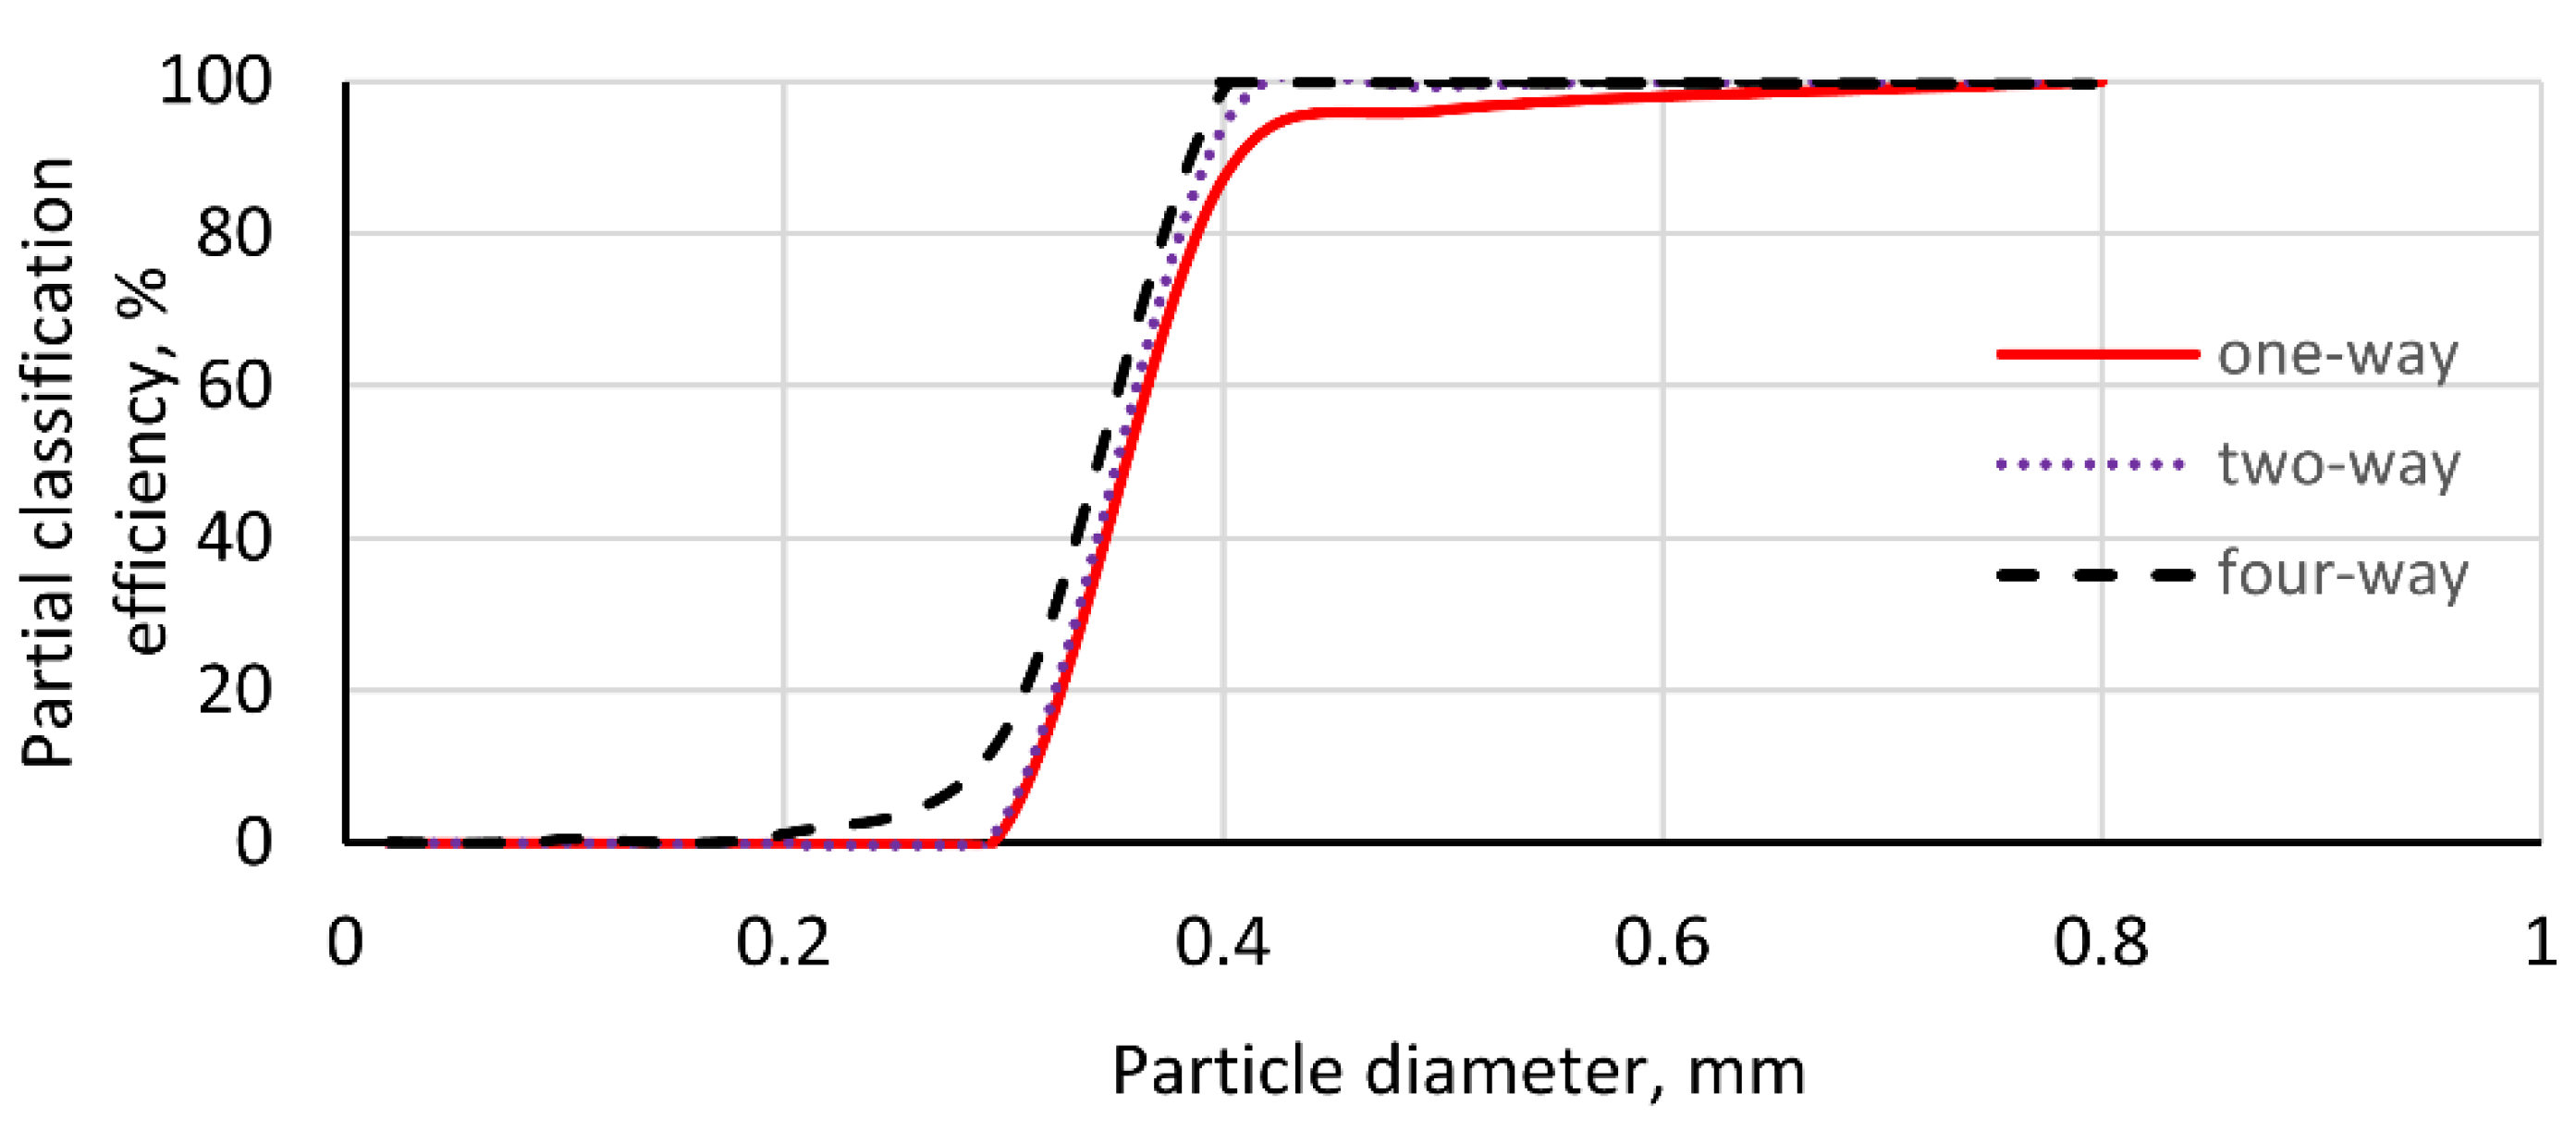
21]. The interactions between the solid and gas phases are considered under three coupling regimes: one-way coupling (ignoring the reactions of solids to gas flow), two-way coupling (considering the reactions of solids to gas flow), and four-way coupling (considering both particle interactions and their impact on the continuous phase) [22]. Many researchers have attempted to extend the CFDDEM approach to study complex particle–fluid flow systems [23,24,25,26,27,28,29,30]. Derksen et al. [31] proposed a modified LPT model and revealed that the presence of a solid phase causes the cyclone to lose swirl intensity and strongly damps the turbulence of the gas flow. Modeling particle–particle interaction is important. To date, only a few studies have considered these interactions. Most of them were carried out for simple models like cyclones [32,33,34,35] or to study the influences of the fish-hook effect [7]. The fish-hook effect is only represented when particle–particle interaction is considered [36]. For large classifiers, many problems arise when using models of industrial-scale air classifiers in numerical research, such as the significant amount of computing resources, time needed, and scale effects (the variations in the properties and physical behavior of a phenomenon across different geometric scales that potentially lead to inaccuracy by underpredicting critical parameters in small-scale models) [37]. Thus, lab-scale classifiers are often chosen for numerical and experimental investigations [1,34]. In addition, simulations using a four-way coupling model are comparatively costly in terms of time; thus, the effects of the solid phase on the continuous phase and their interactions are often overlooked [38,39,40,41,42,43,44,45]. Therefore, the impact of the particles on the gas phase and their interactions cannot be satisfactorily characterized, resulting in an inadequate representation of the physical nature of the flow. The internal flow field of an air classifier is complex, consisting of a highly turbulent three-dimensional swirling flow. This leads to dynamic instability of the flow parameters, as demonstrated by a number of laboratory experiments and numerical simulations [46].
Jia et al. [1] performed three-dimensional steady simulations using a one-way coupled CFD–DEM model as a laboratory-scale classifier. The inverted cone-type rotor with diameter ratios of 1:0.8 and 1:0.7 was verified as the most effective structure for rotors in bottom-feed classifiers. The conical rotor significantly enhanced the flow field distribution in the classification region [47]. In this work, the particle–particle interaction and the effect of the solid phase on the gas phase were ignored. Similarly, Yu et al. [48] used a lab-scale turbo air classifier model to study the influence of the rotor radius on the airflow field inside the separator. The tangential and radial velocities greatly fluctuated when the rotor radius was either too large or too small. Zeng et al. [42] optimized the rotational speed of the turbo air classifier’s rotor to produce ultrafine powder via three-dimensional steady simulation results with the one-way coupling model. As the airflow rate increased, the yield of the coarse product decreased, while the yield of the fine product increased [49]. The annular area is the primary focus of the classification process. If the material particles are not promptly separated, they concentrate heavily in the annular region. This leads to more frequent particle collisions, reducing the separation efficiency and accuracy [50]. Numerous researchers have recognized the significance of conducting in-depth studies on the evaluation metrics for separation performance. It was also found that the classification process is characterized by the classification sharpness index and performance [42], which are influenced by factors such as the rotor cage’s rotational speed and the air velocity entering the classifier.
A review of the literature reveals a lack of studies on the analysis of the outlet mass flow rate’s impact on the flow dynamics and separation performance of micron air classifiers for quartz powder. Additionally, the particle size distribution of the powder material plays a crucial role in achieving a product with the required quality in quartz-based engineered stone production. Therefore, evaluating the performance of quartz powder classification solely based on conventional indexes such as d50 (cut size), K (classification sharpness index), and the change in pressure (ΔP) is insufficient. The cut size is essentially the point of separation between fine and coarse particles in a classification process, while K indicates how well the classifier can distinguish between particles just below and just above d50. Therefore, the particle size distribution curve of the powder material is considered a constrained condition when evaluating the separation performance efficiency.
In this study, we explore the gas–particle flow field in a real-size industrial-scale micron air classifier manufactured by Phenikaa Group [51] using 3D transient simulations with the FWC-RSM–DPM (Four-Way Coupling-Reynold Stress Model-Discrete Phase Model) in ANSYS Fluent 2022 R2 with the assistance of High-Performance Computing (HPC) systems. A comparison of the three coupling models highlights the significant influence of the interactions between the solid and gas phases on the flow field. The complex two-phase flow, characterized by the formation of multiple vortices with different sizes, positions, and rotation directions, is successfully captured on the real-size model of the classifier. Additionally, analyzing the vortices’ effects on the flow field provides a comprehensive understanding of the gas–solid flow field and the classification mechanism. The effect of the outlet mass airflow rate is also investigated. The classifier’s Key Performance Indicators (KPIs: d50, K, η, ΔP) and the condition of the final product’s particle size distribution curve are used to evaluate the classification efficiency. Newton’s efficiency (η), which quantitatively indicates the degree of classification, is employed to measure classification effectiveness. Therefore, the objectives of this study are as follows: (i) to conduct a simulation analysis of the flow field inside a real-size industrial-scale classifier to highlight its advantages over a lab-scale one; (ii) to conduct a comparison among three coupling models, showing the advancement of four-way coupling in providing accurate results for simulations of interactions between the gas phase and particles; and (iii) to address the particle size distribution curve performances under different simulation models and outlet airflow rates, from which the optimal parameters could be selected in the design and operation processes to achieve the required efficiency of an air classifier.

2. Equipment Description

Geometry modeling of the industrial-scale classifier for the computational region was conducted using Ansys 2022 R2 (Advanced Technology Joint Stock Company, Hanoi, Vietnam). Figure 1 illustrates the primary components of the classifier.
The materials are fed into the classifier through the primary air stream at the bottom air inlet. The air–particle mixture continues moving upwards in the coarse material cone to the intermediate bin. The airflow velocity decreases because of the abrupt increase in the cross-sectional area of the classification chamber. The particle–gas flow collides with the impact plate, causing some of the coarse particles to deposit over the guide cone due to collisions. The remaining materials are carried into the separation compartment by the airflow. The rotation of the rotor generates a centrifugal field for particle classification. When the particles collide with the chamber wall, rotor blades, and adjacent particles, they gradually lose their kinetic energy and fall. The fine products are drawn inward through the rotor blades along with the airflow. The fine products are extracted according to the cut size set on the classifier and conveyed with the airflow to the fine outlet. The fine products are separated from the classifying air by a filtration device. To ensure that there are no remaining fine particles, the coarse materials undergo thorough air rinsing before being discharged. The required air enters the classifier through the secondary air inlet. The coarse material is discharged through the coarse material discharge.

3. Calculation Methodology

3.1. Model Establishment and Mesh Generation

The geometric dimensions of the primary components are presented in Figure 2. The coordinate origin is defined as the center of the top surface of the classification chamber. One of the most important parts of the classifier is the rotor cage, which consists of 24 non-radial blades (610 × 106 × 10 mm) coated with a 2 mm alumina layer, uniformly positioned around the circumference. The impact plate has a diameter of 790 mm and a thickness of 20 mm. The guide cone has a diameter of 1643 mm at the top and 697 mm at the bottom. In this study, the ANSYS Fluent 2022 R2 software is used to mesh the model. The entire computational domain is divided by poly-hexcore grids. To study the effect of grid resolution on the results, four grid sizes (5.767, 6.906, 7.133, and 8.128 million cells) are tested under identical conditions, with changes in the average static pressure measured between the inlet and the outlet. The results are shown in Table 1. Factory data were obtained from the industrial equipment at the Vicostone Plant, Phenikaa Group. The simulation results show that there is no significant difference in the pressure drop when the grid resolution is changed. Accordingly, the 6.906 million mesh model is adopted for the following simulations to save computation time while still yielding reasonable accuracy. For the RSM, when the residuals decrease to below 1 × 10⁻⁴, the solution is considered to have converged. A time step of 1 × 10⁻⁴ is set for the simulation.

3.2. Mathematical Model

3.2.1. Turbulent Model

The fluid flow is addressed using a locally averaged approximation of the continuity and Navier–Stokes equations. The equations for the conservation of mass and momentum in the gas phase are as follows [52,53]:
( ρ f ε ) t + . ( ρ f ε u ) = 0
( ρ f ε u ) t + . ( ρ f ε u u ) = ε p + . ( ε τ f ) + . ( ρ f u u ¯ ) + ε ρ f g S
where the index f represents the fluid; ε, u, u′, t, ρf, p, τf, and g are the volume fraction locally occupied by the fluid, average and fluctuating fluid velocities, time, fluid density, pressure, fluid viscous stress tensor, and gravitational acceleration, respectively. S is another source term. ρ f u u ¯ is the Reynolds stress term caused by turbulence, which is addressed using the RSM. This work considers the modifications of turbulence caused by the presence of particles. Details of the RSM turbulence model are shown in [52,53].
T ( ρ u i u j ) + C i j = D i j + D L , i j + P i j + G i j + ϕ i j + ε i j + F i j + S u s e r
where the first term on the left side represents the local time derivative of the Reynolds stress tensor; Cij, Dij, DL,ij, Pij, Gij, ϕij, εij, Fij, and Suser are, respectively, the convection, turbulent diffusion, molecular diffusion, stress generation term, buoyancy production term, pressure strain term, dissipation, generation through system rotation, and other source term. In this study, Cij, DL,ij, Gij, and Fij are neglected for incompressible flow. The RSM requires the following empirical constants [52,53]: a Prandtl number (δk) of 0.82, TKE Prandtl number (δk) of 1.0, TDR Prandtl number (δε) of 1.3, Cµ = 0.09, C1 = 1.8, C2 = 0.6, C1′ = 0.5, C2′ = 0.3, δε = 1.0, Cε1 = 1.44, and Cε2 = 1.92.

3.2.2. Discrete Phase Model

In this work, the solid phase is considered a discrete phase, with the particles being tracked individually according to Newton’s second law of motion. The motion of the i-th particle is expressed as follows [52,53]:
m i d v i d t = f p f , i + j = 1 k i ( f c , i j + f d , i j ) + m i g
where mi and vi are the i-th particle’s mass and velocity, respectively. The forces acting on the solids are the gas–solid interaction force, fp-f, i, and the interparticle forces between particles i and j, which include the contact forces, fc,ij, and viscous damping forces, fd,ij. The interparticle forces are summed over the ki particles in contact with particle i. The gravitational force is mig.

3.3. Simulation Condition

In this study, a four-way coupled CFD–DEM model in ANSYS Fluent 2022 R2 is utilized to simulate the transient air–particle two-phase flow in the micron air classifier. We also use one-way, two-way, and four-way coupling schemes to demonstrate the efficiency of the various CFD–DEM coupling models on the computational results. The turbulence model chosen is the RSM. For the flow, pressure is coupled with velocity using the SIMPLEC algorithm, while convective diffusion is addressed using the QUICK difference scheme. No-slip boundary conditions are applied to the wall boundaries. The near-wall surface is handled using standard wall functions. The air velocity at the inlet is assumed to be uniform. In industrial applications, the coarse powder outlet is often locked by the valve; therefore, it is treated as a “wall.” The material particles are injected with gas from the inlet. The particle interactions and influence of the solid phase on the continuous phase are considered. For simplicity, the material particles are assumed to be spherical. The micron air classifier works under conditions of negative pressure and low velocity. Consequently, the airflow is regarded as incompressible. The computational parameters are listed in Table 2 and Table 3.

3.4. Validating the Model and Solver

To validate the model and solver and assess the mesh generation and boundary condition assignment, simulations using the current solver are conducted for the same model using the simulation conditions and one-way coupling method reported in Ref. [50]. The pressure drop is used as the major parameter for validation. The current simulation results and those reported in Ref. [50] show a minor difference in the pressure drop (i.e., 0.202% for pure airflow and 0.936% for two-phase air–solid flow). Table 4 shows the pressure drops predicted in this work and in Ref. [50].

4. Simulation Results and Discussion

4.1. Particle–Gas Flow Fields with Different Coupled CFD–DEM Models

To select the optimal coupled CFD–DEM model, one-way coupling (ignoring the reaction of solids on the gas flow), two-way coupling (considering the reaction of solids on the gas flow), and four-way coupling (considering both particle interactions and their impact on the continuous phase) are investigated. Several criteria are typically considered, mainly focusing on the trade-offs between computational cost and accuracy. By evaluating these criteria, we have simultaneously investigated three different coupled models. With the assistance of High-Performance Computing (HPC) systems, in this study, we could have successfully captured the complex two-phase flow field characterized by the formation of multiple vortices inside the industrial-scale micron air classifier using a four-way coupling. The conditions are a mass airflow rate of 6.125 kg/s at the outlet, a rotor speed of 240 rpm, and a feed flow rate of 1.574 kg/s.

4.1.1. Fluid Flow with Different Coupled CFD-DEM Models

To date, it is still particularly challenging to accurately capture the complex flow as a complex two-phase gas–solid flow inside classifiers in experimental studies and numerical simulations on scaled-down models. Building a scaled-down model that accurately replicates a real-size model is a highly complex task, in which it is essential to identify the rules of similarity and establish an appropriate set of parameters. These parameters must ensure not only geometric similarity but also kinematic and dynamic similarity, which is significantly challenging for researchers. In fact, utilizing a real-size model of classifiers for numerical studies will allow for more accurate and real characteristics of the flow field to be captured, even though the computational amount is large and there are numerous risks during the calculation process.
The RSM has been demonstrated as the most accurate approach for modeling high swirling flows [8,9,10,11,12] and anisotropic turbulence [13] in air classifiers. However, the RSM is very computationally expensive and time-consuming because convergence is very difficult to achieve. Numerous challenges arise in numerical research, especially when simulating a real-size model of large air classifiers with FWC-RSM-DPM (Four-Way Coupling RSM-DPM) model. With the assistance of High-Performance Computing (HPC) systems in this study, the computational challenges of simulating the industrial-scale classifier are effectively and accurately addressed. The turbulent model, specifically the RSM, has successfully captured the complex two-phase flow field characterized by the formation of multiple vortices inside the industrial-scale micron air classifier, which has not been reported to date. The inner airflow structures in the vertical central plane of the classifier are shown in Figure 3a. In the classification chamber, part of the airflow is initially directed toward the wall after passing through the impact plate (shown in Figure 1), and then the flow moves upward along the wall. After being blocked by the upper surface of the classification chamber, it turns to enter the rotor. Most of the airflow enters the rotor diagonally. Additionally, a large vortex emerges near the lower section of the rotor. The remaining part of the airflow changes its direction after passing through the impact plate and moves downward, which helps carry the coarse powder into the coarse material cone. There are many vortices with different intensities, positions, sizes, and rotation directions in this region. Analyzing the vortices’ effects on the flow field provides a comprehensive understanding of the gas–solid flow field and the classification mechanism. For instance, the large vortex in the classification chamber obstructs the entrance of the airflow to the rotor cage and diminishes the effective separation height of the rotor, which is detrimental to the classification efficiency. The vortices in different components of the classifier clearly directly impact the material particle flow. The vortices in the coarse material cone maintain the material particles in this region for a longer period, which allows fine particles to continue separating from coarse particles.
A comparison of the simulated flow field distributions under one-way coupling, two-way coupling, and four-way coupling reveals significant differences in terms of the number, size, position, intensity, and rotation direction of the vortices, as illustrated in Figure 3b–d. Notably, a large vortex was formed in the classification chamber under two-way coupling at the lowest position, whereas the same was positioned at the highest point under one-way coupling (as shown in Figure 3c). Clearly, the lower the position of this vortex, the more favorable it is for the material particle separation process, as the gas–particle flow enters the rotor cage more smoothly. In a coarse material cone, one of the crucial components of the classifier that is characteristic of vortices is different under the different couplings mentioned above. For example, the vortices that appear just below the recirculation slot (shown in Figure 3d) differ significantly in terms of position, size, and shape. Under two-way coupling, the vortex forms closer to the outer wall of the feed tube compared to the two remaining cases, creating space for the airflow to more easily return upward into the guide cone. These differences directly impact the particle flow and the secondary separation capability of the coarse material cone.
On the real-size industrial-scale micron air classifier model, the simulated performance of a complex two-phase gas–solid flow, characterized by the formation of multiple vortices with different sizes, positions, and rotation directions, was successfully captured, while it is not fully represented in previous simulations with lab-scale models. The effects of vortices on the velocity distribution, particle flow inside the classifier, and separation efficiency are further analyzed in subsequent sections, particularly through the evaluation of one-way coupling, two-way coupling, and four-way coupling models, and the impact of the gas mass airflow rate at the fine powder outlet on the flow field within the classifier and the separation efficiency are studied.

4.1.2. Velocity Distribution

Figure 4a presents the axial velocity distributions under the three different coupling models. According to the radial direction from the wall of the classification chamber, the axial velocities initially have negative values that significantly decrease in the region near the wall. This means that the flow carries particles upward in this region. Next, they become positive and gradually increase to carry the particles downwards before entering the rotor cage. Then, they remain steady in the blade classification zone. Clearly, the axial velocity under one-way coupling is the highest, while it seems likely to be similar under the two-way and four-way coupling models. On the other hand, Figure 4b illustrates that the radial velocities under one-way coupling, two-way coupling, and four-way coupling are different. In the classification chamber at Z = 310 mm, the radial velocity under the four-way coupling condition is the highest, while that under the two-way coupling condition is the smallest. They reach the highest radial velocity at the outlet of the rotor cage. The negative sign indicates that the direction moves toward the center of the rotor cage, meaning the flow enters the rotor cage, as clearly illustrated in Figure 3.

4.1.3. Particle Flow with Different Coupled CFD-DEM Models

Figure 5 illustrates that the particle flow patterns exhibit distinct differences under different coupling models between the solid and gas phases: (1) one-way coupling (where the reaction of solids to gas flow is ignored), (2) two-way coupling (where the reaction of solids to gas flow is considered), and (3) four-way coupling (where particle–particle collisions are included). Specifically, the particle flow pattern under one-way coupling is not clearly observed, whereas the patterns under the two-way and four-way coupling models are more distinct, with similar descending angles being observed in the coarse material cone. This can be explained by the fact that the reaction force exerted by individual particles on the fluid phase is significant, leading to a reduction in the axial velocities of the particles. Therefore, the axial velocity of the flow under one-way coupling is higher than that under two-way coupling or four-way coupling (Figure 4a). The presence of a solid phase alters the airflow structure inside the classifier. As analyzed in Section 4.1.1 and Section 4.1.2, the positions, sizes, shapes, and rotational directions of the vortices formed in the separator and the velocity of the airflow exhibit significant differences with different coupled CFD–DEM models (Figure 3 and Figure 4). These observations highlight the significant impacts of the solid phase on the gas phase, which directly impacts the motion of the particle stream and the overall separation efficiency. Additionally, there are more small particles (blue particles shown in Figure 5) in the coarse material cone under four-way coupling compared to the other models. This is because particle–particle interactions are included in two-way coupling for four-way coupling, which increases the probability of collisions between particles. As a result, small particles may be carried by larger particles to the coarse material cone. Under all three coupling models, the particle flow undergoes additional airflow through the secondary inlet and some vortices with different positions, sizes, and rotational directions in this region. Therefore, the coarse materials are cleared again before discharging by removing the remaining fine products. The coarse material cone functions as a secondary separator like an air cyclone, as shown in Figure 5.

4.1.4. Classification Efficiency

The Tromp curve, which plots the partition of particles to the underflow versus particle size, describes the efficiency of the classifier (Figure 6). These curves show a similar trend: as the particle size decreases, the classification efficiency initially declines gradually, followed by a sharp decrease at a particle size of 400 µm. According to the simulation results, the Newton efficiencies for one-way, two-way, and four-way coupling are 90.8%, 88.32%, and 88.48%, respectively. This also presents a minor difference in classification efficiency between two-way and four-way coupling. However, the cut size decreases slightly (i.e., 0.355, 0.351, and 0.326, respectively) depending on whether one-way, two-way, or four-way coupling is used.

4.1.5. Particle Size Distribution

According to the powder particle size distribution shown in Figure 7, the particle size distributions of the final products vary under different coupled schemes. However, the distributions for two-way and four-way coupling have similar trends and meet production needs, while the one-way coupling distribution is completely different. This result highlights the significant impacts of the solid phase on the gas phase and shows the necessity of using the four-way coupling model in simulations to comprehensively understand the gas–solid flow field and the classification mechanism.

4.2. The Effects of the Outlet Mass Airflow Rate on the Classification Performance

Considering the actual working condition limits, three combinations of the outlet mass airflow rate (M), rotor speed (N), and feed rate (Qp) are set: (a) M = M1 = 4.934 kg/s, N = 240 rpm, and Qp = 1.574 kg/s; (b) M = M2 = 6.125 kg/s, N = 240 rpm, and Qp = 1.574 kg/s; and (c) M = M3 = 6.806 kg/s, N = 240 rpm, and Qp = 1.574 kg/s.

4.2.1. Fluid Flow under Different Outlet Mass Airflow Rates

Two-dimensional vector graphs of the flow field are presented in Figure 8. A large vortex forms near the lower section of the rotor cage, obstructing the airflow entry and decreasing the effective classification height. A comparison of the vortices under different conditions shows that the position of the vortex formed under M2 (6.125 kg/s) is the lowest, facilitating airflow entry into the rotor cage and allowing more particles to enter during the classification. Thus, it is inferred that M2 is the best condition. Additionally, large vortices exist in the guide cone region, but their intensities, positions, and rotation directions differ under various outlet mass airflow rates. For M2 = 6.125 kg/s, the airflow mostly moves downward from the guide cone to the coarse material cone, aiding in transporting large particles to the coarse material cone before discharge. A small part of the airflow moves upward from the coarse material cone to the guide cone near the wall, offering a good opportunity to re-clean fine particles from the coarse product. Under outlet mass airflow rates of 4.934 kg/s and 6.806 kg/s, vortices in the coarse material cone return flow to the guide cone, helping fine particles to be re-cleaned from coarse particles. These vortices assist in raising the fine particles again. It is notable that in all three simulation cases, the coarse material cone acts as an air cyclone, functioning like a secondary air separator. The influence of the outlet mass airflow rates on the flow field is further elucidated by analyzing the velocity field distribution as follows.

The Effects of the Outlet Mass Airflow Rate on the Tangential Velocity

Figure 9 illustrates the tangential velocity distributions inside the classifier. A trend is observed where the tangential velocity increases with an increase in the outlet mass airflow rate, particularly in the coarse material cone and blade classification region. Additionally, the tangential velocity decreases from the top surface of the classification chamber in all three cases. This is due to the presence of large turbulent vortices of various sizes in the lower section of the separating zone. Consequently, the classification efficacy appears to be superior in the upper portion of the rotor. Another trend is that the velocity in the blade zone (I) is higher than that in the annular zone (II), especially in the third simulation case. This causes fine particles to migrate into the coarse product. Figure 9 shows that the tangential velocity distribution is the most uniform at an outlet mass airflow rate of 6.125 kg/s, which improves the separation efficiency. Both zones (I) and (II) are critical grading functional areas in the classifier, necessitating a detailed study of the velocity distribution [42].
As shown in Figure 10, the tangential velocity profiles in the blade zone (I) and the annular region (II) are significantly different, but the tangential change gradient amplitudes are similar in both zones. However, the tangential velocity under M2 is higher than that under M1 and M3 in zone (I), which may contribute to better classification efficiency.

The Effect of the Outlet Mass Airflow Rate on the Radial Velocity

This subsection focuses on the radial velocity of the airflow. A radial velocity of less than zero (Figure 11) indicates that the direction moves toward the center of the rotor cage. The radial velocity distribution at an outlet mass airflow rate of 6.125 kg/s is more stable. The radial velocity at M = M1 = 4.934 kg/s is clearly the smallest, whereas the radial velocity gradient at M = M2 = 6.125 kg/s is the highest. This improves the separation efficiency at 6.125 kg/s, which is consistent with the findings for the tangential velocity.

The Effect of the Outlet Mass Airflow Rate on Axial Velocity

Figure 12 shows a relatively symmetrical trend. According to the radial direction from the classification chamber’s wall, the axial velocities initially have negative values to carry particles upward before entering the rotor cage. They increase and become negative inside the rotor cage, causing the fine particles to move upward and discharge through the fine powder outlet. The axial velocity at M = M3 = 6.806 kg/s is the highest, while that at M2 = 6.125 kg/s is the lowest in the blade zone. As M increases, the axial velocity also increases in the annular zone.
The above analysis indicates that the velocity field inside the classifier is significantly influenced by the outlet mass airflow rate. This directly affects the particle flow and classification efficiency of the micron air classifier, which will be examined in the following sections.

4.2.2. Simulated Results and Analysis of Discrete Phase

Particle Flow under Different Outlet Mass Airflow Rates

During the separation process, the particle trajectories elucidate the dynamics of particle movement, providing a visual representation of the classification mechanism. Consequently, the particle motions under three distinct sets of operating parameters are analyzed and compared.
As shown in Figure 13, fine and coarse particle classifications occur not only in the classification chamber, but also in the coarse material cone and guide cone. In the classification chamber, the particles are mainly classified in the upper half. This occurs because, in the underfeed classifier, the airflow enters the rotor at a large incidence angle, generating a large vortex in the lower half of the classification chamber. This vortex impedes the airflow, causing the lower half of the rotor cage to lose its classification functionality, resulting in particle accumulation in the upper section of the chamber. The increased friction between the particles reduces both the efficiency and accuracy of the separation. Fine particles are carried by the continuous phase into the lower part of the rotor, while larger particles are separated in the upper part of the chamber. Additionally, fine products are transported downwards to the guide cone and then rise back to the classification chamber due to the vortices. Similarly, the coarse material cone acts as a secondary separator like a gas cyclone. Before discharge, the coarse material is intensively rinsed with secondary air to remove any remaining fine products.

The Outlet Mass Airflow Rate’s Effects on the Classification Efficiency

Numerical simulations provide data on the escaped and trapped particles. The efficiency curve is constructed based on the percentage of trapped particles within the total mass of the feed particles of the same size, determining the degree of separation corresponding to varying outlet mass airflow rates. The results are shown in Figure 14.
As shown in Figure 14, the Tromp curves exhibit the same trend: the classification efficiency drops dramatically for particle sizes less than 400 µm. Under outlet mass airflow rates of 4.934 kg/s and 6.806 kg/s, higher airflow rates result in lower yields of coarse products and vice versa for fine products. This is due to the different terminal velocities of the particles; higher airflow rates result in more particles in the fine product because their terminal velocity is exceeded. However, as the outlet mass airflow rate increases, d50 also increases. This result is consistent with those reported in Refs. [39,44]. Specifically, at outlet mass airflow rates of 4.934 kg/s, 6.125 kg/s, and 6.806 kg/s, the air micron separator achieves Newton efficiencies of 61.25%, 88.48%, and 87.17%, respectively (Table 5). The values of K corresponding to 6.125 kg/s and 6.806 kg/s range from 1.0 to 1.4, indicating excellent classification performance [42]. Based on these indexes, the classification performance at the outlet mass airflow rate of 6.125 kg/s is superior to the others. However, increasing the outlet mass airflow rate also increases the pressure drop, which unfortunately increases the energy consumption in the plant.

The Outlet Mass Airflow Rate’s Effects on the Particle Size Distribution

Figure 15 shows that the particle size distributions of the final products vary significantly. The particle size range of the separation product increases when the outlet mass airflow rate increases from 4.934 kg/s to 6.806 kg/s. This is because as the outlet mass airflow rate increases, the velocity of the airflow inside the classifier also increases (further analyzed in Section 4.2.1), resulting in a greater force being exerted on the particles in the flow. With this increased force, larger particles are more likely to be carried along by the airflow. Consequently, the final classification product has a broader particle size range compared to conditions with a lower outlet mass airflow rate. The simulation results also indicate that a higher outlet mass airflow rate results in higher productivity. Specifically, when the outlet mass airflow rate increases from 4.934 kg/s to 6.125 kg/s, the productivity increases by about 25%. Furthermore, it increases by approximately 31% when the outlet mass airflow rate increases from 6.125 kg/s to 6.806 kg/s.
The above analysis shows that the outlet mass airflow rate has significant effects on the flow field and classification performance, which is evaluated by the classifier’s Key Performance Indicators (KPIs: d50, K, η, ΔP) and the classification product’s particle size distribution curve considered as a constrained condition. In detail, higher airflow rates result in lower yields for coarse products and vice versa for fine products. The outlet mass airflow rate increases, d50 also increases. The values of K corresponding to 6.125 kg/s and 6.806 kg/s range from 1.0 to 1.4, indicating excellent classification accuracy. However, increasing the outlet mass airflow rate also increases the pressure drop, which, unfortunately, raises energy consumption in the plant. Based on these indexes, the classification performance with the highest classification efficiency and accuracy at an outlet mass airflow rate of 6.125 kg/s is superior to the others. The simulated results also indicate that the particle size distribution curve of the classification products varies significantly under different outlet mass airflow rates. This forms the foundation for optimizing the structural and operation conditions of the classifier with the constrained condition of meeting the required distribution curve for quartz-based engineered stones. This problem will be addressed in our next study.

5. Validation with Plant Data

The simulation results are validated by comparing them with the results obtained from industrial equipment at the Vicostone Plant of the Phenikaa Group under the same operating parameters (i.e., an outlet mass airflow rate of 6.125 kg/s and a rotation speed of 240 rpm). The pressure drop is used as the major parameter for validation. A photograph of the industrial micron air classifier is shown in Figure 16.
The data in Table 6 show a slight difference (6.7%) between the simulation results and the measured data. This indicates that the simulated results agree well with the measured data of the plant.

6. Conclusions

With the assistance of High-Performance Computing (HPC) systems, this study effectively and accurately addressed the computational challenges faced when simulating a real-size model of an industrial-scale classifier using the FWC-RSM-DPM. These results enhance our understanding of the classification mechanism. The simulation results are validated by comparing them with plant data. The effects of different outlet mass airflow rates were analyzed, leading to the following conclusions:
(1)
The complex two-phase flow, characterized by the formation of multiple vortices with different sizes, positions, and rotation directions, is successfully captured by a real-size model of an industrial-scale micron air classifier. This phenomenon is particularly challenging to accurately capture in experimental studies and simulations conducted on scaled-down models. The coarse material cone functions as a secondary separator, similar to an air cyclone, where coarse particles undergo intensive upward airflow to remove the remaining fine material particles before discharge. The simulation results provide a comprehensive understanding of the gas–solid flow field and the classification mechanism.
(2)
The distribution of the internal flow field and the classification performance of the micron air classifier are significantly influenced by the outlet mass airflow rate. When the outlet mass airflow rate increases from 4.934 kg/s to 6.125 kg/s, Newton’s efficiency gradually increases from 61.25% to 88.48%. Conversely, it decreases from 88.48% to 87.17% as the outlet mass airflow rate increases from 6.125 kg/s to 6.806 kg/s. As the outlet mass airflow rate increases from 4.934 kg/s to 6.806 kg/s, the cut size increases by about 18%, while the classification sharpness index decreases by about 16%.
(3)
A comparison among the three coupling models highlights the significant impacts of the solid phase on the gas phase and shows the advancement of four-way coupling in providing accurate results when simulating interactions between the gas phase and particles. The four-way coupling model provides the most accurate simulation results, although it is very difficult to converge and is expensive.
(4)
The particle size distribution curve performances of the classified product under different simulation models and different outlet airflow rates were addressed, from which the optimal parameters could be selected in the design and operation processes to achieve the required efficiency of an air classifier. This topic will be addressed in our next study.

Author Contributions

N.X.H., H.T.D., N.T.D. and B.H.N. were involved in conceptualization, methodology, validation, investigation, and writing—reviewing and editing. All authors have read and agreed to the published version of the manuscript.

Funding

This research received no external funding.

Data Availability Statement

The data that support the findings of this study are available within the article.

Acknowledgments

The authors are grateful to the Vicostone Plant, Phenikaa University, Advanced Technology Joint Stock Company, and the Phenikaa Group for supporting this work. The calculations in this work were performed at Phenikaa University’s HPC Systems.

Conflicts of Interest

Author Bang Hai Nguyen was employed by the Advanced Technology Joint Stock Company. The remaining authors declare that the research was conducted in the absence of any commercial or financial relationships that could be construed as a potential conflict of interest. The Advanced Technology Joint Stock Company had no role in the design of the study; in the collection, analyses, or interpretation of data; in the writing of the manuscript, or in the decision to publish the results.

Abbreviations

The following abbreviations and mathematical symbols are used in this manuscript:
CFDComputational Fluid Dynamics
DPMDiscrete Phase Model
FWCFour-Way Coupling
RSMReynold Stress Model
DEMDiscrete Element Method
KPIsKey Performance Indicators
KANKolmogorov-Arnold Network
LLMsLarge language models
HPCHigh-Performance Computing
QUICKQuadratic Upwind Interpolation of Convective Kinematics
SIMPLECSemi-Implicit Method for Pressure Linked Equations Consistent
εthe volume fraction locally occupied by fluid
uthe average fluid velocities
u′the fluctuating fluid velocities
ttime
ρffluid density
ppressure
ggravitational acceleration
mithe i-th particle’s mass
vithe i particle’s velocities

References

  1. Jia, F.; Mou, X.; Fang, Y.; Chen, C. A new rotor-type dynamic classifier: Structural optimization and industrial applications. Processes 2021, 9, 1033. [Google Scholar] [CrossRef]
  2. Vincent, J.H. Aerosol Science for Industrial Hygienists, 1st ed.; Pergamon: Oxford Tarrytown, NY, USA, 1995. [Google Scholar]
  3. Peng, Y.; He, M.; Hu, F.; Mao, Z.; Huang, X.; Ding, J. Predictive Modeling of Flexible EHD Pumps Using Kolmogorov-Arnold Networks. 2024. Available online: https://www.researchgate.net/publication/380572489_Predictive_Modeling_of_Flexible_EHD_Pumps_using_Kolmogorov-Arnold_Networks (accessed on 26 August 2024).
  4. Zhang, C.; Chen, J.; Li, J.; Peng, Y.; Mao, Z. Large language models for human–robot interaction: A review. Biomim. Intell. Robot. 2023, 3, 100131. [Google Scholar] [CrossRef]
  5. Chu, K.W.; Wang, B.; Xu, D.L.; Chen, Y.X.; Yu, A.B. CFD–DEM simulation of the gas–solid flow in a cyclone separator. Chem. Eng. Sci. 2011, 66, 834–847. [Google Scholar] [CrossRef]
  6. Guizani, R.; Mhiri, H.; Bournot, P. Effects of the geometry of fine powder outlet on pressure drop and separation performances for dynamic separators. Powder Technol. 2017, 314, 599–607. [Google Scholar] [CrossRef]
  7. Guizani, R.; Mokni, I.; Mhiri, H.; Bournot, P. CFD modeling and analysis of the fish-hook effect on the rotor separator’s efficiency. Powder Technol. 2014, 264, 149–157. [Google Scholar] [CrossRef]
  8. Huang, Q.; Liu, J.; Yu, Y. Turbo air classifier guide vane improvement and inner flow field numerical simulation. Powder Technol. 2012, 226, 10–15. [Google Scholar] [CrossRef]
  9. Gao, L.; Yu, Y.; Liu, J. Study on the cut size of a turbo air classifier. Powder Technol. 2013, 237, 520–528. [Google Scholar] [CrossRef]
  10. Yu, Y.; Liu, J.; Zhang, K. Establishment of a prediction model for the cut size of turbo air classifiers. Powder Technol. 2014, 254, 274–280. [Google Scholar] [CrossRef]
  11. Morimoto, H.; Shakouchi, T. Classification of ultra fine powder by a new pneumatic type classifier. Powder Technol. 2003, 131, 71–79. [Google Scholar] [CrossRef]
  12. Hoekstra, A.J.; Derksen, J.J. An experimental and numerical study of turbulent swirling flow in gas cyclones. Chem. Eng. Sci. 1999, 54, 2055–2065. [Google Scholar] [CrossRef]
  13. Barimani, M.; Green, S.; Rogak, S. Particulate concentration distribution in centrifugal air classifiers. Miner. Eng. 2018, 126, 44–51. [Google Scholar] [CrossRef]
  14. Xu, B.H.; Yu, A.B. Numerical simulation of the gas-solid flow in a fluidized bed by combining discrete particle method with computational fluid dynamics. Chem. Eng. Sci. 1997, 52, 2785–2809. [Google Scholar] [CrossRef]
  15. Li, Y.; Zhang, J.; Fan, L.-S. Numerical simulation of gas-liquid-solid fluidization systems using a combined CFD-VOF-DPM method: Bubble wake behavior. Chem. Eng. Sci. 1999, 54, 5101–5107. [Google Scholar] [CrossRef]
  16. Rhodes, M.J.; Wang, X.S.; Nguyen, M.; Stewart, P.; Li, K. Use of discrete element method simulation in studying fluidization characteristics: Influence of interparticle force. Chem. Eng. Sci. 2001, 56, 69–76. [Google Scholar] [CrossRef]
  17. Kafui, K.D.; Thornton, C.; Adams, M.J. Discrete particle-continuum fluid modelling of gas-solid uidised beds. Chem. Eng. Sci. 2002, 57, 2395–2410. [Google Scholar] [CrossRef]
  18. Yu, A.B.; Xu, B.H. Particle-scale modelling of gas-solid flow in fluidisation. J. Chem. Technol. Biotech. 2003, 78, 111–121. [Google Scholar] [CrossRef]
  19. Limtrakul, S.; Boonsrirat, A.; Vatanatham, T. DEM modeling and simulation of a catalytic gas–solid fluidized bed reactor: A spouted bed as a case study. Chem. Eng. Sci. 2004, 59, 5225–5231. [Google Scholar] [CrossRef]
  20. Di Renzo, A.; Di Maio, F.P. Homogeneous and bubbling fluidization regimes in DEM-CFD simulations: Hydrodynamic stability of gas and liquid fluidized beds. Chem. Eng. Sci. 2007, 62, 116–130. [Google Scholar] [CrossRef]
  21. Kuang, S.B.; Chu, K.W.; Yu, A.B.; Zou, Z.S.; Feng, Y.Q. Computational Investigation of Horizontal Slug Flow in Pneumatic Conveying. Ind. Eng. Chem. Res. 2008, 47, 470–480. [Google Scholar] [CrossRef]
  22. Elghobashi, S. On predicting particle-laden turbulent flows. Appl. Sci. Res. 1994, 52, 309–329. [Google Scholar] [CrossRef]
  23. Kawaguchi, T.; Tanaka, T.; Tsuji, Y. Numerical simulation of two-dimensional fiuidized beds using the discrete element method (comparison between the two- and three-dimensional models). Powder Technol. 1998, 96, 129–138. [Google Scholar] [CrossRef]
  24. Rong, D.; Horio, M. Behavior of particles and bubbles around immersed tubes in a fluidized bed at high temperature and pressure: A DEM simulation. Int. J. Multiph. Flow 2001, 27, 89–105. [Google Scholar] [CrossRef]
  25. Ibsen, C.H.; Helland, E.; Hjertager, B.H.; Solberg, T.; Tadrist, L.; Occelli, R. Comparison of multifluid and discrete particle modelling in numerical predictions of gas particle flow in circulating fluidised beds. Powder Technol. 2004, 149, 29–41. [Google Scholar] [CrossRef]
  26. Chu, K.W.; Yu, A.B. Numerical simulation of complex particle–fluid flows. Powder Technol. 2008, 179, 104–114. [Google Scholar] [CrossRef]
  27. Chu, K.W.; Wang, B.; Yu, A.B.; Vince, A. CFD-DEM modelling of multiphase flow in dense medium cyclones. Powder Technol. 2009, 193, 235–247. [Google Scholar] [CrossRef]
  28. Chu, K.W.; Wang, B.; Yu, A.B.; Vince, A.; Barnett, G.D.; Barnett, P.J. CFD–DEM study of the effect of particle density distribution on the multiphase flow and performance of dense medium cyclone. Miner. Eng. 2009, 22, 893–909. [Google Scholar] [CrossRef]
  29. Gui, N.; Fan, J.; Cen, K. Effect of local disturbance on the particle-tube collision in bubbling fluidized bed. Chem. Eng. Sci. 2009, 64, 3486–3497. [Google Scholar] [CrossRef]
  30. Zhao, Y.; Jiang, M.; Liu, Y.; Zheng, J. Particle-scale simulation of the flow and heat transfer behaviors in fluidized bed with immersed tube. AIChE J. 2009, 55, 3109–3124. [Google Scholar] [CrossRef]
  31. Derksen, J.J.; van den Akker, H.E.A.; Sundaresan, S. Two-way coupled large-eddy simulations of the gas-solid flow in cyclone separators. AIChE J. 2008, 54, 872–885. [Google Scholar] [CrossRef]
  32. Wang, S.; Li, H.; Wang, R.; Wang, X.; Tian, R.; Sun, Q. Effect of the inlet angle on the performance of a cyclone separator using CFD-DEM. Adv. Powder Technol. 2019, 30, 227–239. [Google Scholar] [CrossRef]
  33. Chu, K.; Chen, J.; Yu, A. Applicability of a coarse-grained CFD–DEM model on dense medium cyclone. Miner. Eng. 2016, 90, 43–54. [Google Scholar] [CrossRef]
  34. Ma, L.; Wei, L.; Pei, X.; Zhu, X.; Xu, D. CFD-DEM simulations of particle separation characteristic in centrifugal compounding force field. Powder Technol. 2019, 343, 11–18. [Google Scholar] [CrossRef]
  35. El-Emam, M.A.; Zhou, L.; Shi, W.D.; Han, C. True shape modeling of bio-particulate matter flow in an aero-cyclone separator using CFD-DEM simulation. Comp. Part. Mech. 2021, 8, 955–971. [Google Scholar] [CrossRef]
  36. Betz, M.; Gleiss, M.; Nirschl, H. Effects of Flow Baffles on Flow Profile, Pressure Drop and Classification Performance in Classifiers. Processes 2021, 9, 1213. [Google Scholar] [CrossRef]
  37. Kesseler, M.; Heller, V.; Turnbull, B. A laboratory-numerical approach for modelling scale effects in dry granular slides. Landslides 2018, 15, 2145–2159. [Google Scholar] [CrossRef]
  38. Yoshida, H. Three-dimensional simulation of air cyclone and particle separation by a revised-type cyclone. Colloids Surf. A: Physicochem. Eng. Asp. 1996, 109, 1–12. [Google Scholar] [CrossRef]
  39. Pant, K.; Crowe, C.T.; Irving, P. On the design of miniature cyclones for the collection of bioaerosols. Powder Technol. 2002, 125, 260–265. [Google Scholar] [CrossRef]
  40. Derksen, J.J.; Sundaresan, S.; van den Akker, H.E.A. Simulation of mass-loading effects in gas-solid cyclone separators. Powder Technol. 2006, 163, 59–68. [Google Scholar] [CrossRef]
  41. Wang, B.; Xu, D.L.; Chu, K.W.; Yu, A.B. Numerical study of gas-solid flow in a cyclone separator. Appl. Math. Model. 2006, 30, 1326–1342. [Google Scholar] [CrossRef]
  42. Zeng, Y.; Zhang, S.; Zhou, Y.; Li, M. Numerical Simulation of a Flow Field in a Turbo Air Classifier and Optimization of the Process Parameters. Processes 2020, 8, 237. [Google Scholar] [CrossRef]
  43. Kim, M.; Cha, J.; Go, J.S. Ring-Shaped Baffle Effect on Separation Performance of Lithium Carbonate Micro Particles in a Centrifugal Classifier. Micromachines 2020, 11, 980. [Google Scholar] [CrossRef] [PubMed]
  44. Galletti, C.; Rum, A.; Turchi, V.; Nicolella, C. Numerical analysis of flow field and particle motion in a dynamic cyclonic selector. Adv. Powder Technol. 2020, 31, 1264–1273. [Google Scholar] [CrossRef]
  45. Shah, K.V.; Vuthaluru, R.; Vuthaluru, H.B. CFD based investigations into optimization of coal pulveriser performance: Effect of classifier vane settings. Fuel Process. Technol. 2009, 90, 1135–1141. [Google Scholar] [CrossRef]
  46. Huang, L.; Li, W.; Liu, R.; Yuan, J.; Li, X.; Jiang, H.; Duan, C. Dynamic characteristics of the internal flow field of a rotary centrifugal air classifier and pressure prediction through attention mechanism-enhanced CNN-LSTM. Adv. Powder Technol. 2024, 35, 104578. [Google Scholar] [CrossRef]
  47. Mou, X.; Jia, F.; Fang, Y.; Chen, C. CFD-Based Structural Optimization of Rotor Cage for High-Efficiency Rotor Classifier. Processes 2021, 9, 1148. [Google Scholar] [CrossRef]
  48. Yu, Y.; Kong, X.; Liu, J. Effect of rotor cage’s outer and inner radii on the inner flow field of the turbo air classifier. Mater. Werkst 2020, 51, 908–919. [Google Scholar] [CrossRef]
  49. Petrus, H.T.B.M.; Hirajima, T.; Oosako, Y.; Nonaka, M.; Sasaki, K.; Ando, T. Performance of dry-separation processes in the recovery of cenospheres from fly ash and their implementation in a recovery unit. Int. J. Miner. Process. 2011, 98, 15–23. [Google Scholar] [CrossRef]
  50. Li, Q.; Mou, X.; Fang, Y. Effects of a Guide Cone on the Flow Field and Performance of a New Dynamic Air Classifier. Processes 2022, 10, 874. [Google Scholar] [CrossRef]
  51. PHENIKAA. Available online: https://phenikaa.com/?fbclid=IwZXh0bgNhZW0CMTAAAR2IwWXC-v6zK8ZS4dzodw1q_bAewfEL8yU77aOuw2fCVVirAb1UPHybLUk_aem_ARC9awdS1zVbJVosvEh4jvHrBImhbhsxpVIsTGtqVq6fnMAz4qJwi7MjfFnkuObpMuZEezUiDcHara7aOOEqVpk8 (accessed on 10 August 2024).
  52. Ahmad, T.; Plee, S.L.; Myers, J.P. Fluent Theory Guide; ANSYS: Canonsburg, PA, USA, 2021. [Google Scholar]
  53. Ahmad, T.; Plee, S.L.; Myers, J.P. Fluent User’s Guide; ANSYS: Canonsburg, PA, USA, 2016. [Google Scholar]
Figure 1. A schematic outline of the classification process by a micron air classifier.
Processes 12 02035 g001
Figure 2. The computational grid (a) and dimensions (b) of the micron air classifier.
Processes 12 02035 g002
Figure 3. Vector graphics of the flow field (vectors are colored according to the velocity magnitude). (a) Vortices forming inside the classifier; (b) comparison of the flow field under one-way coupling, two-way coupling, and four-way coupling; (c) large vortex forming in the classification chamber; (d) vortex forming in the coarse material cone.
Processes 12 02035 g003
Figure 4. Axial velocity distributions (a) and radial velocity distributions (b) in the horizontal section (Z = 310 mm) between one-way coupling (V1), two-way coupling (V2), and four-way coupling (V3).
Processes 12 02035 g004
Figure 5. The solid flow patterns with 1-way coupling, 2-way coupling, and 4-way coupling. The snapshots were taken at t = 3 s. The particles are colored according to the particle diameters.
Processes 12 02035 g005
Figure 6. Tromp curves of the classifier with one-way, two-way, and four-way coupling CFD–DEM models.
Processes 12 02035 g006
Figure 7. Particle size distributions with one-way, two-way, and four-way coupling models (CFD–DEM).
Processes 12 02035 g007
Figure 8. Vortices of airflow into the investigated classifier: (a) M1 = 4.934 kg/s, (b) M2 = 6.125 kg/s, and (c) M3 = 6.806 kg/s.
Processes 12 02035 g008
Figure 9. Contours of the tangential velocity distribution under different outlet mass airflow rates: (a) M1 = 4.934 kg/s, (b) M2 = 6.125 kg/s, and (c) M3 = 6.806 kg/s.
Processes 12 02035 g009
Figure 10. A comparison of air tangential velocities (Vt) at Z = 310 mm. Vt1, Vt2, and Vt3 correspond to M1, M2, and M3, respectively.
Processes 12 02035 g010
Figure 11. A comparison of air radial velocities at Z = 310 mm. Vr1, Vr2, and Vr3 correspond to M1, M2, and M3, respectively.
Processes 12 02035 g011
Figure 12. A comparison of air axial velocities (Va) at Z = 310 mm. Va1, Va2, and Va3 correspond to M1, M2, and M3, respectively.
Processes 12 02035 g012
Figure 13. Solid flow patterns under different outlet mass airflow rates. Snapshots were captured at t = 3 s, with the particles colored based on their diameter.
Processes 12 02035 g013
Figure 14. Tromp curves of the classifier with different outlet mass flow rates.
Processes 12 02035 g014
Figure 15. Particle size distributions at different outlet mass flow rates.
Processes 12 02035 g015
Figure 16. A photograph of the micron air classifier manufactured by Phenikaa Group.
Processes 12 02035 g016
Table 1. The impact of the mesh resolution on the average static pressure drop.
Mesh Size (million)5.7676.9067.1338.128Factory Data
ΔP (Pa)26142596255824522500
Deviation (%)4.563.842.321.92
Table 2. Simulation conditions of the flow field in the micron air classifier.
Boundary NameValueBoundary NameValue
Outlet mass airflow rate (kg/s)4.934 to 6.806Rotor speed (rpm)240
Young’s modulus (N/m2)8.8 × 1010Feed flow rate (kg/s)1.574
Particles’ static friction coefficient0.6Particle density (kg/m3)2650
Particle–wall restitution coefficient0.5Gas density (kg/m3)1.225
Viscosity (kg/m/s) 1.789 × 10⁻⁵Poisson’s ratio0.088
Table 3. The particle size distribution of the raw material.
Particle Size [µm]Accumulated Percentage [%]Particle Size [µm]Accumulated Percentage [%]
200.112007.38
320.230028.8
450.3640065.22
630.7150087.52
901.1770099.6
1001.48800100
Table 4. A comparison between the current simulation results and those reported in Ref. [50].
Pressure DropUnitPresent StudyRef. [50]Deviation (%)
Pure air phasePa230.605230.140.202
Air–particle flowPa226.558228.70.936
Table 5. A comparison of the cut sizes, classification sharpness indexes and efficiencies, and pressure drops for three different outlet mass airflow rates.
Outlet Mass Airflow Rate, kg/sd50, mmKη, %ΔP, Pa
M1 (4.934)0.3021.3561.252381
M2 (6.125)0.3421.1688.483001
M3 (6.806)0.3561.1787.174006
Table 6. Comparison between simulation results and plant data.
Simulation ResultsPlant DataDeviation
Pressure drop (Pa)300128006.7%
Disclaimer/Publisher’s Note: The statements, opinions and data contained in all publications are solely those of the individual author(s) and contributor(s) and not of MDPI and/or the editor(s). MDPI and/or the editor(s) disclaim responsibility for any injury to people or property resulting from any ideas, methods, instructions or products referred to in the content.

