Article

Research on Accurate Detection Algorithm for the Cross-Section of Shale Gas Casing Deformation Pipe String Based on Laser Ranging

State Key Laboratory for Performance and Structure Safety of Petroleum Tubular Goods and Equipment Materials, CNPC Tubular Goods Research Institute, Xi’an 710077, China
*
Author to whom correspondence should be addressed.
Processes 2024, 12(7), 1435; https://doi.org/10.3390/pr12071435
Submission received: 7 April 2024 / Revised: 5 June 2024 / Accepted: 25 June 2024 / Published: 9 July 2024
(This article belongs to the Section Process Control and Monitoring)

Abstract

:
Under shear and non-uniform loads, the deformation of the section shape of a casing results in an irregular section, and the spatial continuity is poor. The change in the distance between the wall of the casing before and after stress is recorded to analyze the deformation of the casing, and the distance value is taken as the key characteristic of the casing. A large number of the key characteristic values of shale gas casing deformation can be obtained by using the circular traversal detection method. At the same time, this article focuses on the center deviation between the laser sensor axis and the pipe string axis, as well as on the disturbance problem during measurement. An eccentricity error correction algorithm is derived to correct the eccentricity error that occurs during the detection process, and then we use interpolation algorithms to draw cubic spline curves to improve detection accuracy. The test results show that the algorithm can effectively eliminate eccentricity errors in measurement and achieve the accurate measurement of deformation casing characteristic values, which can provide basic data for the study of a shale gas casing deformation mechanism.

1. Introduction

Due to the sliding shear and non-uniform external compression of the formation of shale gas [1,2,3], the deformation of the production casing of shale gas has always existed [4,5,6,7]. At the same time, casing deformation, rupture or perforation is caused during cementing, fracturing and perforating in the process of oil and gas field exploitation. Casing deformation restricts the efficient exploitation of shale gas, causing huge economic losses or accidents such as harmful gas leakage, oil well shutdown or even well sealing [8,9,10]. Under laboratory conditions, simulating the stress and deformation environment of shale gas casing wellbore and studying the mechanism of casing deformation can provide data on which to base casing development and the production and adjustment of drilling and production technology [11,12,13].
At present, the detection of casing deformation mainly uses a multi-arm caliper to collect on-site data from casing deformation wells and obtain corresponding casing deformation data [14,15,16]. The accuracy of its data collection is difficult to evaluate [17,18,19], and it is difficult to accurately determine the deformation mechanism of shale gas wells caused by shear and non-uniform extrusion [20,21,22]. At present, the equipment used for internal monitoring of casing deformation is mostly used for ground pipelines [23,24,25], with relatively large inner diameters, and there is still a lack of equipment for detecting casing deformation [26,27]. Therefore, an automatic detection device based on a traversal detection method was designed to simulate the stress state of shale gas casing under laboratory conditions and to use real-time monitoring of casing deformation under shear and non-uniform loads.
Due to the shear and non-uniform loads on the casing, deformation results in an irregularly shaped section. The use of traversal detection can maximize the acquisition of cross-sectional feature parameters and ensure testing accuracy. However, it is inevitable that issues such as non-parallelism of the axis and vibration disturbances that affect measurement accuracy during the testing process will be encountered. It is necessary to correct the eccentricity and vibration errors in the detection process. At the same time, a discrete data curve is processed to improve accuracy, and a cubic spline interpolation function is selected to solve the function model that resembles the real curve [28,29,30,31]. Furthermore, a deformation section curve is drawn inside the casing to calculate the relevant characteristic values and to improve detection accuracy in order to provide basic data for evaluating casing deformation.

2. Test Method

The whole detection system was designed in order to adopt modularity. The walking mechanism of the detection device, which is driven by double motors, adopts tooth rod and gear. The large torque of the motor allows the detection system to reduce hardware error. The double motor can realize the forward, backward and rotating actions in the casing, the central spindle can realize the rigid support, and the rotating motor part can realize the rotation of the sensor. The double motor controls the acquisition mechanism equipped with a laser ranging sensor in order to carry out deformation detection in the casing [32,33,34,35]. The structure diagram of the whole system is shown in Figure 1.
Non-contact geometric deformation detection technology detects the deformation inside the casing by using laser ranging sensors based on the laser triangulation method. This is less affected by environmental interference during the detection process and can replace sensors suitable for different ranges according to the diameter measurement of the pipe [35,36,37,38,39].
(1)
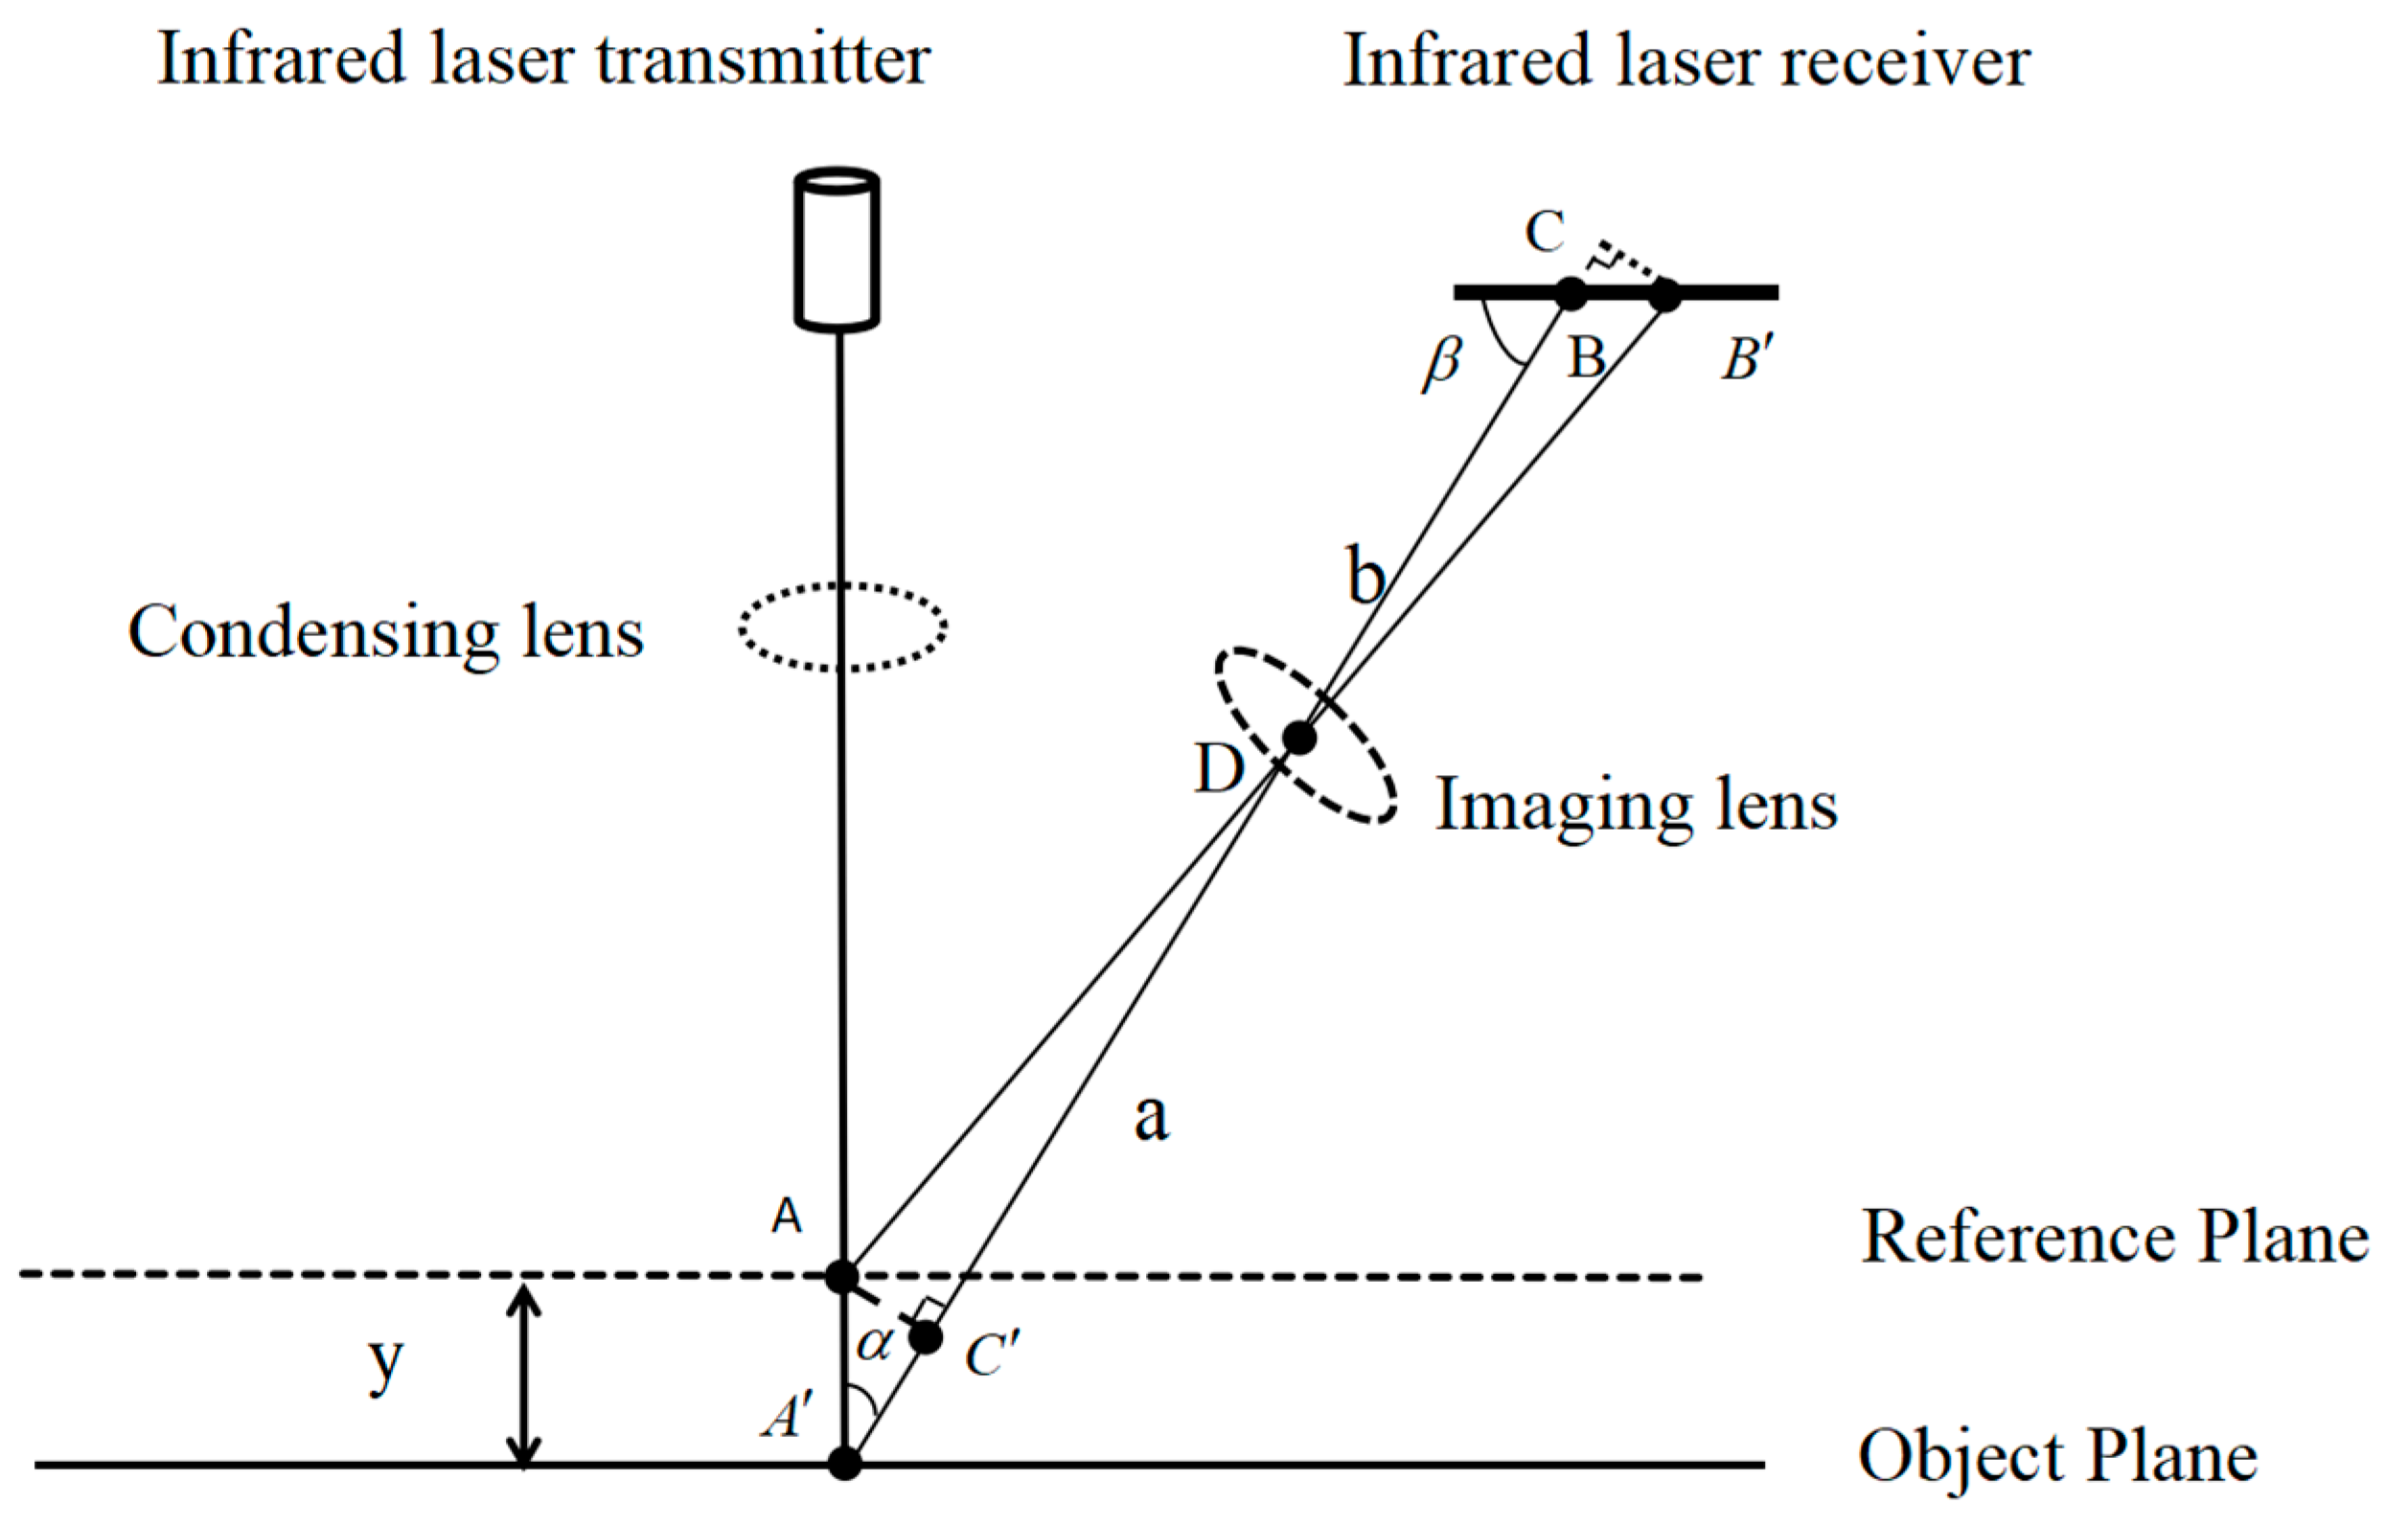
The detection principle of laser sensors
Laser triangulation can be divided into two types: direct triangulation and oblique triangulation. The difference between the two lies in whether the incident axis of the laser is parallel to the normal of the incident plane. Due to the advantages of high accuracy, fast speed, strong adaptability, small sensor volume, easy operation, and good interconnection with communication equipment, a laser sensor was selected as the measurement element based on the principle of direct triangulation.
The working principle of the laser ranging sensor is shown in Figure 2.
The principle of direct triangulation distance measurement is based on solving the principle of triangles, which calculates the distance between the target and the measuring instrument by using the time difference between when the laser beam is directly emitted and when it is reflected back to the measuring target [28]. The laser emits a beam to the surface being measured, which is parallel to the normal surface being measured. The laser irradiation point is A. After diffuse emission and lens D convergence, the laser converges into a spot on the photosensitive chip at position B. Subsequently, the measured surface undergoes displacement y, while the laser incidence angle remains unchanged. The position of the laser on the surface of the object changes to A′, and the position of the converging spot on the photosensitive chip changes with the position of the object surface. At this point, the position becomes B′, and the position of the spot on the photosensitive chip corresponds one-to-one with the position of the object surface within a certain range. The principle diagram of the straight-line triangulation method for distance measurement is shown in Figure 3.
In order to reduce errors, the straight-line triangulation method usually adjusts the angle of the laser beam, so that the laser beam is vertically directed towards the target. This can minimize the angle between the reflected light and the probe, avoiding the impact of angle errors on distance measurement. The calculation method for straight-line triangulation is as follows:
In Figure 3, the displacement value of y on the surface of the object can be calculated based on the similarity of the triangle. If the triangle is similar, then
A C B C = C D C D
Make: AA = y , BB = x , as shown in Figure 3:
A B A A = sin α
B C B B = sin β
  C D = AD y cos α
CB = BD + x cos β
The following can be launched:
y = A D x sin α B D sin α + sin ( α + β )
Within the range of measurement, the displacement value y can be calculated using this formula whether the surface of the object is close to or far from the laser.
(2)
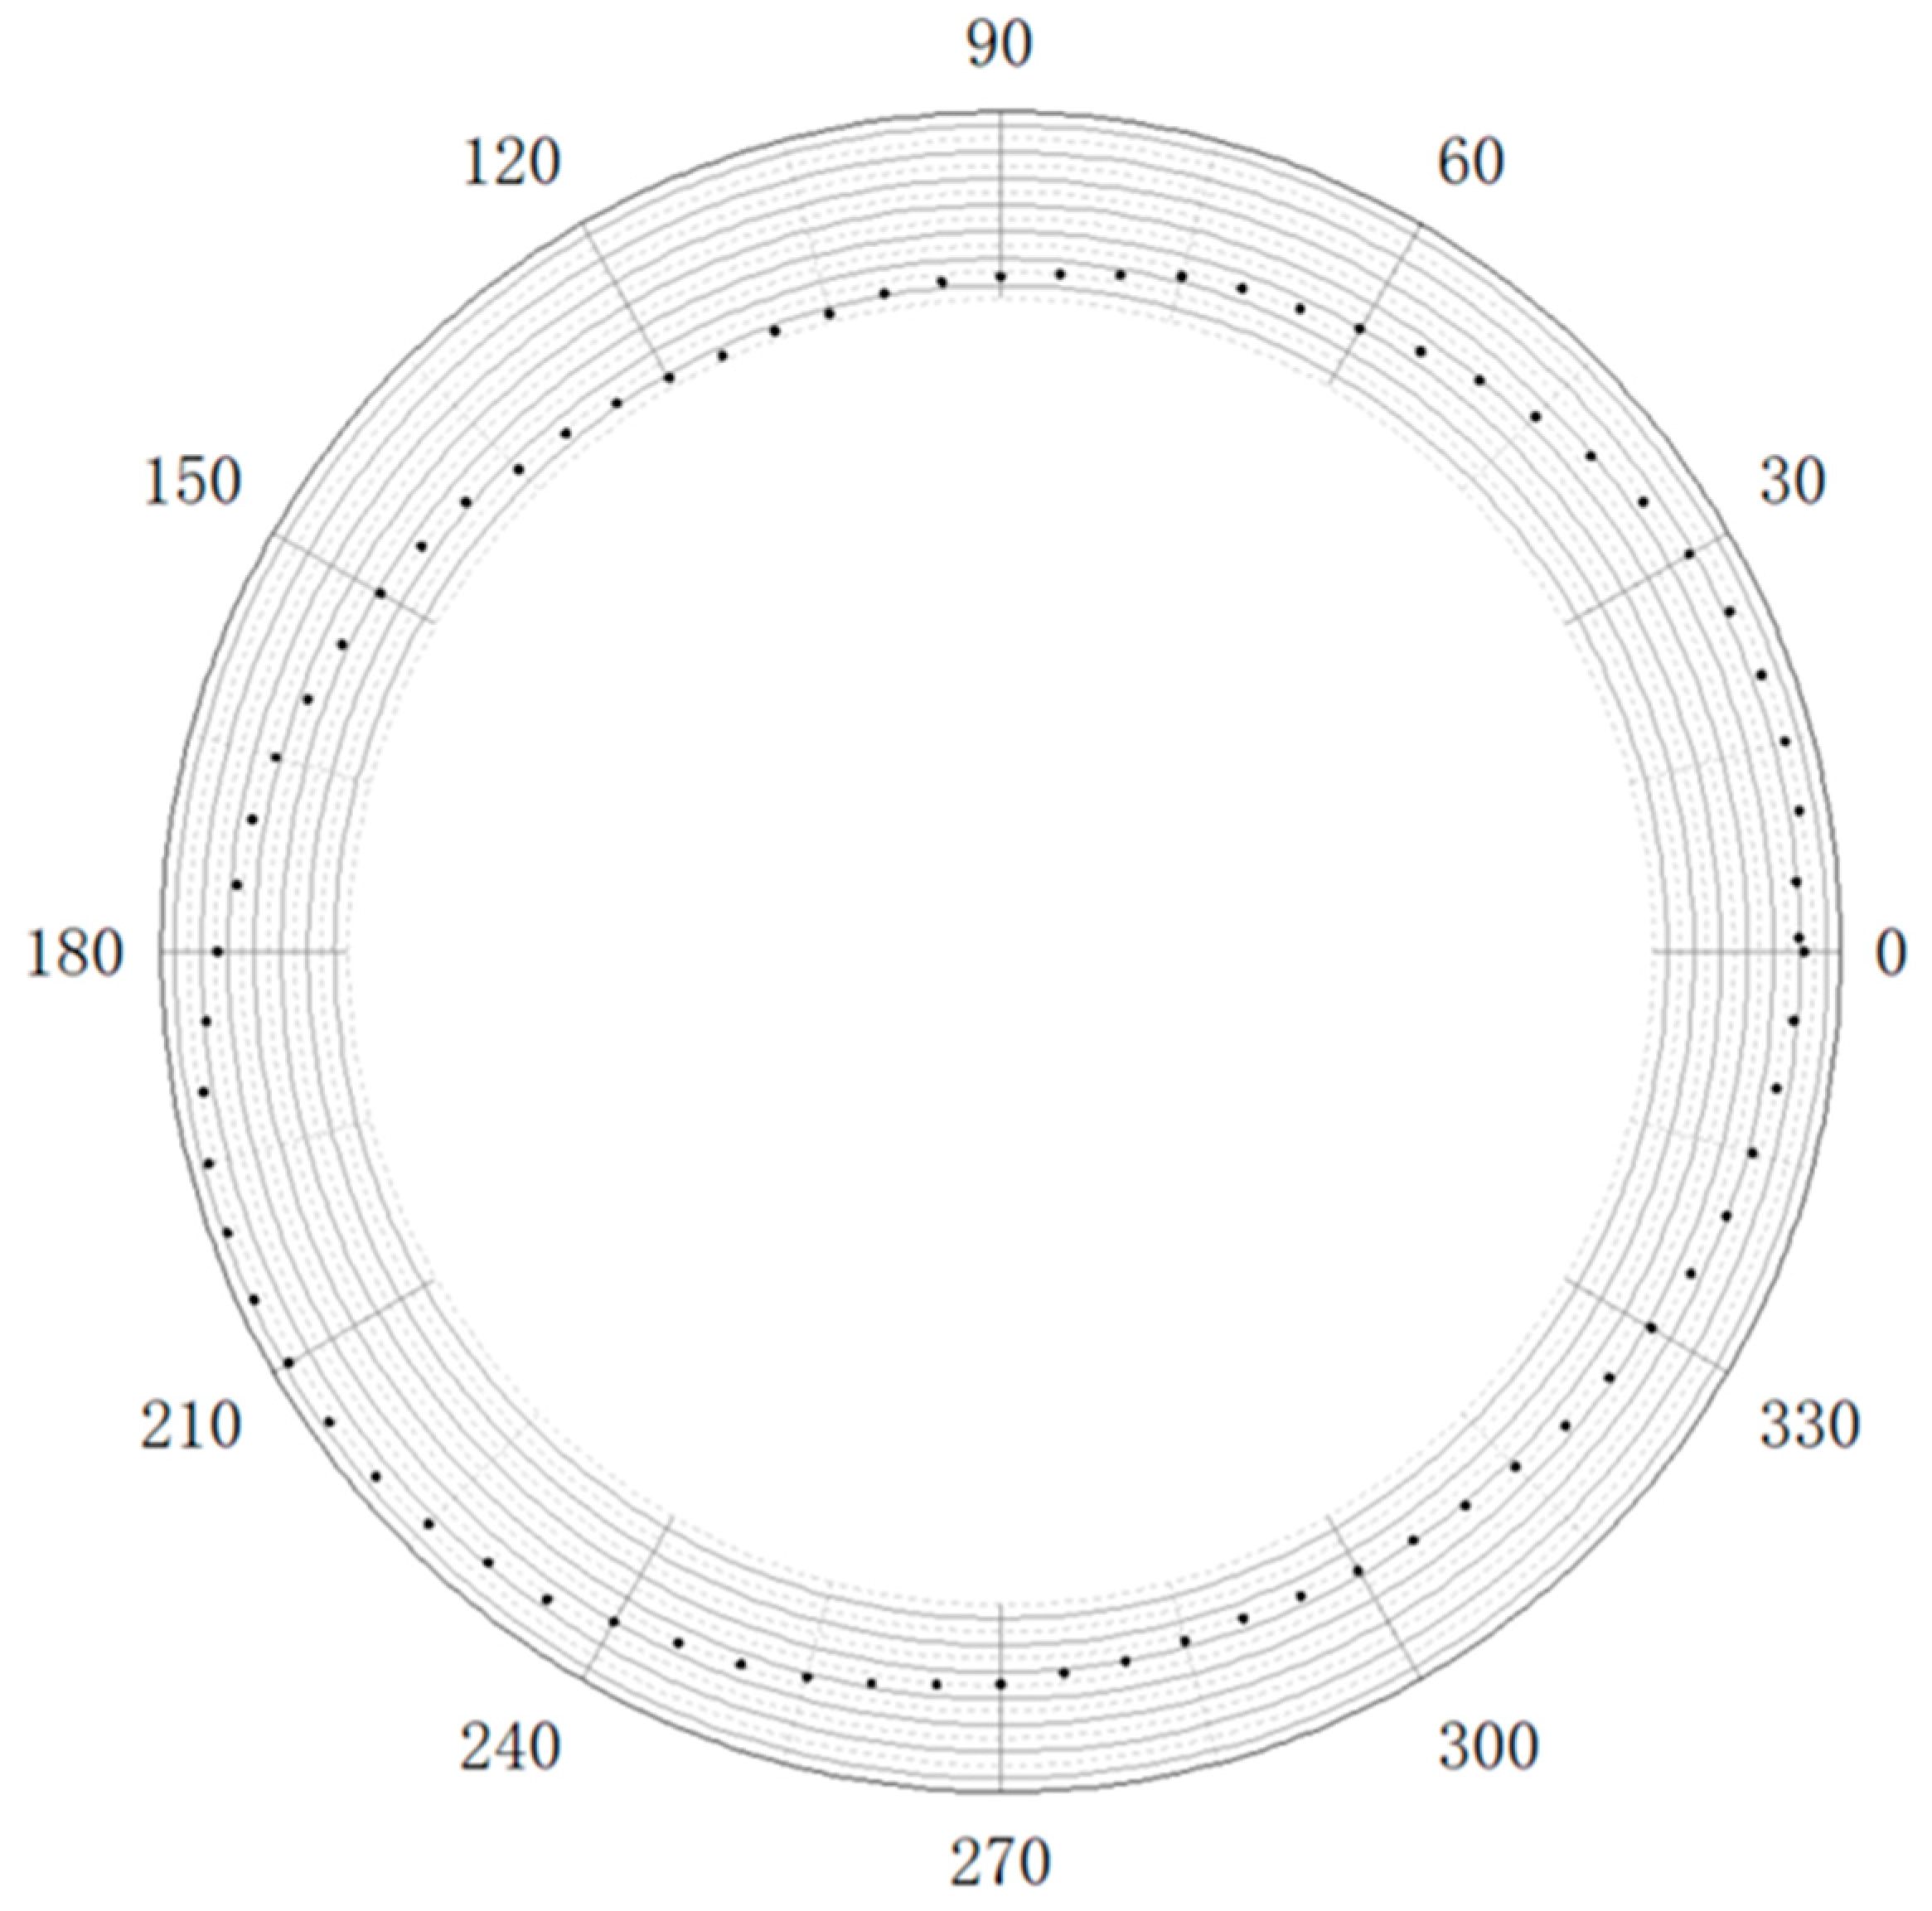
Circular traversal detection method for inner diameter of casing
In an ideal state, the casing profile is a regular circular shape, but the casing profile is approximately circular or irregularly elliptical due to processing technology and external pressure during use. Studying the size and position of the maximum and minimum diameters before and after deformation of the casing can evaluate the performance of the casing, as well as the distribution of ovality and the maximum deformation position. In order to achieve uniform extraction of the profile data about the casing, a circular traversal detection method suitable for small-sized casing is proposed. The principle of circumferential traversal detection inside the casing is shown in Figure 4.
In the measurement process, the center A′ of the detection device and the center A of the casing should be at the same point. However, in actual measurement, eccentricity can be caused by mechanical device installation or vibration during mechanical movement, which affects the accuracy of data detection. Therefore, it is necessary to use mathematical methods to eliminate eccentricity errors. To address these issues, a small-sized detection device is designed, and sensors are controlled through automatic control technology to perform multi-point, equal step circumference traversal detection of the inner profile of the inside casing.
The laser sensor selected in this device can collect more than 17,000 data points per second, and it takes 20 s to rotate one cycle. The large amount of data collection makes it difficult to store and analyze the data, so it is necessary to perform secondary filtering on the data. For this purpose, in the detection process, the PLC controls the laser sensor to rotate at a fixed angle α. The laser sensor collects m data points for each rotation α, filters out abnormal data points, and selects a data point from the fixed position of each arc to be placed in a data table. The monitoring data for one circle are sequentially screened and stored to obtain an effective data table to be processed. This completes the circumference traversal detection inside the casing. The total number of points collected during circular traversal and the measurement step size follow the below formula:
L = 360 / N
where:
  • L—Measurement step size;
  • N—Total number of points collected through circular traversal, N = 360 ° / α .
Based on the above data, a polar coordinate system can be established for the profile curve inside the casing. In Figure 4, when the center A′ is considered, the polar diameter R = r 1 + r 2 and the polar angle θ = n α ( n N + ) of point B. Therefore, the measured position can be represented by polar coordinates ( R i , θ i ) . For the convenience of calculation, the established polar coordinates are converted into a Cartesian coordinate system to obtain the Cartesian coordinate equation as follows:
x θ i = R θ i cos θ i y θ i = R θ i sin θ i

3. Experimental Casing Morphology and Detection Device

(1)
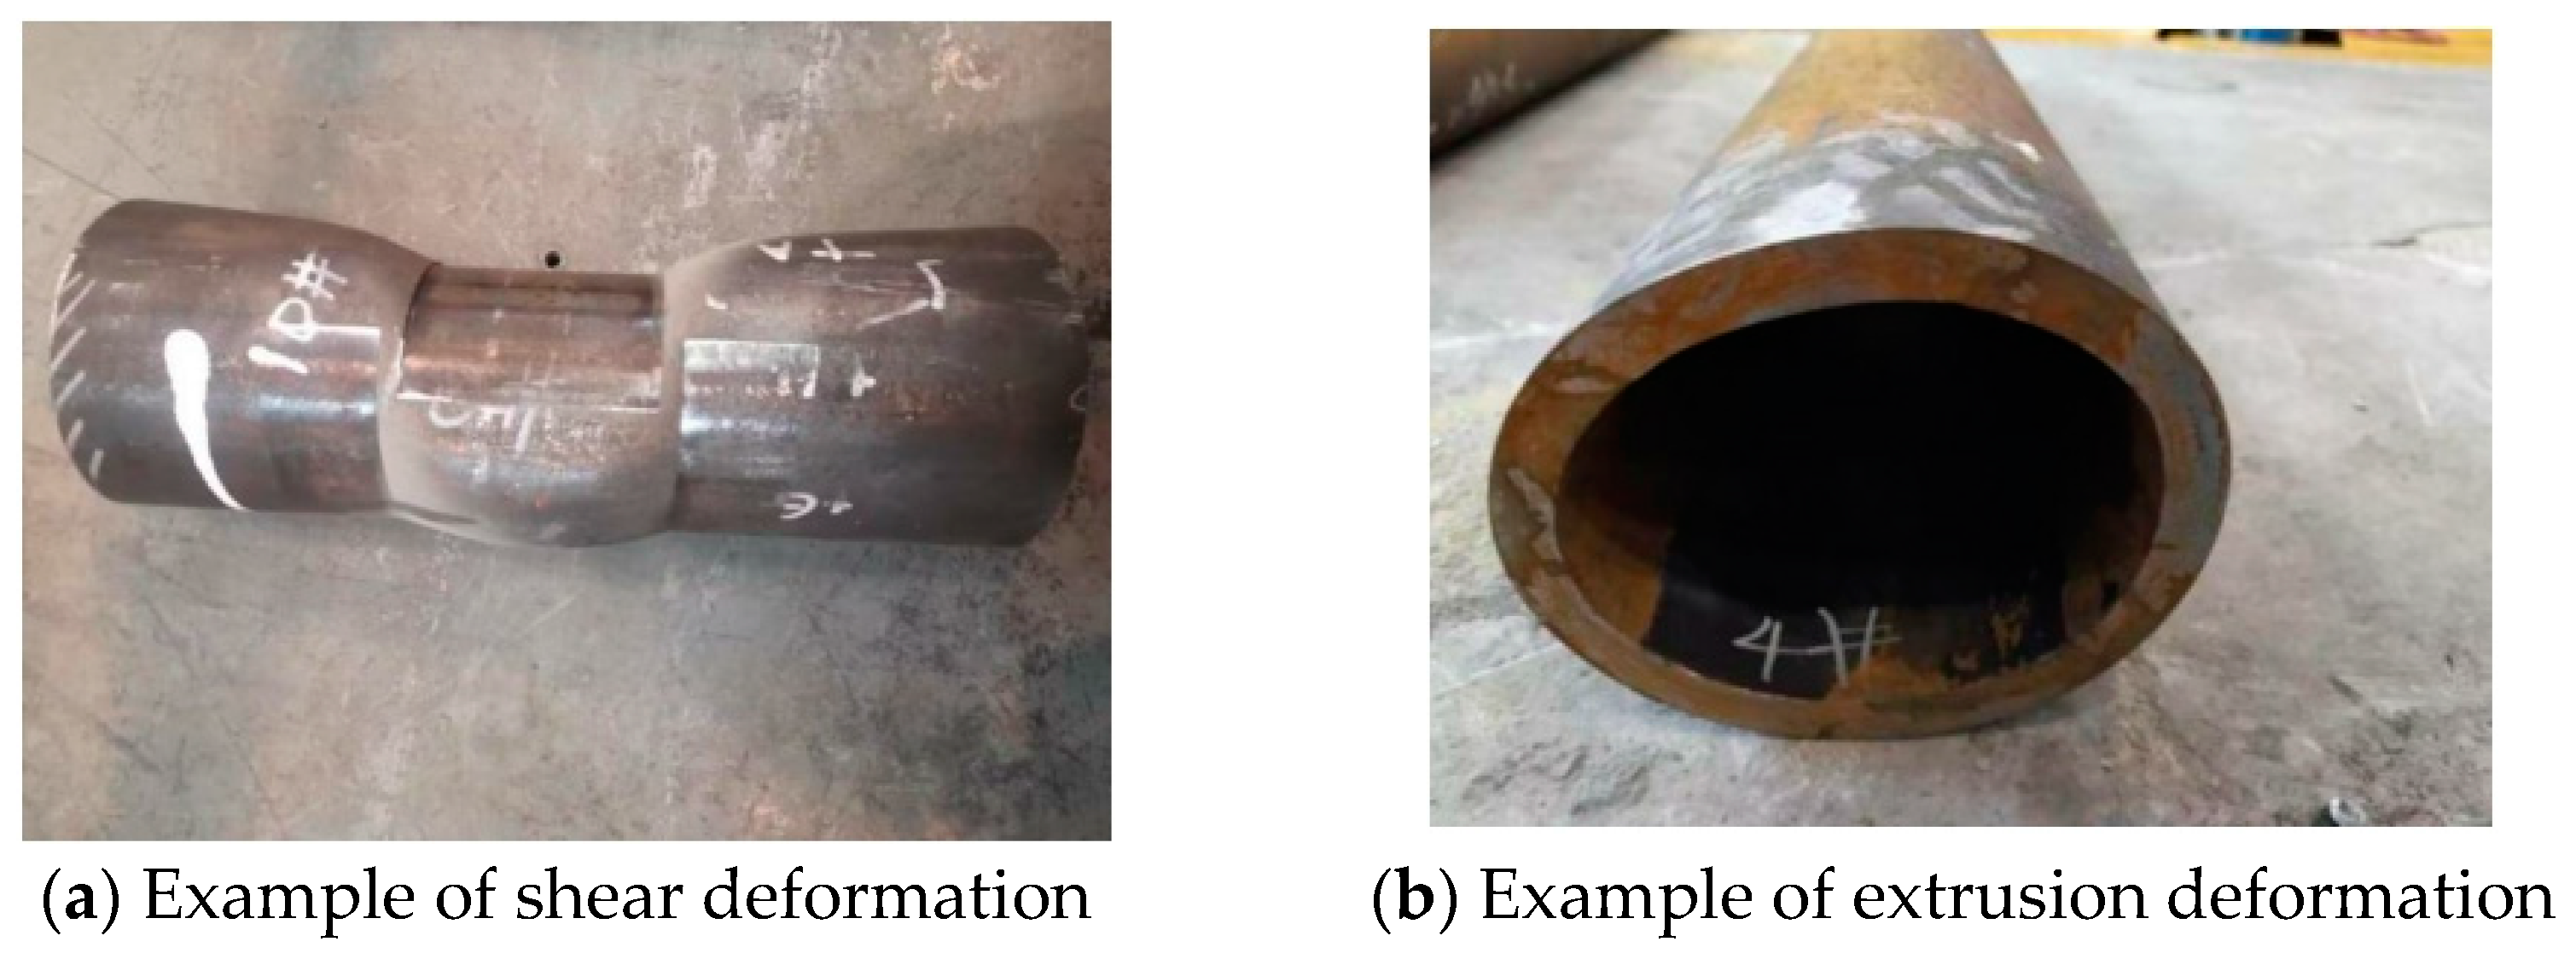
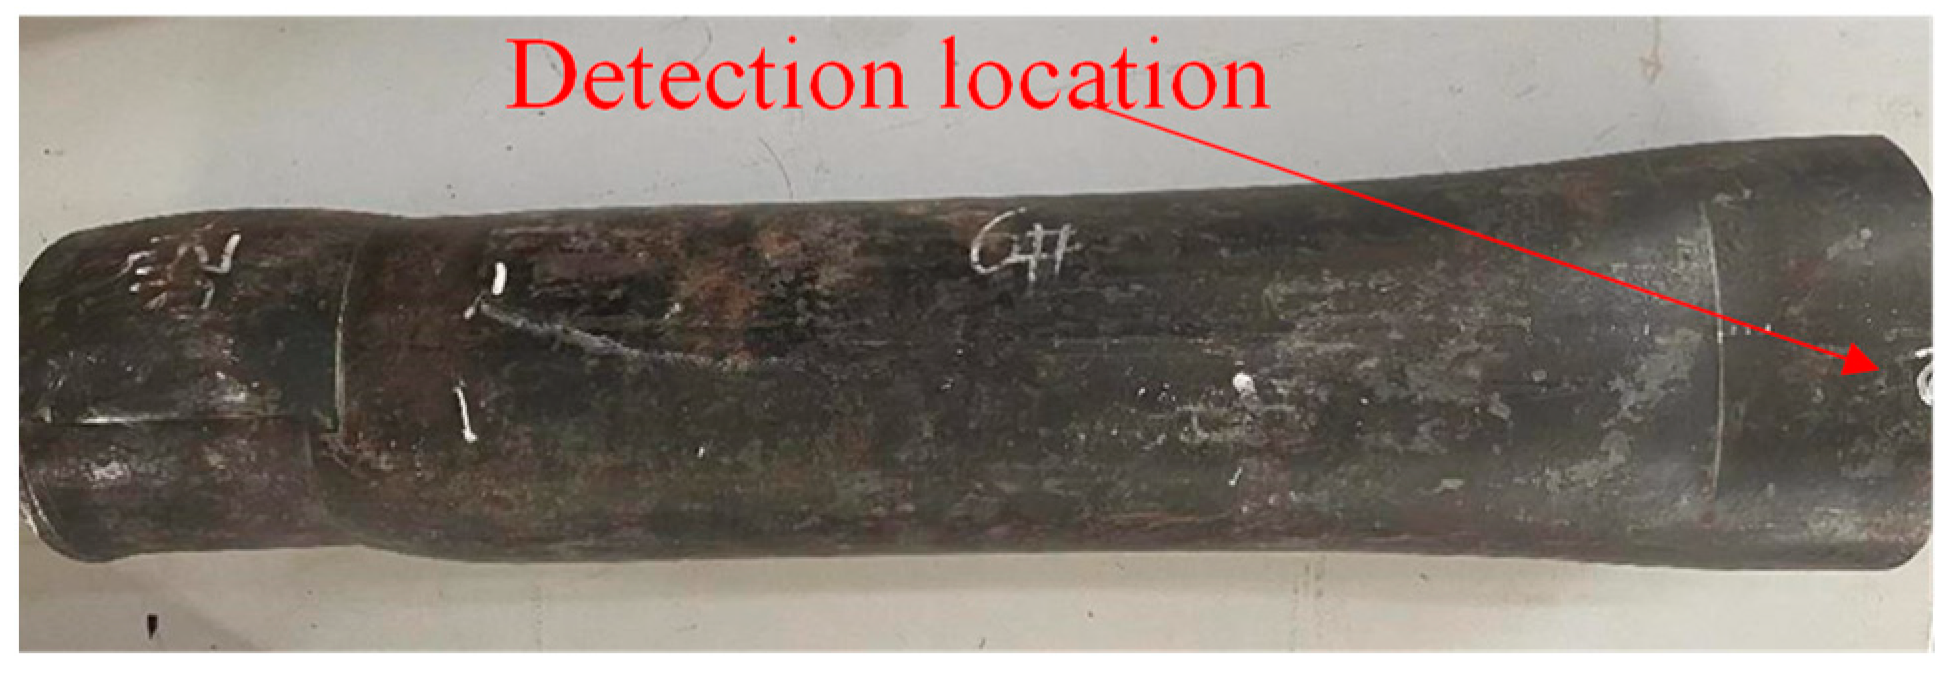
Deformation morphology of shale gas casing
During the completion and production processes of oil and gas wells, the casing may undergo compression deformation and shear deformation, as shown in Figure 5, and other phenomena due to the influences of the external environment and the working load.
(2)
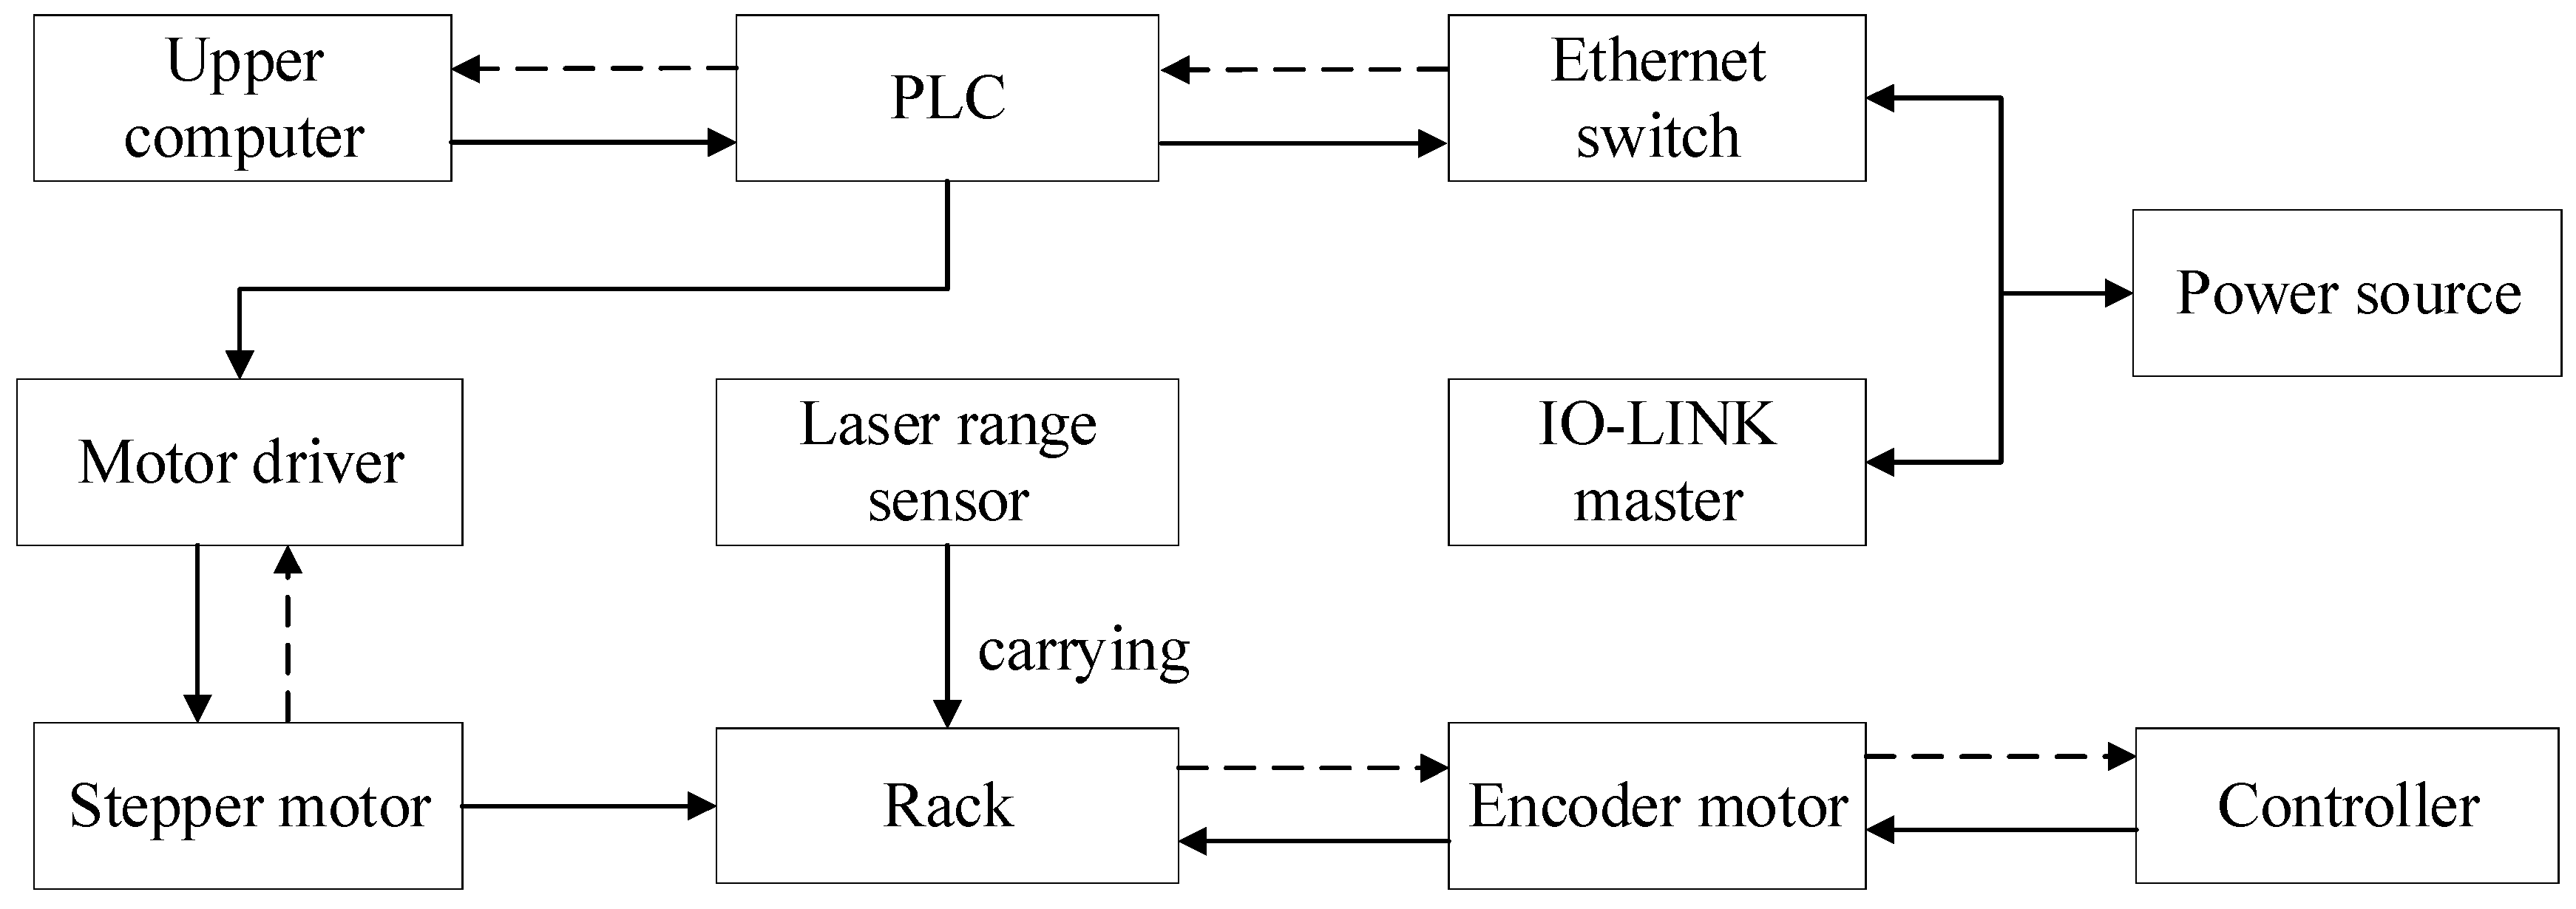
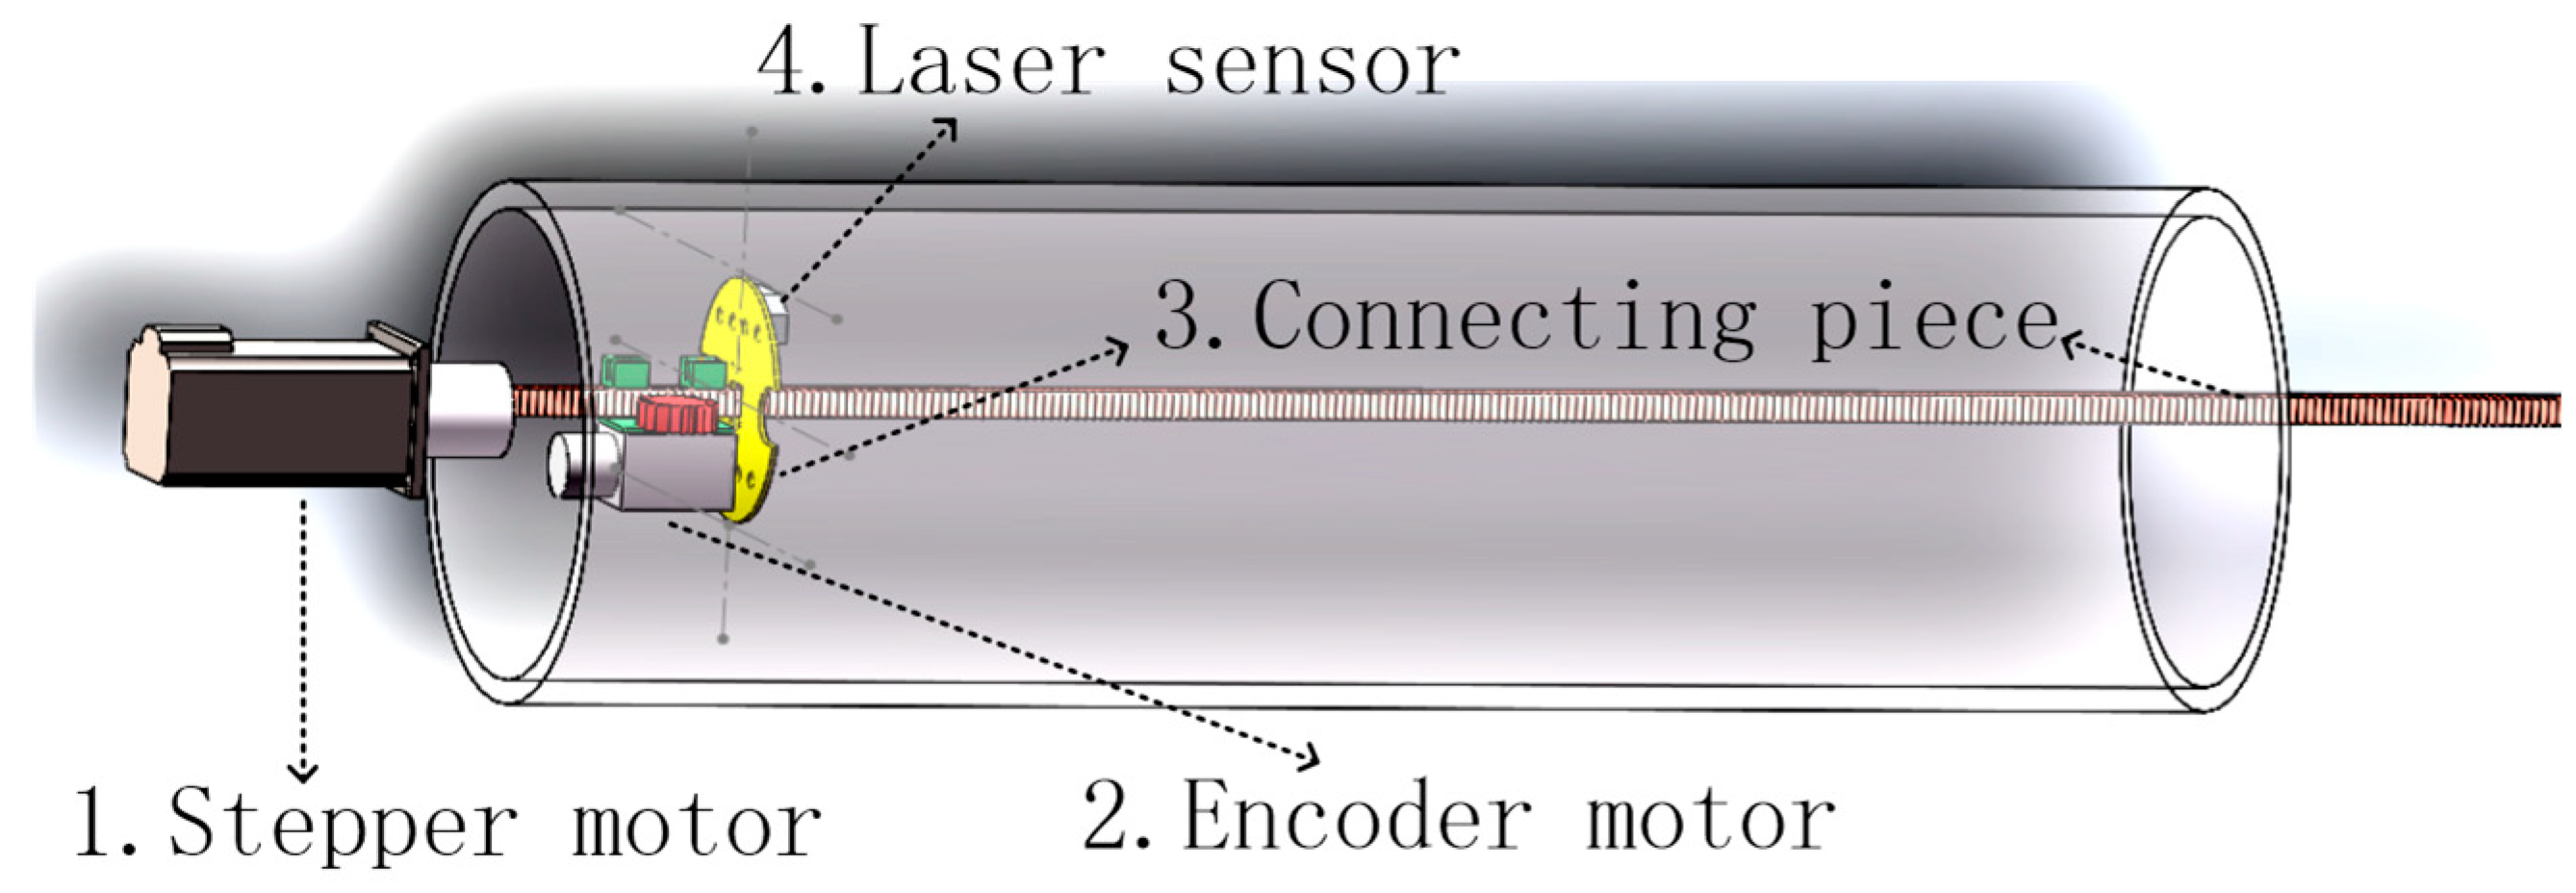
Design of detection device
The inner diameter of commonly used casing is relatively small due to the influence of shale gas extraction site conditions, and the size range is often between 50 mm and 200 mm. This is precisely due to their small size, the fact that general non-contact measuring devices are difficult to access, coupled with the insufficient measurement range and accuracy requirements of conventional laser displacement sensors. Therefore, an internal casing detection device which consists of a rotation control module, a casing internal travel control module, and a laser ranging module is designed. The casing deformation detection device is shown in Figure 6. The following design requirements have been met.
(1)
Selecting laser sensors with a small volume and high accuracy of short-distance measurements as measurement components;
(2)
Minimizing the mechanical devices that fix and drive sensor movement as much as possible;
(3)
The detection device needs to be able to move forward, backward, and perform circumferential measurements inside the casing.
Taking into account factors such as the detection conditions of the casing and the required characteristic values for casing deformation analysis, this detection device meets the following detection requirements:
(1)
The sensor can travel to the designated position inside the casing;
(2)
Comparison between measurement data and reference values is possible;
(3)
Extreme values of the measured data set are displayed inside the casing;
(4)
The curve graph displays a section of data inside the casing.

4. Methods for Eliminating Eccentricity Errors and Smoothing Curves

(1)
Eccentricity error elimination
The device can directly detect the curve profile of the measured position during the single circle measurement. If we only observe the deformation law before and after deformation, it is not necessary to determine the actual center of the casing. But, to detect the values of the maximum and minimum diameters before and after deformation, as well as their positions, or establish a three-dimensional model of the internal deformation of a section of casing, it is necessary to share a center for each set of data. In this case, it is necessary to eliminate the errors caused by eccentricity and the data values centered on A in Figure 4. Since ( R i , θ i ) is known, the distance R and angle θ from the detection point to A can be calculated. Therefore, when the coordinate system centered on A′ moves to the position centered on A, the polar diameter R i corresponding to the polar angle θ i is a function of the polar angle θ i , denoted as R θ i , and can be used to obtain the polar coordinate system R θ i , θ i centered on A.
However, the data collected by the detection device based on the principle of circular traversal are discrete, and these data values can be connected by straight lines to obtain a closed line graph connected by sequential straight lines. In order to reflect the continuity of bending deformation of elastic media in the measured data, it is necessary to combine the mathematical model of the inner profile of the casing to smooth the curve.
Taking the inner profile of the port position as an example in Figure 5b, the detection device extracts a measurement value for every 1° rotation from the starting point. The measured values marked in the polar coordinate system roughly show the trend of the profile. To obtain the profile curve that is closest to the actual situation, further processing of these discrete data is required. The data targets of the measured profile are shown in Figure 7.
(2)
Curve smoothing processing
The tested casing is not a standard circular or elliptical shape but a closed curve. In cases where some discrete data are known, but the function expression that satisfies these data is not known, the corresponding function expression can be derived through interpolation or data fitting. The difference between the two algorithms is that the interpolation function can pass through all known points, so when drawing the inner profile curve, it is possible to obtain a curve with smaller errors and smoother results. Therefore, the segmented cubic spline interpolation algorithm is chosen to derive the function formula of the inner profile of the casing, and then the available characteristic values such as maximum and minimum diameters can be automatically calculated through the upper computer program design.
After the detection device completes the measurement, if n + 1 data are detected, then these data have n intervals because each interval is not a standard arc, so the interval curve function is constructed as follows:
S i X i = A i + B i X X i + C i X X i 2 + D i X X i 3 = Y i i = 0 , 1 , 2 n 1
The function value at the corresponding discrete point for each interval data obtained under the function relationship Y = S X is as follows:
XX0····X1·····X2 ··· ··· Xn−1·····Xn
YY0····Y1·····Y2 ··· ··· Yn−1·····Yn
In Formula (9), there are four unknowns, A, B, C, and D, in each cubic function segment S X i , so solving these four unknowns requires four equations. We can infer from the following four conditions that the difference between the three samples must meet the following conditions:
Condition 1: If each cubic function must pass through two ending points, then
S i X i = Y i   i = 0 , 1 , 2 n
Condition 2: In order to ensure the smoothness of the curve, the function values of the previous equation and the following equation at the nodes are the same, that is
S i X i + 1 = S i + 1 X i + 1
Condition 3: In order to ensure that there are no drastic jumps on the original function, it is necessary for the function to have the same slope at the same node, as follows:
S i X i + 1 = S i + 1 X i + 1
Condition 4: If the function on the same node has the same degree of curvature, that is, if the curvature is the same, then there is the following:
S i X i + 1 = S i + 1 X i + 1
According to condition 1, it can be inferred that A i = Y i ;
By setting the sampling step size H i = X i + 1 X i based on condition 2, it can be inferred from Formula (11) that
A i + H i B i + H i 2 C i + H i 3 D i = S i + 1 X i + 1
From condition 3 and Formula (14), it can be inferred that
B i + 2 H i C i + 3 H i 2 D i B i + 1 = 0
Derived from condition 4:
2 C i + 6 H i D i 2 C i + 1 = 0
Make:
M i = S i X i = 2 C i
By substituting Formula (17) into Formula (16), it can be concluded that
D i = M i + 1 M i 6 H i
By substituting public announcements (17) and (18) into Formula (15), it can be concluded that
B i = Y i + 1 Y i H i H i 2 M i H i 6 M i + 1 M i
By utilizing the endpoint conditions S 0 X 0 = S n X n = 0 of the free boundary of cubic interpolation, to establish a matrix function, the matrix function can be solved to obtain the values of M i , and then to obtain the parameters C i . All unknown parameters of the corresponding spline function have been removed. A smooth curve that is closest to the actual situation can then be drawn through the upper computer. The smoothing curve corresponding to Figure 7 is shown in Figure 8. It can be seen that the curve in Figure 8 passes through all the detected data points, and that the curve is continuous and transitions smoothly at each data point, which better reflects the situation inside the casing.

5. Algorithm Testing

The system is used to detect the casing after compression and extrusion deformation, and the detection range is 96~246 mm. Taking 5.5 in and 7 in casings as examples, the corresponding inner diameters to be tested are 114.3 mm and 157.08 mm, respectively, as the internal profile curves of the casing after deformation detection.

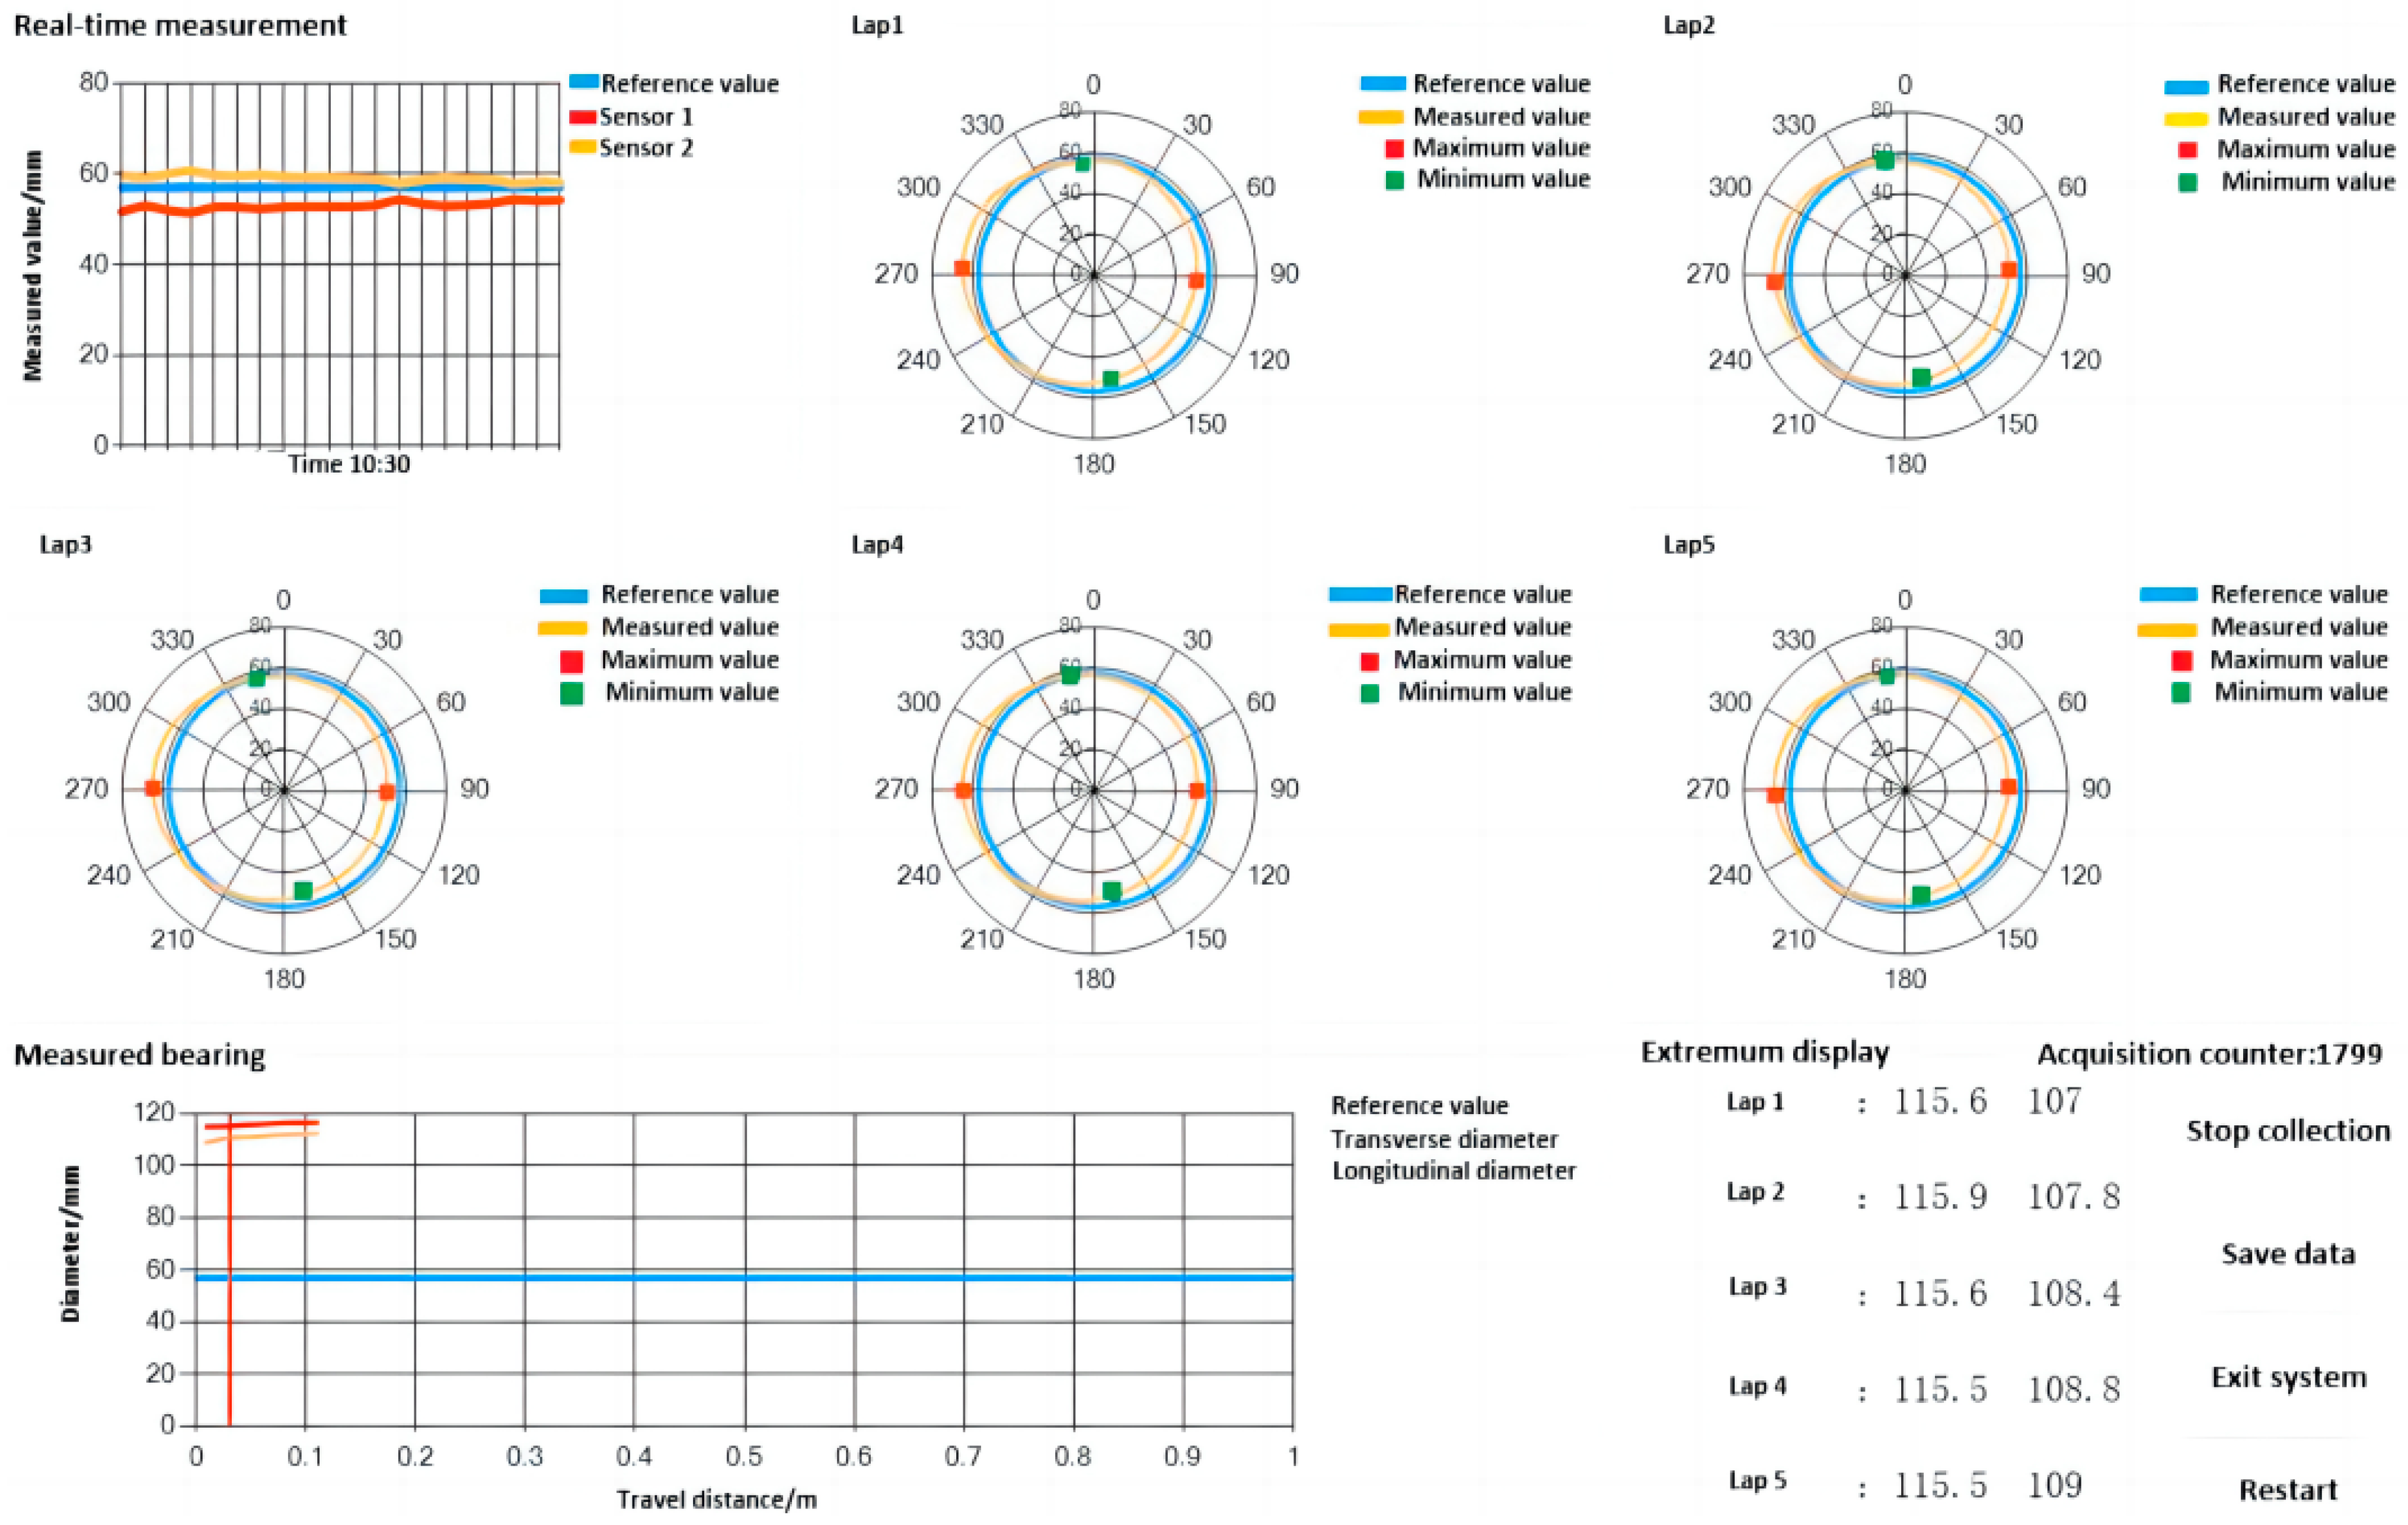
5.1. The Inner Diameter of the 114.3 mm Casing

After the installation and software of the detection system are completed, typical deformation casings are selected for detection to verify the software operability, hardware integrity, and sensor accuracy of the detection system. The specific parameters of the casing are shown in Table 1. The physical object of the tested casing is shown in Figure 9.
(1)
Data acquisition
Detection is carried out in a sleeve with an inner diameter of 114.3 mm and subjected to compression deformation. The traveling motor is set to travel at a speed of 2 cm/s. After the traveling motor runs to the designated position, data are measured every 5 mm. The rotating motor rotates for 30 s, and sensor data are recorded every 1°. Data are collected continuously for five cycles.
By using the upper computer to fit the data, a smooth curve can be obtained. The software interface results are shown in Figure 10.
(2)
Data processing
After the laser ranging sensor rotates in the casing for one revolution, the measurement data are sent to the upper computer. Based on the measurement starting point, one datum is taken for each 1° rotation, and the measurement data in Figure 10 are smoothed. The result is shown in Figure 11.
The results in Figure 10 have been extracted, and the extreme diameter values of each section are listed In Table 2.
The detection device smooths the detection curve, is displayed on the upper computer interface, automatically calculates the maximum and minimum diameters of the tested casing, and marks the extreme position in the graph. In the display interface, the mouse can directly point out the detection value at any position, and the image can also be enlarged, reduced, stored, andb exported, and other operations can also be carried out.
By calculating and analyzing the measured values, it can be seen that the measurement error is less than 0.1 mm when the sensor travels in a single direction inside the casing compared with the true values in Figure 11.

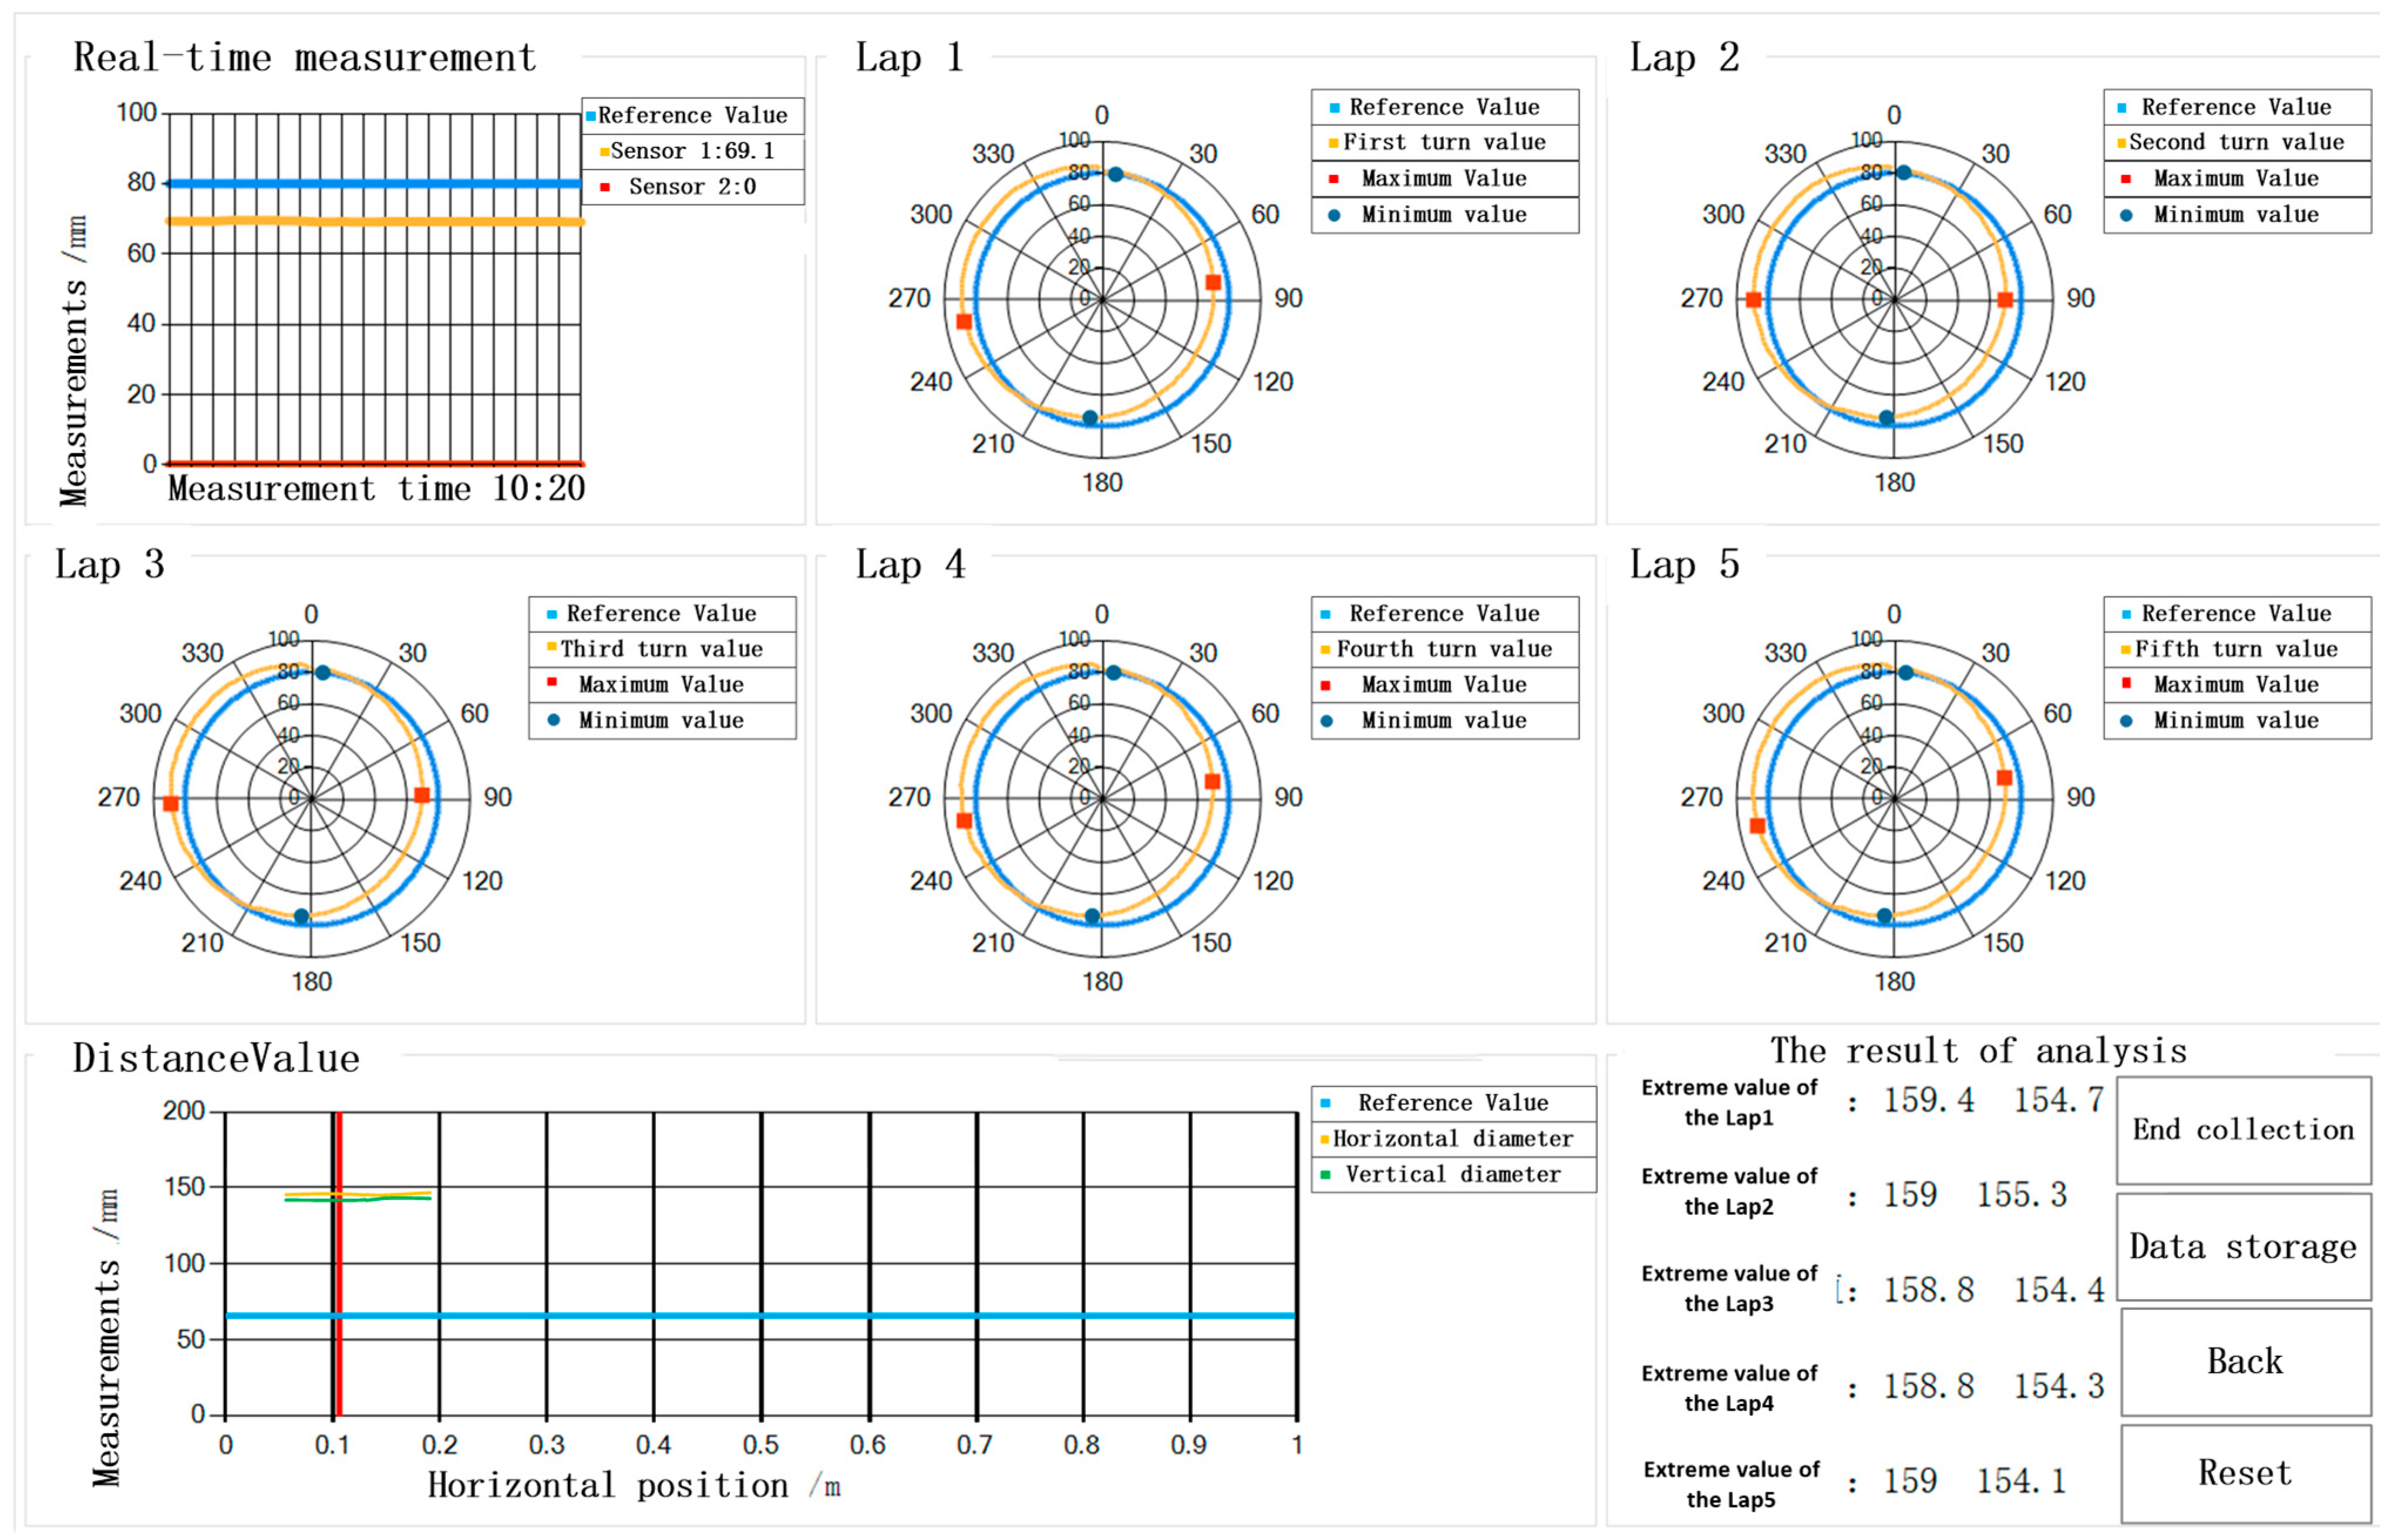
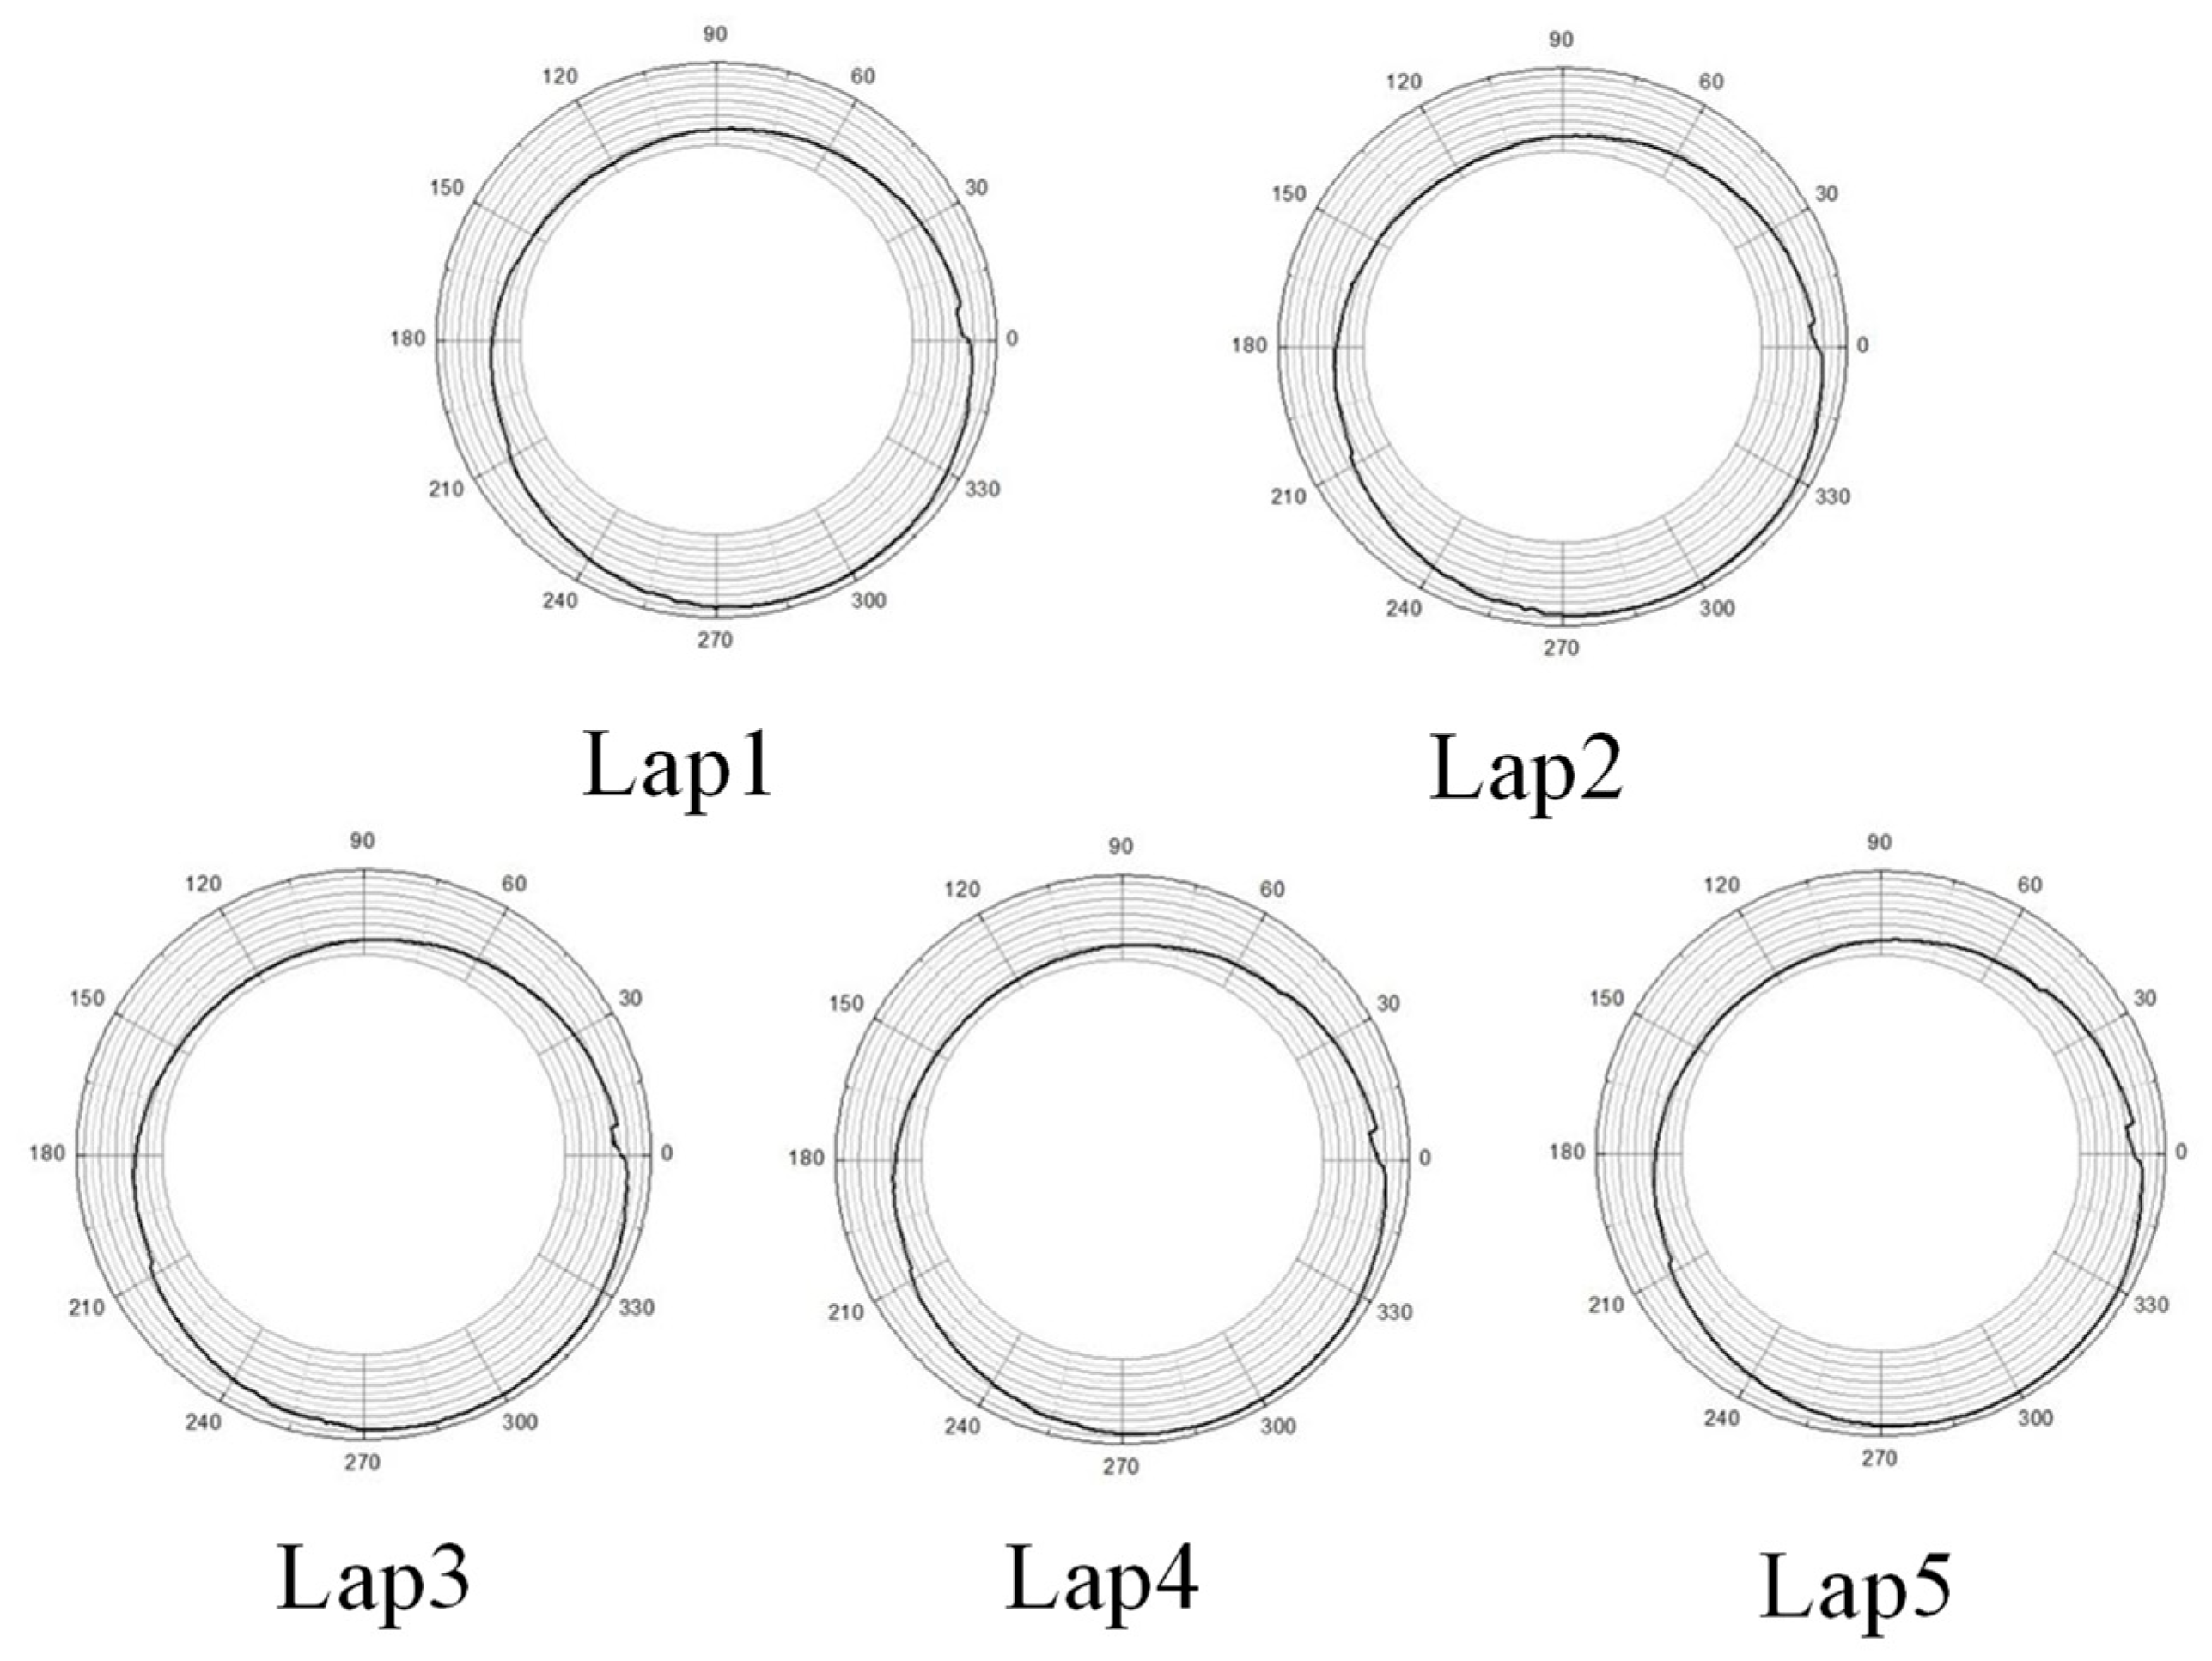
5.2. The Inner Diameter of the Casing Is 157.08 mm

The specific parameters of the tested casing are shown in Table 3, and the actual casing is shown in Figure 12.
(1)
Data collection
The detection was carried out in a casing with an inner diameter of 157.08 mm, which was subjected to compression deformation. The parameters of the detection device were set as shown in Example 1. Five consecutive rounds of data were collected at the test point, and the software interface results are shown in Figure 13.
(2)
Data processing
According to the detection device, the polar diameter value is collected every 1° rotation. The rotating device rotates inside the casing once to obtain 360 data points. A polar coordinate system is established, and the measurement data in Figure 13 are smoothed. The results are shown in Figure 14.
The extreme diameter values of each section in Figure 14 have been extracted and are listed in Table 4.
Calculating and analyzing the measured values shows that the absolute value of the measurement error is less than 0.1 mm when comparing the measured values in Table 4 with the actual values when the sensor travels in a single direction inside the casing.

6. Conclusions

A circumferential traversal method is used to collect discrete data of the casing under non-uniform extruding force. Real-time data transmission is carried out by laser ranging sensor, and an eccentric error correction algorithm is used to correct the eccentric error data. In order to improve detection accuracy, a cubic spline interpolation function (similar to the real curve) is used to solve the function model to optimize data accuracy. The main conclusions are as follows:
(1) The deformation section morphology of casing caused by shear and non-uniform external compression loads is relatively complex, and the spatial continuity is poor. A traversal detection method is used to obtain a sufficient number of discrete points to meet the characteristic values of the deformation cross-section morphology of shale gas casing.
(2) A cubic spline interpolation function is selected to solve the function model that resembles the true curve through the discrete data collected by the laser ranging sensor. The application of segmented interpolation compensates for the drawback of data fitting, while avoiding the occurrence of high-order Runge–Kutta phenomenon and improving testing accuracy.
(3) On the basis of cubic spline curves, an eccentricity error correction algorithm is derived to achieve eccentricity error correction during the detection process. This algorithm can effectively eliminate eccentricity errors in measurement, achieve accurate characteristic values of deformed casings, and detect casings with different diameters and compression deformation, with a measurement accuracy of ±0.1 mm.
(4) For the field use of instruments and equipment, the reliability and accuracy of the measurement should be further studied under the influence of environmental loads.

Author Contributions

S.Y.: methodology, investigation, writing—original draft. Y.M.: formal analysis, validation, investigation, funding acquisition. J.C.: writing—review and editing, investigation. Y.Y.: validation, investigation. All authors have read and agreed to the published version of the manuscript.

Funding

This research was funded by the Innovative Talents Promotion Program—Young Science and Technology Nova Project (2021KJXX-63), research on key technology of casing damage evaluation and repair in oil and gas wells (2021DJ2705), and study of key technology of stimulation and modification for Gulong shale oil (2021ZZ10-04).

Data Availability Statement

Data are contained within the article. The original contributions presented in the study are included in the article, further inquiries can be directed to the corresponding author.

Conflicts of Interest

Authors: Shangyu Yang, Yisheng Mou, Jing Cao, and Yan Yan are employed by the company CNPC Tubular Goods Research Institute. The authors declare that the research was conducted in the absence of any commercial or financial relationships that could be construed as potential conflicts of interest.

References

  1. Rui, S.; Fei, L.; Zhao, Y.; Li, G.; Yu, W. Analysis of Influential factors of multi-cluster fracturing casing stress in shale gas wells. China Pet. Mach. 2023, 51, 148–156. [Google Scholar]
  2. Xi, Y.; Li, J.; Liu, G.; Zeng, Y.; Li, J. Overview of casing deformation in multistage fracturing of shale gas horizontal wells. Spec. Oil Gas Reserv. 2019, 26, 1–6. [Google Scholar]
  3. Chen, Z.; Shi, L.; Xiang, D. Mechanism of casing deformation in the Changning–Weiyuan national shale gas demonstration area and countermeasures. Nat. Gas Ind. B 2017, 4, 1–6. [Google Scholar] [CrossRef]
  4. Yan, W.; Zou, L.; Li, H.; Deng, J.; Ge, H.; Wang, H. Investigation of casing deformation during hydraulic fracturing in high geo-stress shale gas play. J. Pet. Sci. Eng. 2017, 150, 22–29. [Google Scholar] [CrossRef]
  5. Han, L.; Li, X.; Liu, Z.; Duan, G.; Wan, Y.; Guo, X.; Cuo, W.; Cui, Y. Influencing factors and prevention measures of casing deformation in deep shale gas wells in Luzhou block, southern Sichuan Basin, SW China. Pet. Explor. Dev. 2023, 50, 979–988. [Google Scholar] [CrossRef]
  6. Lu, Q.; Liu, Z.; Guo, J.; He, L.; Li, Y.; Zeng, J.; Ren, S. Hydraulic fracturing induced casing shear deformation and a prediction model of casing deformation. Pet. Explor. Dev. 2021, 48, 460–468. [Google Scholar] [CrossRef]
  7. Salimov, F.L.; Plugin, S.; Kramer, H. Successful application of through casing logging technology toincrease oil production in a brown field well. In Proceedings of the SPE Russian Oil and Gas Exploration and Production Technical Conference and Exhibition, Moscow, Russia, 14–16 October 2014. [Google Scholar]
  8. Hughes, M.A.; Kramer, H.; Ramli, M.N.; Abdul Razak, R.; Valouiski, K. Successful application of through casing saturation technology to increase oil production in an Offsgore mature well. In Proceedings of the International Petroleum Technology Conference, Kuala Lumpur, Malaysia, 10–12 December 2014. [Google Scholar]
  9. Yin, F.; Han, L.; Yang, S.; Deng, Y.; He, Y.; Wu, X. Casing deformation from fracture slip in hydraulic fracturing. J. Pet. Sci. Eng. 2018, 166, 235–241. [Google Scholar] [CrossRef]
  10. Bingyin, J.; Fu, Y.; Meng, L.; Sun, J.; Sun, J. Full-scale test and new mechanism on collapsing strength of shale gas casing under nonuniform load. China Pet. Mach. 2023, 51, 148–154. [Google Scholar]
  11. Dong, Z.; Tang, S. Numerical study of near-wellbore hydraulic fracture propagation. Theor. Appl. Fract. Mech. 2019, 103, 102274. [Google Scholar] [CrossRef]
  12. Zhang, W.; Li, J.; Zhang, H.; Wang, D.; Li, T.; Liu, H. Influence of fault slip on casing shear deformation and its prevention and control measures. Fault-Block Oil Gas Field 2023, 30, 734–742. [Google Scholar]
  13. Huang, X.; Shen, H.; Sun, J.; Lv, K.; Liu, J.; Dong, X.; Luo, S. Nanoscale Laponite as a Potential Shale Inhibitor in Water-Based Drilling Fluid for Stabilization of Wellbore Stability and Mechanism Study. ACS Appl. Mater. Interfaces 2018, 10, 33252–33259. [Google Scholar] [CrossRef] [PubMed]
  14. Hui, L. Application of Multiarm Diameter and Electromagnetic Thickness Measurement TOOL Combination Logging of Casing Inspection in Changqing Oil field. Pet. Tubul. Goods Instrum. 2022, 8, 81–84. [Google Scholar]
  15. Xin, J.; Chen, J.; Li, X.; Wang, C.; Zhang, X.; Zhu, H. Advances in Oil and Gas Pipeline Internal Inspection Technology. China Pet. Mach. 2022, 50, 119–126. [Google Scholar]
  16. Dai, L.; Zhang, S.; Zhu, X.; Zhang, W.; Wang, D. Research progress of oil and gas pipeline diameter detector technology. Oil Gas Storage Transp. 2012, 31, 808–813. [Google Scholar]
  17. Chen, J.; Wang, J.; Ma, Y.; He, R.; Jin, Y. Internal inspection technology of pipeline cathodic protection based on current measurement. Nondestruct. Test. 2018, 40, 9–11, 31. [Google Scholar]
  18. Min, X.; Yang, L.; Wang, G.; Rao, X.; Liu, B. Weak Magnetism Stress Internal Testing Technology of the Long Distance Oil-gas Pipeline. J. Mech. Eng. 2017, 53, 19–27. [Google Scholar] [CrossRef]
  19. Zhang, W.; Sun, H.; Tao, A.H.; Li, Y.J.; Shi, Y.B. Local defect detection of ferromagnetic metal casing based on pulsed eddy current testing. IEEE Trans. Instrum. Meas. 2022, 71, 6003109. [Google Scholar] [CrossRef]
  20. Xu, F.; Huang, H.; Luo, Q. Quantitative Evaluation Method of Eddy Current Detection Data for Deformation Defects in Oil and Gas Well Casing. Log. Tech. 2021, 45, 584–591. [Google Scholar]
  21. Xie, M.; Tian, Z. A review on pipeline integrity management utilizing in-line inspection data. Eng. Fail. Anal. 2018, 92, 222–239. [Google Scholar] [CrossRef]
  22. Ege, Y.; Coramik, M. A new measurement system using magnetic flux leakage method in pipeline inspection. Measurement 2018, 123, 163–174. [Google Scholar] [CrossRef]
  23. Khodayari-Rostamabad, A.; Reilly, J.P.; Nikolova, N.K.; Hare, J.R.; Pasha, S. Machine learning techniques for the analysis of magnetic flux leakage images in pipeline inspection. IEEE Trans. Magn. 2009, 45, 3073–3084. [Google Scholar] [CrossRef]
  24. Piao, G.; Guo, J.; Hu, T.; Deng, Y.; Leung, H. A novel pulsed eddy current method for high-speed pipeline inline inspection. Sens. Actuators A Phys. 2019, 295, 244–258. [Google Scholar] [CrossRef]
  25. Long, Y.; Zhang, J.; Huang, S.; Peng, L.; Wang, W.; Wang, S.; Zhao, W. A novel crack quantification method for ultra-high-definition magnetic flux leakage detection in pipeline inspection. IEEE Sens. J. 2022, 22, 16402–16413. [Google Scholar] [CrossRef]
  26. Ma, Q.; Tian, G.; Zeng, Y.; Li, R.; Song, H.; Wang, Z.; Gao, B.; Zeng, K. Pipeline in-line inspection method, instrumentation and data management. Sensors 2021, 21, 3862. [Google Scholar] [CrossRef] [PubMed]
  27. Fei, C.; Bai, G.; Chao, T. Extremum Response Surface Method for Casing Radial Deformation Probabilistic Analysis. J. Aerosp. Inf. Syst. 2013, 10, 1. [Google Scholar] [CrossRef]
  28. Cuan, Y.; Wang, S.; Han, J. Research on Deformation Detection Method of Oil and Gas Well Casing Based on Curve Fitting. J. Phys. Conf. Ser. 2019, 1325, 012218. [Google Scholar] [CrossRef]
  29. Cohen, A.; Migliorati, G. Optimal weighted least-squares methods. SMAI J. Comput. Math. 2017, 3, 181–203. [Google Scholar] [CrossRef]
  30. Hong, S.H.; Wang, L.; Truong, T.K.; Lin, T.C.; Wang, L.J. Novel approaches to the parametric cubic-spline interpolation. IEEE Trans. Image Process. 2012, 22, 1233–1241. [Google Scholar] [CrossRef]
  31. Maekawa, T.; Matsumoto, Y.; Namiki, K. Interpolation by geometric algorithm. Comput.-Aided Des. 2007, 39, 313–323. [Google Scholar] [CrossRef]
  32. Qiu, Z.; Shen, M.; Jia, C.; Chen, J.; Feng, R. Laser distance measurement technology research status and development trend. Laser J. 2023, 44, 1–8. [Google Scholar]
  33. Sun, Y.; Pang, Y.; Bai, Z.; Wang, Y.; Lv, Z. Application technology of laser triangulation. Laser J. 2021, 42, 1–8. [Google Scholar]
  34. Kienle, P.; Köhler, M.H.; Wang, K.; Jakobi, M.; Koch, A.W. Increasing the sensitivity of laser triangulation systems using structured optical surfaces. In Proceedings of the ODS 2020: Industrial Optical Devices and Systems, Online, 24 August–4 September 2020; Volume 11500, pp. 56–64. [Google Scholar]
  35. Suh, Y.S. Laser sensors for displacement, distance and position. Sensors 2019, 19, 1924. [Google Scholar] [CrossRef]
  36. Salgado, C.F.A.; Maestre, L.E.P.; Noriega, L.A.; Castro, J.R. Distance Aproximator Using IEEE 802.11 Received Signal Strength and Fuzzy Logic. In Proceedings of the 11th Mexican International Conference on Advances in Computational Intelligence—Volume Part II, San Luis Potosi, Mexico, 27 October–4 November 2012; Springer: Berlin/Heidelberg, Germany. [Google Scholar] [CrossRef]
  37. Reza, S.A.; Khwaja, T.S.; Mazhar, M.A.; Niazi, H.K.; Nawab, R. Improved laser-based triangulation sensor with enhanced range and resolution through adaptive optics-based active beam control. Appl. Opt. 2017, 56, 5996–6006. [Google Scholar] [CrossRef] [PubMed]
  38. Wallace, L. Understanding laser-based 3D triangulation methods. Vis. Syst. Des. 2015, 20, 31–35. [Google Scholar]
  39. Walker, C.L.; Robinson, N.E. Inline Surface Dimensional Flaw Detection and OD/Ovality Measurement Using Laser Line Triangulation on Round Product. Wire & Cable Technology International, 2 November 2022. [Google Scholar]
Figure 1. The whole system structure diagram.
Processes 12 01435 g001
Figure 2. Schematic diagram of the working principle of the laser ranging sensor.
Processes 12 01435 g002
Figure 3. Principle diagram of straight-line triangulation distance measurement.
Processes 12 01435 g003
Figure 4. Principle of circumferential traversal detection inside the casing.
Processes 12 01435 g004
Figure 5. Common examples include casing deformation.
Processes 12 01435 g005
Figure 6. Deformation detection device inside the casing.
Processes 12 01435 g006
Figure 7. Display of measurement data in polar coordinate system.
Processes 12 01435 g007
Figure 8. Smoothed inner profile curve of casing.
Processes 12 01435 g008
Figure 9. The 5.5-inch test casing.
Processes 12 01435 g009
Figure 10. The 5.5 in casing measurement results displayed on the upper computer.
Processes 12 01435 g010
Figure 11. Smoothed sectional view of deformation data inside the 5.5-inch casing after processing.
Processes 12 01435 g011
Figure 12. The 7-inch test casing.
Processes 12 01435 g012
Figure 13. The 7-inch casing measurement results as displayed on the upper computer.
Processes 12 01435 g013
Figure 14. Cross-section view of smoothed deformation data inside the 7-inch casing.
Processes 12 01435 g014
Table 1. Specific parameters of 5.5 in casing.
NameLength (mm)Outer Diameter (mm)Inner Diameter (mm)Wall Thickness (mm)Detection Position (mm)
casing70012711413550
Table 2. 5.5 inch casing detection extreme values (mm).
Serial NumberMeasurement Value (Max)True Value (Max)Error
Absolute Value
Serial NumberMeasurement Value (min)True Value (min)Error
Absolute Value
Lap1115.6115.55 0.05 Lap1107.0106.96 0.04
Lap2115.6115.55 0.05 Lap2107.6107.55 0.05
Lap3115.6115.55 0.05 Lap3108.5108.48 0.02
Lap4115.7115.68 0.02 Lap4108.8108.71 0.09
Lap5115.5115.47 0.03 Lap5109.7109.62 0.08
Table 3. Specific parameters of 7-inch casing.
NameLength (mm)Outer Diameter (mm)Inner Diameter (mm)Wall Thickness (mm)Detection Location (mm)
Casing700177.8157.08103.6From the right end 200 mm
Table 4. Extreme values for 7-inch casing detection (mm).
Serial NumberMeasurement Value (Max)True Value (Max)Error
Absolute Value
Serial NumberMeasurement Value (min)True Value (min)Error
Absolute Value
Lap1159.4159.37 0.03 Lap1154.7154.68 0.02
Lap2159159 0Lap2155.3155.31 0.01
Lap3158.8158.85 0.05 Lap3154.4154.35 0.05
Lap4158.8158.9 0.01Lap4154.3154.23 0.07
Lap5159158.97 0.03 Lap5154.1154.14 0.04
Disclaimer/Publisher’s Note: The statements, opinions and data contained in all publications are solely those of the individual author(s) and contributor(s) and not of MDPI and/or the editor(s). MDPI and/or the editor(s) disclaim responsibility for any injury to people or property resulting from any ideas, methods, instructions or products referred to in the content.

