Abstract
The parameters of coalbed methane reservoirs have large differences, and the precise values cannot represent the resource and production characteristics of the whole block. In order to address these problems, an index system for evaluating the production potential of coalbed methane blocks was constructed, the weights of evaluation parameters were determined, and a model for the preferential selection of coalbed methane blocks based on the subjective–objective combination of weights method was established. The main coal seams (No. 2-1 and No. 4-2) of the Pingdingshan-Shoushan I Mine Block were taken as the research objects to rank the development potential of CBM blocks in a preferential way. The results show that the six resource and production parameters of No. 2-1 coal are gas content, top and bottom rock properties, coal seam thickness, coal seam depth, coal body structure, and tectonic conditions, in descending order of importance, and the parameters of No. 4-2 coal are gas content, coal body structure, coal seam thickness, top and bottom rock properties, coal seam depth, and tectonic conditions, in descending order of importance. It is predicted that the favorable CBM gas development sweet spot areas of the No. 2-1 coal seam and No. 4-2 coal seam will be located along the exploration wells W15–W29 and W31, respectively. This paper aims to make a multi-dimensional and more comprehensive evaluation of coalbed methane mining potential in the Shoushan I mine, and provide a technical basis for the next step of coalbed methane mining in the study area.
1. Introduction
In recent years, with the deepening of CBM exploration and development, the evaluation of CBM production potential has become increasingly important. In the existing quantitative evaluations of CBM production potential, the weights of evaluation indicators are mostly determined by subjective factors, and their values are fixed [,,,]. Coalbed methane constituency evaluation is the basic work in coalbed methane exploration, which is related to exploration results and development benefits []. At present, most of the evaluation methods of coal reservoirs are mainly based on gas content and permeability. However, coal reservoirs buried deep below the ground surface are actually part of a complex environmental system with multiple factors acting together [,]. In China, the formation conditions for coalbed methane and the history of reservoir tectonic evolution are relatively complex, resulting in large regional differences in geological parameters []. Even in the same stratum in the same region, each parameter still shows strong anisotropy []. Therefore, the question of how to select a suitable approach to determine the weights of indicators and avoid subjectivity and objective randomness is a prerequisite for establishing a practical and accurate preference model. The subjective assignment method is mainly based on the experience of subjective judgement to obtain the weight, but the subjective randomness of the decision maker is difficult to quantify. The objective assignment method is based on the characteristics and interrelationships of the indicator values of the evaluation object, and the use of statistical methods to calculate the weights, but the evaluation of the weights is too objective, and may be biased away from actual indicators [,].
The Pingdingshan coal mine area in Henan Province is a typical coal seam development zone in China, with rich coal seam reserves, large total thickness, large spacing between seams, high gas content in coal seams, tectonic coal development, and strong heterogeneity [,]. However, it also faces problems of complicated geological conditions and difficult target area preference. Therefore, based on previous research, the Shoushan I Mine in the Pingdingshan mine area was taken as the research object. This study puts forward a coalbed methane potential evaluation index system of the constituency based on multi-level and multi-type indicators of the gas source conditions, reservoirs’ physical properties, and preservation conditions. In this system, the triangular fuzzy hierarchical analysis method and the entropy weight method that combines the subjective and objective weights were used to design the indicator weight [,,]. This practice can enable the multi-dimensional evaluation of coalbed methane mining potential in the Shoushan I mine. It can provide a technical basis for the priority and construction ratio of coalbed methane exploration and development in the subsequent Shoushan I mine area. It can provide a better solution for the exploration and development of the project, and provide the direction for the next step of coalbed methane exploration and development in the area. Therefore, this study has certain theoretical significance and important application value.
2. Method and Material
After constructing the index system, it is necessary to choose an appropriate evaluation model. Determining the weights of the index and choosing the evaluation methods are fundamental for objective and rational assessment. In order to obtain accurate and objective index weights, relatively mature and widely recognized model combinations or methods should be used first when selecting evaluation methods. Secondly, evaluation methods should be adapted to the evaluation purposes. According to specific evaluation objectives, adaptive and rational evaluation methods should be chosen. Finally, qualitative methods should be combined with quantitative methods. In complex evaluation problems where obtaining quantitative data for many indicators is challenging, qualitative analysis becomes particularly crucial. Thus, it is essential in relevant evaluations to thoroughly explore the selected indicators, appropriately combine qualitative and quantitative methods, and achieve a comprehensive and unbiased evaluation of the objects under assessment.
The analytic hierarchy process is the most commonly used method for determining the weights of indicators, but its weight allocation is not objective enough. The entropy weight method is a method for determining the evaluation weights based on the sample data, and does not contain the subjective opinion of the evaluator, but its defect is that the evaluation weights are too objective and may be biased away from the indicator’s actuality [,]. Therefore, to improve the rationality of the evaluation, this paper proposed an integrated method of the two evaluation methods, which uses the triangular fuzzy hierarchical analysis method FEAHP (Fuzzy Extend Analytic Hierarchy Process) to improve the traditional hierarchical analysis method and the entropy weight method to correct the weights determined by the hierarchical analysis method.
2.1. Indicator Weights Based on Fuzzy Extend AHP
The traditional hierarchical analysis method can unify and quantify qualitative and quantitative indicators of different dimensions into one dimension, which is very practical for multi-objective decision-making problems in various fields. However, it is difficult for some experts to accurately assign weights to multiple parameters simply based on the “1–9” scale []. Therefore, the concept of triangular fuzzy numbers is introduced when determining the score. The improved hierarchical analysis method proposes the theory of fuzzy triangular numbers for the drawbacks of the “1–9” scale in the hierarchical analysis method, i.e., the triangular fuzzy hierarchical method FEAHP (Fuzzy Extend Analytic Hierarchy Process). When determining the relative importance of indicators, the degree of affiliation in fuzzy mathematics is used instead []. The calculation steps in the FEAHP method are as follows:
2.1.1. Application of Fuzzy Triangular Numbers to Build a Two-by-Two Judgement Matrix
The fuzzy triangular number takes the form of an affiliation function, denoted as (l, m, u), where l denotes the value of the smallest possible value, m takes the value of the most likely value, and u denotes the maximum possible value. For the two-by-two factor comparison matrix, the values are taken as shown in Table 1.

Table 1.
Triangular fuzzy number conversion table.
According to the basic principle of the FEAHP method, combined with the research results of former experts and the geological background of the study area [,,,,], through the evaluation system of coalbed methane potential indexes established above (Figure 1) and the analysis of the controlling factors of the coalbed methane potential indexes, the triangular scale method was used to obtain the judgement matrix of pairwise fuzzy comparisons.
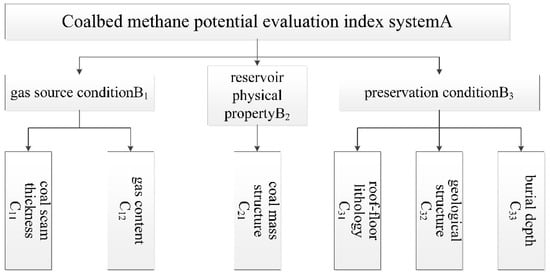
Figure 1.
Coalbed methane potential evaluation index system.
2.1.2. Consistency Test
Using the triangular fuzzy number defuzzification method, the pairwise fuzzy comparison judgement matrix is transformed into a clear matrix as shown in Equation (1). Additionally, the consistency test is carried out as shown in Equation (2).
where λmax is the maximum characteristic root of the matrix; n is the number of matrix orders; R.I. is the average random consistency index, which is determined by Table 2; and C.I. is the deviation from the full consistency index, and the closer the judgement matrix is to full consistency, the smaller the value is. When C.R. < 0.10 (which can be obtained from Equation (3), it is necessary to re-adjust the fuzzy judgement matrix and clarify it to obtain the C.R. value again.
Table 2.
The value of random index (R.I.).
The fuzzy judgment matrix is transformed into a clear matrix according to Equations (1) and (2), and the clear matrix of the A–B layer can be obtained. Similarly, the pairwise fuzzy comparison judgment matrix and the defuzzification clarity matrix of B–C layer indicators can be obtained, as well as the consistency test results (Table 3).
Table 3.
Hierarchical indicator fuzzy comparison judgement matrix.
2.1.3. Compute Weight Vectors for Each Level of the Target Hierarchy
- The formula for calculating the synthetic fuzzy number for each indicator in the dominance layer is as per Equation (4):where denotes the total fuzzy importance of a single element in the matrix in comparison with other elements in its dominant layer, which can be obtained by a fuzzy addition operation, and the calculation formula is shown in Equations (5)–(7).
- 2.
- The probability that Si ≥ Sk and Sk ≥ Si can be calculated from the following.
Denote
as the possibility of Sk ≥ Si, and m2 is the triangular fuzzy number of Sk,
m1 is the triangular fuzzy number of Si, which is calculated as follows (Equation (8)):
- 3.
- Measure the likelihood of the synthetic value Si of indicator xi, which is, on average, greater than the synthetic values of all other indicators (Equation (9)):Then, the weight vector is .
- 4.
- Normalize the weight vectors (Equation (10)):where W is a vector of non-fuzzy numbers, which determines the subjective weights of the elements in the evaluation system.
Table 4
can be obtained according to the above calculation process.
Table 4.
Summary of the calculation process of the FEAHP method.
2.2. Indicator Weights Based on Entropy Weighting
The entropy method is a mathematical method for determining the weights of evaluation parameters based on the degree of data discrepancy of each parameter. In a system with evaluation indicators and n evaluation objects, the evaluation matrix is constructed from the raw data of the corresponding indicators m of the evaluated objects
.
2.2.1. Dimensionless Processing of the Original Data
For positive indicators, a half-liter trapezoidal fuzzy affiliation function was used for quantification (Equation (11)).
where 1 ≤ i ≤ m, 1 ≤ j ≤ n.
For the reverse indicator, a half-descending trapezoidal fuzzy affiliation function was used for quantification (Equation (12)):
where 1 ≤ i ≤ m, 1 ≤ j ≤ n. xij is the original value of the jth evaluation object on indicator i, n is the number of evaluated objects, m represents the number of evaluation indicators, and aij represents the dimensionless value.
2.2.2. Correction of aij Values Using the Efficacy Coefficient Method
Because the logarithmic function is imperative in the calculation of the entropy weight method, the dimensionless value aij cannot take zero. For this reason, it is necessary to use the efficacy coefficient method to correct aij, to ensure that the final result of each operation is greater than 0, as shown in Equation (13):
Finally, a new evaluation matrix with m evaluation indicators and n samples as the evaluation system, and the dimensionless value of the evaluated object as yij, can be obtained and written as follows:
2.2.3. Calculation of the Entropy Value of the ith Indicator ei (Equation (14))
2.2.4. Calculation of the Coefficient of Variation for the ith Indicator (Equation (15))
2.2.5. Calculation of the Entropy Weight of the ith Indicator (Equation (16))
For the qualitative indicators, the fuzzy comprehensive evaluation method in fuzzy mathematics is used to portray the parameters using the affiliation function and the degree of affiliation. Based on the above analysis of geological control factors of the CBM-rich area in the Shoushan I Mine and the actual situation of the study area, the determination of tectonic complexity combines the determination of Zhang Xiaodong (2017) [] in the Changzhi block with four indicators, namely, fault density, extension length, and fault inclination and fault distance, are selected for the qualitative evaluation of tectonic complexity for block stacking (Table 5). The prediction and qualitative evaluation criteria of CBM-rich areas were established, and the assignment results of the membership degree of the index are shown in Table 5 and Table 6.
Table 5.
Determination of tectonic complexity.
Table 6.
Assignment of qualitative indicators of affiliation.
For the quantitative index, the forward index and the reverse index are dimensionlessly processed by Equation (11) and Equation (12), respectively. After the above calculation of the original data in the study area (Table 7 and Table 8), the value of can be obtained; the calculation results are shown in Table 9 and Table 10.
Table 7.
The original data of No. 2-1 coal reservoir in an exploration well of Shoushan I Mine.
Table 8.
The original data of No. 4-2 coal reservoir in an exploration well of Shoushan I Mine.
Table 9.
Summary of entropy weighting method calculation process for No. 2-1 coal reservoir.
Table 10.
Summary of entropy weighting method calculation process for No. 4-2 coal reservoir.
2.3. Subjective-Objective Combination Weight
In this paper, the additive integration method was used. The comprehensive weight vector obtained using the subjective and objective combination weighting method is expressed as , where α and β are the undetermined coefficients of the combination of the main and objective phases. The values of α and β can be determined using the subjective and objective weight values obtained from each index. Let obtain , , and then normalize them, and the obtained will be the final weight vector based on FEAHP and the entropy weight method. The application results of each parameter weight are shown in Table 11 and Table 12. The comprehensive evaluation results of the mining potential of the main coal seam in Shoushan I Mine are shown in Table 13 and Table 14:
Table 11.
Main parameters and weight coefficient of No. 2-1 coal reservoir.
Table 12.
Main parameters and weight coefficient of No. 4-2 coal reservoir.
Table 13.
Comprehensive evaluation of No. 2-1 coal reservoir in an exploration well of Shoushan I Mine.
Table 14.
Comprehensive evaluation of No. 4-2 coal reservoir in an exploration well of Shoushan I Mine.
3. Case Study
3.1. Tectonic Setting
The Pingdingshan mine is located at the eastern extension of the latitudinal tectonic belt of the Qinling Mountains and at the top of the reflecting arc of the western flank of the Huayangshan zigzag tectonics, which are a composite of latitudinal tectonics and Huayangshan zigzag tectonics [,,]. Shoushan I Mine is located in the eastern section of the northern flank of the Likou dyke in the Pingdingshan mine, and the main tectonics consist of a broad and gentle dorsal slope with an axial direction of 320°, i.e., the Baishishan dyke, whose north and south flanks are the north flanks and south flanks of the Likou and Lingwushan dykes, respectively (Figure 2) [].
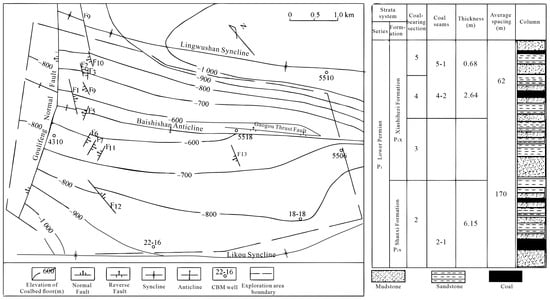
Figure 2.
Tectonic position and coal seam composite histogram of Shoushan I Mine, Pingdingshan, China.
3.2. Coal-Bearing Formations and Coal Seams
The main strata developed in the region are Pre-Aurignan (Anz), Aurignan, Cambrian, Upper Carboniferous, Permian, Triassic, Cretaceous, Palaeoproterozoic, Neoproterozoic, and Quaternary. The coal-bearing strata in this area consist of the Taiyuan Formation of the Upper Carboniferous and Lower Permian, the Shanxi Formation of the Lower Permian, the Lower Xiashihezi Formation, and the Upper Xiashihezi Formation of the Upper Permian. The total thickness of the coal-bearing strata is 795 m. The total thickness of the coal beds is 22.85 m, and the coal content coefficient is 2.77% []. The recoverable coal seams in the whole area are the No. 2-1 coal seam of the Shanxi Group and the No. 4-2 coal seam of the Lower Stone Box Group, and the distribution of coal seams is stable. Most of the coal reservoirs in this area have experienced complex tectonic effects, and the coal seams have been abraded and compressed, resulting in the deformation of the coal body structure and serious tectonic damage. In particular, the coal body structure of the No. 4-2 seam features mainly crushed coal and is dominated by Permian strata, and that of the No. 2-1 coal seam is mainly dominated by cracked coal and crushed coal, with a local distribution of ergocene. In general, the coal body structure of the No. 4-2 seam is poorer than that of the No. 2-1 coal seam (Figure 1) [].
In the whole Pingdingshan mining area, the No. 2-1 coal seam is located in the lower part of the Shanxi Formation, with a coal thickness ranging from 2.76 to 10.22 m, generally 5.00 to 7.00 m, and on average 6.15 m. The local branch features No. 2-1 and No. 2-2 coal, and the coal seam structure is relatively simple, with zero to two layers of interbedded gangue and a thickness ranging from 0.03 to 0.65 m—on average, 0.27 m. The lithology is composed of charcoal mudrock and mudstone, indicating a stable or relatively stable coal seam. The average gas content of the air-dried basis in the No. 2-1 coal seam is 3.50 m3/t. The No. 4-2 coal seam is located in the lower part of the No. 4 coal section of the Lower Stone Box Group, with a coal thickness of 0.90–5.15 m and an average of 2.64 m. The coal seam has a relatively simple structure, containing 0-3 layers of dirt band with a thickness of 0.08–0.79 m, and the lithology is mudstone and charcoal mudstone, which suggests that it is a more stable coal seam and the average gas content of the air-dried basis in the No. 4-2 coal seam is 5.64 m3/t. [].
3.3. Evaluation Index Analysis of CBM Potential in Study Area
To evaluate the CBM mining potential, it is necessary to construct a potential evaluation index system suitable for the study area. The determination of the factors affecting CBM production can be regarded as a multi-criteria decision-making problem, and the importance of each evaluation index in the final evaluation system varies, so it is necessary to first screen out the main controlling factors affecting the potential of CBM in the study area []. By comprehensively analyzing the geological conditions of coalbed methane formation, storage, and cap combinations, the weighted evaluation index system established by the previous research could be summarized. Finally, the three key factors affecting CBM enrichment and high production, namely, gas source conditions, reservoir physical properties, and preservation conditions, were comprehensively selected. Each key control factor was further subdivided into several major qualitative and quantitative sub-indicators affecting CBM survival and output.
3.3.1. Coal Thickness
The coal seam not only produces gas, but also stores gas. A coal seam with a large thickness is a prerequisite for a high yield of coalbed methane (CBM) storage, and the thicker the coal seam is, the larger the corresponding effective reservoir space is and the richer the gas reserves are []. Therefore, the thickness of coal beds is considered as a benefit-based indicator. In the study area, the main coal seams for CBM exploration and development are the No. 2-1 coal seam and the No. 4-2 coal seam. The contour maps of the coal thicknesses of No. 2-1 coal and No. 4-2 coal were plotted according to the data on CBM exploratory wells (Table 7 and Table 8), as shown in Figure 3. From the statistical data of 32 wells, the thickness of the No. 2-1 coal seam is 0.84~8.02 m, and the average thickness of the coal seam is 5.4 m. A thick coal seam over 6 m is concentrated in the northwestern part, and the coal seam located near the southern well area is thin. The thickness of the coal seam is less than 1 m. The thickness of the No. 4-2 coal seam is 0.90~5.15 m, and the average thickness of the coal seam is 2.4 m. The coal seam over 3 m is concentrated in the southwestern part, and the coal seam located near the southwestern well area is thin. The coal seams near the well area in the northwest are thin, and the thickness of the coal seams is 0~1.6 m. The coal seams in the thick coal seam areas generally have good horizontal continuity, high resource abundance, and a stable coal structure []. Therefore, the thick coal seam area in the western part of the Shoushan I Mine study area is favorable for the development of coalbed methane in multi-branch horizontal wells.
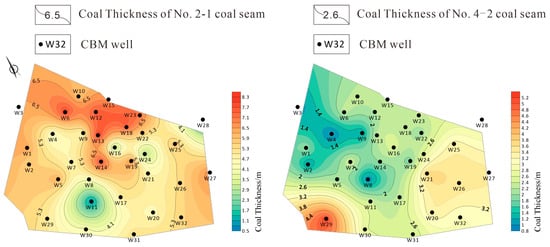
Figure 3.
Contour map of coal thickness of No. 2-1 coal and No. 4-2 coal in Shoushan I Mine.
3.3.2. Gas Content
Gas content is a key parameter in reflecting the abundance of coalbed methane. The critical desorption pressure rises as the gas content of the coal reservoir increases, and the larger the effective desorption area becomes, the shorter the gas breakthrough time becomes, thus increasing the gas production of a single well []. In the evaluation, gas content is considered to be a benefit-based indicator. The gas content of the No. 2-1 coal seam in the study area is 5–40 m3/t (Table 7 and Table 8). The gas content contour maps of No. 2-1 coal and No. 4-2 coal were plotted based on the gas content data, as shown in Figure 4. The gas content of the No. 2-1 coal seam is relatively high (>26 m3/t) in the northern part (near wells W10, W15, and W23) and the southern part of the Shoushan I Mine (near wells W32, W30, and W29), while in the central part of the block, the gas content is low (<10 m3/t). The gas content of the No. 4-2 seam ranges from 0.2 to 20 m3/t. The gas content of the No. 4-2 seam in the southern part of the Shoushan I Mine (near the shafts W30 and W31) is relatively high (>15 m3/t), while in the northeastern and central parts of the block, the gas content is low (<1 m3/t).
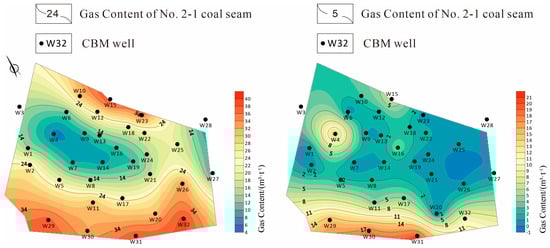
Figure 4.
Contour map of gas content of No. 2-1 coal and No. 4-2 coal in Shoushan I Mine.
3.3.3. Burial Depth
From the perspective of commercial development value, there is a critical threshold for the increase in burial depth. The permeability of a coal seam decreases with increasing burial depth, which is not conducive to drainage and pressure reduction in CBM wells or to the seepage output of CBM, indirectly affecting the development cost of CBM. Therefore, weighing the recoverable reserves of CBM and the economic rationality of engineering technology, the maximum recoverable burial depth of CBM reservoirs is generally set at 2000 m as the lower limit of the resource calculation range []. In reservoir evaluation, it is considered that the burial depth of a coal bed is a cost-based indicator. According to the data table of CBM exploratory wells (Table 7 and Table 8), the burial depth of No. 2-1 coal ranges from 645.75 m to 1305.35 m, with an average of 898.75 m, and that of No. 4-2 coal ranges from 445.11 m to 1130.09 m, with an average of 713.55 m. From the contour plots of the depths of burial of No. 2-1 and No. 4-2 coals (Figure 5), the burial depth of the No. 2-1 coal seam generally decreases from northwest to southeast. Overall, the depths of both Seam 2-1 and Seam 4-2 increase from northwest to southeast and are shallower in the central northwest area, increasing from the center towards the edge of the mine.
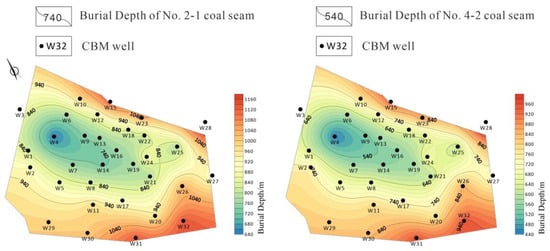
Figure 5.
Contour map of burial depth of No. 2-1 coal and No. 4-2 coal in Shoushan I Mine.
3.3.4. Roof/Floor Rocks
The existence of a rock layer with certain confinement properties above the coal seam can block and slow down the escape of free gas through water solubility, percolation, and diffusion so that more free gas can be preserved. The closure performance of the cap seam is controlled by two factors: the lithology of the top slab and its thickness []. The lithology of the top and bottom slabs of the No. 2-1 coal seam and No. 4-2 coal seam includes six kinds of lithologies: sandy mudstone, fine-grained sandstone, mudstone, siltstone, charcoal mudstone, and medium-grained sandstone. The lithological assemblage characteristics of coal-bearing rock systems in various regions of China can be divided into five types as a whole: oil shale type, mudstone type, sandy mudstone interbedded type, limestone type, and sandstone type. Under the condition that the reservoir is not damaged by tectonic stress, the enclosing rock types of these five lithological combinations have a decreasing effect on closure according to the above ordering. The oil shale type is the best, followed by mudstone and sandstone–mudstone interbedded types, while the limestone and sandstone types are poor. On this basis, the cover conditions (Table 7 and Table 8) in the study area were divided and quantified, and the contour maps of the cover conditions of No. 2-1 coal and No. 4-2 coal were drawn, as shown in Figure 6. The cover conditions are considered to be benefit-based indicators in the reservoir evaluation.
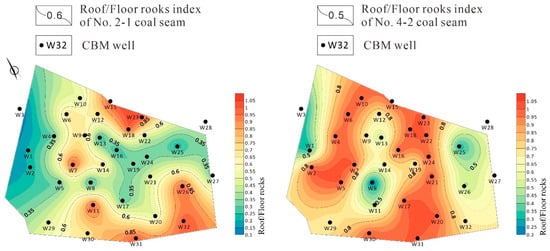
Figure 6.
Contour map of roof/floor rocks index of No. 2-1 coal and No. 4-2 coal in Shoushan I Mine.
3.3.5. Tectonic Conditions
The influence of geological formations on CBM reservoirs is comprehensive and important, and it can be quantified in terms of geological formation burial history, folding, and fracturing in general terms [].
Shoushan I Mine is located in Xiangcheng County, northeast of Pingdingshan City, and the folds and fractures in the minefield are relatively developed, with the main structure of the Baishishan anticline. Its northeast-oriented Lingwushan syncline and its southwest-oriented Likou syncline belong to the longitudinal folds, with the axial direction of about 320° and an inclination angle of the two flanks ranging from 10° to 20°. There are 14 major faults identified in the minefield which have NEE and NNE strike directions, including the Goulifeng normal fault, and the Gaogou thrust fault. The Goulifeng normal fault and Gaogou thrust fault have the largest extension lengths in the wellfield, and the Goulifeng normal fault is located on the west side of the wellfield, cutting into the Baishishan anticline and Lingwushan syncline with a drop of about 150 m. The extension length of the wellfield is 5500 m. The Gaogou thrust fault is located in the eastern part of the wellfield near the Baishishan anticline, with a drop of about 40 m, and the extension length of the wellfield is 2070 m. The rest of the faults are located on the eastern side of the Goulifeng normal fault, with a drop of 3–10 m, and their extension lengths are less than 1000 m []. In addition to this, there are 352 small faults catalogued in the roadway of the No. 2-1 coal, most of which are positive faults with a drop of 0.5 m, and the strike directions are mostly in the NEE direction and the NWW direction. The geological structure outline of the No. 2-1 coal seam and No. 4-2 coal seam of Shoushan I Mine is shown in Figure 7.
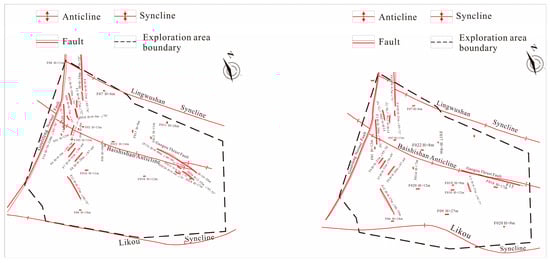
Figure 7.
Schematic diagram of tectonic conditions of No. 2-1 coal and No. 4-2 coal in Shoushan I Mine.
3.3.6. Coal Body Structure Index
Based on the analysis of the coal core logging response, the geophysical identification criteria of the coal body structure in the study area were established, and the coal body structure was classified into Class I (primary structural coal), Class II (fractured coal), and Class III (fractured granular mineral coal) []. As the main mining seam in the study area (Table 7 and Table 8), the coal body structure of the No. 2-1 coal seam is generally complete, and the coal samples are lumpy, with a small amount of them being granular and powdery. The coal body structure of the No. 4-2 coal seam is more fractured than that of the No. 2-1 coal seam, and the coal body structure is fractured and has broken grains. The distribution of different types of coal structures is shown in Figure 8.
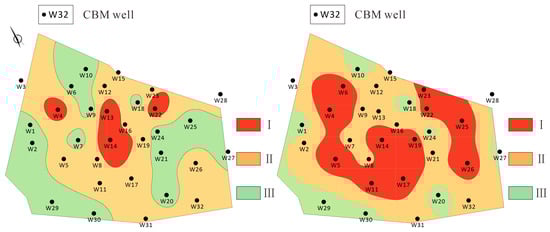
Figure 8.
Contour map of coal body structure index of No. 2-1 coal and No. 4-2 coal in Shoushan I Mine.
3.4. Model Application
According to the evaluation index system and evaluation model established above, the specific data of 34 wells of coalbed methane evaluation parameters of No. 2-1 coal and No. 4-2 coal in Shoushan I Mine area were counted, and a quantitative prediction map of coalbed methane mining potential in Shoushan I Mine was drawn after a comprehensive calculation and analysis (Figure 9). The comprehensive evaluation results of coalbed methane predicted its enrichment and recoverable potential. According to the size of the evaluation value, it was divided into a desert area (type I, evaluation score [0.8, 1.0)), a sub-desert area (type II, evaluation score [0.6, 0.8)), a sub-unfavorable area (type III, evaluation score [0.4, 0.6)), and an unfavorable area (type IV, evaluation score [0, 0.4)).
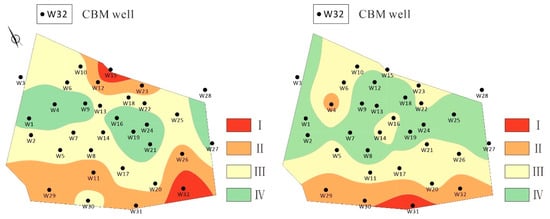
Figure 9.
The distribution of comprehensive scores of CBM system in Shoushan I Mine blocks. Left is No. 2-1 coal seam, and right is No. 4-2 coal seam.
4. Results Analysis and Discussion
- The coalbed methane formation conditions of No. 2-1 coal in the study area of Shoushan I Mine are simpler than those of No. 4-2 coal: from the data of 32 wells, the thickness of the No. 2-1 coal seam is 0.84–8.02 m, with an average thickness of 5.4 m; the gas content of the coal seam is 5–40 m3/t; and the depth of burial of the coal reservoir is 645.75 m–1305.35 m, with an average of 898.75 m. The coal body structure is dominated by Class I primary structural coal and Class II fractured coal, and the top and bottom lithology are dominated by mudstone. At 898.75 m, the structure of the coal body is dominated by Class I primary structural coal and Class II fractured coal, the lithology of the top and bottom plates is dominated by mudstone, and the overall gas content is good; the thickness of the No. 4-2 coal seam is 0.90~5.15 m, the average thickness of the seam is 2.4 m, the gas content of the seam is 0.2~20 m3/t, and the depth of burial of the seam is 445.11 m~1130.09 m, with an average of 713.55 m. The structure of the coal body is dominated by Class II primary structural coal and Class III crushed grain–mineral coal, the lithology of the top and bottom plates is also dominated by mudstone, and the overall gas content is lower than that of No. 2-1 coal.
- Using the subjective and objective combination weight method of the triangular fuzzy analytic hierarchy process and entropy weight method, the weight distribution proportion of each index can be carried out, and the weight value of the evaluation index can be determined by synthesizing the subjective experience of the experts and the objective deviation law of the data. The importance of evaluation indexes of No. 2-1 coal is ranked from high to low regarding gas content, roof–floor lithology, coal thickness, burial depth, coal body structure index, and tectonic conditions, and the weight values are 0.2960, 0.1923, 0.1489, 0.1335, 0.1277, and 0.1016, respectively. The order of importance of the evaluation indexes of No. 4-2 coal from high to low is as follows: gas content, coal body structure index, coal thickness, roof–floor lithology, burial depth, and tectonic conditions, and the weight values are 0.3080, 0.1534, 0.1458, 0.1407, 0.1391, and 0.1130.
- Based on the systematic theory of triangular fuzzy hierarchical analysis and the entropy weighting method, a multi-level and multi-indicator preferential model for selective CBM blocks applicable to the Shoushan I Mine in Pingdingshan was established, and the mining potentials of the main coal seams in the study area, i.e., the No. 2-1 coal seam and the No. 4-2 coal seam, were evaluated and classified into the sweet spot area (Type I), the sub-sweet spot area (Type II), the sub-unfavorable area (Type III), and the unfavorable area (Type IV), respectively. The Type I sweet spot zone of the No. 2-1 coal seam is mainly located near well W15 in the north and well W29 in the southeast of the block, and the Type I sweet spot zone of No. 4-2 coal seam is mainly located near well W31 in the south of the block.
5. Conclusions
- The No. 2-1 coal seam has more advantages in coalbed methane mining potential than the No. 4-2 coal seam. The thickness of the No. 2-1 coal seam ranges from 0.84 to 8.02 m, the average thickness of the seam is 5.4 m, and the depth of the seam ranges from 645.75 m to 1305.35 m. The average depth of the seam is 898.75 m, and the gas content is 5~40 m3/t.
- In this paper, FEAHP and the entropy weight method were used to quantify the weight of each parameter, and fuzzy mathematical analysis was supplemented to unify the qualitative data and quantitative data. On this basis, the evaluation model of coalbed methane exploitation potential in the geological background of the Shoushan I coal mine was established. Four types of CBM enrichment blocks were delineated, namely, the sweet zone (type I), the sub-sweet zone (type II), the sub-unfavorable zone (type III), and the unfavorable zone (type IV). The Class I blocks of coal seams 2-1 and 4-2 were located near well W15 in the north, well W29 in the southeast, and well W31 in the south of the study area, respectively.
- Taking the Shoushan I mine as an example, the optimal model of the sweet spot area on the plane was established. The evaluation results were in good agreement with the actual development situation. The evaluation results of this study have important theoretical significance for the exploration and development of the Shoushan I mine and the locations of coalbed methane wells.
Author Contributions
All authors contributed to the study conception and design. Methodology, investigation, writing—original draft, and writing—review and editing by S.L. Conceptualization, project administration, funding acquisition, and supervision by Y.J. Data curation and writing—review and editing by J.Y. and H.S. Methodology and investigation by B.W., J.D. and J.Z. All authors have read and agreed to the published version of the manuscript.
Funding
This work was supported by Excellent Youth Foundation of Henan Scientific Committee (Grant No. 232300421025), the Key Technologies Research and Development Program of Henan Province (Grant No. 222102320332), the Doctoral Foundation of Henan Polytechnic University (Grant No. B2020-59), and the Youth Innovative Exploratory Fund of Henan Polytechnic University (Grant No. NSFRF230406).
Data Availability Statement
Data are contained within the article.
Conflicts of Interest
The authors declare no conflicts of interest.
References
- Wang, Z.; Fu, X.; Pan, J.; Deng, J. Effect of N2/CO2 injection and alternate injection on volume swelling/shrinkage strain of coal. Energy 2023, 275, 127377. [Google Scholar] [CrossRef]
- Fu, H.J.; Tang, D.Z.; Xu, H.; Xu, T.; Chen, B.; Hu, P.; Ying, Z.; Wu, P.; He, G. Geological characteristics and CBM exploration potential evaluation: A case study in the middle of the southern Junggar Basin, NW China. J. Nat. Gas Sci. Eng. 2016, 30, 557–570. [Google Scholar] [CrossRef]
- Zhang, Z.; Qin, Y.; Zhuang, X.; Li, G.; Liu, D. Geological Controls on the CBM Productivity of No. 15 Coal Seam of Carboniferous-Permian Taiyuan Formation in Southern Qinshui Basin and Prediction for CBM High-yield Potential Regions. Acta Geol. Sin. Engl. Ed. 2018, 92, 2310–2332. [Google Scholar] [CrossRef]
- Zhao, G.F.; Kang, T.H.; Guo, J.Q.; Zhang, R.; Li, L. Gray Relational Analysis Optimization for Coalbed Methane Blocks in Complex Conditions Based on a Best Worst and Entropy Method. Appl. Sci. 2019, 9, 5033. [Google Scholar] [CrossRef]
- Fu, X.; Meng, Y.; Li, Z.; Kong, P.; Chang, S.; Yan, T.; Liu, Y. Coalbed Methane Potential Evaluation and Development Sweet Spot Prediction Based on the Analysis of Development Geological Conditions in Yangjiapo Block, Eastern Ordos Basin, China. Geofluids 2021, 2021, 8728005. [Google Scholar] [CrossRef]
- Tang, S.H.; Sun, S.L.; Hao, D.H.; Tang, D. Coalbed methane-bearing characteristics and reservoir physical properties of principal target areas in North China. Acta Geol. Sin. Engl. Ed. 2004, 78, 724–728. [Google Scholar]
- Wang, B.Y.; Qin, Y.; Shen, J.; Wang, G.; Li, J. Formation Environment of Main Brown Coal Seam in Xi-2 Minefield of Shengli Coalfield Based on Coal Ash Phase Analysis. J. Geol. Soc. India 2018, 92, 111–119. [Google Scholar] [CrossRef]
- Liu, J.; Chang, S.L.; Zhang, S.; Li, Y.; Hao, Y.; He, G.; He, Y.; Liu, B. Prediction of coalbed methane content based on seismic identification of key geological parameters: A case in a study area, Southern Qinshui Basin. Acta Geophys. 2023, 71, 2645–2662. [Google Scholar] [CrossRef]
- Liu, G.F.; Liu, H.; Xian, B.A.; Gao, D.; Wang, X.; Zhang, Z. Fuzzy pattern recognition model of geological sweetspot for coalbed methane development. Pet. Explor. Dev. 2023, 50, 924–933. [Google Scholar] [CrossRef]
- Sitorus, F.; Brito-Parada, P.R. The selection of renewable energy technologies using a hybrid subjective and objective multiple criteria decision making method. Expert Syst. Appl. 2022, 206, 117839. [Google Scholar] [CrossRef]
- Zhao, J.; Jin, J.L.; Zhu, J.Z.; Xu, J.; Huang, Q.; Chen, Y.; Han, D. Water Resources Risk Assessment Model based on the Subjective and Objective Combination Weighting Methods. Water Resour. Manag. 2016, 30, 3027–3042. [Google Scholar] [CrossRef]
- Xu, Y.B. Analysis of interlayer interference in combined development of coalbed methane wells and discussion on combined production methods: A case study of Shoushan No.1 Coal Mine in Pingdingshan. Coal Geol. Explor. 2021, 49, 112–117. [Google Scholar] [CrossRef]
- Zhai, C.; Xiang, X.W.; Xu, J.Z.; Wu, S. The characteristics and main influencing factors affecting coal and gas outbursts in Chinese Pingdingshan mining region. Nat. Hazards 2016, 82, 507–530. [Google Scholar] [CrossRef]
- Liu, H.; Hu, Y. An Evaluating Method with Combined Assigning-Weight Based on Maximizing Variance. Sci. Program. 2015, 2015, 290379. [Google Scholar] [CrossRef]
- Wang, Y.; Jin, Z.; Deng, C.; Wang, X. Comprehensive decision-making with fuzzy combined weighting and its application on the order of gob management. J. Intell. Fuzzy Syst. 2018, 34, 2641–2649. [Google Scholar] [CrossRef]
- Shan, C.; Yang, J.; Dong, Z.; Huang, D.; Wang, H. Study on River Health Assessment Weight Calculation. Pol. J. Environ. Stud. 2020, 29, 1839–1848. [Google Scholar] [CrossRef] [PubMed]
- Jia, Z.C.; Huang, H.Z.; Huang, S.B.; Zhou, Y.; Wang, B. Evaluation of the development potential of the coalbed methane resources in mining area based on AHP-entropy method. Coal Geol. Explor. 2021, 49, 117–124. [Google Scholar]
- Luo, J.H.; Yang, Y.G.; Qin, Y.; Xu, W. Fuzzy optimization for CBM favorable targets based on combined weights. J. China Coal Soc. 2012, 37, 242–246. [Google Scholar]
- Jin, L.; Watkins, D.; Yuen, M. Personality, career decision self-efficacy and commitment to the career choices process among Chinese graduate students. J. Vocat. Behav. 2009, 74, 47–52. [Google Scholar] [CrossRef]
- Zhang, X.J. Study on Engineering Management Personnel Career Decision-making Method and Management: A View Based on Knowledge Mining. Ph.D. Thesis, North China Electric Power University, School of Economic and Management, Beijing, China, 2015. [Google Scholar]
- Hu, S.B. 3-D Geological Model Construction and Reserve Evaluation of Mine Geothermal Reservoir. Ph.D. Thesis, China University of Mining and Technology, Xuzhou, China, 2023. [Google Scholar]
- Song, Y.; Liu, S.B.; Zhang, Q.; Tao, M.; Zhao, M.; Hong, F. Coalbed methane genesis, occurrence and accumulation in China. Pet. Sci. 2012, 9, 269–280. [Google Scholar] [CrossRef]
- Li, L.; Tang, D.Z.; Xu, H.; Tao, S.; Chen, S.; Tang, S.; Yao, H. Coalbed methane geology and exploration potential in large, thick, low-rank seams in the Bayanhua Sag of the Erlian Basin, northern China. Energy Explor. Exploit. 2022, 40, 995–1022. [Google Scholar] [CrossRef]
- Song, H.B.; An, H.L.; Liu, S.X.; Yu, Z.; Jin, Y.; Wang, B.; Wang, C. Controlling geological factors and coalbed methane enrichment areas in Southern Wuxiang Block, Qinshui Basin. J. China Coal Soc. 2021, 46, 3974–3987. [Google Scholar] [CrossRef]
- Yang, Y.S.; Chu, J.Y.; Li, J.X.; Zhang, X. CBM Hosting Geological Condition and Resources Potential Assessment in Pingdingshan Coalfield. Coal Geol. China 2019, 31, 45–49. [Google Scholar] [CrossRef]
- Ma, G.; Zhu, Y. Geological Characteristics of CBM in Eastern Sector of Pingdingshan Mining Area and Exploitation Potential. Coal Geol. China 2013, 25, 18–21. [Google Scholar] [CrossRef]
- Sun, X.C.; Zhang, Y.Y. Research on the geological structure complexity of the F group coal seams in Shoushan No.1 Mine. China Coal 2019, 45, 102–107, 113. [Google Scholar] [CrossRef]
- Guo, C.; Xia, Y.C.; Ma, D.M.; Sun, X.; Dai, G.; Shen, J.; Chen, Y.; Lu, L. Geological conditions of coalbed methane accumulation in the Hancheng area, southeastern Ordos Basin, China: Implications for coalbed methane high-yield potential. Energy Explor. Exploit. 2019, 37, 922–944. [Google Scholar] [CrossRef]
- Zhang, X.M.; Li, J.W.; Han, B.S.; Dong, M. Division and formation mechanism of coalbed methane reservoir in Huainan Coalfield, Anhui Province, China. Chin. Sci. Bull. 2005, 50, 7–17. [Google Scholar] [CrossRef]
- Li, M.; Jiang, B.; Lin, S.F.; Lan, F.; Zhang, G. Characteristics of coalbed methane reservoirs in Faer Coalfield, Western Guizhou. Energy Explor. Exploit. 2013, 31, 411–428. [Google Scholar] [CrossRef]
- Shen, J.; Qin, Y.; Fu, X.H.; Chen, G.; Chen, Y. Properties of Deep Coalbed Methane Reservoir-forming Conditions and Critical Depth Discussion. Nat. Gas Geosci. 2014, 25, 1470–1476. [Google Scholar]
- Yan, J.W.; Tan, Z.H.; Guo, Y.; Jia, T. Research on Coal Bed Methane (Gas) Occurrence Controlled by Geological Tectonics in the Southern Margin of North China Plate: A Case Study of the Pingdingshan Coalfield, China. Shock Vib. 2021, 2021, 6686591. [Google Scholar] [CrossRef]
- Yu, G.; Zhao, J.Z.; Gang, W.Z.; Hu, L.; Zhao, D. The influence of tectonic characteristics on the accumulation of Coalbed Methane in H area. Indian J. Geo-Mar. Sci. 2016, 45, 1652–1659. [Google Scholar]
- Lei, D.; Li, H.; Meng, H. Geological division of gas in the Pingdingshan mine area based on its tectonic dynamics characteristics. Int. J. Min. Sci. Technol. 2015, 25, 827–833. [Google Scholar] [CrossRef]
- Ni, X.M.; Tan, X.B.; Yang, S.; Xu, B.; Fu, X. Evaluation of coal reservoir coalbed methane production potential in considering different coal structures in a coal seam section: A case study of the Shizhuang North Block in the Qinshui Basin. Environ. Earth Sci. 2021, 80, 676. [Google Scholar] [CrossRef]
Disclaimer/Publisher’s Note: The statements, opinions and data contained in all publications are solely those of the individual author(s) and contributor(s) and not of MDPI and/or the editor(s). MDPI and/or the editor(s) disclaim responsibility for any injury to people or property resulting from any ideas, methods, instructions or products referred to in the content. |
© 2024 by the authors. Licensee MDPI, Basel, Switzerland. This article is an open access article distributed under the terms and conditions of the Creative Commons Attribution (CC BY) license (https://creativecommons.org/licenses/by/4.0/).