Article

Fluent Integration of Laboratory Data into Biocatalytic Process Simulation Using EnzymeML, DWSIM, and Ontologies

1
Laboratory of Equipment Design, Department of Biochemical and Chemical Engineering, TU Dortmund University, 44227 Dortmund, Germany
2
Institute of Biochemistry and Technical Biochemistry, University of Stuttgart, 70174 Stuttgart, Germany
3
Department of Biochemical and Chemical Engineering, Chair for Bioprocess Engineering, TU Dortmund University, 44227 Dortmund, Germany
4
Laboratory of Biotechnology, School of Science, Constructor University, 28759 Bremen, Germany
*
Author to whom correspondence should be addressed.
Processes 2024, 12(3), 597; https://doi.org/10.3390/pr12030597
Submission received: 5 February 2024 / Revised: 11 March 2024 / Accepted: 13 March 2024 / Published: 16 March 2024
(This article belongs to the Special Issue Development, Modelling and Simulation of Biocatalytic Processes)

Abstract

:
The importance of biocatalysis for ecologically sustainable syntheses in the chemical industry and for applications in everyday life is increasing. To design efficient applications, it is important to know the related enzyme kinetics; however, the measurement is laborious and error-prone. Flow reactors are suitable for rapid reaction parameter screening; here, a novel workflow is proposed including digital image processing (DIP) for the quantification of product concentrations, and the use of structured data acquisition with EnzymeML spreadsheets combined with ontology-based semantic information, leading to rapid and smooth data integration into a simulation tool for kinetics evaluation. One of the major findings is that a flexibly adaptive ontology is essential for FAIR (findability, accessibility, interoperability, reusability) data handling. Further, Python interfaces enable consistent data transfer.

1. Introduction

Biocatalytic reactions have significant potential for novel industrial production routes [1,2]. Developing new bioprocesses is an intricate task, particularly concerning the specifics of reaction conditions. This has created a substantial demand for tools like process simulators that make the process design and development phase more efficient, saving both time and costs [3]. An open-source process simulator such as DWSIM [4] enables the computation of process streams even before the establishment of the process in a laboratory setting. However, process simulation needs input derived from real-world experiments in order to model the reality properly.
Ensuring standardized conditions is crucial when handling enzymatic data in bioreactors designed for enzymatic reactions within process simulators. Key parameters, such as reaction rates and enzyme kinetics, can vary depending on specific reaction conditions. Additionally, the experimenters recording enzyme-specific data in laboratories might differ from those individuals conducting process simulations. Thus, research data needs to be findable, accessible, interoperable, and reusable (FAIR) in order to mitigate loss of information between different individuals, to reduce the workload, to minimize error sources, and to enhance the effectiveness of workflows [5]. To tackle these challenges, ontologies offer a solution by providing standardized vocabularies and semantic relationships among pertinent concepts in the research domains. This facilitates precise comparison and analysis of enzymatic data [6,7].
In addition, structured data deposition helps experimenters to record their data in a FAIR way, thereby generating machine-readable data storage. In this work, the standardized, XML-based data exchange format EnzymeML was used to store the measured time course of product concentration and the modelled enzyme kinetics [8,9]. EnzymeML uses ontology classes from the Systems Biology Ontology (SBO) [10,11], rendering it a promising tool for further FAIR research data integration.
This work presents a partially automated method for transforming information from EnzymeML into a process simulation using standardized concepts defined by ontologies. The overall workflow, facilitating the direct conversion of data into a process simulation through ontologies, is depicted in Figure 1 [12]. Data and metadata on the enzyme-catalyzed reaction is collected in an EnzymeML-compatible spreadsheet and is parsed to a Python-based kinetic modelling platform for model selection and parameter estimation. With this, data are extracted and organized within an ontology-based knowledge graph, increasing data FAIRness. This includes details regarding the process flow diagram (PFD) and supplementary information necessary for configuring the process simulation. Subsequently, DWSIM and its Python application programming interface (API) are employed to import the requisite data for the automated configuration of process simulation. Following the simulation, the resulting data are also integrated into the knowledge graph, enabling the automatic storage of research data in a format both machine- and humanreadable.
With this, the data FAIRness of laboratory experiments is enhanced, making the overall workflow usable even for experimenters who may not have extensive knowledge in ontology engineering or process simulation. Besides being able to set up data models more quickly, the ontologies and resulting knowledge graph also allow for better cross-domain exchange of data by shared conceptualization of the knowledge. To develop this workflow, a simple model reaction was used, namely the laccase-catalyzed oxidation of ABTS. The biocatalysis experiments were performed in two capillary flow reactors and the corresponding evaluation of the results were used as data input for the workflow.

2. Materials and Methods

This section starts with the description of the biochemical system, followed by the experimental setup of the capillary reactors with connected digital image processing (DIP). The experimental data are recorded by an EnzymeML-compatible spreadsheet. The section ends with an overview about ontology engineering enabling the smooth connection of experimental results with process simulation performed by DWSIM.

2.1. Determination of Reaction Kinetics

The oxidation of 2,2′-azino-bis(3-ethylbenzothiazoline-6-sulfonic acid) (ABTS) (Merck KGaA, Darmstadt, Germany) catalyzed by laccase (E.C. 1.10.3.2) from Trametes versicolor (Merck KGaA, Darmstadt, Germany) was chosen as an easy to quantify model reaction. The purity of the laccase was determined, which did not show any protein contamination. For the determination of the enzyme activity, one unit was defined as the amount of the laccase that oxidizes 1 μmol of ABTS per min. The protein concentration was determined by Bradford assay using BSA as standard.
For the two-substrate kinetics, the initial rates for the oxidation of ABTS were monitored, while assuming a constant concentration of the second substrate (oxygen). The apparent kinetics constants ( v m a x a p p and K M a p p ) have been determined indicating that their values toward ABTS oxidation depend on the concentration of the second substrate, oxygen. To determine the K M a p p and k c a t a p p of the laccase, enzyme assays with varying ABTS concentrations were carried out in a multi-well plate reader (Tecan Safire2TM, Männedorf, Germany). The reaction was performed with 21 U L−1 laccase in 200 µL 1% (v/v) sodium acetate buffer (pH 5.3) containing 1% (v/v) Tween® 80, incubated for 15 min at 37 °C. ABTS was added in different concentrations: 0, 0.15, 0.3, 0.45, 0.6, 0.75, 0.9, 1.0, 5, 10, 15, 20, 30, 40, 50, 60, 70, and 80 mM. The absorption at 420 nm was measured every 48 s. Experiments were performed in triplicate. To convert the absorption into concentration, a correlation was determined from the absorption of reacted ABTS dependent on the substrate concentration used. It was assumed that the ABTS was fully converted, and that the product was stable in solution.
Kinetics absorption data were processed in a Jupyter Notebook alongside calibration data for concentration calculation. Therefore, the MTPHandler Python tool was used to read in unprocessed absorption data from the plate reader. Subsequently, reaction conditions and initial concentrations for substrate and enzyme were assigned to the individual wells of the MTPHandler “Plate” object. Absorption data were obtained from wells containing oxidized ABTS to prepare a standard curve for concentration calculation. Subsequently, the absorption data of the enzyme reactions were converted to the data structure of EnzymeML. In this process, the standard of oxidized ABTS was used, yielding concentration data. After creation of EnzymeML data, the concentration data between 300 s and 900 s was used to estimate the kinetic parameters k c a t a p p and K M a p p by fitting the integrated irreversible Henri–Michaelis–Menten rate law to the data.
r = k c a t a p p c L a c c a s e c A B T S r e d K M a p p + c A B T S r e d
The estimated kinetic parameters, kinetic model, reaction conditions, and measured concentration data were serialized as an EnzymeML document in the form of an .omex archive.

2.2. Tube Reactor Experiments

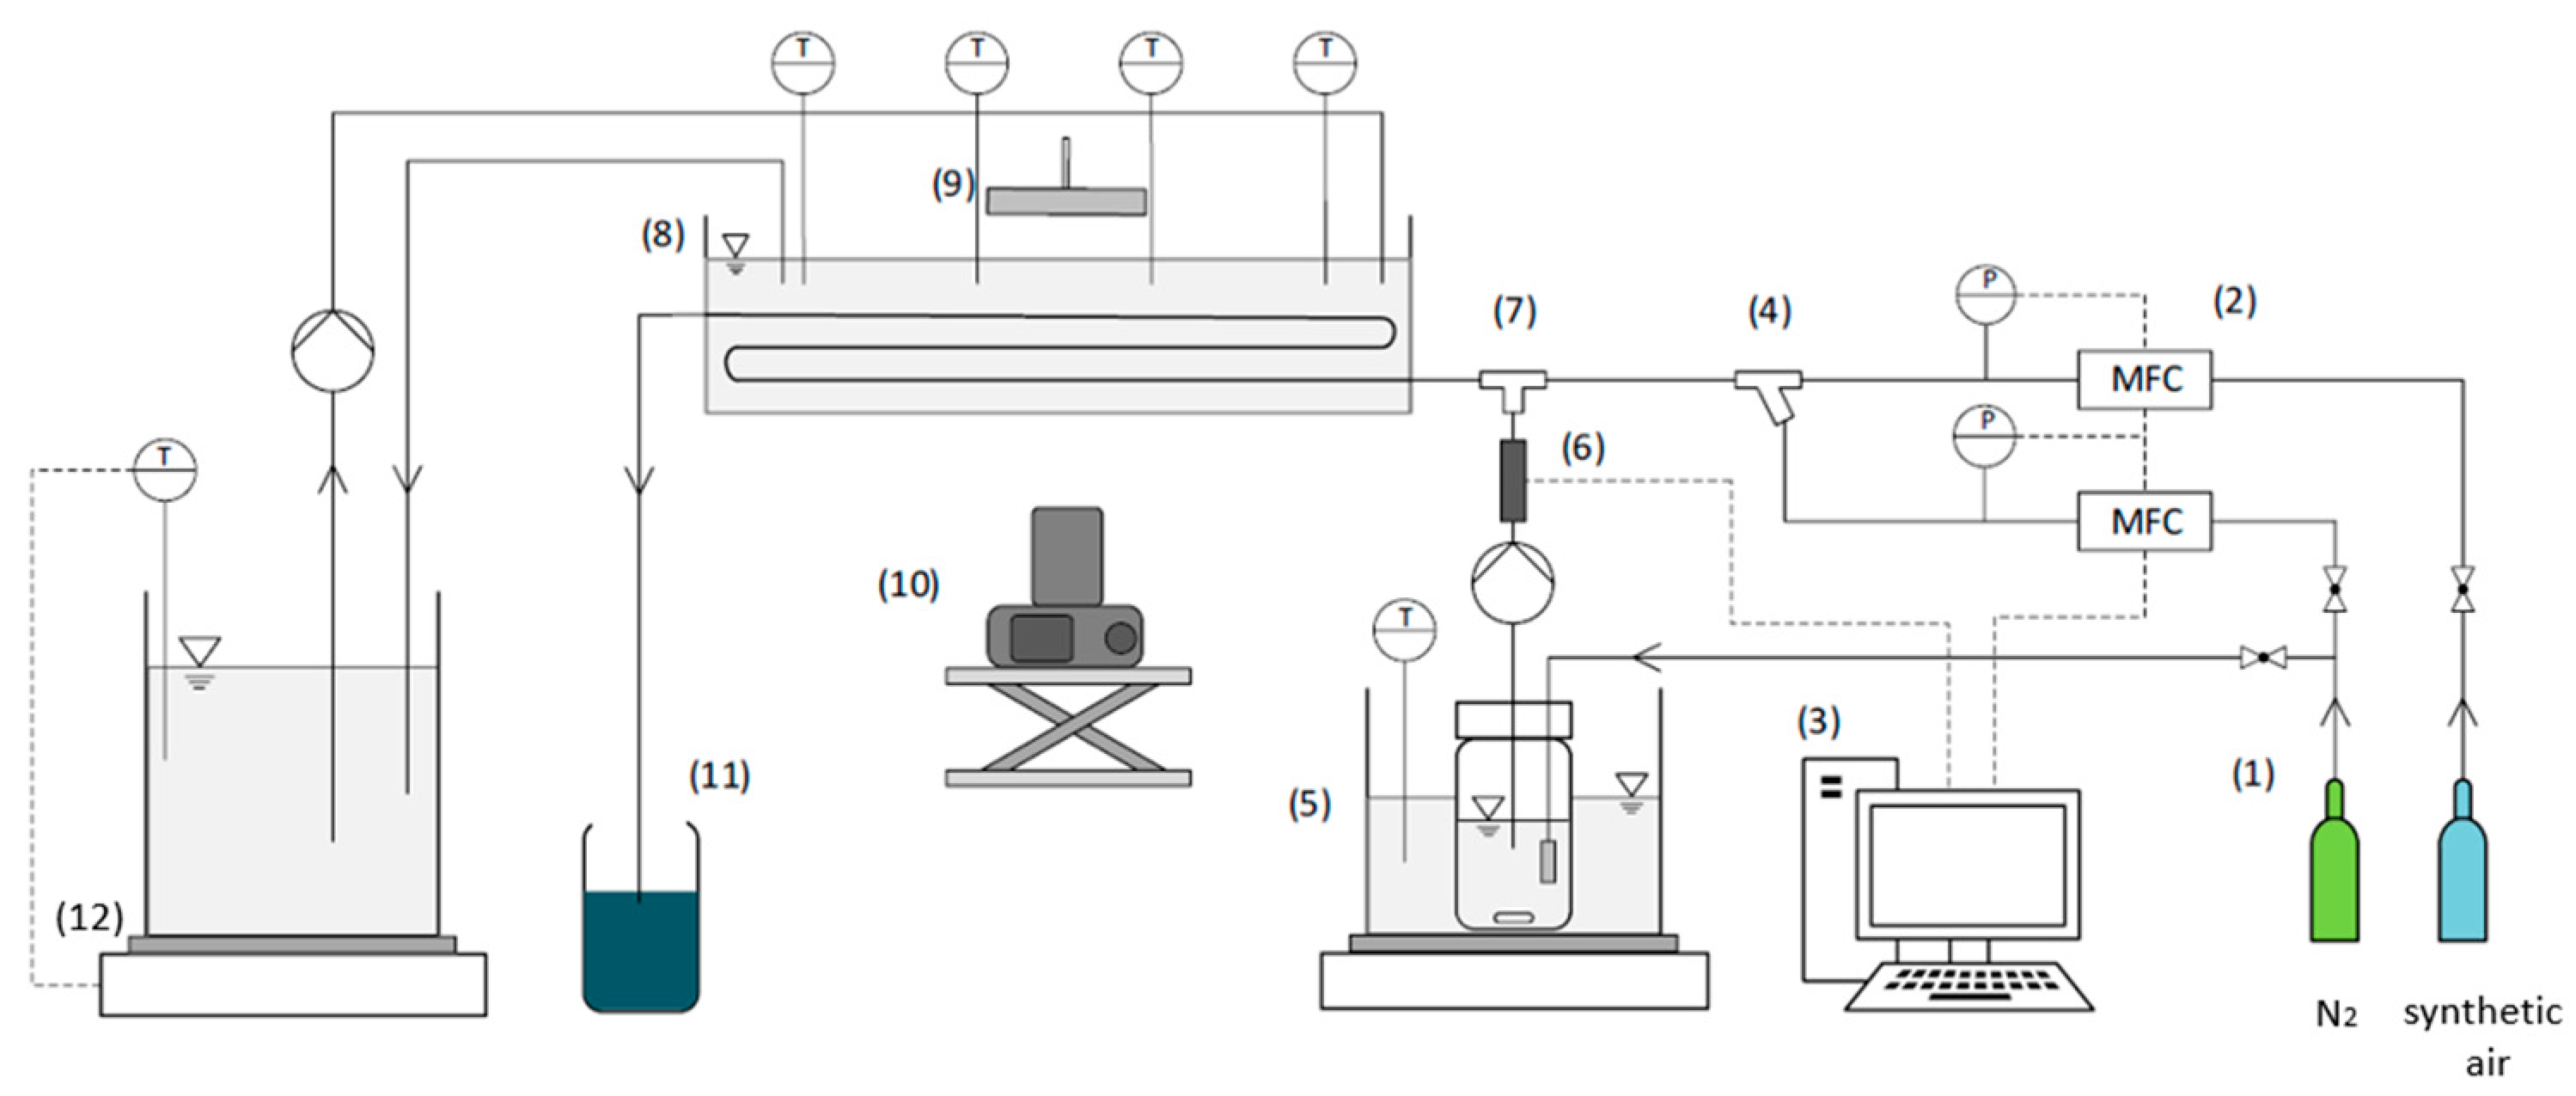
2.2.1. Experimental Setup

The experimental capillary reactor setup consists of the components shown in Figure 2, in which the setup for the straight capillary (SC) is shown as an example. To set the desired oxygen content in the gas phase, a gas cylinder (1) each is used for synthetic air and nitrogen. These gas flows are regulated by two mass flow controllers (Bronkhorst EL-Flow select, Bronkhorst, The Netherlands) (2) and controlled by a computer (3). The gas flows are then combined in a Y-mixer (4). The storage tank with the reaction solution is located in a water bath (5), which is heated to operating temperature using a heating plate (MR Hei-Tec, Heidolph, Germany). The inertization with pure nitrogen of the storage tank takes place through a sintered filter (VitraPor®, Robu Glasfilter, Hattert, Germany). For slug flow generation, a peristaltic pump (Ismatec ISM597, Ismatec Industry Solutions GmbH, Grevenbroich, Germany) pumps the reaction solution through a T-mixer (7), where it is contacted with the gas phase in a co-current flow. In order to control the concentration of ABTSox (Merck, Darmstadt, Germany) in the reaction solution before it enters the straight capillary reactor, a photosensor (6) is positioned between the T-mixer and the peristaltic pump. The gas–liquid flows (3 mL min−1 gas, 5 mL min−1 liquid) through the capillary reactor (straight capillary or coiled capillary) with a reactor length of 4 m (fluoroethylene propylene, inner diameter: 1.6 mm, Bohlender GmbH, Grünsfeld, Germany), which is tempered in a water bath (8). To temper this reactor water bath, a 5 L laboratory bottle on a hotplate with a feedback control (Witeg MSH-20D, Witeg Labortechnik GmbH, Wertheim, Germany) (12) is used. The value of the feedback control is set to 39–40 °C. A single-lens reflex camera (Nikon D5300, Nikon Europe BV, Amstelveen, The Netherlands) (10) is used to take pictures of the reaction in the capillary reactor with a focal length of 85 mm, an exposure time of 1/1000 s, and ISO number of 6400. Illumination is realized with an LED panel (9) (Starcluster Kaiser, Kaiser Fototechnik, Buchen, Germany). The straight capillary and the coiled setup differ only in terms of illumination and camera position. In the straight capillary setup, the camera and one LED panel face each other. In contrast, the coiled capillary is illuminated by two LED panels at an angle of approximately 45° from the same direction as the camera. The reaction product at the outlet of the capillary reactor is collected in a waste container (11).

2.2.2. Digital Image Processing (DIP)

For the investigation of biocatalytic gas–liquid reactions with a color change in straight and coiled capillary reactors, a non-invasive evaluation method is needed to determine the reaction progress. Digital image processing (DIP) is a suitable method for this purpose as it evaluates without disturbing the flow. The applied DIP steps corresponding to [13] are data/image input, image pre-processing, segmentation, masking bubbles, calibration, and analysis in MATLAB 2019. In the data/image, input step a camera acquires the images and saves them into a specific file format. The pre-processing contains image enhancement algorithms to reduce noise, for example. Within the segmentation step, a routine determines the region of interest (ROI). Masking bubbles is an optional step that should only be performed if no near-interface phenomena are to be observed. The DIP program uses a direct calibration. That means a calibration coefficient with a linear regression is calculated pixel-wise. Images of a capillary filled with known concentrations and background images (capillary filled with deionized water) are used as data input. The DIP program generates mean images and backgrounds for various concentrations. The routine then subtracts the background from the concentration images. The result is an image that shows the color intensity proportional to the absorbance of the medium. The last step is the analysis in which a generalized linear equation system is formed. Here, the information from any channel of an RGB image is stored.
With this evaluation method, it is possible to take images of the reactor at different positions and, thus, determine the reaction progress depending on the reactor length. However, this evaluation method requires the measuring points to be easily accessible and that there is very good exposure in order to produce evaluable images. Furthermore, online measurement is not possible, as the recorded images are first transferred to a computer and then used for evaluation with the developed analysis program.

2.3. EnzymeML and MS Excel-Based ELNs

EnzymeML is a standard for the documentation and standardized exchange of data on enzyme catalytic reactions addressing the FAIR principles for scientific data management [5]. EnzymeML follows the Standards for Reporting Enzymology Data (STRENDA) guidelines. These guidelines define the minimum information to be included with published data on enzyme activity to ensure the reproducibility of results. Furthermore, EnzymeML uses the SMBL (Systems Biology Markup Language) syntax, an XML-based modelling language for systems biology. SMBL is used to represent biochemical models such as metabolic or gene regulatory networks [8,14,15].
A spreadsheet is used to enter the experimental data as it allows for a more user-centred usage. The spreadsheet is then parsed to the EnzymeML, and the resulting document can then be used as a standardized exchange format to transfer data between different applications. The spreadsheet records laboratory data regarding general information of the experiment, used vessels, reactants, proteins, reactions, and kinetic models. Furthermore, the measured absorption values are included in the file. Communication between the applications takes place via the Python framework PyEnzyme [11]. This enables the document to be read and edited and at the same time ensures that it is checked for completeness and consistency [9,14].
The experimental data reported by the EnzymeML spreadsheet contribute most of the input data needed to successfully set up a process simulation. However, as it is primarily designed for batch operations, some additional information needed for process simulation is missing, such as volumetric flow rates or critical volumes of the substances. Furthermore, information on the reactor specification like length, pressure loss, and diameter are missing. Thus, an additional spreadsheet is created to consider information that is not considered by EnzymeML, but necessary to carry out subsequent process simulations.

2.4. Ontology Engineering

Ontologies are a fundamental concept for describing the existence of and relation between entities. They are necessary to store knowledge in a machine-readable and explicit way [16]. An ontology is a structured network of logically connected attributes and entities aiming to represent conceptual ideas (classes) within a specific knowledge domain. They are expressed in description languages to articulate their content in classes and establish logical relationships between their classes. With this, an ontology has classes and their hierarchical structuring as its core. Real-world representations of these classes are usually represented by individuals. Object properties are used to create connections between classes and between individuals, as well as connections between classes and individuals. Data, like a certain temperature, in turn can be asserted to individuals and classes by data properties.
The Systems Biology Ontology (SBO) [10] contains 645 classes for the formal representation of systems biology-related topics. It was developed with the aim of ensuring uniform terminology and standards for the description of models and experiments in systems biology. Using a class hierarchy and key aspects, such as the role of the reaction participants and quantitative parameters like the Michaelis–Menten constant, a classification of the mathematical expressions that describe the system and the modelling framework used can be defined. SBO terms are used in data formats, such as SMBL, to classify concepts within a model and, thus, contribute to the uniform description of models. EnzymeML uses SBO terms to define an enzymatic catalyst or the reactants of a reaction, such as the substrate [9,17].
Metadata4Ing is an ontology for the semantic description of research data in the context of a scientific activity. It comprises entities that represent research processes and management and contains classes that represent the object of investigation or the investigation method of an experiment or a simulation. Metadata4Ing draws on existing ontology entities from, for example, the European Materials and Modeling Ontology (EMMO) [18] or the Basic Formal Ontology (BFO) [19], which are refined with their own classes, properties, relations, and axioms. At the heart of the Metadata4Ing ontology is the processing step class for describing processing steps within a process model. Based on this class, investigation objects or investigation variables of a process can be specified with the object property investigated [20].
Both ontologies contain important concepts to describe the overall process of laboratory experiments to process simulations. In a first step, a class hierarchy is taken up to have a list of needed classes. The classes integrated here map all the information from the EnzymeML spreadsheet and the additional spreadsheet to obtain a list of the classes to be modelled in the ontology. In addition, further information required by DWSIM to implement a biocatalytic reaction is investigated. These specific requirements are identified as separate classes and integrated into the class hierarchy. In the second step, the Metadata4Ing ontology and the SBO are combined. The entities of the ontologies are first compared with each other and then evaluated to what extent they are suitable for the application of a process simulation. Those entities that do not fit the desired application are removed from the ontology in a third step. In the fourth step, the combined ontology is extended by adding the class hierarchy, whereby entities are not to be defined redundantly. Finally, object properties are defined to refine the classes and data properties are formulated to secure process-relevant data types.
Extending the tailored ontology with the data acquired from EnzymeML and data created by the process simulation enables the construction of a knowledge graph. This resulting knowledge graph can subsequently also be queried using SPARQL to retrieve the stored information in an automated manner.

2.5. Process Simulation with DWSIM

DWSIM [4] is an open-source chemical process simulator with a graphical user interface for visualizing flowcharts and an application programming interface (API) that enables automated creation and execution of flowcharts. Its goal is to create an open platform for exchanging information between different process modeling tools and facilitating collaboration between various software applications. DWSIM’s application programming interface (API) supports the Python programming language, allowing access to all simulation elements, including flowsheets, thermodynamic models, and substance databases. This enables the direct application of changed parameters to the simulation. DWSIM performs calculations and returns results to the Python environment, allowing for flowchart creation, process modeling, and insight without opening the graphical user interface.
Process modeling involves the automated creation of an empty flowsheet that is filled consecutively with the needed data by an automation manager. Thus, reactants and the process flow are modeled, as well as reactor specifications, and property packages defined.
For modeling input streams, corresponding substance quantities and volume flows are specified.
To define the customized reaction kinetics, a Python script is generated and passed via the API to DWSIM. This allows for tailored reaction kinetics like the realization of the Michaelis–Menten kinetics equation in contrast to the program’s default Arrhenius kinetics. The script is then stored and transferred to DWSIM for execution of the process simulation. The process concludes with requesting the calculation of the flowsheet and saving the simulation file.
To automate the process simulation, the DWSIM automation manager can be called via an API. This enables date to be imported from the knowledge graph automatically. Thus, information on reactants, setup of the flow diagram, material streams, and process parameters can be added in an automated way. Furthermore, the Python script for the dynamic calculation of reaction rates can be inserted into the process simulator, enabling the simulation of reactors with custom reaction rates. Finally, the process simulation is executed by the API and the resulting data is read out and re-integrated into the knowledge graph. The overall workflow described for the execution of process simulations in DWSIM is depicted in Figure 3.

3. Results and Discussion

This section contains the results of the experiments of the capillary reactors with regard to the oxidation of ABTS. The recorded experimental data are then used to execute the data integration into a knowledge graph allowing for process simulations. Finally, the results of process simulation are compared to the laboratory experiments.

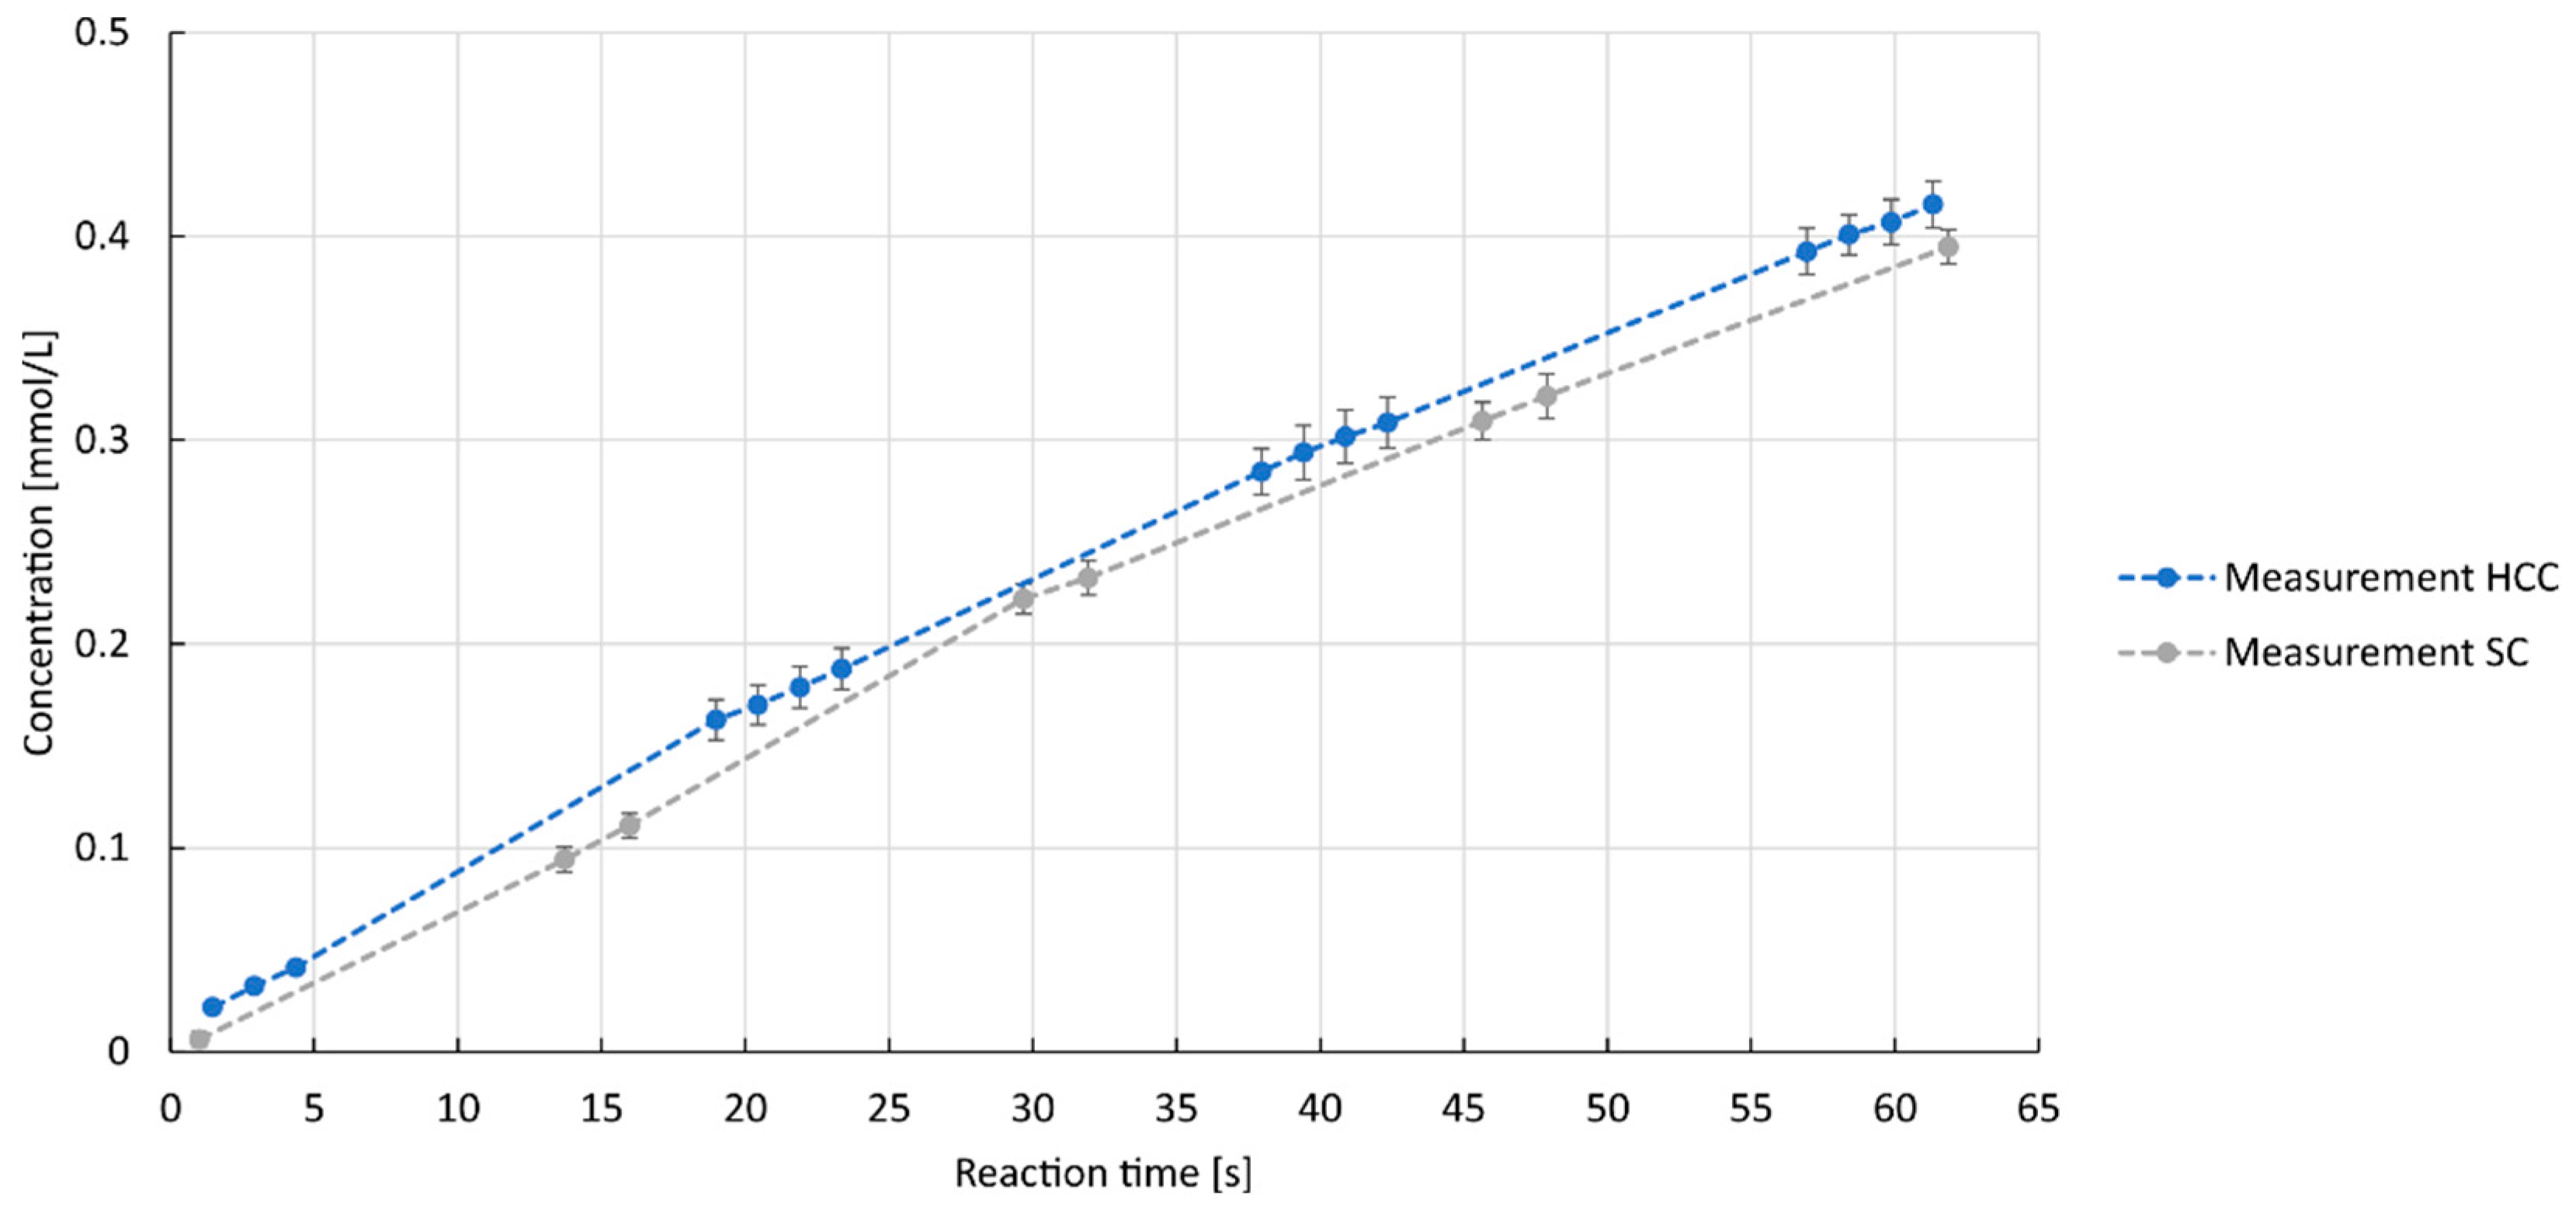
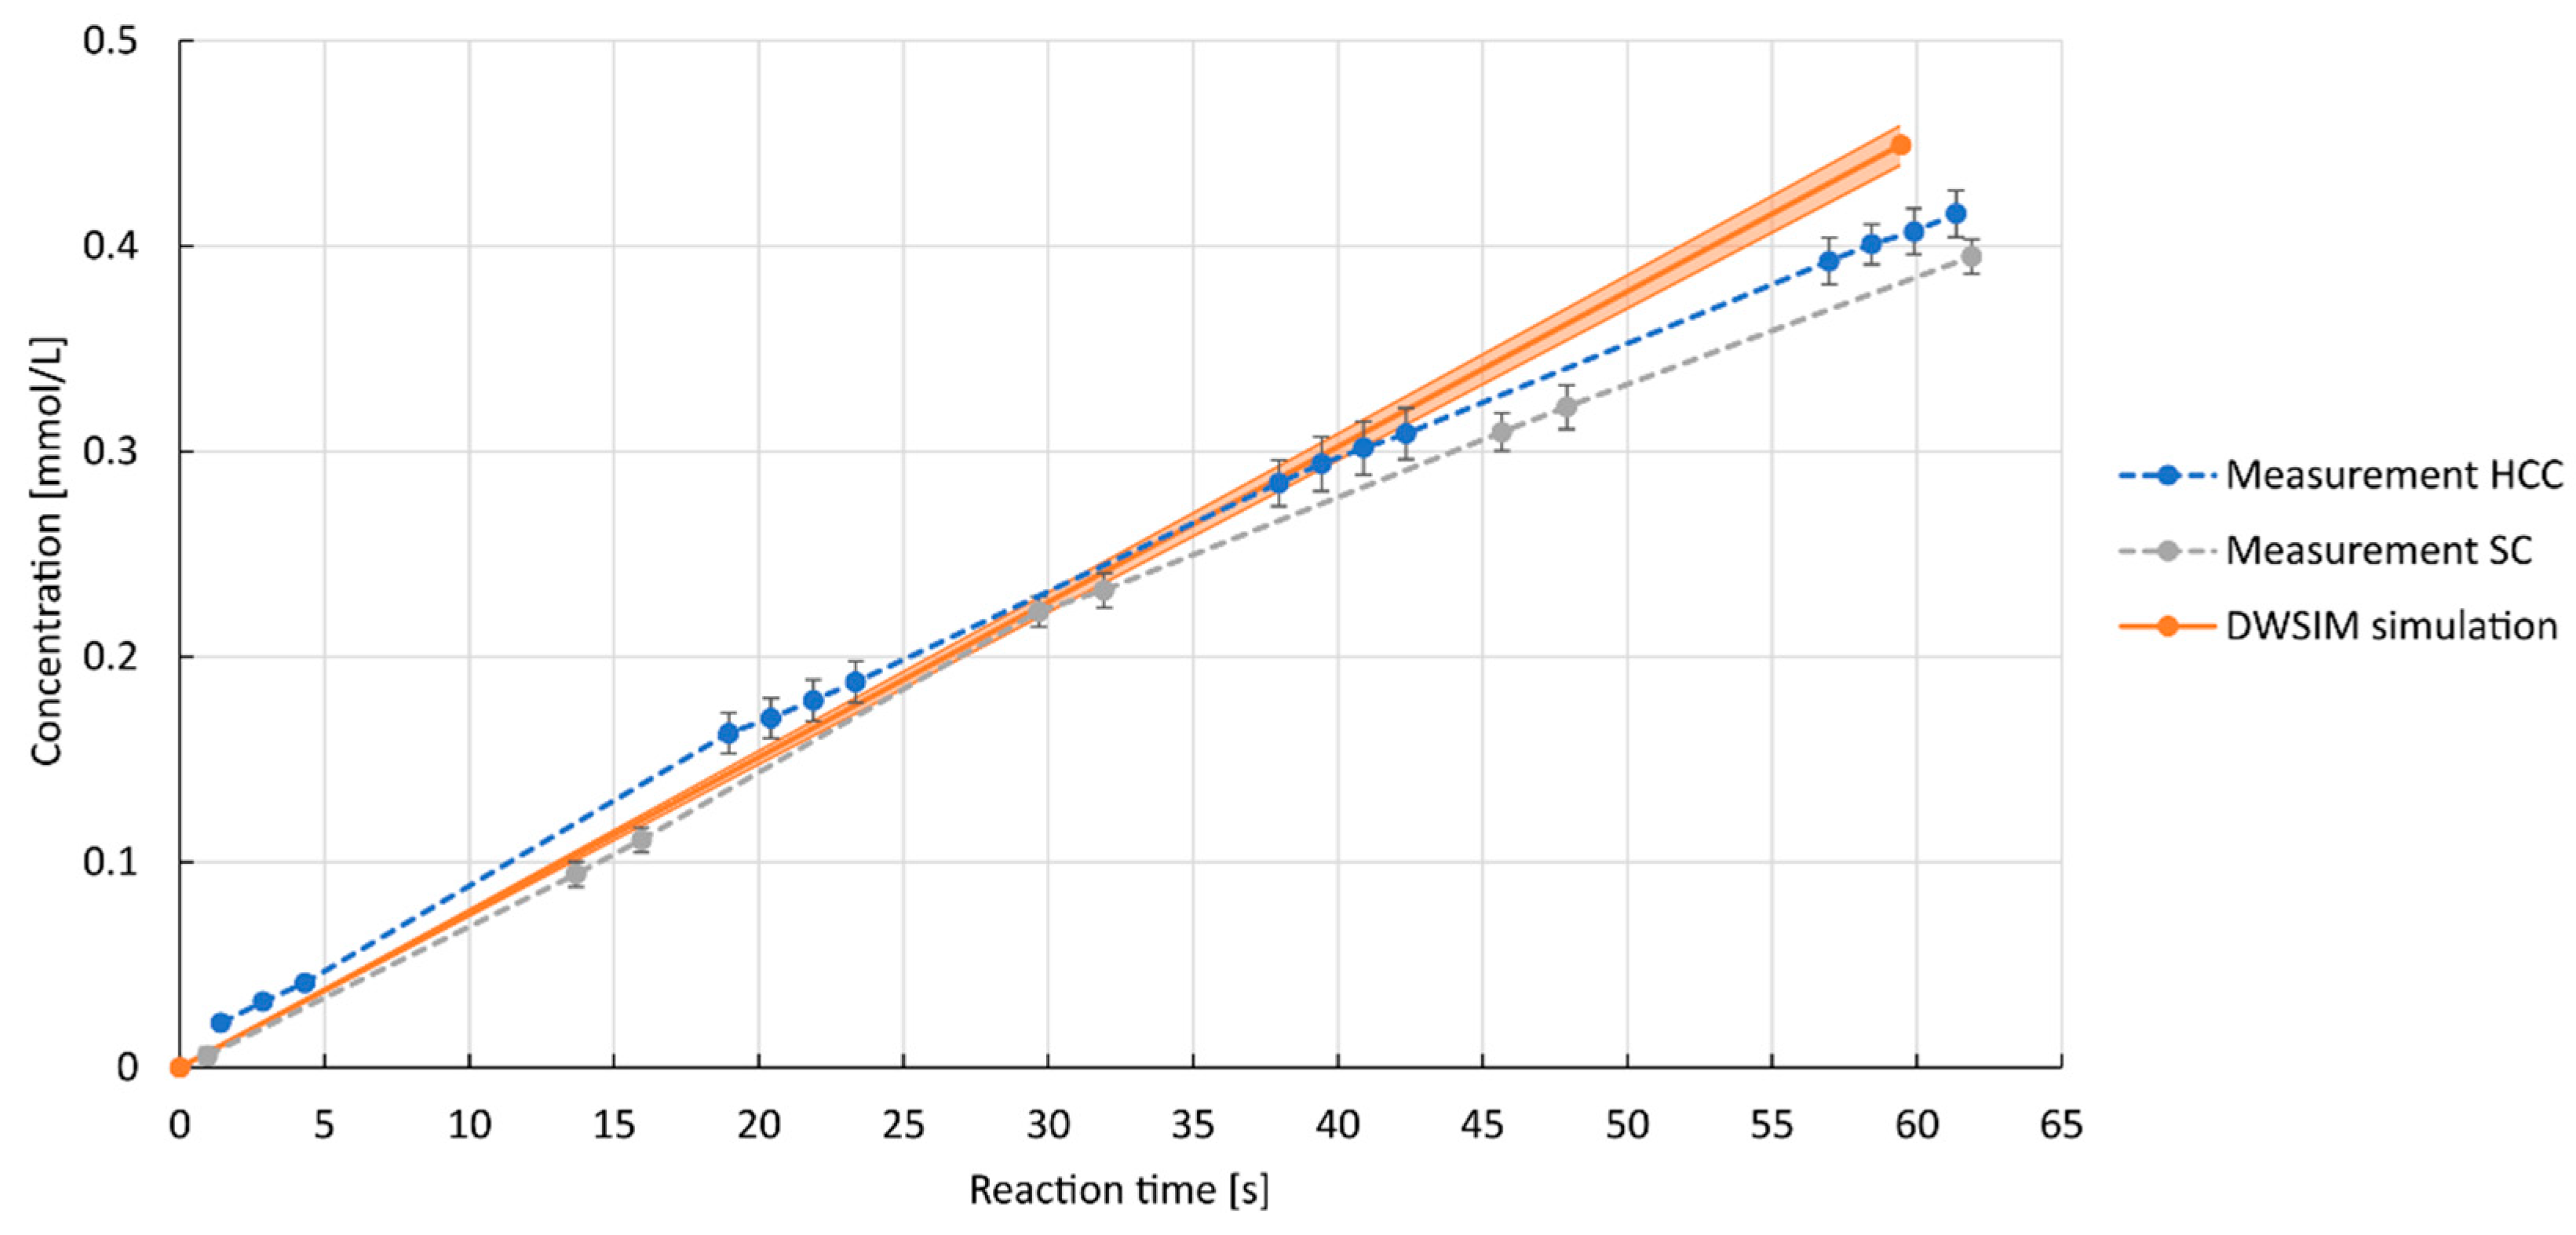
3.1. Experimental Results of Reactor Experiments

The measured data sets were stored in an EnzymeML spreadsheet according to the described workflow. The apparent enzyme kinetics for the substrate ABTS were calculated using Michealis–Menten kinetics. Apparent kinetics means that the influence of varying ABTS concentrations on reaction rates was determined at a constant oxygen concentration. The determined kinetics, a K M a p p of 1.2 mM and a k c a t a p p of 2.0 s−1, are therefore specific for the oxygen concentration used for the experiments. The K M a p p is higher and the k c a t a p p is lower than previously reported values in the literature [21,22,23,24,25]. As only apparent kinetics were recorded here and the influence of oxygen was not investigated independently, oxygen availability may have influenced the data. In addition, the influence of Tween® 80 that is required to ensure a stable gas–liquid flow in the flow reactor cannot be excluded. Furthermore, the reaction conditions were different regarding temperature, pH, and buffer in comparison to literature values. However, as only reference data was required rather than the optimal catalytic performance, the study was continued under these conditions.
In addition to the enzyme kinetics, experimental reference data were required. Microreactors are characterized by their large specific surface area, controlled flow conditions, and improved heat and mass transfer. Due to good mixing, short residence time, and narrow residence time distribution, they offer high selectivity, which makes them interesting for the chemical and biochemical process industry [3]. Microreactors are often used to obtain early-stage process data, which is beneficial in bioprocess development as they allow control over variables and reduce time and cost [26,27]. For these reasons, as well as the extensive experience of the research group, this reactor type was used to collect reference data for the subsequent simulation. Two different designs for flow reactors were selected for this purpose. A flow reactor consisting of a straight capillary was used in order to minimize the formation of Dean vortices. In this reactor, mixing in the liquid phase takes place mainly through Taylor vortices. To enhance mixing, a helically coiled capillary reactor was also used, in which the capillary was wound in a spiral shape. The fact that the reactor geometry has an influence on mixing has already been demonstrated in the past with various reaction systems [28]. The reaction progress of both reactors is shown in Figure 4.
No substantial difference in the reaction progress was observed between the straight capillary reactor and the helically coiled capillary reactor. The mean catalytic activities of 0.77 U mg−1 ± 0.03 for the straight capillary reactor and 0.78 U mg−1 ± 0.02 for the helically coiled capillary reactor demonstrate that the chosen reactor designs have no influence on the reaction rate in these experiments. The concave shape in the experimental data could be explained by the presence of inhibitory or limiting factors such as oxygen availability, but these are not considered further here.

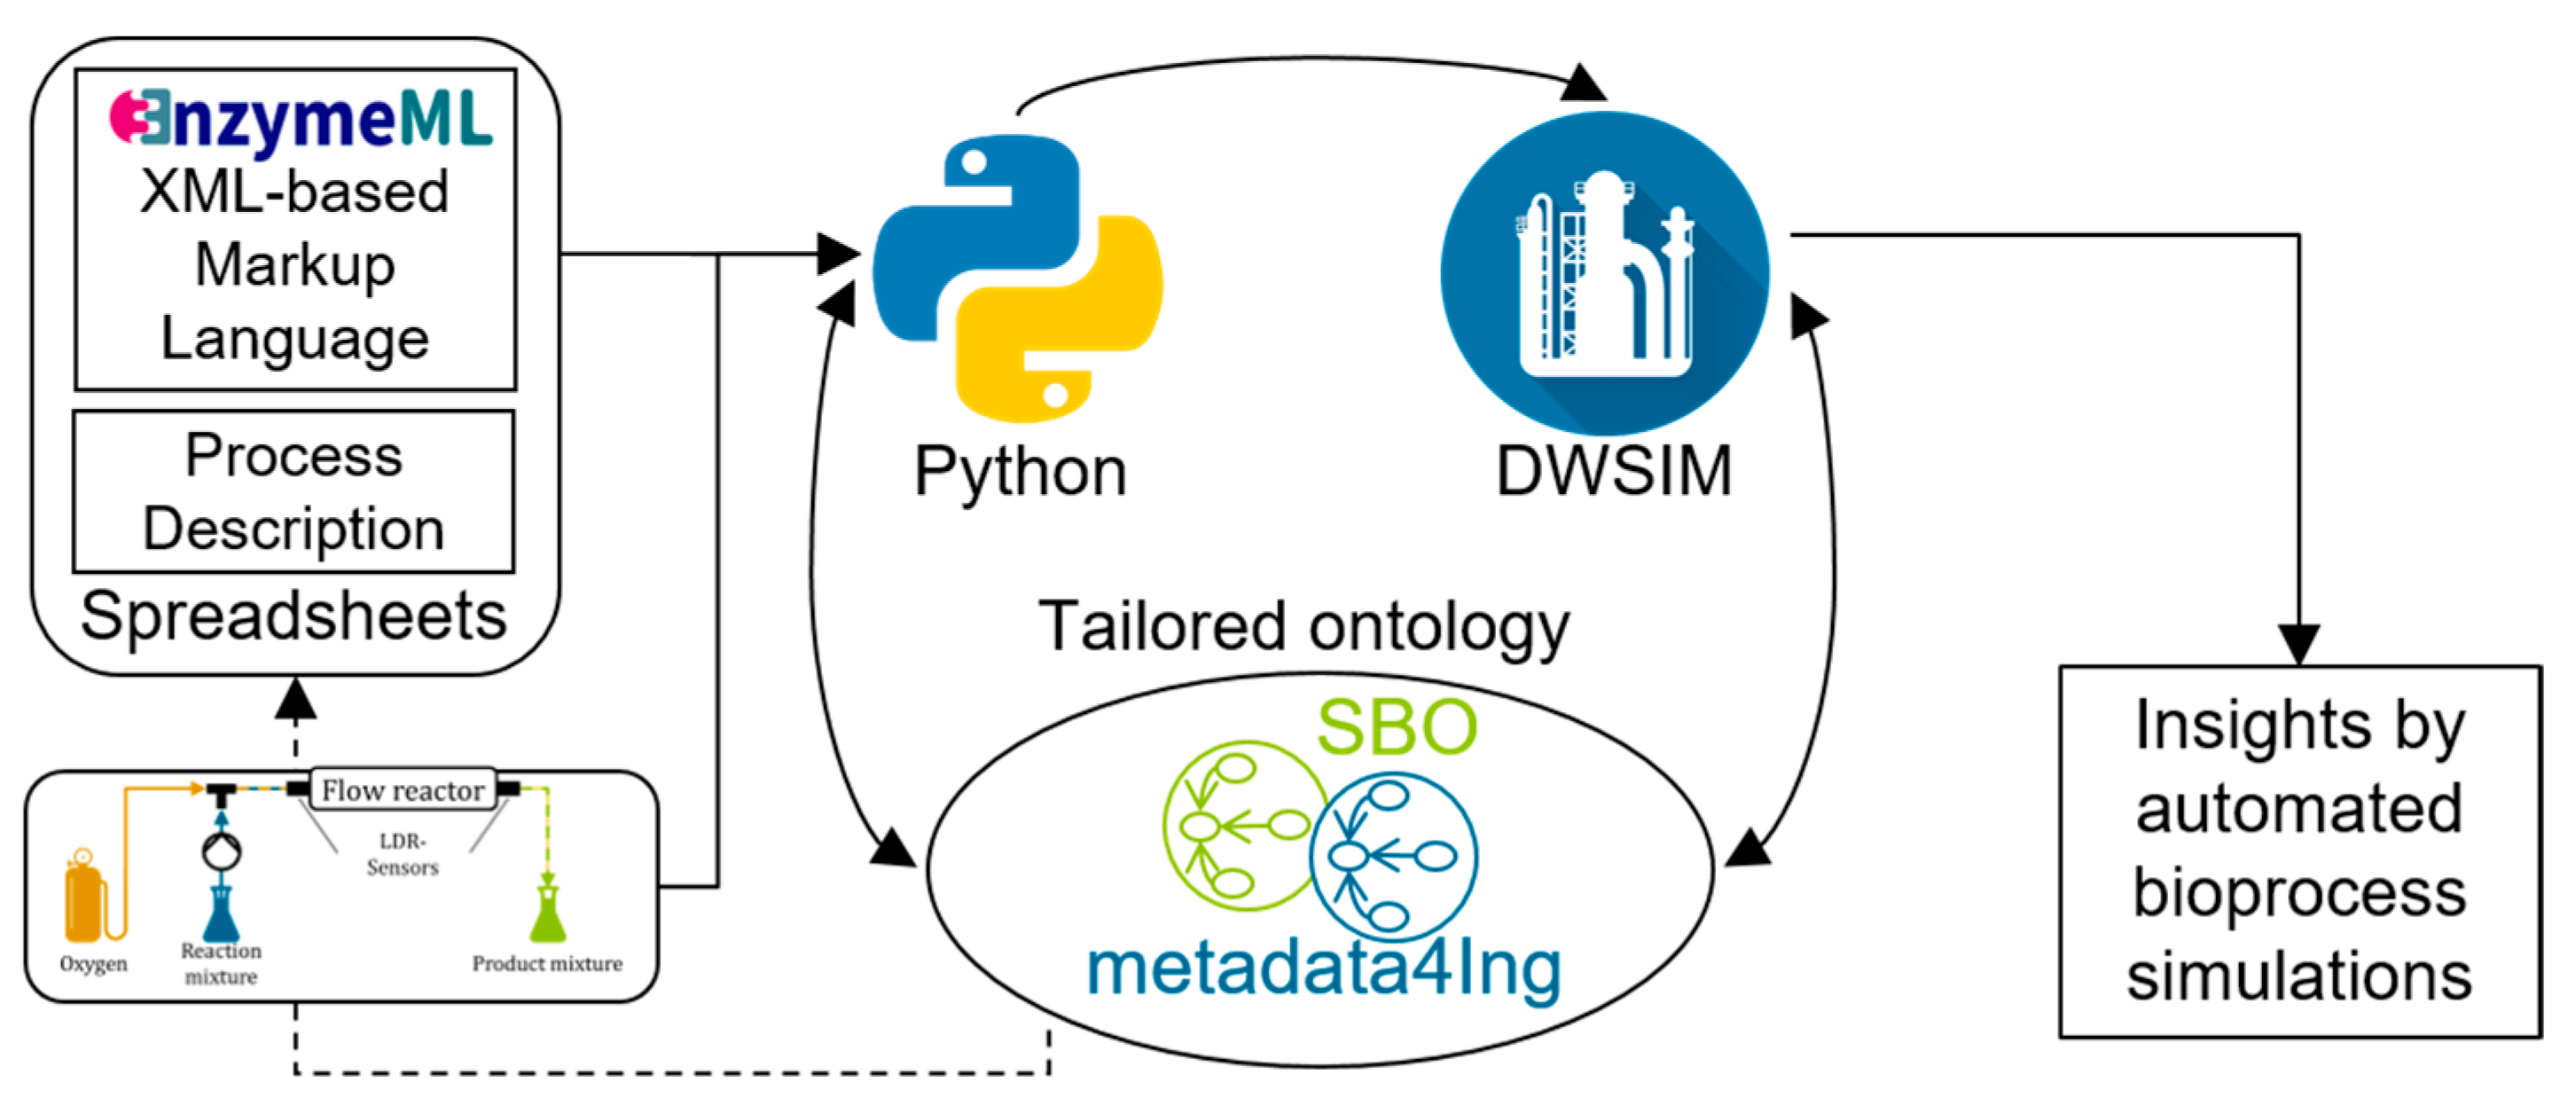
3.2. Automated Integration of Laboratory Data in Process Simulations

After recording the laboratory data within EnzymeML and the MS Excel-based ELN, population of the tailored ontology with the data takes place. The data are then transferred into DWSIM, and the process simulation is executed. The Python codes produced for this, the EnzymeML spreadsheet, and the MS Excel-based ELN are available in a GitHub Repository as noted in the Supplementary Materials section of this work.

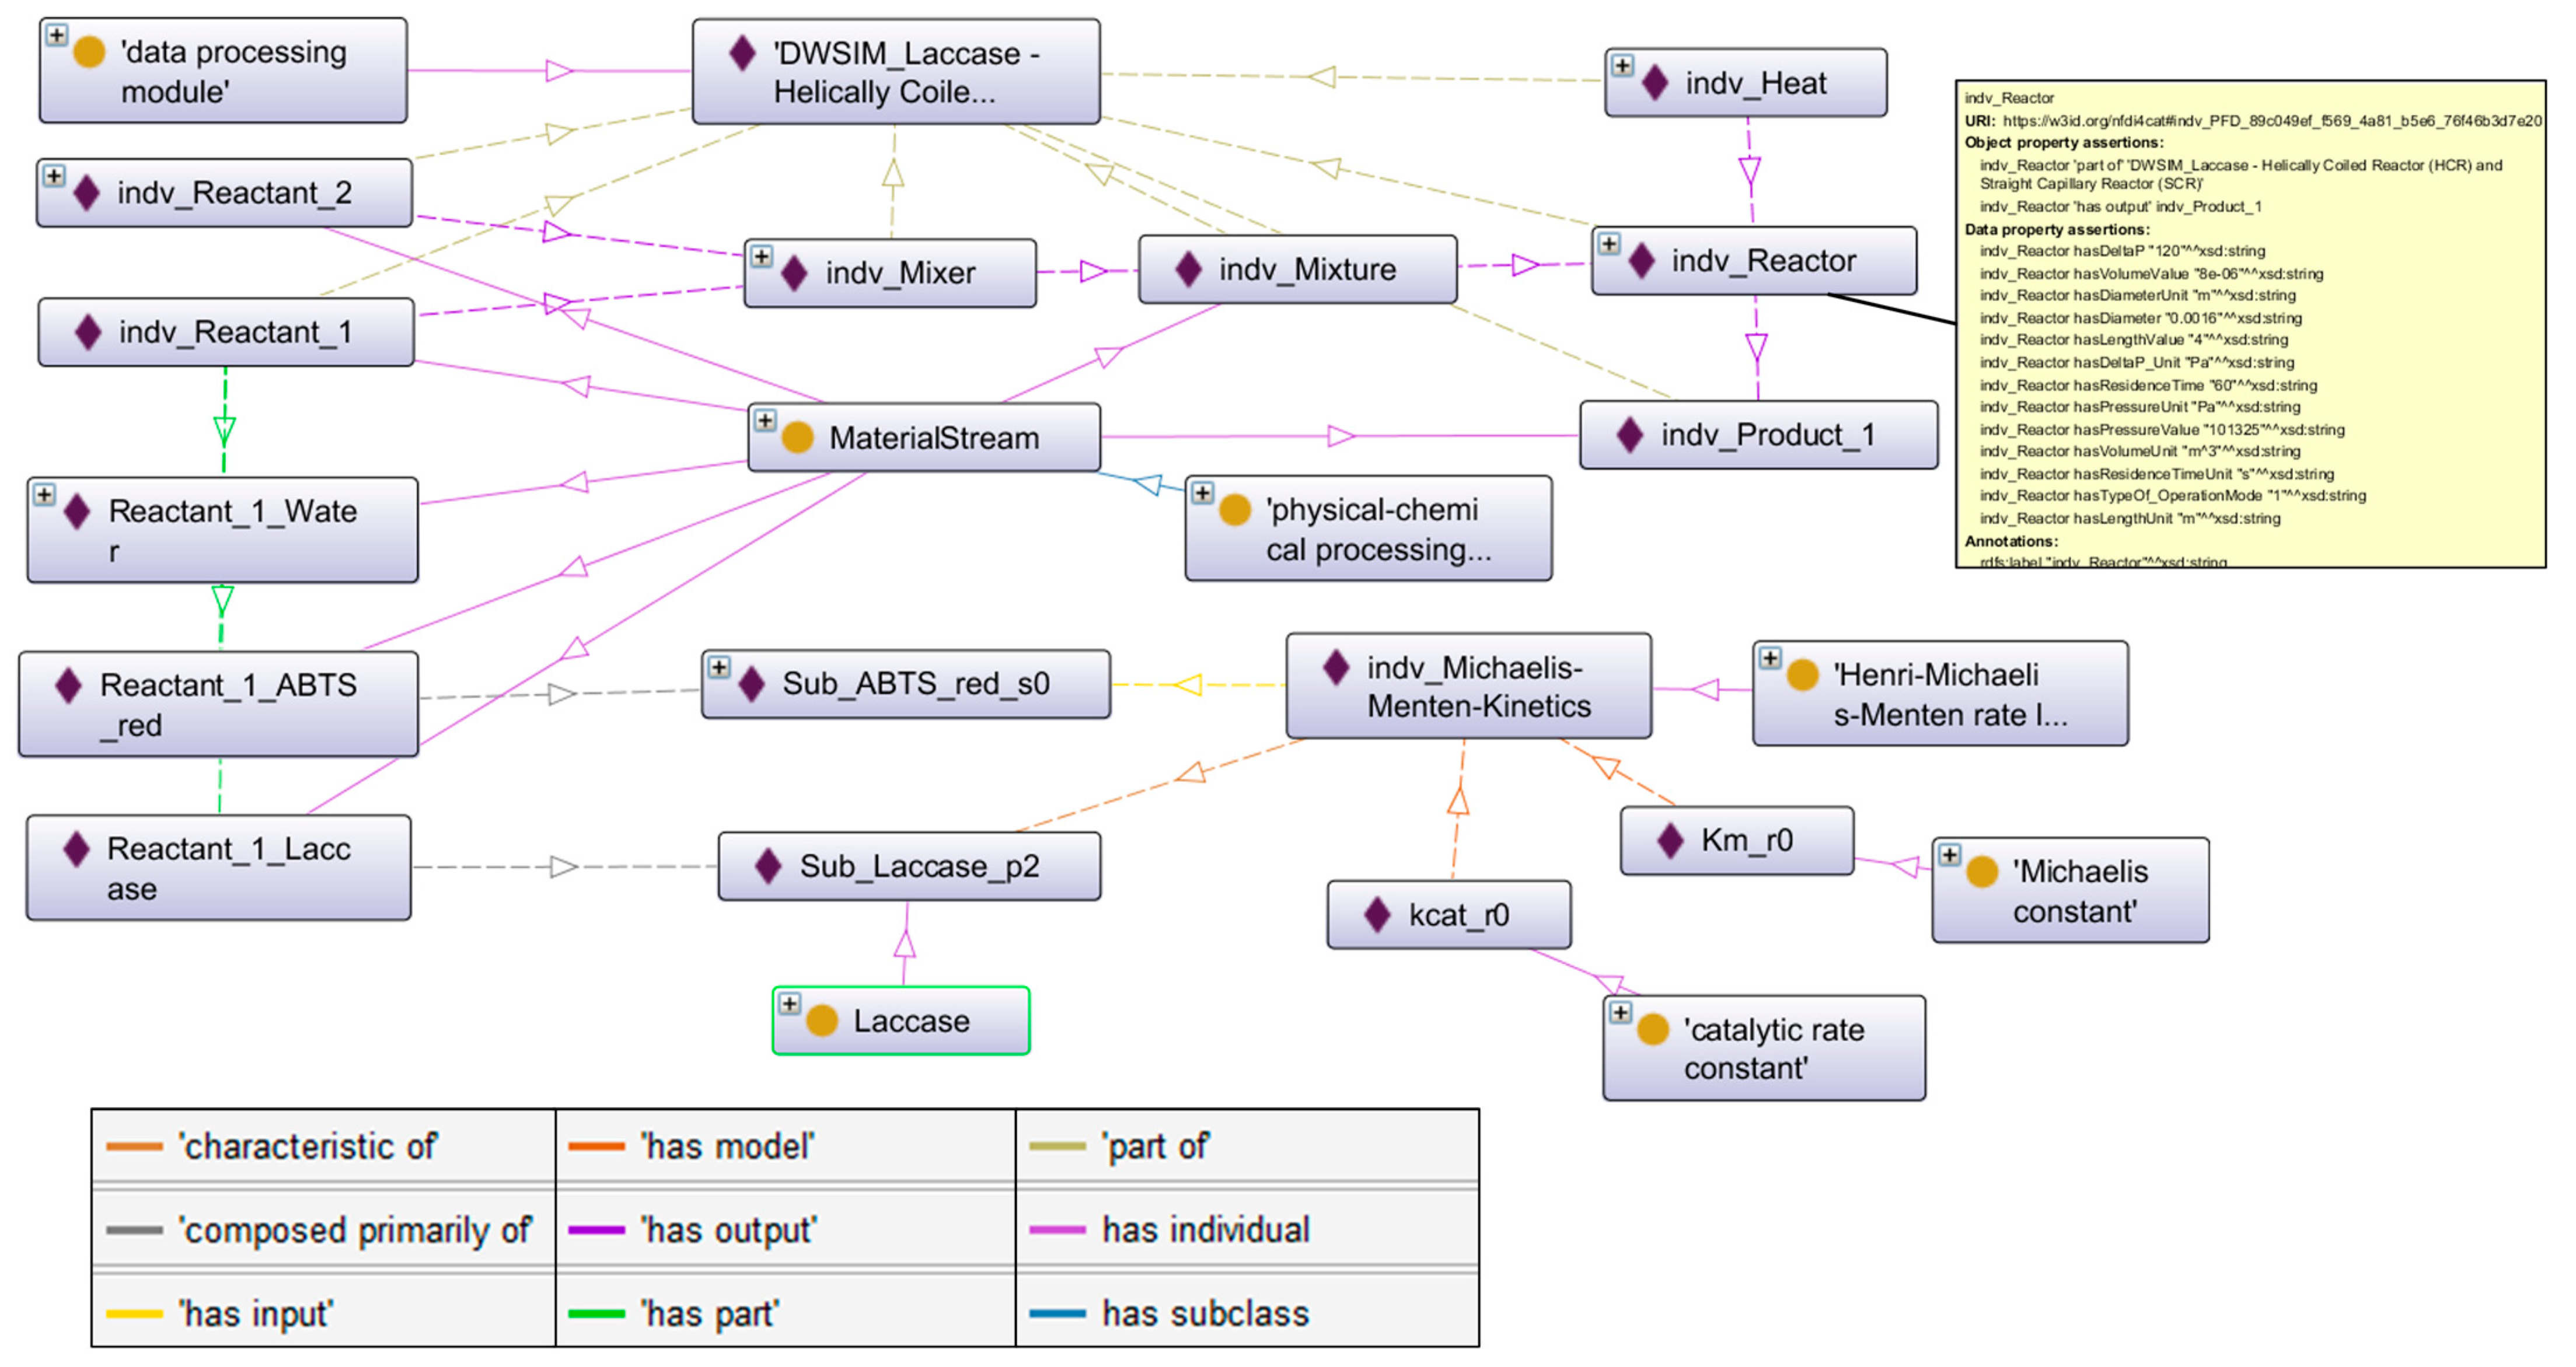
3.2.1. Integration of Experimental Data in the Ontology

With help of the Python frameworks PyEnzyme and Pandas, the data are extracted and included in the tailored ontology. For this, the Python framework owlready2 [29] is utilized to facilitate automated data integration into the ontology.
To illustrate the method of integrating new classes and data into the ontology, the modelling of the substance laccase inside the ontology is described in detail here. Within the ontology, the substance laccase is modelled as a subclass of the already existing SBO-contained class of polypeptide chain (OBO ID SBO:0000252). The laccase used in the laboratory experiments is described in the ontology as individual of the class Laccase and called “Sub_Laccase_p2”. This in turn allows for the individual to have specific data properties regarding its K M a p p and k c a t a p p values for the Michaelis–Menten rate law. The individual “indv_Michaelis-Menten-kinetics” describes the Michaelis–Menten rate law for this specific reaction and is an individual from the SBO-contained class “Henri-Michaelis-Menten rate law” (ontology class SBO:0000029). The classes “kcat_r0” and “Km_r0” are connected to the class “Henri-Michaelis-Menten rate law” via the relation “has model” (ontology class RO:0002615) [30], thus, implying the same relation to the respective individuals. Furthermore, the inlet-flow of the reactor is modelled in the ontology as individual “Indv_Reactant_1”, consisting of three subordinated material flows related by the “has part” (ontology class BFO:0000051) relation. With this, the liquid inlet-flow can be distinguished in its mass flows of substances, allowing connection of the process flows with the enzyme kinetics. The mass flow individual “Reactant_1_Laccase” in turn relates to the previously mentioned Laccase individual with the object property “composed primarily of” (ontology class RO:0002473) [30]. The relation “has output” (RO:0002234) connects the individuals of the respective processing module class with the labels “indv_Reactant_1”, “indv_Reactant_2”, “indv_Mixer”, “indv_Mixture”, “indv_Reactor”, “indv_Heat”, and “indv_Product”. To avoid confusion of the individuals with newly created flow diagram objects in future runs, the unique resource identifiers (URIs) of the individuals are generated with the help of universally unique identifiers (UUIDs), consisting of a randomly generated 32-bit string. This not only allows the process flow diagram to be set up within the knowledge graph, but also allows inclusion of data from EnzymeML, the MS Excel-based ELN, and the process simulation in one knowledge graph.
These relationships and new individuals are created in an automated way in Python by the data contained in EnzymeML and the MS Excel-based ELN, enabling a dynamic creation of this knowledge graph. This excerpt of the overall knowledge graph is depicted in Figure 5 using the ontology editor software Protégé v. 5.5.0 [31]. The reactant oxygen is modelled as part of the individual indv_Reactant_2 and is omitted from this visualization for reasons of clarity.

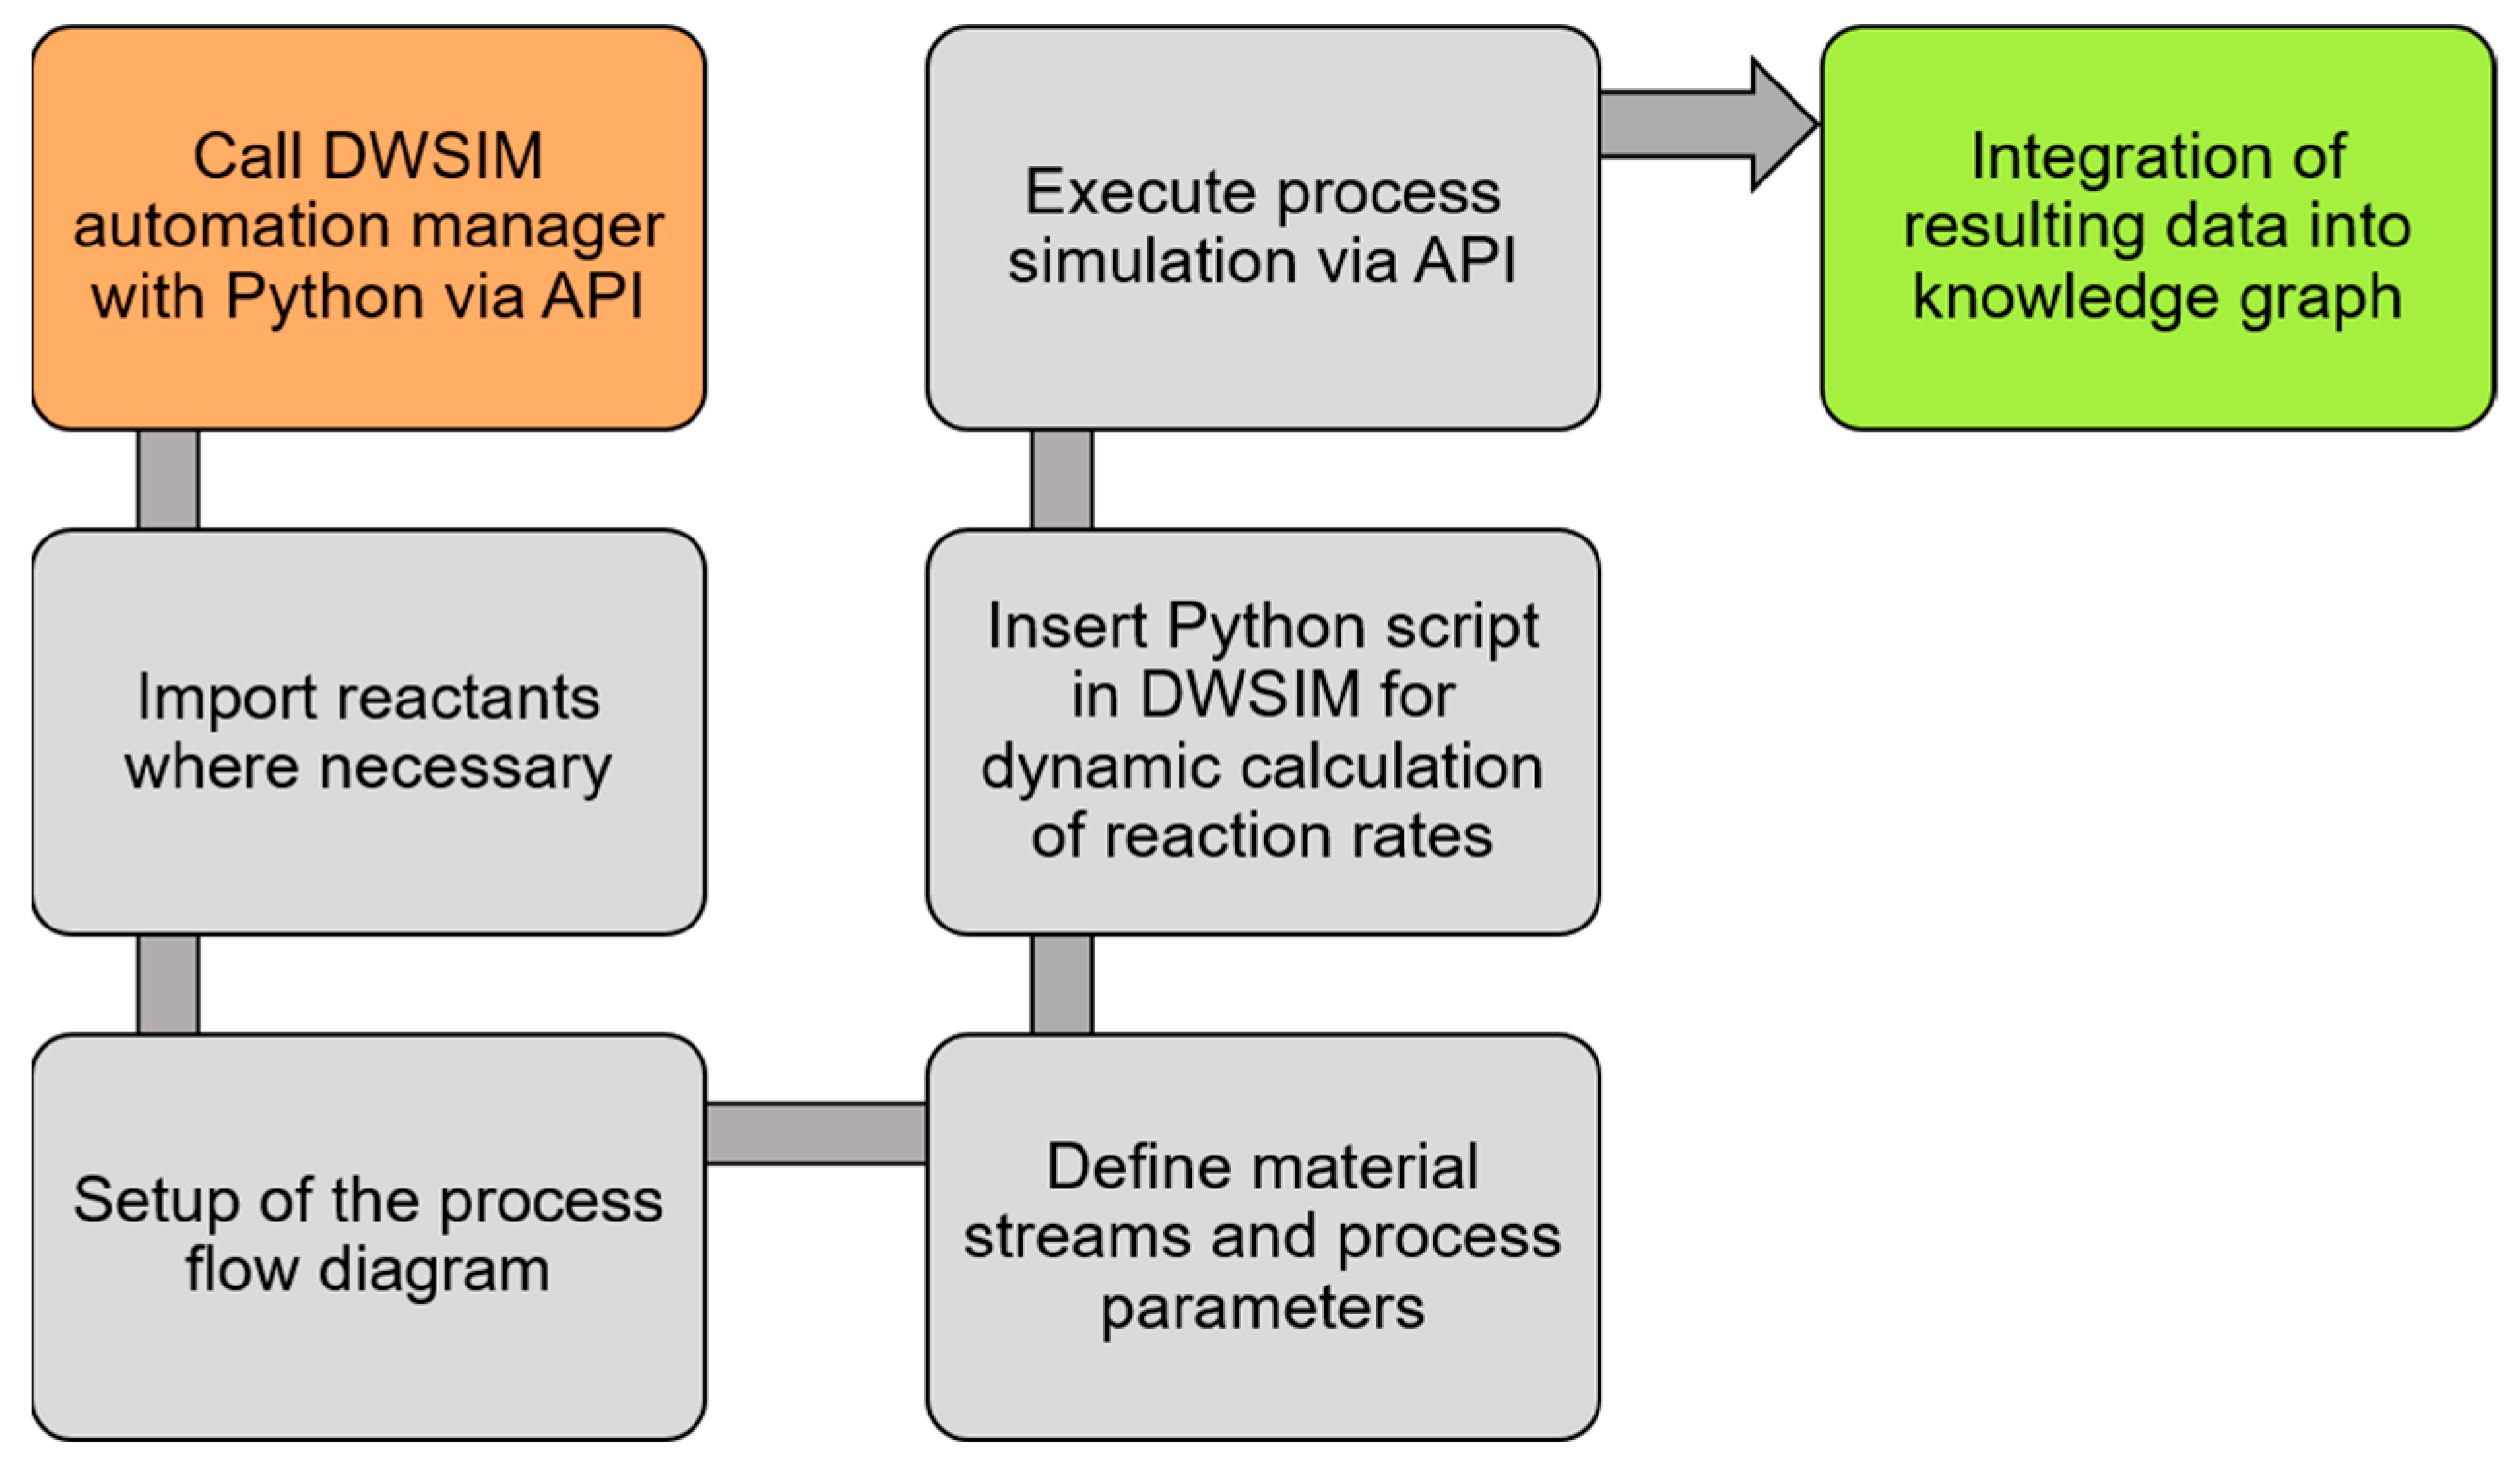
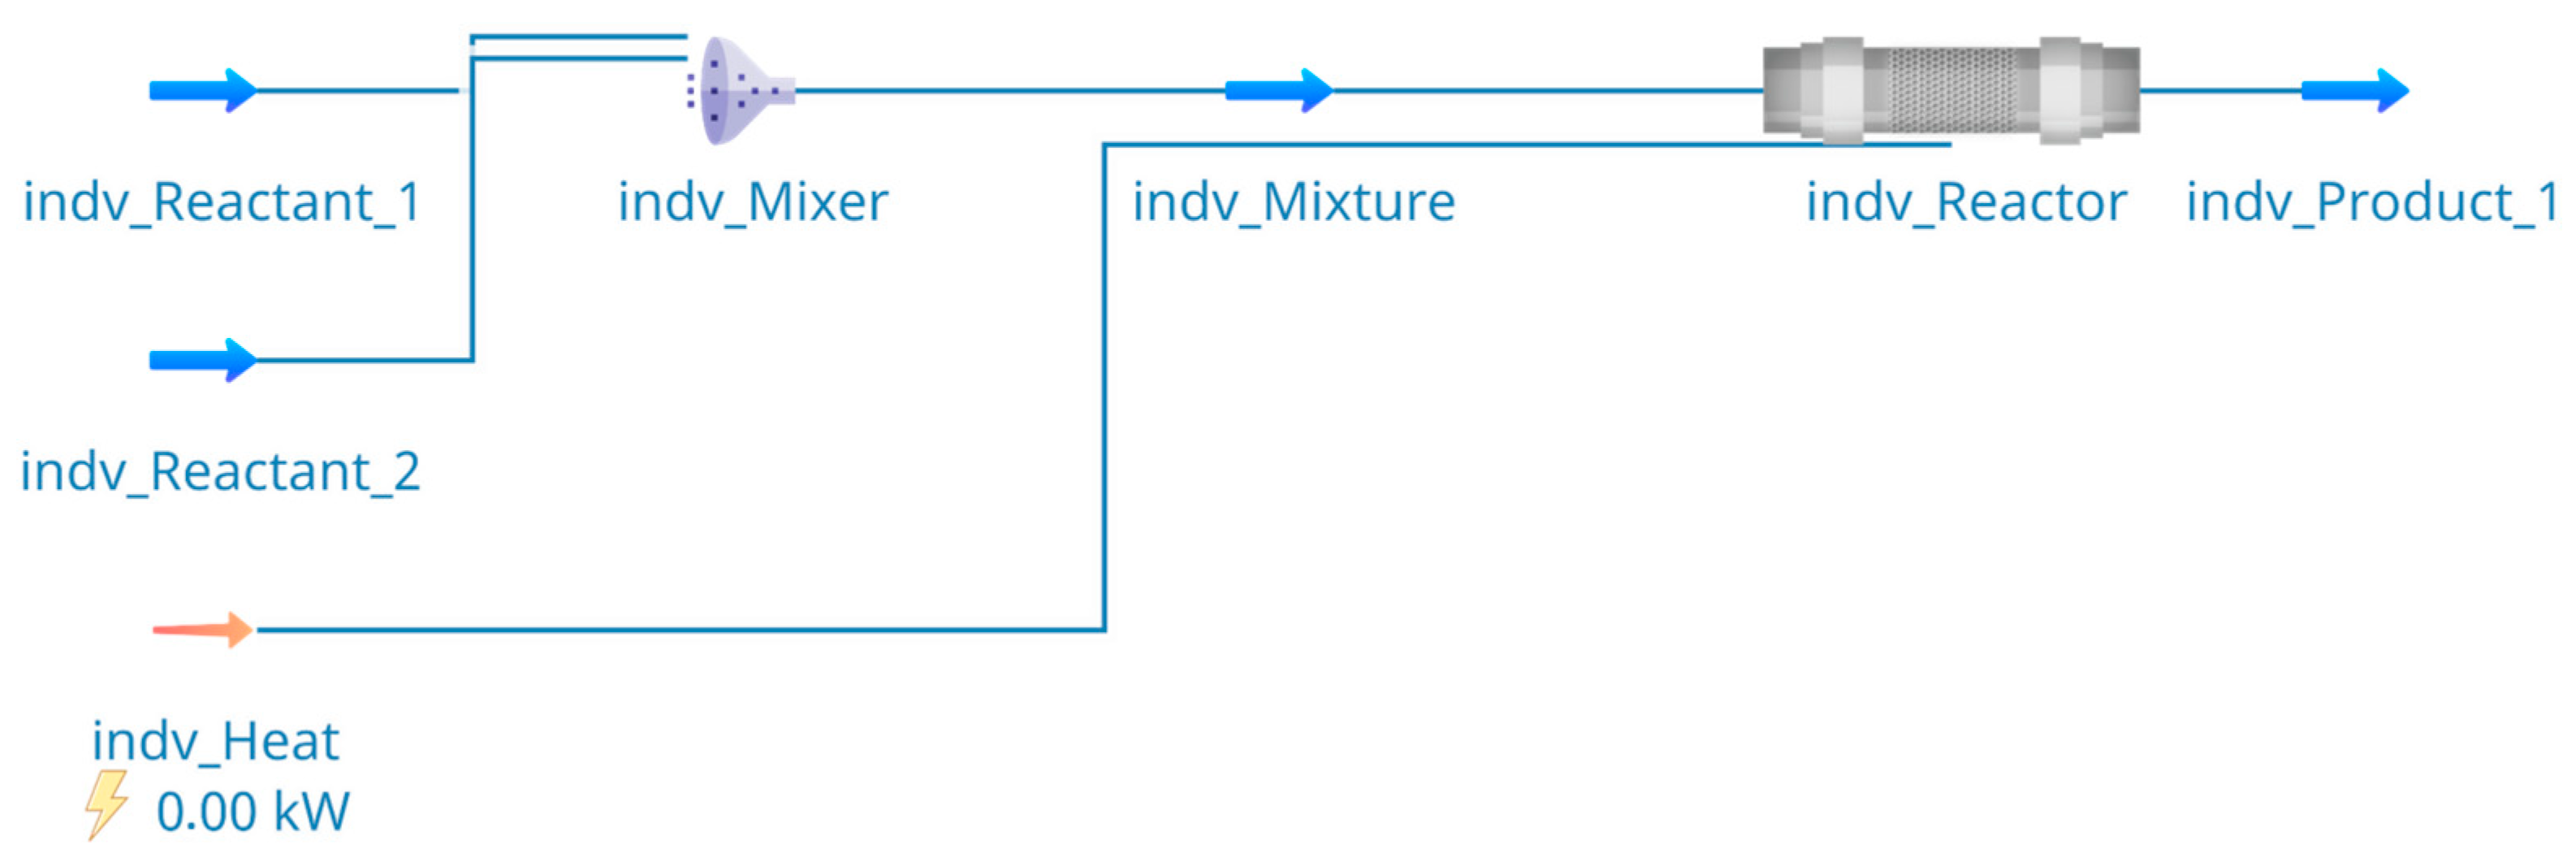
3.2.2. Automated Process Simulation

The process simulation in DWSIM (v. 8.4.6) is executed with experimentally determined kinetic parameters with a K M a p p of 1.2 mM and a k c a t a p p of 2.4 s −1. As DWSIM does not provide the investigated reactor classes, a plug flow reactor (PFR) is used to model the two-phase flow reactors. With the detailed information on the process from the knowledge graph, the PFD is set up in the process simulator in an automated way. Figure 6 shows the resulting PFD from the DWSIM user interface, with defined entering mass-flows (indv_Reactant_1 and indv_Reactant_2), a mixer (indv_Mixer) creating the gas–liquid flow (indv_Mixture) that flows into the reactor (indv_Reactor) and finally exits the reactor (indv_Product_1). Additionally, an energy stream (indv_Heat) enters the reactor. However, since the reaction is calculated as isothermal, the energy stream gets calculated as 0 by the simulator. The flow rates of the gas and liquid streams in the experiments, for example, are used to set the corresponding mass flows in the process simulation (indv_Reactant_1 and indv_Reactant_2). Furthermore, the details on the substance parameters, like molar weight, from the knowledge graph, are used to set up the corresponding substances in the process simulator. In addition, the reaction equation and rate are defined based on the previously recorded data, such that the reaction in the reactor follows the Michaelis–Menten rate and utilizes the aforementioned K M a p p and k c a t a p p . Upon execution, DWSIM then calculates, among others, the outgoing flow rate of the liquid and the gas phase and the respective concentrations of the substances in stream indv_Product_1. This in turn allows for direct comparison of the resulting product concentrations in the simulated case with the experimental product concentrations.
The results of the process simulations are shown in Figure 7, along with corresponding laboratory experiments as an example of the investigated parameters. At the reactor inlet, the parameters were set to a concentration of laccase of 11.6 µM, a concentration of ABTS in the liquid phase of 0.97 mM, and a concentration of oxygen in the gas phase of 1.34 mM, with overall volumetric flow rates of 3 mL min−1 of gas and 5 mL min−1 of liquid phase. Using the data as denoted for the start conditions of the reactor within the ELNs, the reaction time of the liquid within the reactor is calculated to be 59 s. The deviation observed in Figure 7 between the simulation results and the experimental data beyond 40 s can be attributed to the fact that the data was modeled using a Michaelis–Menten model, which did not account for inhibition by the product or oxygen limitations. In addition, hydrodynamics and internal mixing might have an influence on the enzymatic reaction.

4. Conclusions

In this study, a workflow was developed that automates the transfer of data from EnzymeML for recording biocatalysis data in the laboratory accompanied by a self-designed spreadsheet to capture process data coupled to process simulation software. The transfer and structuring of data with a tailored ontology allow for efficient data transfer with minimal user input. This ontology was set up using primarily concepts of the SBO, extended by concepts from other existing ontologies such as the OBO Relations Ontology. The resulting tailored ontology was then extended to a knowledge graph with regards to laboratory and process simulation data. This enables the automated transfer of laboratory data into the process simulator, thus facilitating faster and more efficient execution of process simulation based on laboratory data. Additionally, the knowledge graph can serve as object-relational data storage also fit for further querying with, for example, SPARQL-queries, enhancing the data FAIRness.
With regards to the process simulation in DWSIM, an automated fill in of experimental data into the process simulator was facilitated via its API. While this workflow might still be domain dependent, it also enables researchers to more rapidly incorporate their laboratory data into the process simulation software, advancing the overall process development and scale-up investigations. However, the simulation results still deviate from the laboratory experiments due to still-existing modeling shortcomings. The hydrodynamics as well as internal mixing will be considered in future studies.

Supplementary Materials

EnzymeML spreadsheets, Excel-based ELNs, code produced for the execution of DWSIM simulations, and the knowledge graph extension can be found in the GitHub Repository https://github.com/TUDoAD/DWSIM-EnzymeML-KG (accessed on 3 February 2024). The version of the repository that was created for this publication is permanently accessible at https://zenodo.org/records/10613474 (accessed on 3 February 2024).

Author Contributions

Conceptualization, A.S.B. and K.R.; methodology, A.S.B., E.A., K.R., M.H. and J.S.; software, E.A., A.S.B. and M.H.; validation, A.S.B., K.R., J.P., M.H., S.L. and N.K.; data curation, K.R. and J.S.; writing—original draft preparation, A.S.B., K.R., J.S. and M.H.; writing—review and editing, N.K., J.P. and S.L.; visualization, A.S.B. and J.S.; supervision, K.R., N.K., S.L. and J.P. All authors have read and agreed to the published version of the manuscript.

Funding

This research was partly funded by grant NFDI/2-1-2021 for ASB, EA, grant KO2349/13-1 for J.S., and as part of SFB 1333/2, grant 358283783 for JP.

Data Availability Statement

Data are contained within the article.

Acknowledgments

The authors would like to thank Bibiazhar Suleimen and Subhan Aamir for carrying out the enzyme kinetics experiments and Murat Oruc for carrying out the flow reactor experiments. A.S.B. thanks the networking program ‘Sustainable Chemical Synthesis 2.0′ (SusChemSys 2.0) for the support and fruitful discussions across disciplines.

Conflicts of Interest

The authors declare no conflict of interest.

References

  1. Wu, S.; Snajdrova, R.; Moore, J.C.; Baldenius, K.; Bornscheuer, U.T. Biocatalysis: Enzymatic Synthesis for Industrial Applications. Angew. Chem. Int. Ed. Engl. 2021, 60, 88–119. [Google Scholar] [CrossRef]
  2. Rosenthal, K.; Lütz, S. Recent developments and challenges of biocatalytic processes in the pharmaceutical industry. Current Opin. Green Sustain. Chem. 2018, 11, 58–64. [Google Scholar] [CrossRef]
  3. de Santis, P.; Meyer, L.-E.; Kara, S. The rise of continuous flow biocatalysis—Fundamentals, very recent developments and future perspectives. React. Chem. Eng. 2020, 5, 2155–2184. [Google Scholar] [CrossRef]
  4. Medeiros, D. DWSIM—Open Source Process Simulator. 2023. Available online: https://dwsim.org/ (accessed on 17 January 2024).
  5. Wilkinson, M.D.; Dumontier, M.; Jan Aalbersberg, I.J.; Appleton, G.; Axton, M.; Baak, A.; Blomberg, N.; Boiten, J.-W.; da Silva Santos, L.B.; Bourne, P.E.; et al. The FAIR Guiding Principles for scientific data management and stewardship. Sci. Data 2016, 3, 160018. [Google Scholar] [CrossRef]
  6. Grühn, J.; Behr, A.S.; Eroglu, T.H.; Trögel, V.; Rosenthal, K.; Kockmann, N. From Coiled Flow Inverter to Stirred Tank Reactor—Bioprocess Development and Ontology Design. Chem. Ing. Tech. 2022, 94, 852–863. [Google Scholar] [CrossRef]
  7. Menke, M.J.; Behr, A.S.; Rosenthal, K.; Linke, D.; Kockmann, N.; Bornscheuer, U.T.; Dörr, M. Development of an Ontology for Biocatalysis. Chem. Ing. Tech. 2022, 94, 1827–1835. [Google Scholar] [CrossRef]
  8. Lauterbach, S.; Dienhart, H.; Range, J.; Malzacher, S.; Spöring, J.-D.; Rother, D.; Pinto, M.F.; Martins, P.; Lagerman, C.E.; Bommarius, A.S.; et al. EnzymeML: Seamless data flow and modeling of enzymatic data. Nat. Methods 2023, 20, 400–402. [Google Scholar] [CrossRef] [PubMed]
  9. Range, J.; Halupczok, C.; Lohmann, J.; Swainston, N.; Kettner, C.; Bergmann, F.T.; Weidemann, A.; Wittig, U.; Schnell, S.; Pleiss, J. EnzymeML—A data exchange format for biocatalysis and enzymology. FEBS J. 2022, 289, 5864–5874. [Google Scholar] [CrossRef] [PubMed]
  10. Juty, N.; Le Novère, N. Systems Biology Ontology. In Encyclopedia of Systems Biology; Dubitzky, W., Wolkenhauer, O., Cho, K.-H., Yokota, H., Eds.; Springer: New York, NY, USA, 2013; p. 2063. [Google Scholar]
  11. Range, J.; Bergmann, F.; Rohwer, J.; Reisch, A.; Dienhart, H. EnzymeML/PyEnzyme: PyEnzyme 1.1.3. Zenodo. 2022. Available online: https://zenodo.org/records/6457299 (accessed on 23 August 2023).
  12. Behr, A.S.; Abbaspour, E.; Rosenthal, K.; Pleiss, J.; Kockmann, N. Ontology-Based Laboratory Data Acquisition with EnzymeML for Process Simulation of Biocatalytic Reactors. In Proceedings of the 1st Conference on Research Data Infrastructure, Karlsruhe, Germany, 12–14 September 2023; pp. 398–401. [Google Scholar] [CrossRef]
  13. Grühn, J.; Vogel, M.; Kockmann, N. Digital Image Processing of Gas-Liquid Reactions in Coiled Capillaries. Chem. Ing. Tech. 2021, 93, 825–829. [Google Scholar] [CrossRef]
  14. Pleiss, J. Standardized Data, Scalable Documentation, Sustainable Storage—EnzymeML As A Basis For FAIR Data Management in Biocatalysis. ChemCatChem 2021, 13, 3909–3913. [Google Scholar] [CrossRef]
  15. STRENDA Guideline Level 1A Experimental Conditions; Version 1.8; Beilstein STRENDA Commission: Frankfurt am Main, Germany, 2021.
  16. Gruber, T.R. A translation approach to portable ontology specifications. Knowl. Acquis. 1993, 5, 199–220. [Google Scholar] [CrossRef]
  17. Dubitzky, W.; Wolkenhauer, O.; Cho, K.-H.; Yokota, H. (Eds.) Encyclopedia of Systems Biology; Springer: New York, NY, USA, 2013. [Google Scholar]
  18. Hashibon, A.; Ghedini, E.; Schmitz, G.; Goldbeck, G.; Friis, J. Elemental Multiperspective Material Ontology. EMMC ASBL. Available online: http://emmo.info/emmo (accessed on 4 June 2023).
  19. Arp, R.; Smith, B.; Spear, A.D. Building Ontologies with Basic Formal Ontology; Massachusetts Institute of Technology: Cambridge, MA, USA, 2015. [Google Scholar]
  20. Arndt, S.; Farnbacher, B.; Wiljes, C.; Iglezakis, D.; Terzijska, D.; Lanza, G.; Hickmann, J.; Theissen-Lipp, J.; Munke, J.; Windeck, J.; et al. Metadata4Ing: An Ontology for Describing the Generation of Research Data within a Scientific Activity. 2023. Available online: https://zenodo.org/records/10022363 (accessed on 4 November 2023).
  21. Baldrian, P. Fungal laccases—Occurrence and properties. FEMS Microbiol. Rev. 2006, 30, 215–242. [Google Scholar] [CrossRef] [PubMed]
  22. Dwivedi, U.N.; Singh, P.; Pandey, V.P.; Kumar, A. Structure–function relationship among bacterial, fungal and plant laccases. J. Mol. Catal. B Enzym. 2011, 68, 117–128. [Google Scholar] [CrossRef]
  23. Frasconi, M.; Favero, G.; Boer, H.; Koivula, A.; Mazzei, F. Kinetic and biochemical properties of high and low redox potential laccases from fungal and plant origin. Biochim. Biophys. Acta 2010, 1804, 899–908. [Google Scholar] [CrossRef] [PubMed]
  24. Lorenzo, M.; Moldes, D.; Couto, S.R.; Sanromán, M.A. Inhibition of laccase activity from Trametes versicolor by heavy metals and organic compounds. Chemosphere 2005, 60, 1124–1128. [Google Scholar] [CrossRef] [PubMed]
  25. Stoilova, I.; Krastanov, A.; Stanchev, V. Properties of crude laccase from Trametes versicolor produced by solid-substrate fermentation. Adv. Biosci. Biotechnol. 2010, 1, 208–215. [Google Scholar] [CrossRef]
  26. Marques, M.P.; Szita, N. Bioprocess microfluidics: Applying microfluidic devices for bioprocessing. Curr. Opin. Chem. Eng. 2017, 18, 61–68. [Google Scholar] [CrossRef] [PubMed]
  27. Krühne, U.; Heintz, S.; Ringborg, R.; Rosinha, I.P.; Tufvesson, P.; Gernaey, K.V.; Woodley, J.M. Biocatalytic process development using microfluidic miniaturized systems. Green Process. Synth. 2014, 3, 23–31. [Google Scholar] [CrossRef]
  28. Kurt, S.K.; Warnebold, F.; Nigam, K.D.; Kockmann, N. Gas-liquid reaction and mass transfer in microstructured coiled flow inverter. Chem. Eng. Sci. 2017, 169, 164–178. [Google Scholar] [CrossRef]
  29. Jackson, R.; Matentzoglu, N.; Overton, J.A.; Vita, R.; Balhoff, J.P.; Buttigieg, P.L.; Carbon, S.; Courtot, M.; Diehl, A.D.; Dooley, D.M.; et al. OBO Foundry in 2021: Operationalizing open data principles to evaluate ontologies. Database J. Biol. Databases Curation 2021, 2021, baab069. [Google Scholar] [CrossRef]
  30. Mungall, C.; Matentzoglu, N.; Balhoff, J.; Osumi-Sutherland, D.; Duncan, B.; Gaudet, P.; Tan, S.; Tapley Hoyt, C.; Pilgrim, C.; Overton, J.A.; et al. oborel/obo-Relations: 2023-08-18. Zenodo. 2023. Available online: https://zenodo.org/records/8263469 (accessed on 11 October 2023).
  31. Musen, M.A. The Protégé Project: A Look Back and a Look Forward. AI Matters 2015, 1, 4–12. [Google Scholar] [CrossRef] [PubMed]
Figure 1. Overall workflow presented in this work. Starting with laboratory data recorded in EnzymeML on enzyme kinetics and reaction rates, data are read in with Python and stored in a structured manner with the help of a tailored ontology as a knowledge graph. Then, the recorded data are used to automatically generate process simulations, resulting in further insights and eased workflow from laboratory to process simulation data [12].
Processes 12 00597 g001
Figure 2. Experimental setup of the reactor experiments consisting of (1) gas supply, (2) mass flow controllers (MFC), (3) computer, (4) Y-mixer, (5) storage tank with the reaction solution in a water bath, (6) photosensor, (7) T-mixer, (8) capillary reactor (straight capillary or coiled capillary) in a water bath, (9) LED panel, (10) camera, (11) waste container, and (12) bottle on a hotplate with a feedback control to adjust the water bath temperature. The black lines represent the gas and liquid flows, and the dashed lines represent the data transfer.
Processes 12 00597 g002
Figure 3. General procedure for automated data integration and execution of the process simulation in DWSIM.
Processes 12 00597 g003
Figure 4. Resulting concentrations of ABTSox against reaction time for laboratory experiments of helically coiled capillary (HCC) and straight capillary (SC); 11.6 µmol L−1 laccase, ABTSred = 0.97 mM. Volumetric flow rates: 3 mL min−1 gas (7 v/v-% oxygen), 5 mL min−1 liquid.
Processes 12 00597 g004
Figure 5. Excerpt of the resulting knowledge graph visualized with the OntoGraf-Plugin of the ontology editor software Protégé [31]. Boxes with yellow circles denote ontology classes and boxes with purple diamonds denote individuals, while dashed lines represent object properties between these as listed in the bottom-left legend. Strike-through lines denote individuals of the respective classes. The yellow box on the right shows an excerpt of the properties asserted to the reactor individual.
Processes 12 00597 g005
Figure 6. Resulting process flow diagram in DWSIM for the process simulation of the bioprocess of ABTS oxidation with laccase.
Processes 12 00597 g006
Figure 7. Resulting concentrations of ABTSox against reaction time for laboratory experiments and process simulations; 11.6 µM laccase, ABTSred = 0.97 mM. Volumetric flow rates: 3 mL min−1 gas (7 v/v-% oxygen), 5 mL min−1 liquid.
Processes 12 00597 g007
Disclaimer/Publisher’s Note: The statements, opinions and data contained in all publications are solely those of the individual author(s) and contributor(s) and not of MDPI and/or the editor(s). MDPI and/or the editor(s) disclaim responsibility for any injury to people or property resulting from any ideas, methods, instructions or products referred to in the content.

