Abstract
A gear pump is a key rotary-displacement pump for aircraft fuel transportation in the aerospace industry. Due to the great ratio of power-to-weight condition demanded for gear pumps in aircraft fuel transportation systems, the parameter of the rotation speed is a matter of extreme concern affecting internal flow characteristics that determines the adverse effects of cavitation, fuel trapping, and vibration. However, the flow characteristics of an aircraft fuel gear pump influenced by the rotation speed have not been elaborated upon on yet. In this research, the flow characteristics of an aircraft fuel gear pump were studied by considering the influence of the rotation speed. An experiment for testing the external performance of an aircraft fuel gear pump was performed, and a corresponding numerical simulation of a gas–liquid two-phase flow was employed. Distributions of the velocity and pressure at the central cross-sections and their monitored transient developments were comparatively analyzed for different rotation speeds. It was found that a greater pressure oscillational amplitude accompanied by a higher frequency could be induced by a higher rotation speed, especially in the region of gear engagement. Additionally, cavitation evolution characteristics affected by the rotation speed in the fuel gear pump were discussed. The mechanism of cavitation generation in the region of gear engagement to withdrawal was revealed to be the quick release of a great amount of pressure. Furthermore, a dimensionless cavitation area was employed to quantify the periodic cavitation evolution, and the natural exponential development of the maximum dimensionless cavitation area with the rotation speed was determined through curve fitting. This study should be helpful for creating a deeper understanding of the internal flow characteristics of an aircraft fuel gear pump in scientific research and the external performance in aerospace industrial applications.
1. Introduction
Gear pumps are most commonly used positive displacement pumps. Typically, gear pumps use rotating gears to vary the amount of fluid medium being delivered. Due to the advantages of robustness, stability, and low costs, gear pumps are often used as fuel transfer equipment in the chemical and aerospace industries [1,2,3]. In the aerospace industry, gear pumps are used as key fuel pumps in fuel transportation systems, mainly utilized to pump fuel to aircraft engine fuel systems [4,5,6].
The internal flow characteristics of a gear pump are intrinsically important indicators of its superior performance. In recent years, many scholars have conducted a large amount of research on the internal flow characteristics of gear pumps. Castilla et al. [7] used air bubbles as tracers for the Time Resolved Particle Image Velocimetry (TRPIV) technology to study the flow in the suction chamber of an external gear pump. The result showed that, with a high Reynolds number, the integral timescale of the turbulence was approximately the same as the gearing period. Ertürk et al. [8] analyzed the flow characteristics inside an external gear pump system using the time-resolved PIV technique. It was found that the accuracy of the estimated turbulent kinetic energy dissipation rate depended strongly on the velocity measurement error and the number of images used. Ghazanfarian and Ghanbari [9] conducted a numerical study of the internal flow, including the pressure contours and flow patterns in the suction chamber of the double-gear pump. The results showed that that the minimum fuel pressure within the gear pump occurred at the two places between contacting gears near the inlet ports. Yoon et al. [10] conducted a 3D numerical simulation to investigate the flow characteristics in the external gear pump. It was found that the maximum flow rate of the gear pump was a strong function of the gear tooth tip clearance and lateral clearance. Frosina et al. [11] numerically studied the internal flow with PUMPLINX software 4.6 version, finding that this numerical model could better predict the cavitation development and actual pump performance. Sedri and Riasi [12] conducted a numerical and experimental study on the leakage within an external gear pump with new decompression slots, finding that these depression slots could eliminate high pressure pulsations and catastrophic cavitation without increasing the radial leakage. Zhao and Vacca [13] proposed a novel approach for the analysis of the ripple source of gear pumps based on decomposition into a kinematic component and a pressurization component. They found that it was difficult to change the loading in the downstream hydraulic circuit with the response of two ripple sources. Bie et al. [14] studied viscous fluid flow through an external gear pump using a two-dimensional numerical simulation method. It was found that the vortex was mainly present in the suction flow channel, leading to a longer residence time of the substance in the pump. Chai et al. [15] studied the variation law of the geometric parameters of the gear pair in the internal meshing gear pump on the theoretical flow rate and geometric flow pulsation rate. The results indicated that increasing the tip radius of the external gear or increasing the speed of the external gear can improve the average flow rate and volumetric efficiency. Corvaglia [16] presented a three-dimensional model of an external gear pump and a new application of the algorithm used to measure unsteady flow in hydraulic pipelines. Results showed that the proposed flow meter was reliable in assessing flow oscillations under various operating conditions. Szwemin and Fiebig [17] analyzed in detail the effect of radial and axial gaps on the leakage and volumetric efficiency of an external gear pump by utilizing CFD simulations, and they proposed a relationship between the leakage caused by axial and radial gaps. Corvaglia et al. [18] also adopted the CFD model to analyze the tooth space pressure and incomplete filling in external gear pumps by considering the internal fluid leakages. Sanchugov and Rekadze [19] presented computational dynamic models of bench systems in lumped parameters to determine the dynamic fluid flow rate at the gear pump outlet, determining that the amplitudes of flow pulsations should be considered according to the equivalent source of flow fluctuations in gear pumps.
Additionally, cavitation is a classical gas–liquid two-phase flow phenomenon in a gear pump that can severely destabilize the flow field and correspondingly cause adverse effects, such as fuel trapping and vibration; therefore, it has attracted great attention from many researchers and engineers in the area of gear pumps. Campo et al. [20] developed a two-dimensional numerical approach to analyze the effect of cavitation in the volumetric efficiency of external gear pumps. The results showed that the volume of air became more stable and the irregularity of the flow was reduced at high rotational speeds that could dominate the volumetric efficiency. Zhou et al. [21] used a novel formulation for a full cavitation model to predict the cavitation of the flow in the external gear pump, and this novel approach was verified for accurate prediction of the effects in cavitation. Yan et al. [22] proposed a cavitation detection method based on the phase demodulation of ultrasonic signals to analyze the cavitation performance during the operation of hydraulic machinery. The successful recognition rate reached 98%, indicating that the method had good stability and accuracy. Shah et al. [23] also proposed a new model of the Rayleigh–Plesset equation to address several drawbacks to existing cavitation models to better reflect cavitation of an external gear pump. Casari et al. [24] numerically discovered that decreasing the subcooling or increasing the pump rotation speed could promote the cavitation phenomenon. Teng et al. [25] used ANSYS CFX to study the cavitation characteristics of a variable speed centrifugal blood pump. The results showed that the cavitation intensity increased with the increase in impeller speed. Under variable speed, a sharp increase in speed can lead to cavitation. Zhu et al. [26] developed a novel simulation model to investigate the system-level problem of journal-bearing gear pumps. The result showed that cavitation occurred in the bearing region and that the cavitation boundary varied periodically due to changes in the pump load. Lin et al. [27] obtained the flow distribution inside the gear pump as well as the cavitation through model analysis and simulation. The flow characteristics, including the fluctuation of the mass flow rate and pressure during gear rotation (as well as cavitation), were analyzed. Ouyang et al. [28] established a CFD-vibration-coupled model to study the cavitation characteristics in gear transmission, and they found that cavitation was aggravated at high speeds and extreme pressure fluctuations. Liu et al. [29] carried out a numerical study on the cavitation characteristics influenced by the flow rates and fuel temperatures in the centrifugal fuel pump. They found that the occurrence of cavitation was more sensitive to the higher flow rates, and also that the influence of the fuel temperature variations should be considered in a long-time aviation.
However, few studies have been conducted to elaborate on the internal flow characteristics, especially the cavitation performance of aircraft fuel gear pumps for fuel transportation in aircraft engine systems under special aerospace working conditions. Due to the particularity of a fuel medium and the high rotation speed working conditions, the internal flow (including cavitation) of an aircraft fuel gear pump presents distinct flow characteristics that are different from those of a common fuel medium and normal working conditions. Therefore, it is necessary to investigate the internal flow characteristics of aircraft fuel gear pumps by considering the high rotation speed. Moreover, the relationship between the cavitation area and the rotation speed needs to be proposed to provide a theoretical basis for the cavitation restriction and external performance improvement of an aircraft fuel gear pump in the aerospace industry.
In this research, the flow characteristics of an aircraft fuel gear pump influenced by the rotation speed were studied. The distributions of the velocity and pressure, as well as their monitored transient oscillation amplitude and frequency, were comparatively analyzed for different rotation speeds. Additionally, the cavitation evolution characterized by the cavitation volume fraction was depicted. Cavitation occurred in the region of gear engagement to withdrawal due to the quick release of a great amount of pressure. Furthermore, a dimensionless cavitation area was employed to quantify the periodic cavitation evolution, and the development of the maximum dimensionless cavitation area with the rotation speed was determined. We believe that this study will help deepen our understanding of the internal flow characteristics of an aircraft fuel gear pump in scientific research and provide external performance improvement in aerospace industrial applications.
This paper was organized as follows: In Section 2, the experimental method for conducting external performance of the gear pump was described and the credible numerical simulation, including its numerical equations, mesh process and boundary conditions, was determined by the experimental verification. In Section 3, the internal velocity, pressure, and cavitation distributions under various rotation speeds were analyzed, and the characteristics of the cavitation area influenced by the rotation speed was derived and discussed. Finally, all conclusions about this study were displayed in Section 4.
2. Experimental Method and Numerical Simulation
2.1. Experimental Method
The gear pump in this study was the type of external gear pump that is generally used to provide aviation fuel in aircraft engine fuel systems. Figure 1 shows the explosion and assembly of the entire gear pump. The entire structure components of the external gear pump consisted of the pump cover, rigid bearing, slave gear, drive gearing, floating bearing, and pump body. By rotating the drive and slave gears, the fuel could be pressurized from inlet to outlet through the gear pump for fuel transportation. The specific parameters of the gear pump structure are shown in Table 1.
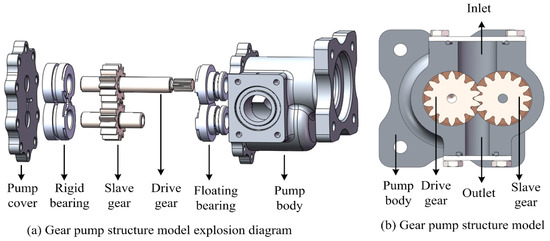
Figure 1.
Gear pump structure model.

Table 1.
Main parameters of the gear pump.
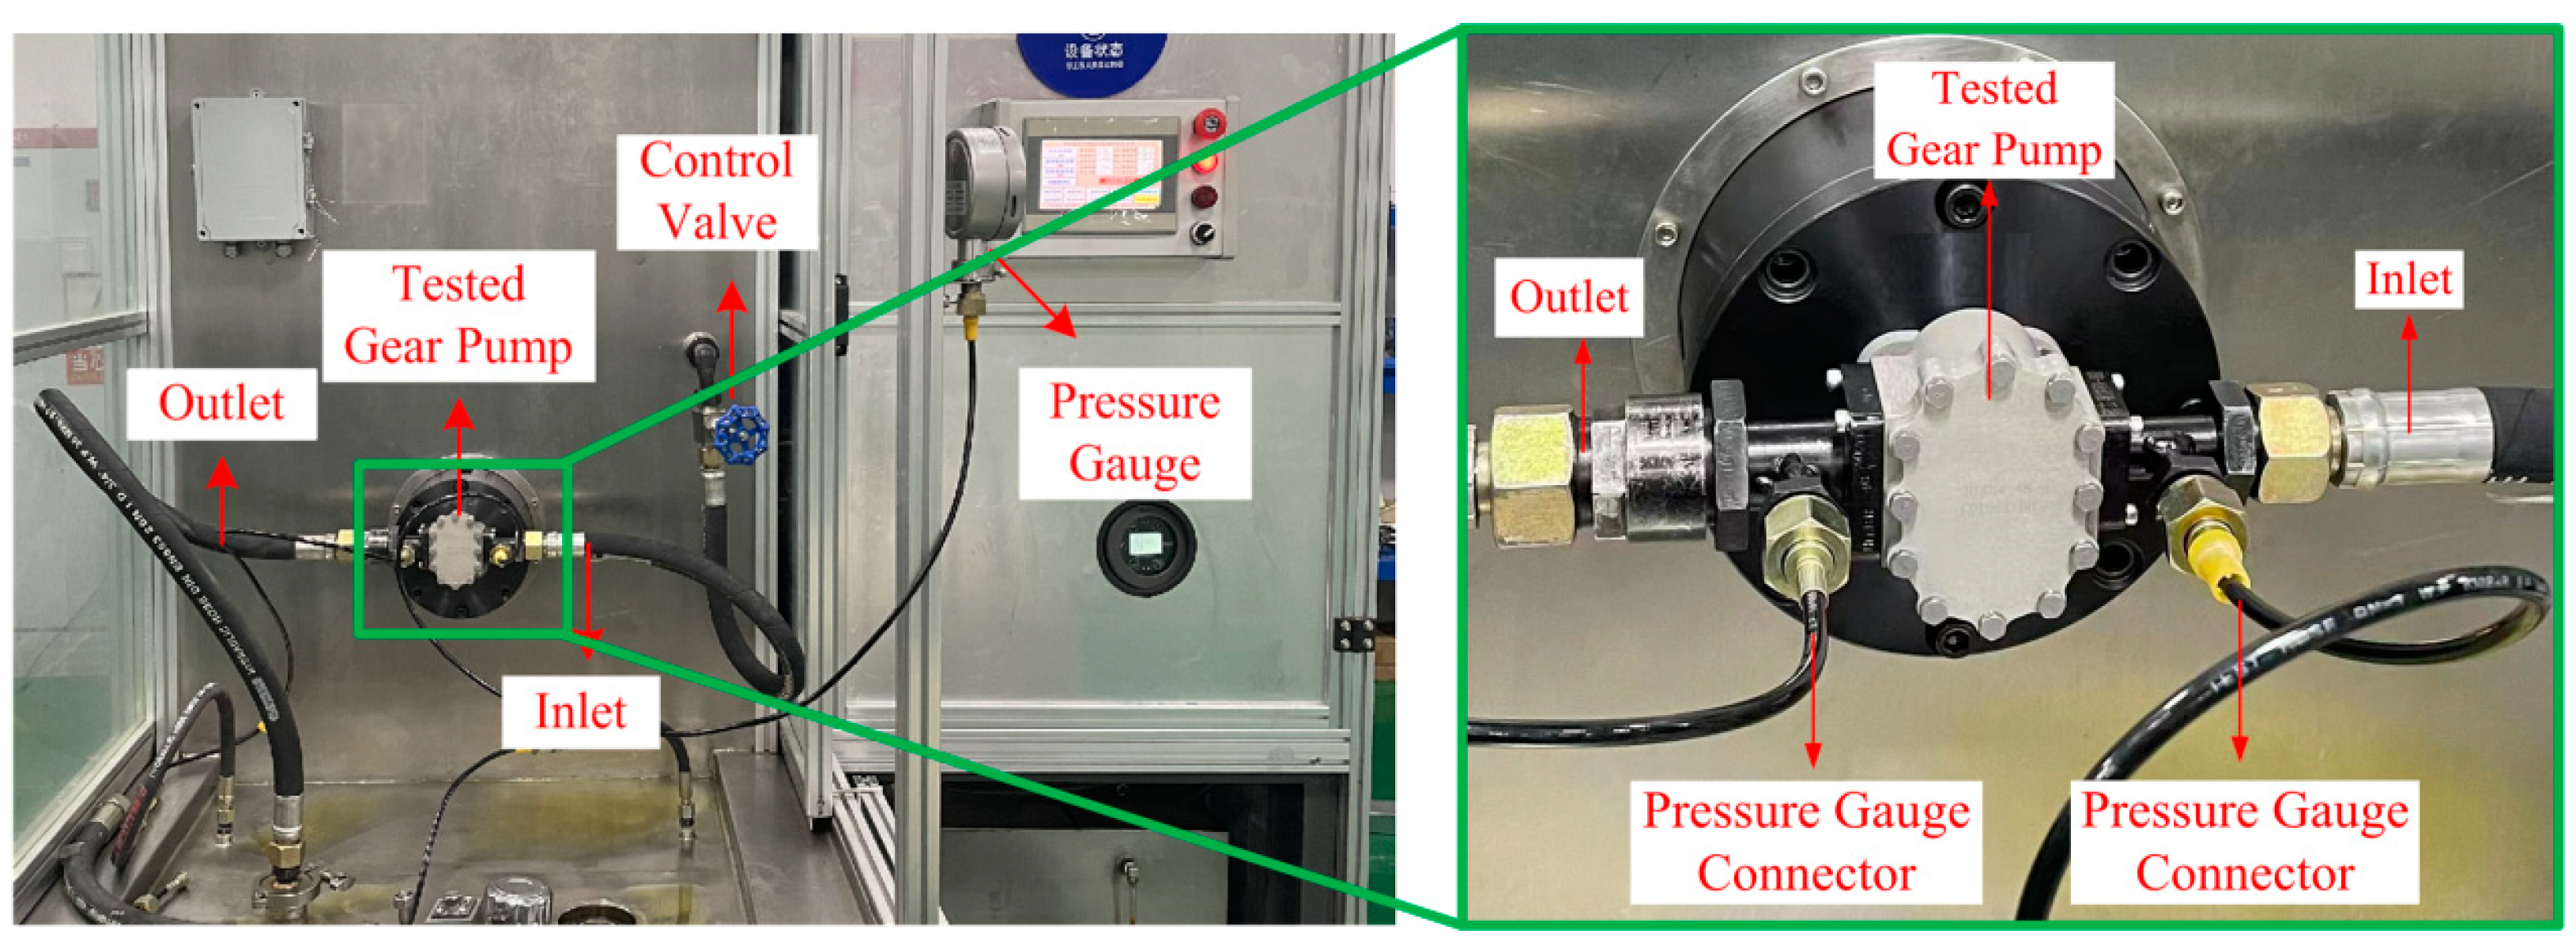
The experimental testing system for testing the performances of the fuel gear pump under various operating conditions was sketched in Figure 2. The flow medium used in the experiments was a specific fuel RP-3 for aircraft engines. The fuel provided from the fuel tank passed through a control valve, an inlet pressure gauge, a booster pump, the experimental gear pump, an outlet pressure gauge, and a volume flow meter, then was flowed back to the fuel tank. The pressures upstream and downstream of the experimental gear pump were collected and displayed in the inlet pressure gauge (FST-100) and the outlet pressure gauge (FST-100), respectively. Their ranges were from 0.1 MPa to 4 MPa, with an accuracy of 0.001 MPa. The booster pump was used to pressurize the fuel flowing into the gear pump, which could reach the inlet pressure required by the gear pump more accurately and meet the demand of the high-pressure external gear pump for fluid transportation. The regulating valve installed downstream of the experimental gear pump was employed to regulate the pressure in the pipeline. The volume flow meter (LWGY-B10), with a range of 0.2–1.2 m3/h and an accuracy of 0.01 L/h, was used to determine the flow rate of the fuel in the experiments. The corresponding key experimental setup of the tested gear pump is shown in Figure 3.
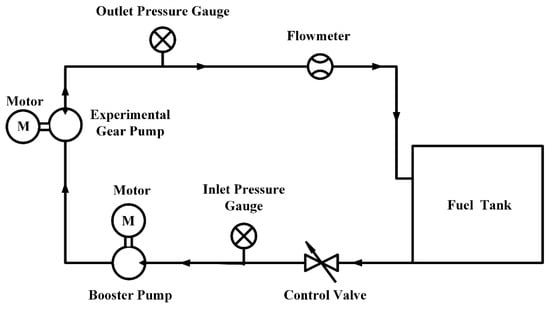
Figure 2.
Schematic of experimental testing system.
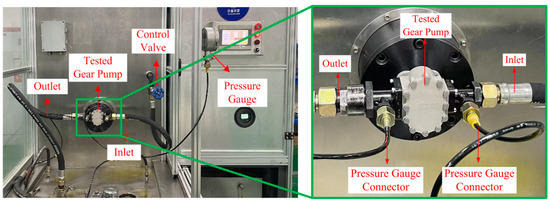
Figure 3.
Photograph of the experimental setup of the gear pump.
2.2. Numerical Simulation
The flow fields included the suction cavity, the engagement zone, the unloading tank, and the discharge cavity, and the entire numerical flow models of these parts were constructed, as shown in Figure 4. Additionally, two pipelines were extended upstream and downstream of the gear pump to stabilize the numerical simulation. The structured mesh was adopted with the used PUMPLINX software in this study, and the mesh was processed by the self-adaptive algorithms that were qualified for meshing the important rotational gear engagement zone. Furthermore, in order to avoid the fluid area between teeth subjecting to the crushing process during teeth rotation, the pair of gears was downscaled slightly to make this key fluid area continuous. In this way, the width of the fluid gap between the teeth in the engagement zone was controlled and approximately equal to the gear tip clearance of 0.01–0.02 mm.

Figure 4.
Entire flow region (a) and each component (b–d) for numerical simulation.
Computational fluid dynamics (CFD) simulations were performed by using the commercial code PUMPLINX to obtain the internal flow field, including the velocity and pressure distributions. The continuity equation and momentum equation were expressed as follows:
where represents the velocity vector, t represents the time, represents the stress tensor, represents the volume force of the micro-element, μ represents the dynamic viscosity, and I represents the unit tensor.
The standard k-ε model has high accuracy for calculation results. Therefore, the standard k-ε turbulence model was chosen as the turbulent model.
where Pt represents the turbulent kinetic energy generation term, σk represents the Prandtl number of turbulent kinetic energy k, and σε represents the Prandtl number of the dissipation rate ε.
The Rayleigh–Plesset equation was adopted as the cavitation model. The dynamic process of the cavitation variation was solved based on a two-phase flow model. By solving the coupled fluid conservation equations of ρ − f (where ρ indicates the dynamics density of the fluid and f indicates the vapor mass fraction), the relationship between the two is expressed as follows:
The vapor mass fraction of the fuel fluid is controlled by the transport equation:
In the equation, ρ represents the total density of the fluid (including vapor), ρv represents the vapor density of the fuel, ρ1 represents the density of pure fuel, and Re represents the precipitating rate of bubbles from the fuel. Rc represents the disappearing rate of bubbles by breaking up and dissolving in the fuel.
The net gas–liquid phase change rate R is derived from the continuity equations for the liquid and gas phases as follows:
Continuity equation for the liquid phase:
Continuity equation for the gas phase:
Net gas–liquid phase change rate R:
The boundary conditions for calculating the internal flow characteristics of an aircraft fuel gear pump are shown in Table 2. The flow rate was determined to be 15 L/min, and the inlet and outlet pressures served as the inlet and outlet boundary conditions. The rotation speed ranged from 1500 r/min to 10,000 r/min, with the range containing the actual high-speed rotation speed for fuel transportation in the aircraft engine system.
Table 2.
Boundary conditions settings.
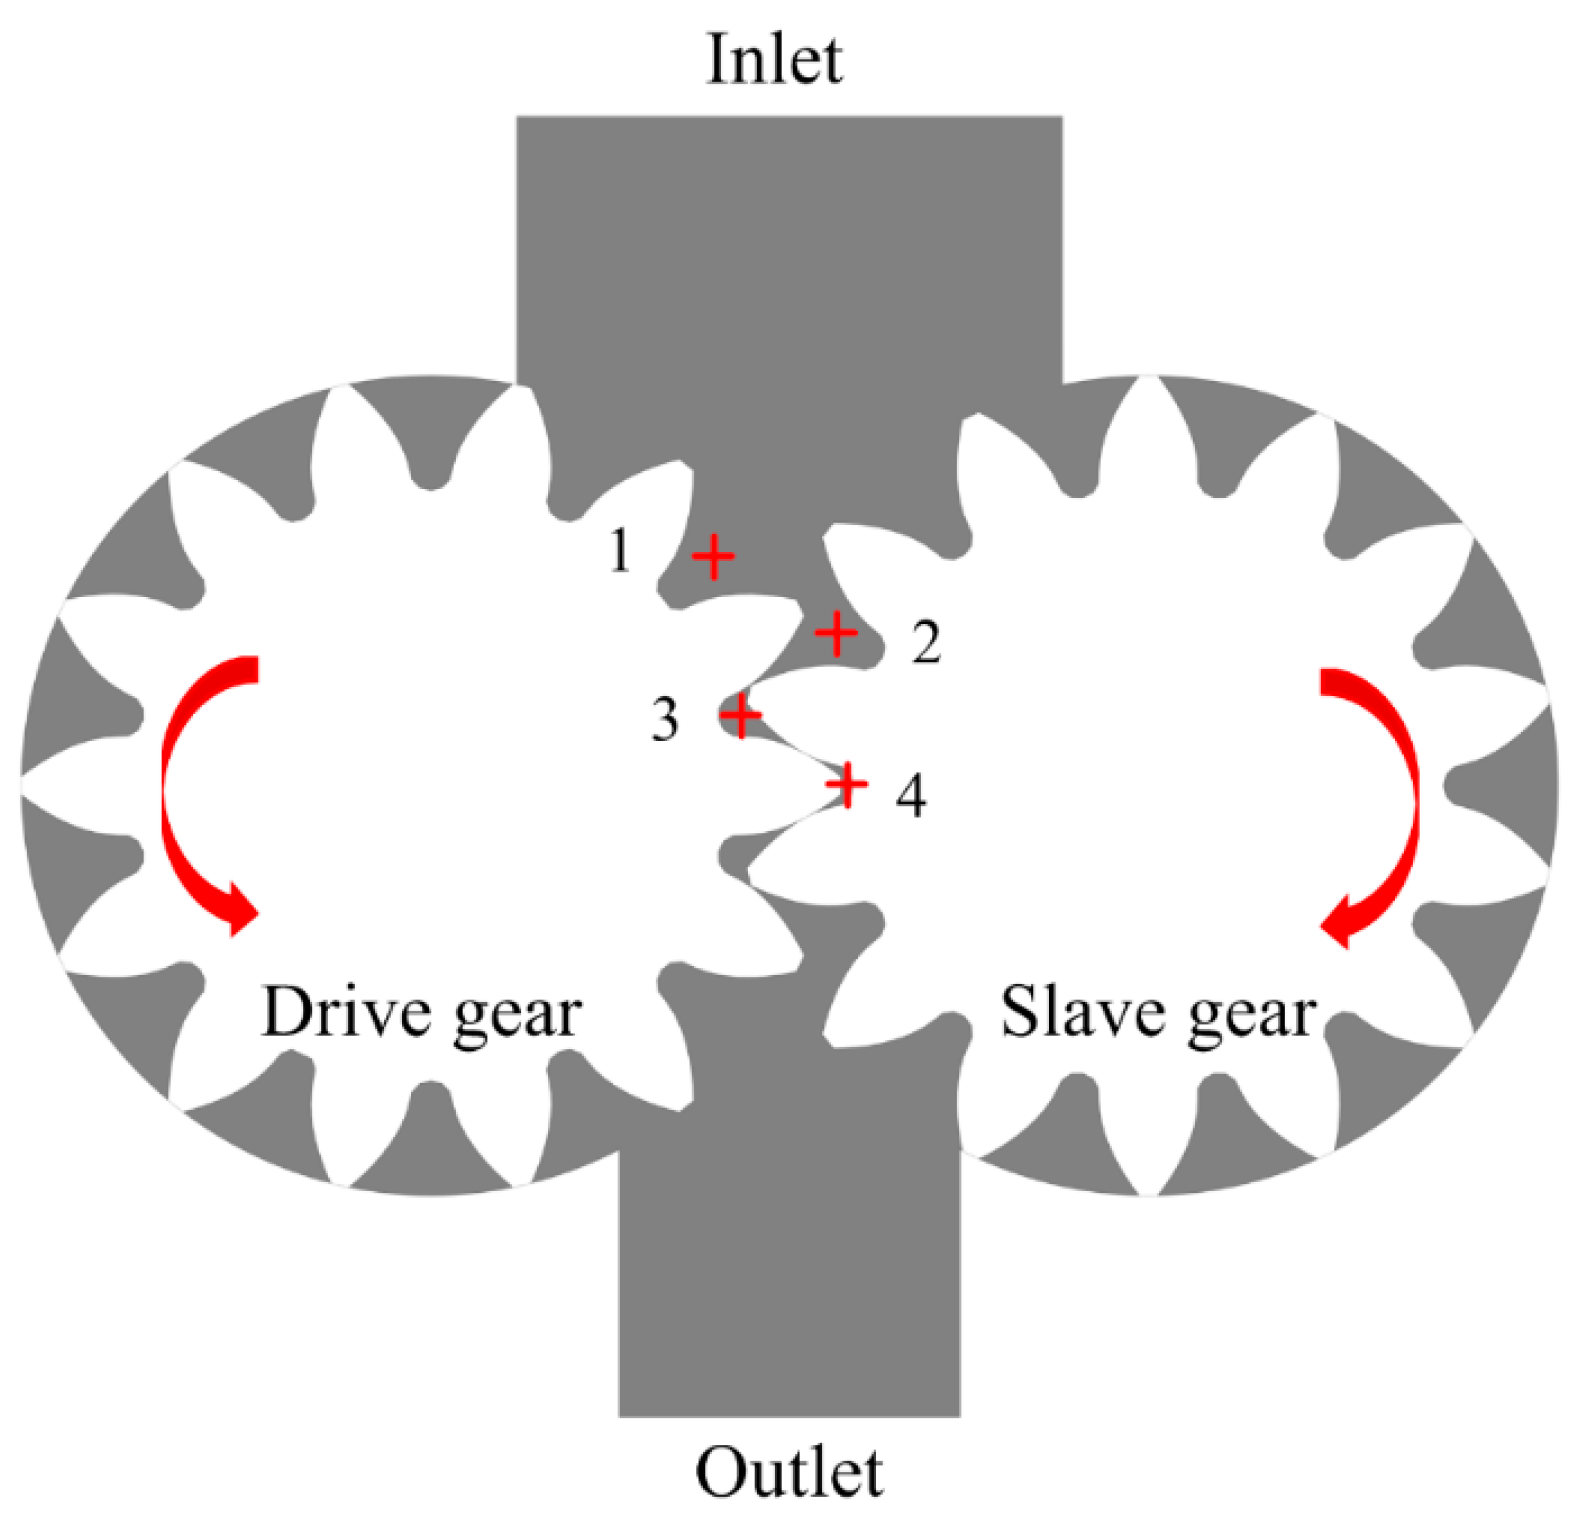
To monitor the flow field characteristics during gear rotation, four monitoring points were set at the typical XOY center cross-section, as shown in Figure 5. Monitoring Point 1 and Monitoring Point 2 were mainly located near the suction port to visually display the sucked fuel pressures and velocities in the gear rotation region, while Monitoring Point 3 and Monitoring Point 4 were located in the gear engagement zone. In addition, Monitoring Point 4 was located in the fuel-trapped area to better present the great flow signal variations, especially at high rotation speeds.
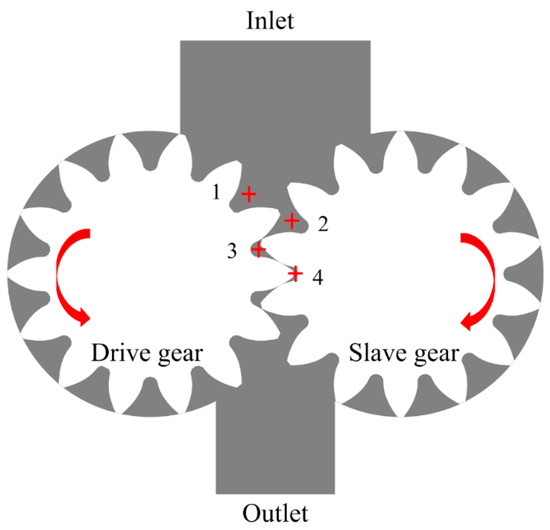
Figure 5.
Monitoring point distribution at the XOY cross-section.
To the initial conditions for the transient simulation, the number of time steps set for each rotating gear tooth was 30 steps, while the whole numerical calculation time for each case was set to 10 rotations (i.e., 4200 steps for 14 gear teeth); thus, the time step for each numerical case can be determined by a rotation speed. The time to reach periodicity depended on the relative fluctuations of the flow parameters. In this study, when the pressure value at monitoring points 1 and 2 showed a stable periodic flow pattern, and the relative difference of the pressure at each monitoring point between two adjacent time steps was less than 5%, it was considered that periodicity and the stable flow state for the numerical simulation had been reached.
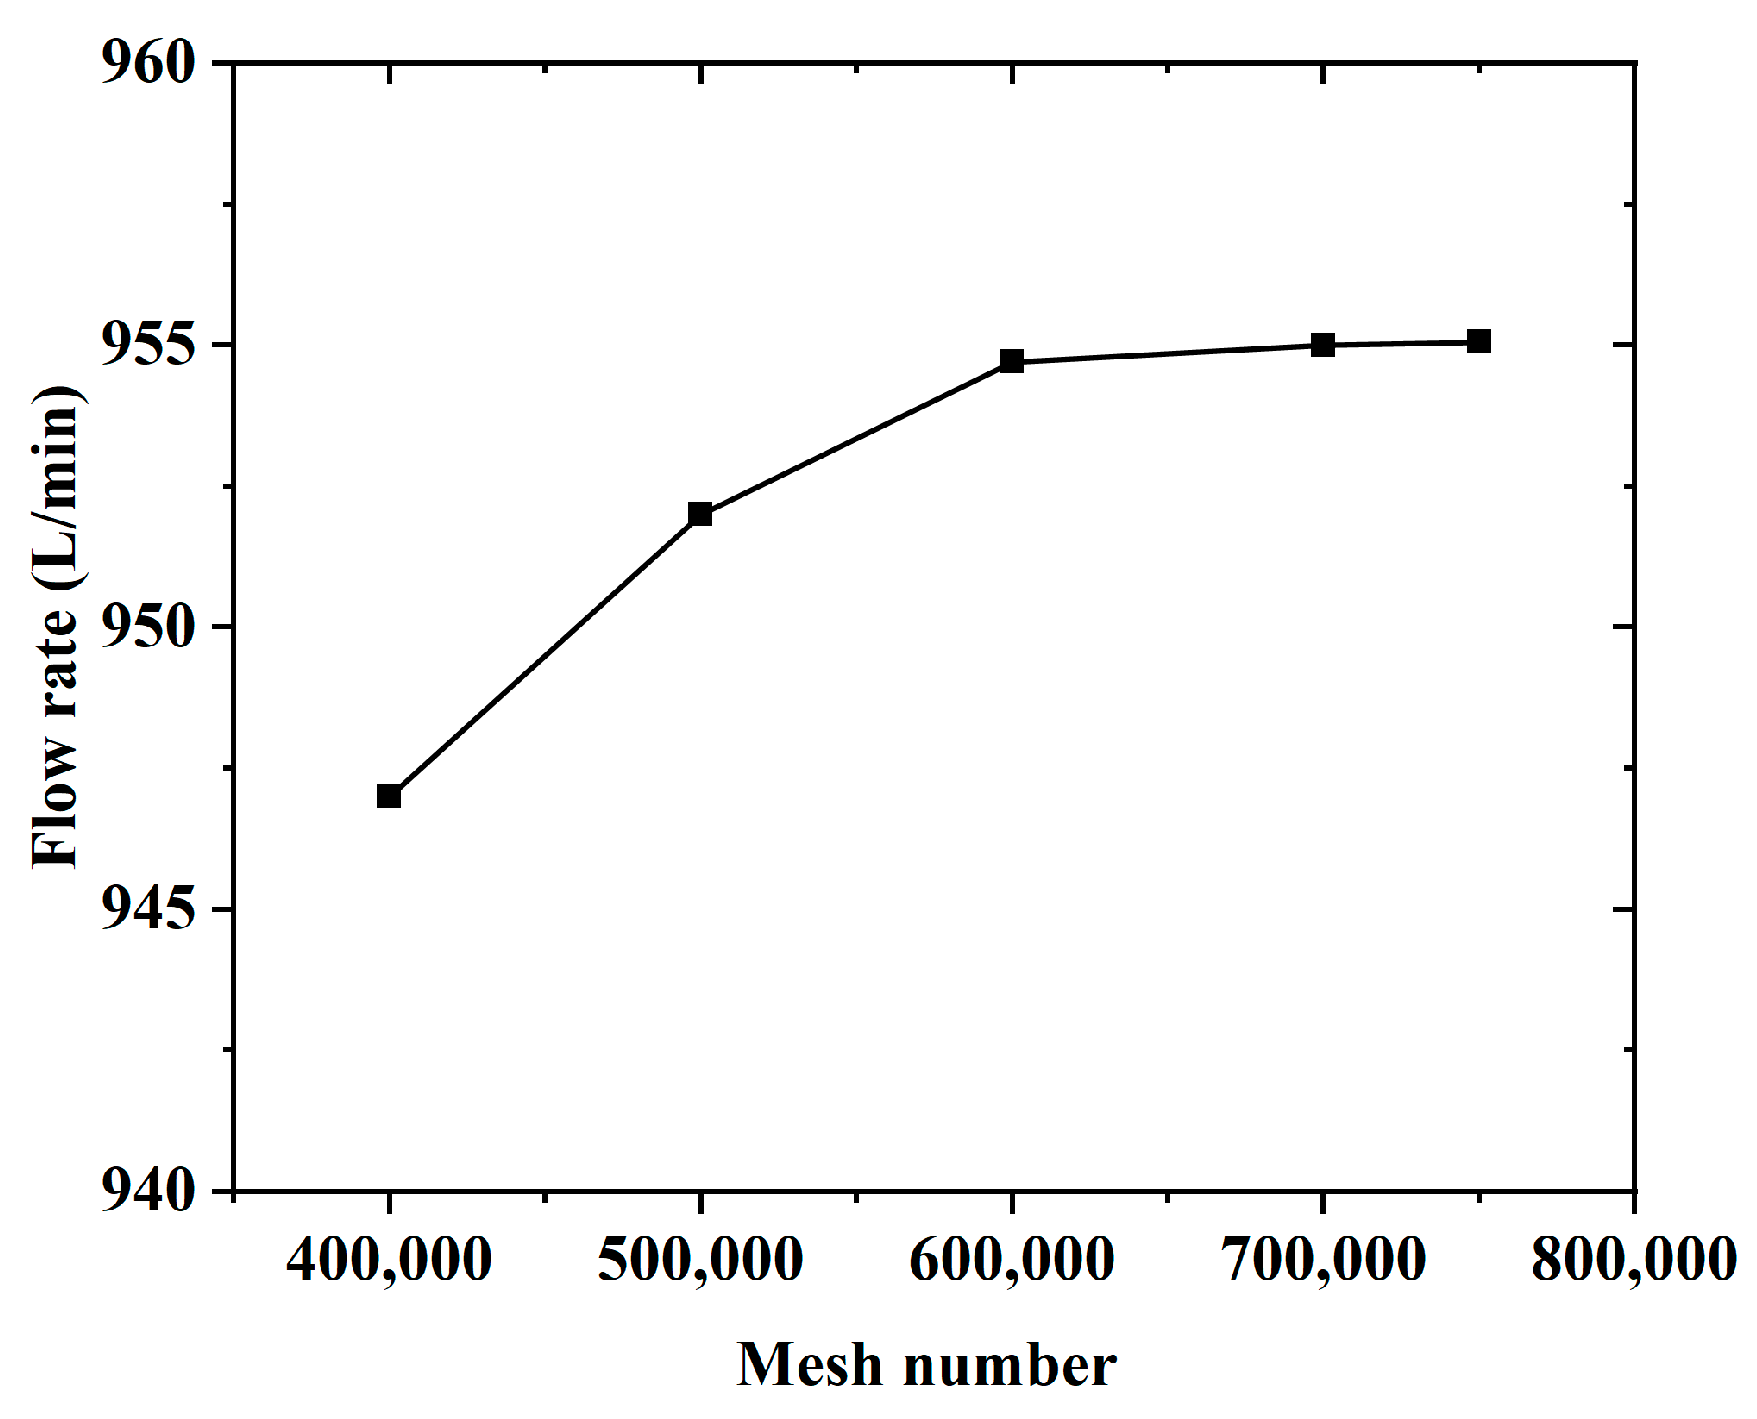
Variations in the outlet flow rate with the change in grid number at a rotational speed of 10,000 r/min were shown in Figure 6. It can be seen that the simulation results of the flow rates remained nearly unchanged when the grid number exceeded 700,000. Thus, the grid number of approximately 700,000 was adopted for the subsequent numerical analysis.
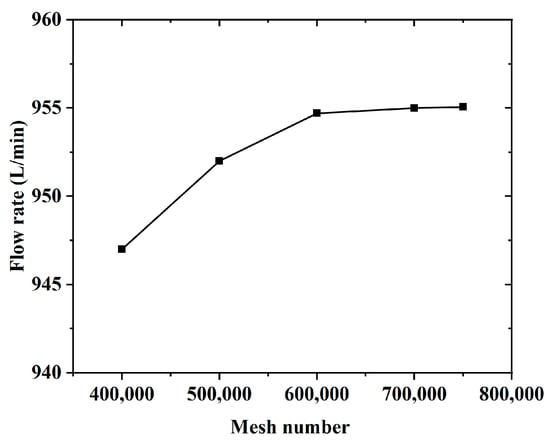
Figure 6.
Mesh independence verification.
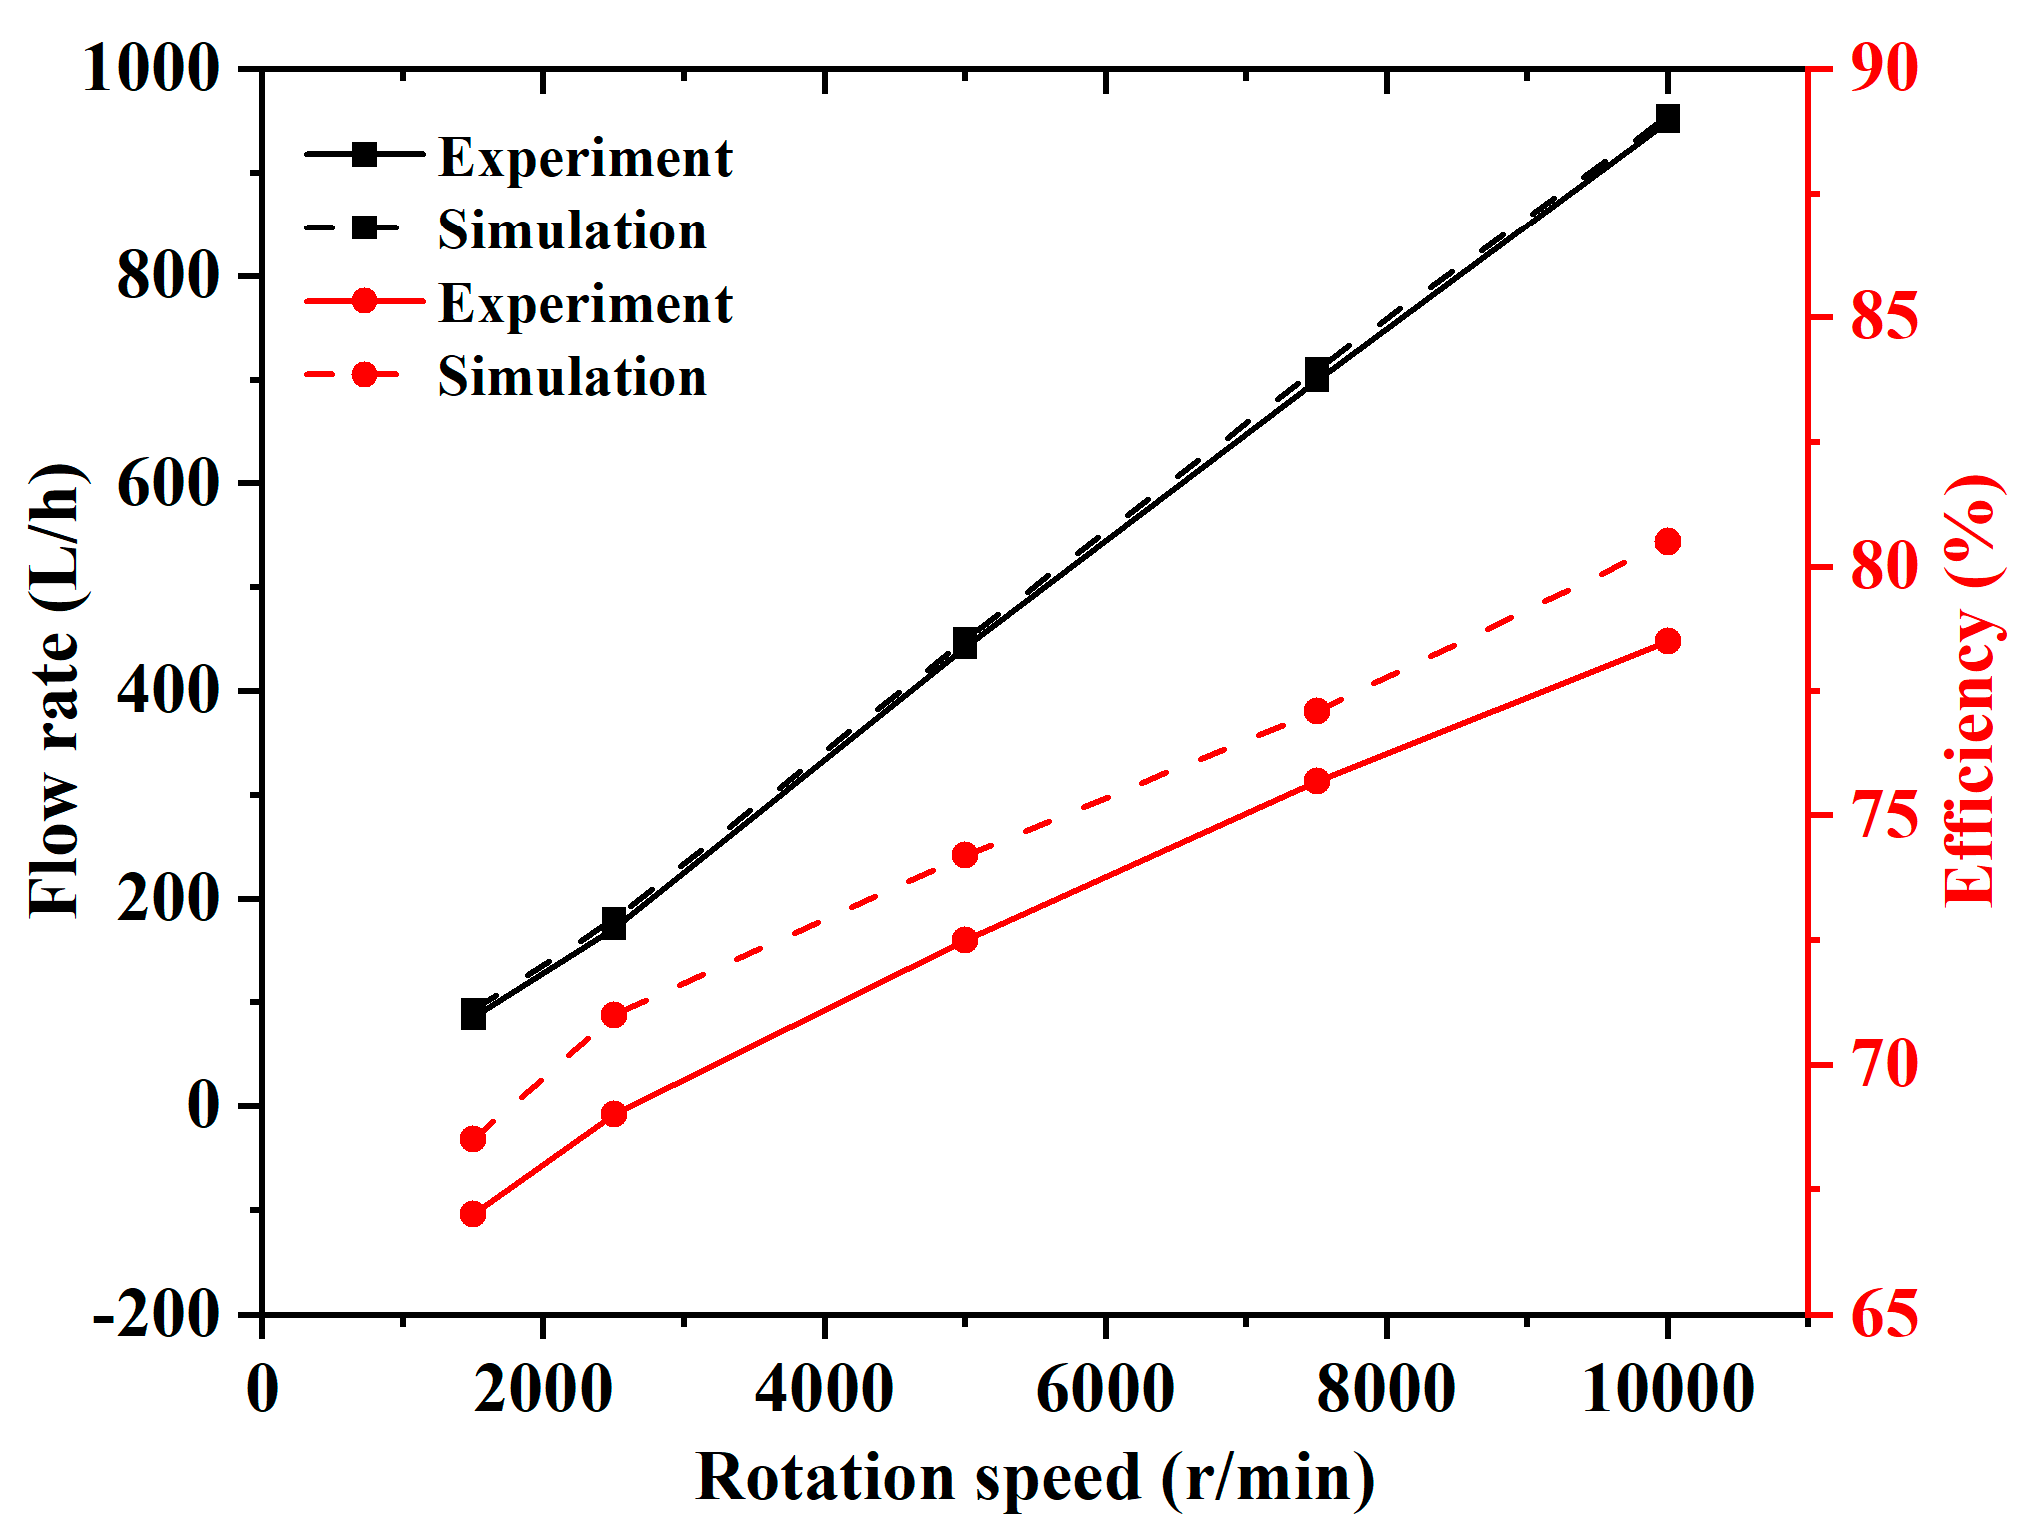
Figure 7 shows the experimental and simulation flow rates of the gear pump at different rotation speeds. It can be seen that the gear pump flow rate increased approximately linearly with the rotation speed increment. In addition, as can be seen from the comparison between actual flow rates and simulated results, the numerical flow rates were shown to agree well with the values of tested flow rates. This meant that the numerical simulation was credible for the subsequent internal flow characteristics analysis.

Figure 7.
Experimental and simulate flow rates and efficiency for different rotation speeds.
As can be seen from the efficiency comparison graph, the efficiency of the simulation was higher than the efficiency of the test. This occurred due to there being no friction, energy loss or leakages during the process, so the efficiency of the simulation was better.
3. Results and Discussion
3.1. Velocity Characteristics
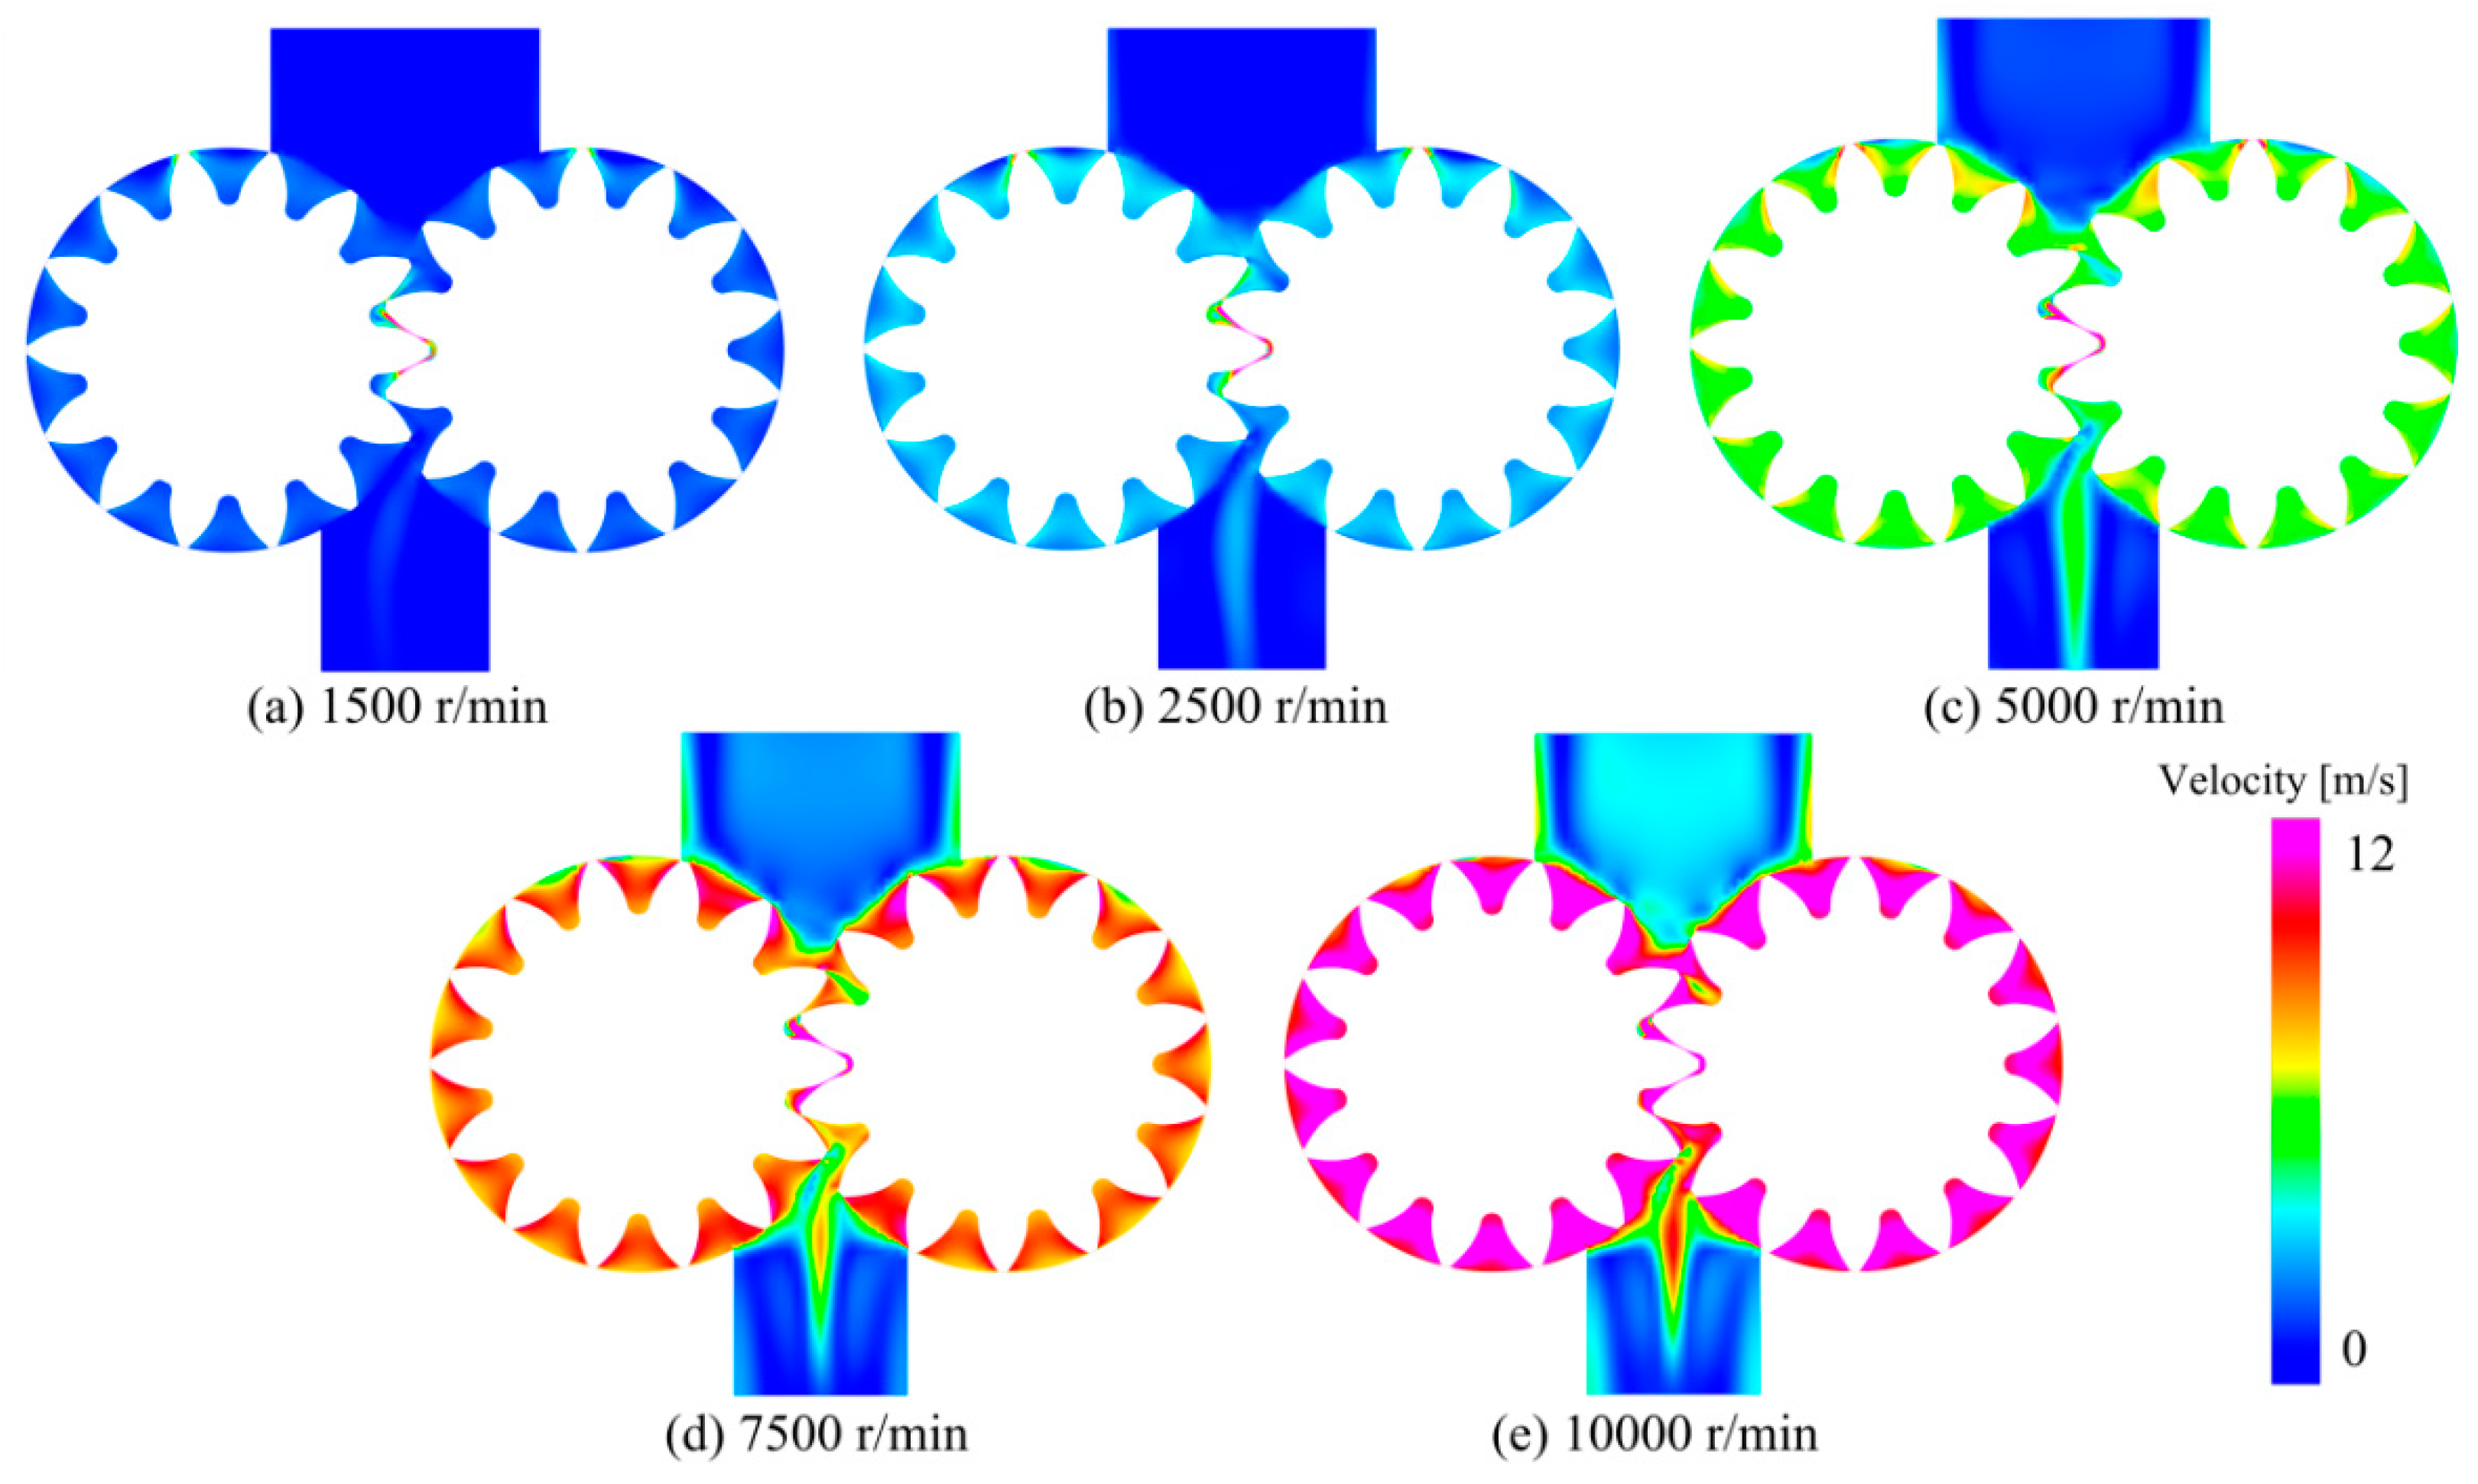
Figure 8 shows the internal fuel velocity distribution at the typical XOY cross-section influenced by the rotation speed. It can be seen that the fluid velocity increased at the outlet section and in the withdrawal engagement area due to the effect of gear rotation in the gear pump for each rotation speed. Based on the color appearance, the velocity was gradually increased with the increase in the rotation speed, reaching the maximum value at the speed rotation of 10,000 r/min. It can be seen that, as the rotation speed increased, the flow field in the pump became increasingly unstable at the outlet. This might have been attributed to the high-speed flow jet generated downstream of the rotating gear, with a high rotation speed causing a greater velocity difference at the outlet.

Figure 8.
Distribution of the velocity at the central XOY cross-section for different rotation speeds.
Figure 9 displayed the cross-sectional velocity vector distribution at the central XOY cross-section under different rotation speeds. Initially, the fuel was consistently sucked from the inlet to the rotor section through the suction port, where the velocity remained relatively uniform. As the fuel flowed into the rotor section, its velocity began to accelerate dramatically. Notably, in the gear engagement area, the velocity of the fuel was significantly was greater than that in other regions. Then, the velocity became gradually more uniform when the fuel left the rotor zone to the exit. Additionally, it can be observed that the fuel speed increased upon improving the rotation speed.
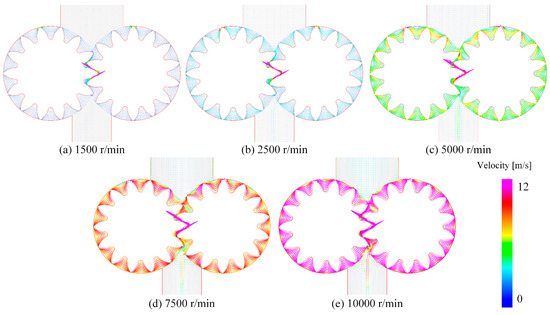
Figure 9.
Distribution of the velocity vector at the central XOY cross-section for different rotation speeds.
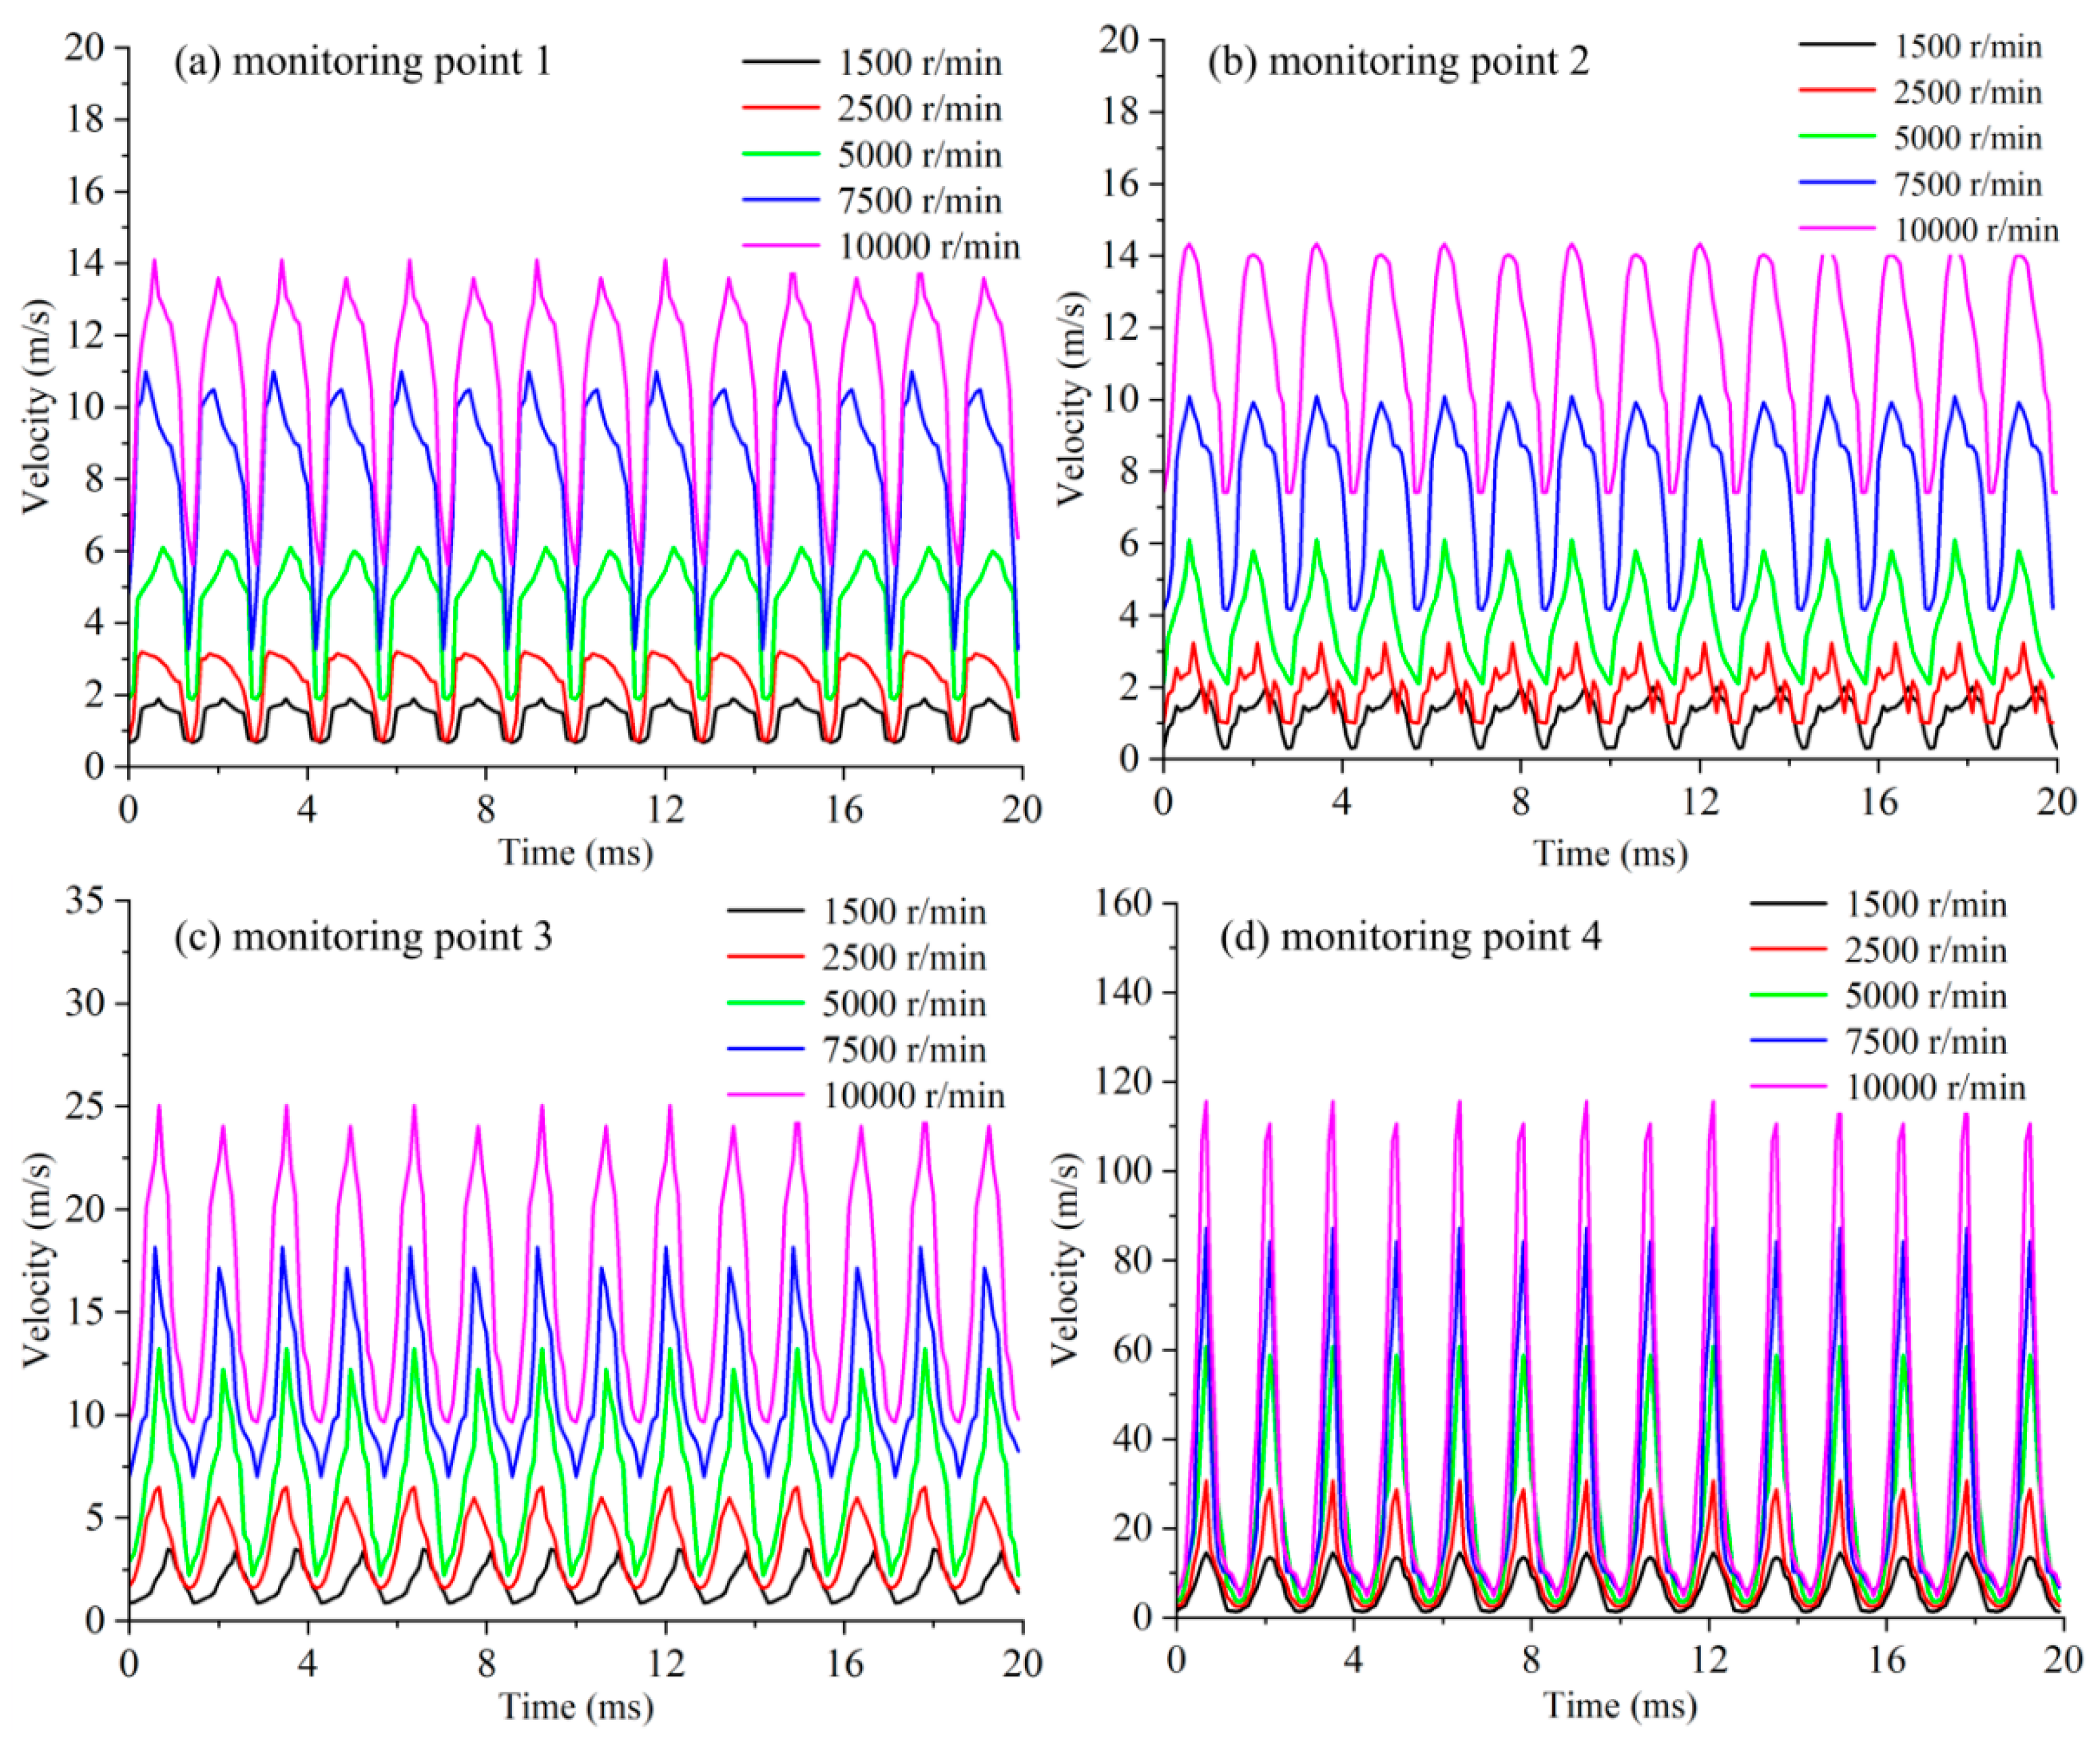
Figure 10 shows the time dependence of velocity magnitude for the monitored points at different rotation speeds. For each monitored point, the variating curve fluctuated regularly with time for each rotation speed. In addition, the amplitude between the peak and trough of the oscillation curve seemed to gradually increase with the increment of the rotation speed, which meant that the velocity fluctuated strongly for a high rotation speed of 10,000 r/min. Additionally, at a fixed rotation speed, it could be found that the average velocity at Monitoring Point 4 was greater than those at the other monitoring points. This signified that the fluid velocity in the gear engagement zone was greater than that in the suction region.
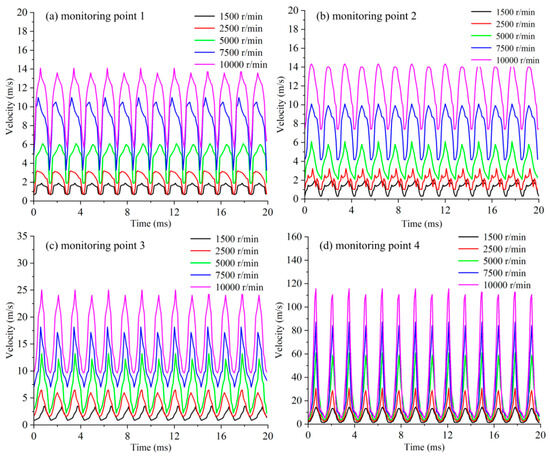
Figure 10.
Influence of rotation speeds on velocity variation for different monitoring points.
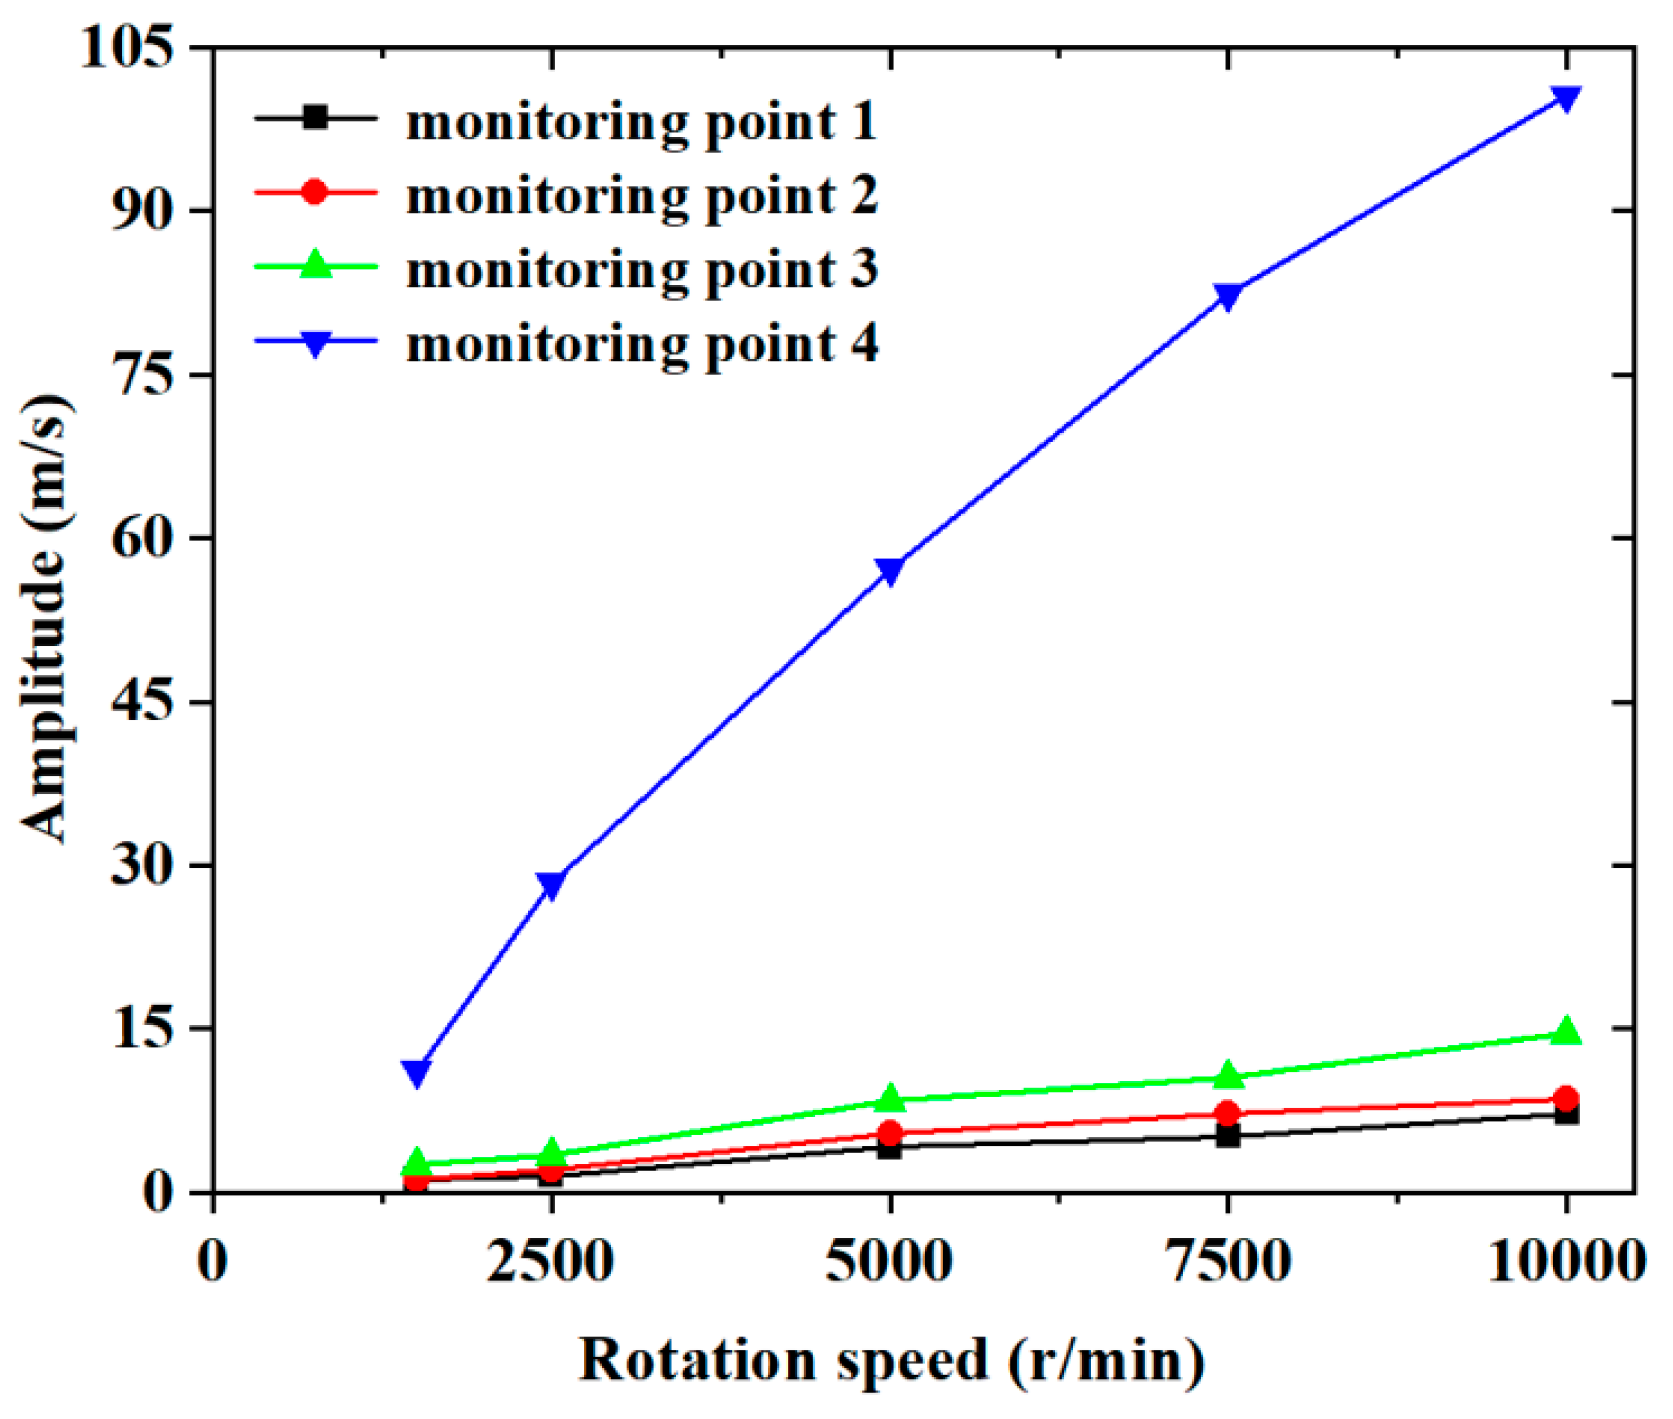
As shown in Figure 11, the amplitude of the oscillational velocity (the difference between the peak and trough of the oscillational curve shown in Figure 8) for the monitoring points was plotted with the rotation speed. It can be seen that the amplitude of the oscillating velocity of the monitoring point increased gradually with the increase in the rotation speed for each monitoring point, reaching the maximum value at the rotation speed of 10,000 r/min. In addition, the velocity amplitude for Monitoring Point 4 was found to be much greater than that for other cases for the same rotation speed. This meant that a higher fluid transportation velocity variation occurred in the region of gear engagement. Furthermore, the development of the velocity amplitude with the rotation speed was presented as a linear enhancement, and the linear slope was enhanced as the region approached the gear engagement along the flow direction (i.e., Monitoring Point 4 had the greatest value of the slope).

Figure 11.
Plot of velocity amplitude with rotation speed for monitored points.
3.2. Pressure Characteristics
As can be seen from Figure 12, for a fixed rotation speed, the fuel pressure gradually increased from the region entering the gear to the region downstream of the gear along the flow direction with the pressurization effect of the gear rotation. In addition, the cross-sectional pressure was increased with the increment of the rotation speed, reaching the highest value at the rotation speed of 10,000 r/min. This might have been attributed to the greater fuel compression effect that could be generated with a higher rotation speed of the gear pump, resulting in greater pressurization along the flow direction. Additionally, for a higher rotation speed, it could be found that the fuel pressure rising along the channel in the slave gear (at the right hand) was more obvious than that in the drive gear (at the left hand), beginning to release at the outlet of the gear to provide the fuel jetting energy.
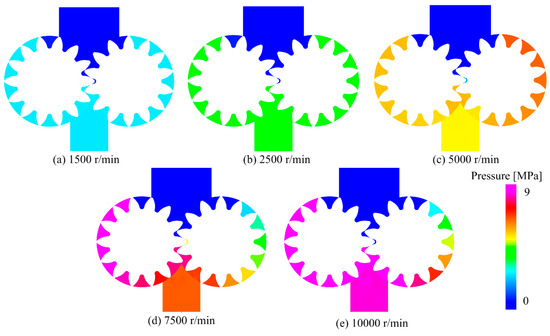
Figure 12.
Distribution of the pressure at the central XOY cross-section for different rotation speeds.
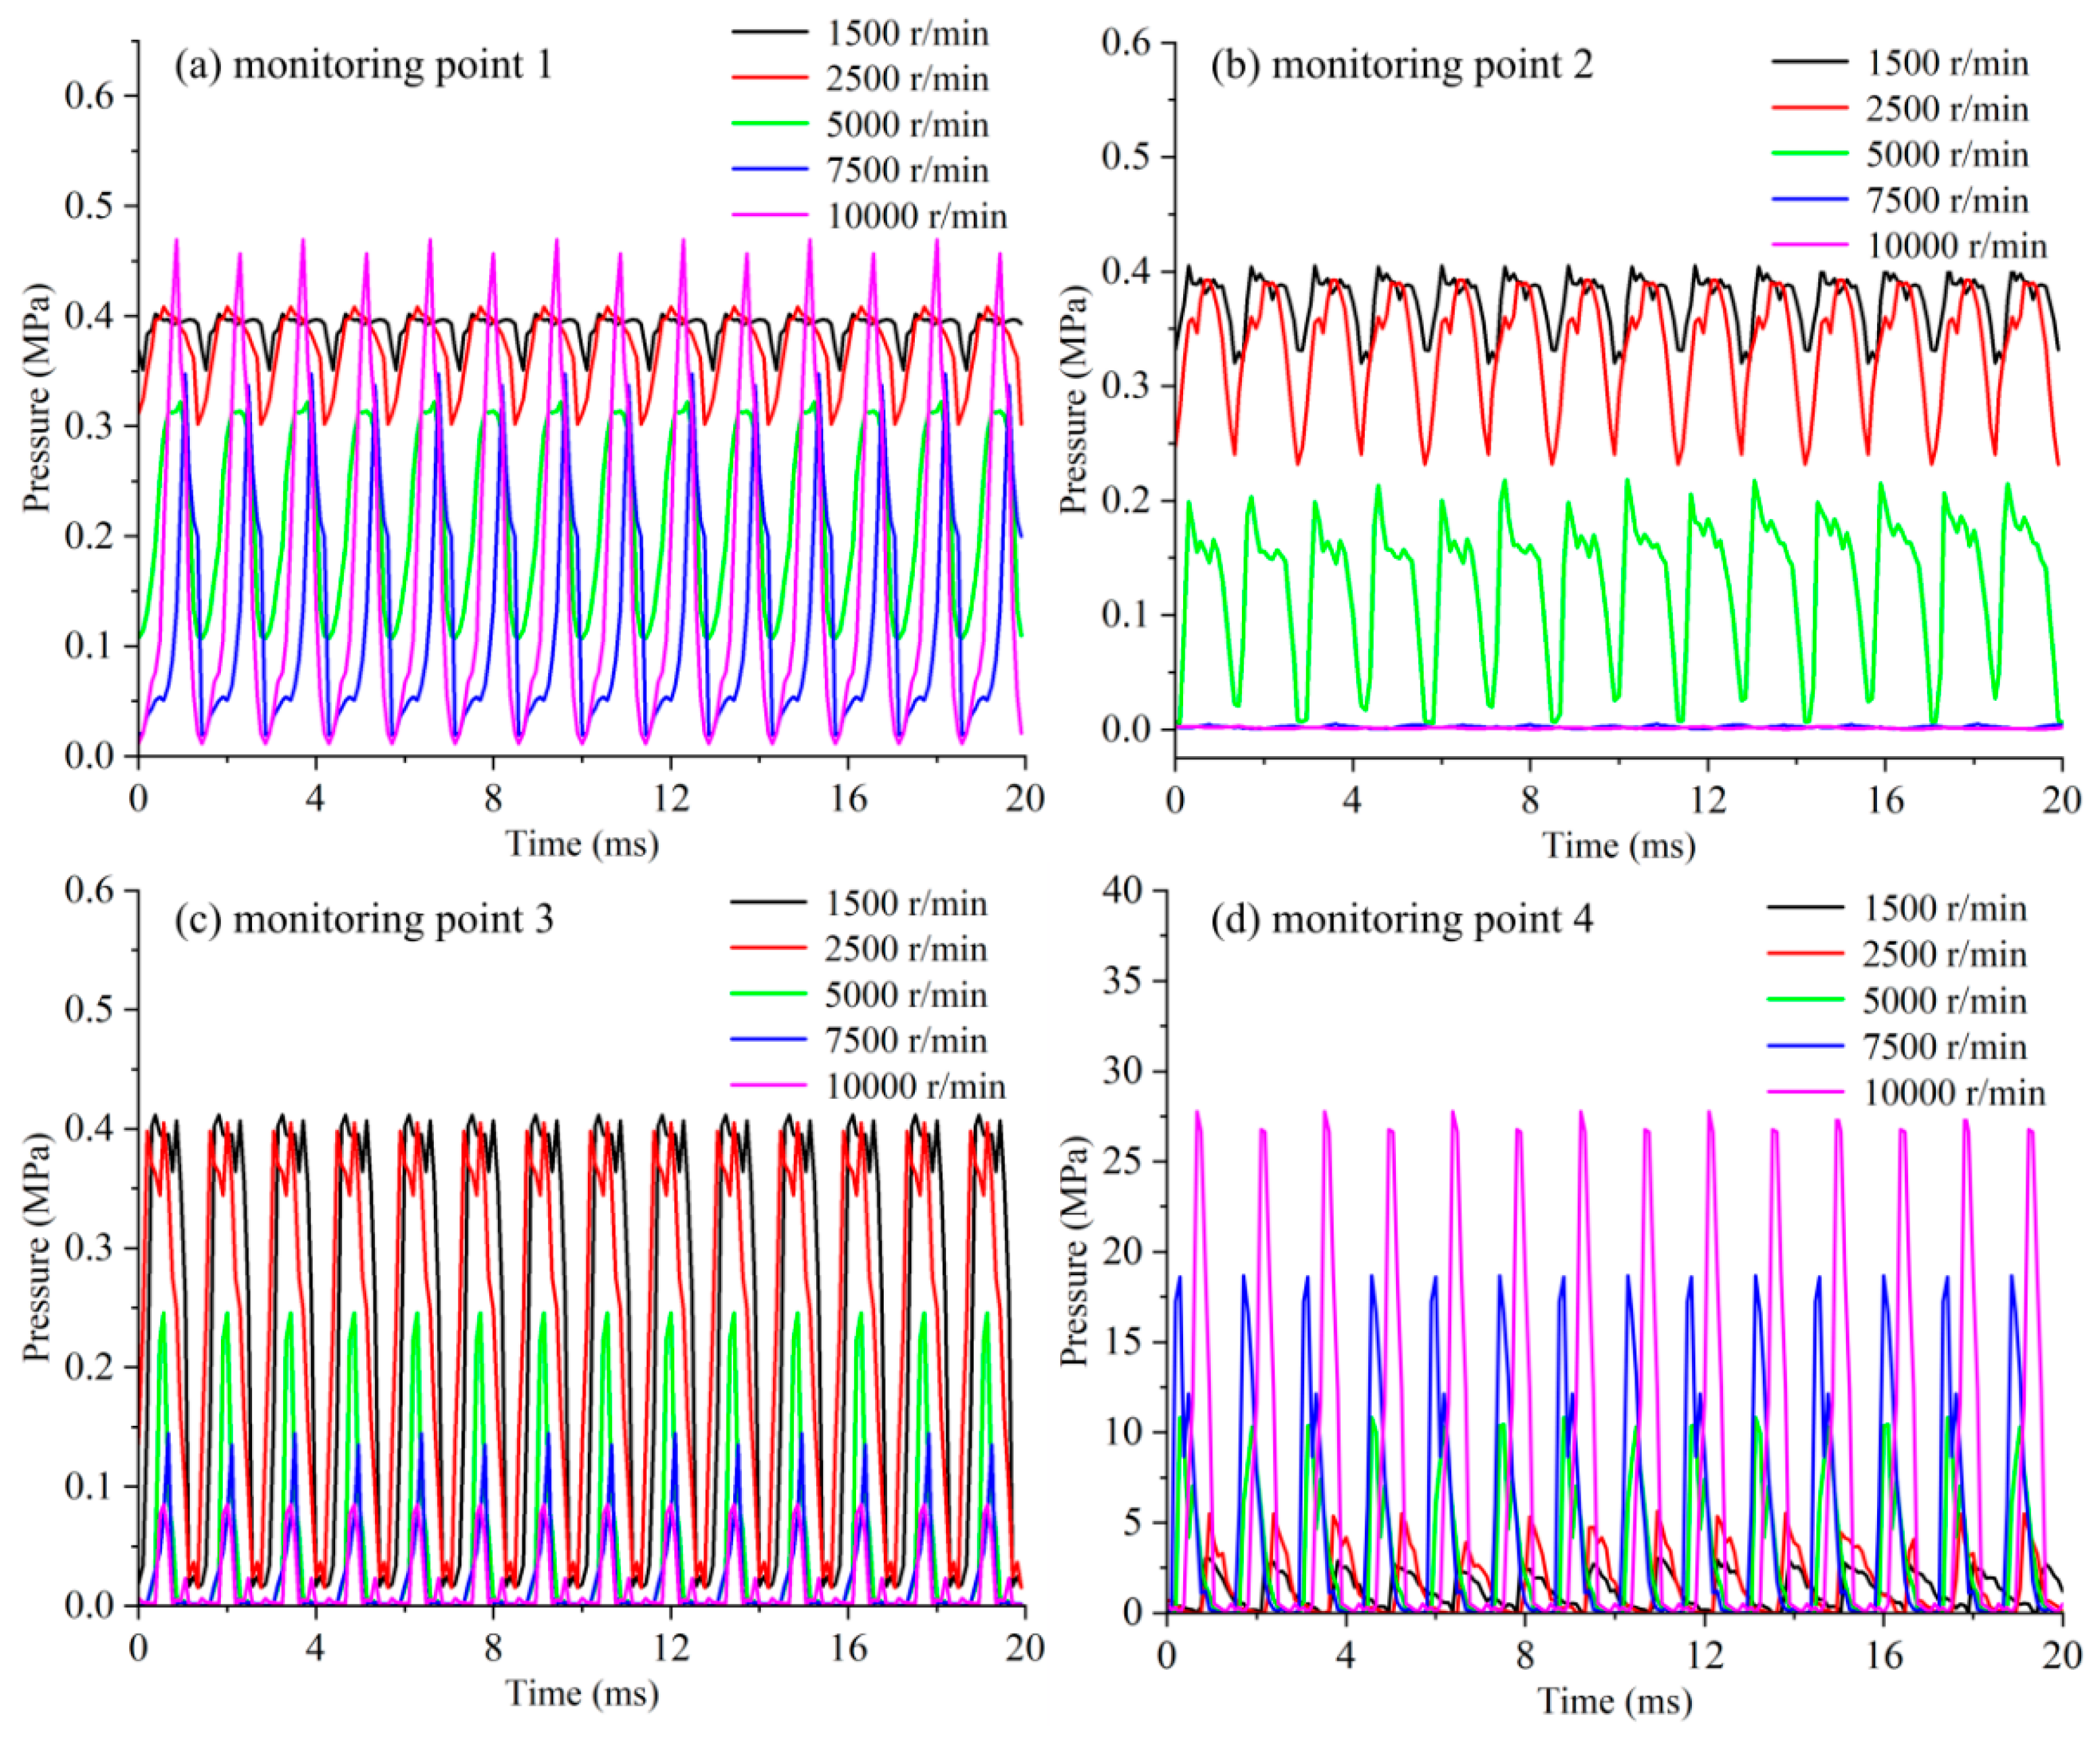
Figure 13 shows the pressure variation for the monitoring points for different rotation speeds. For Monitoring Point 1, the pressure was smaller at a lower rotation speed. Additionally, greater pressure fluctuation was found at a higher rotation speed. For Monitoring Point 2, the pressure in the region of the entering gear appeared to decrease with the increase in the rotation speed, especially at a higher speed. This phenomenon might have been attributed to the cavitation generated in that region (exactly in the tooth tip area), accompanied by a low-pressure zone. Additionally, the pressure at Monitoring Point 3 in the region closer to the gear engagement was approximately decreased with the increase in the rotation speed, which presented similar development to that at Monitoring Point 2. However, the variation amplitude of the pressure was greater, especially at the high rotation speed of 10,000 r/min. For Monitoring Point 4, in the region of gear engagement, a higher pressure was found at a higher rotation speed. For a high rotation speed, the fuel could be easily trapped in the region of gear engagement without release, which caused the fuel pressure to be extremely accumulated for enhancement. This was the explanation for the phenomenon of pressure developing with the rotation speed discussed earlier for Monitoring Point 4. Furthermore, it is worth noting that, due to the effect of cavitation or the fuel-trapped phenomenon, the amplitude and frequency of pressure oscillation varied with the change in the rotation speed of the fuel gear pump.
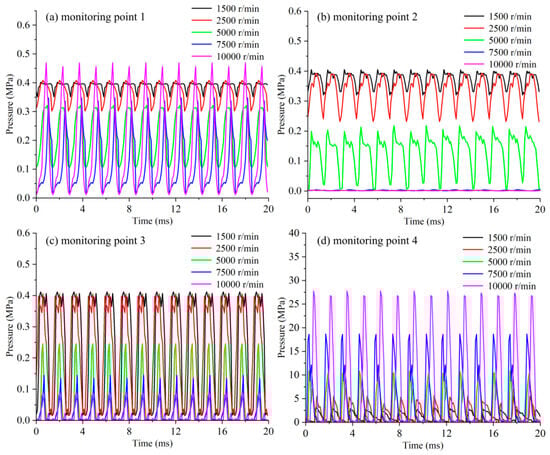
Figure 13.
Influence of rotation speeds on pressure variation for different monitoring points.
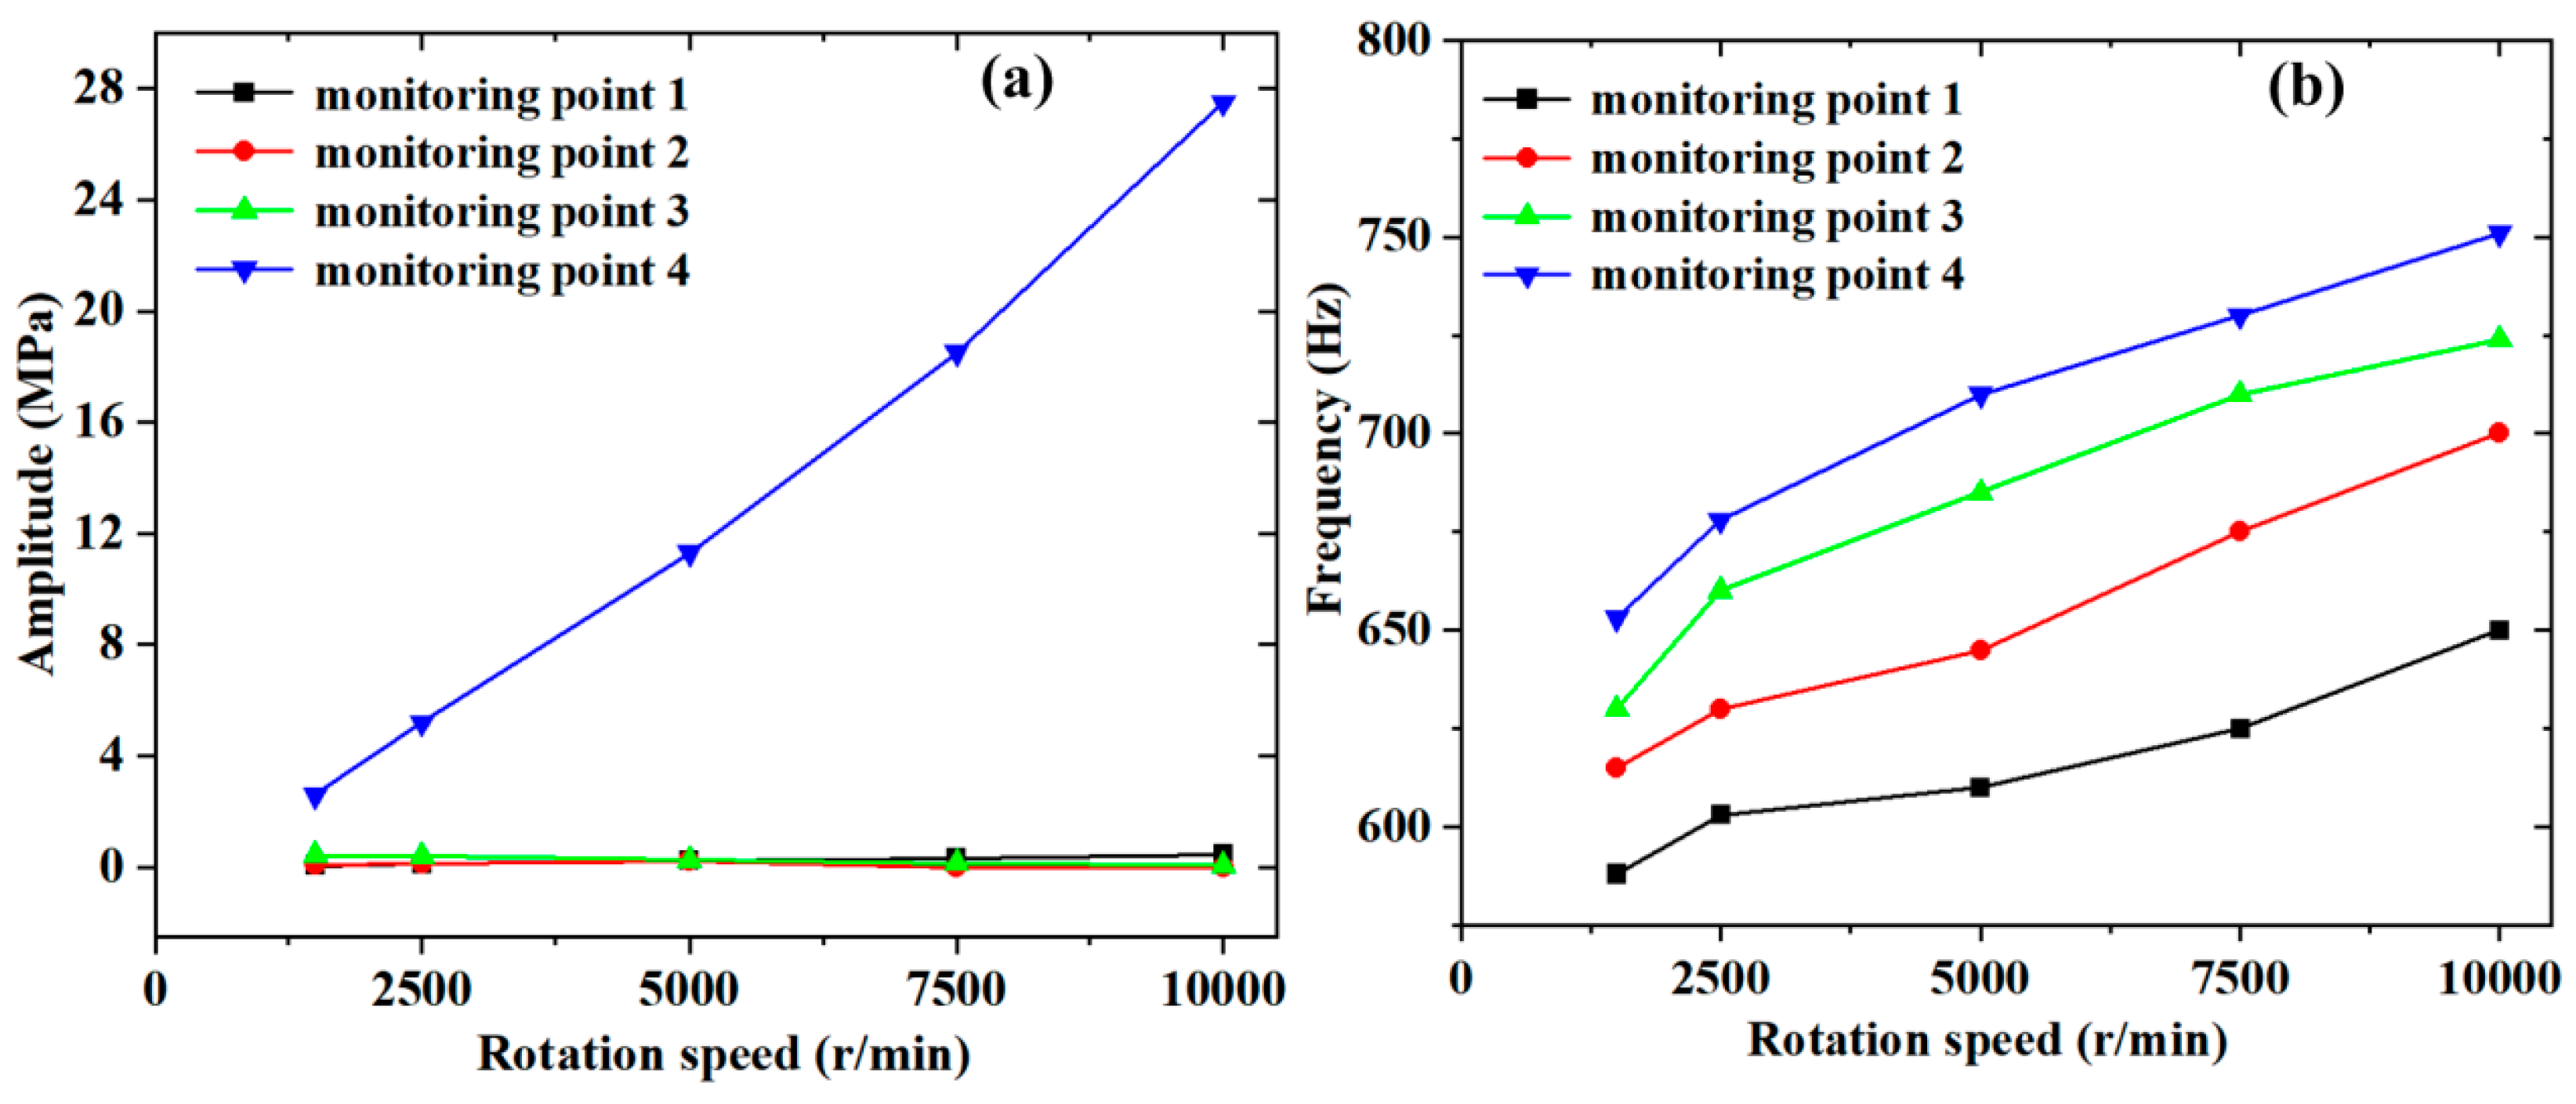
Figure 14 shows the amplitude and frequency of the oscillational pressure influenced by the rotation speed for different monitoring points. As can be seen in Figure 12a, the pressure amplitudes for monitoring points 1, 2, and 3 were almost the same and were not sensitive to the influence of the rotation speed. However, the pressure amplitude for Monitoring Point 4 was much greater than that for other monitoring points, and the deviation was increased with the increase in the rotation speed. In addition, the pressure amplitude was found to have linear development with the increment of the rotation speed, reaching the maximum value at the highest rotation speed of 10,000 r/min. This indicated that the pressure was much greater in the fuel-trapping region and was more sensitive to the influence of the rotation speed.

Figure 14.
Plots of the (a) pressure amplitude and (b) frequency with the rotation speed for the monitoring points.
It can be seen from Figure 14b that the frequency of the oscillational pressure for each monitoring point was increased when the rotation speed of the gear pump increased. The relationship between the frequency and the rotation speed also presented linear development. Additionally, the frequencies for monitoring points 1 and 4 had the lowest and highest values for a fixed rotation speed, respectively. This meant that the pressure became more intense along the fluid direction, resulting in the lowest and highest frequencies at monitoring points 1 and 4, respectively. Furthermore, the fuel-trapped zone (i.e., the region of Monitoring Point 4) had a higher pressure amplitude and frequency, which could produce severe vibration and noise and then shorten the life of the fuel gear pump. Thus, due to the pressure characteristics in the key fuel-trapped zone, a higher rotation speed should be a matter of concern for the reliability of a fuel gear pump.
3.3. Cavitation Characteristics
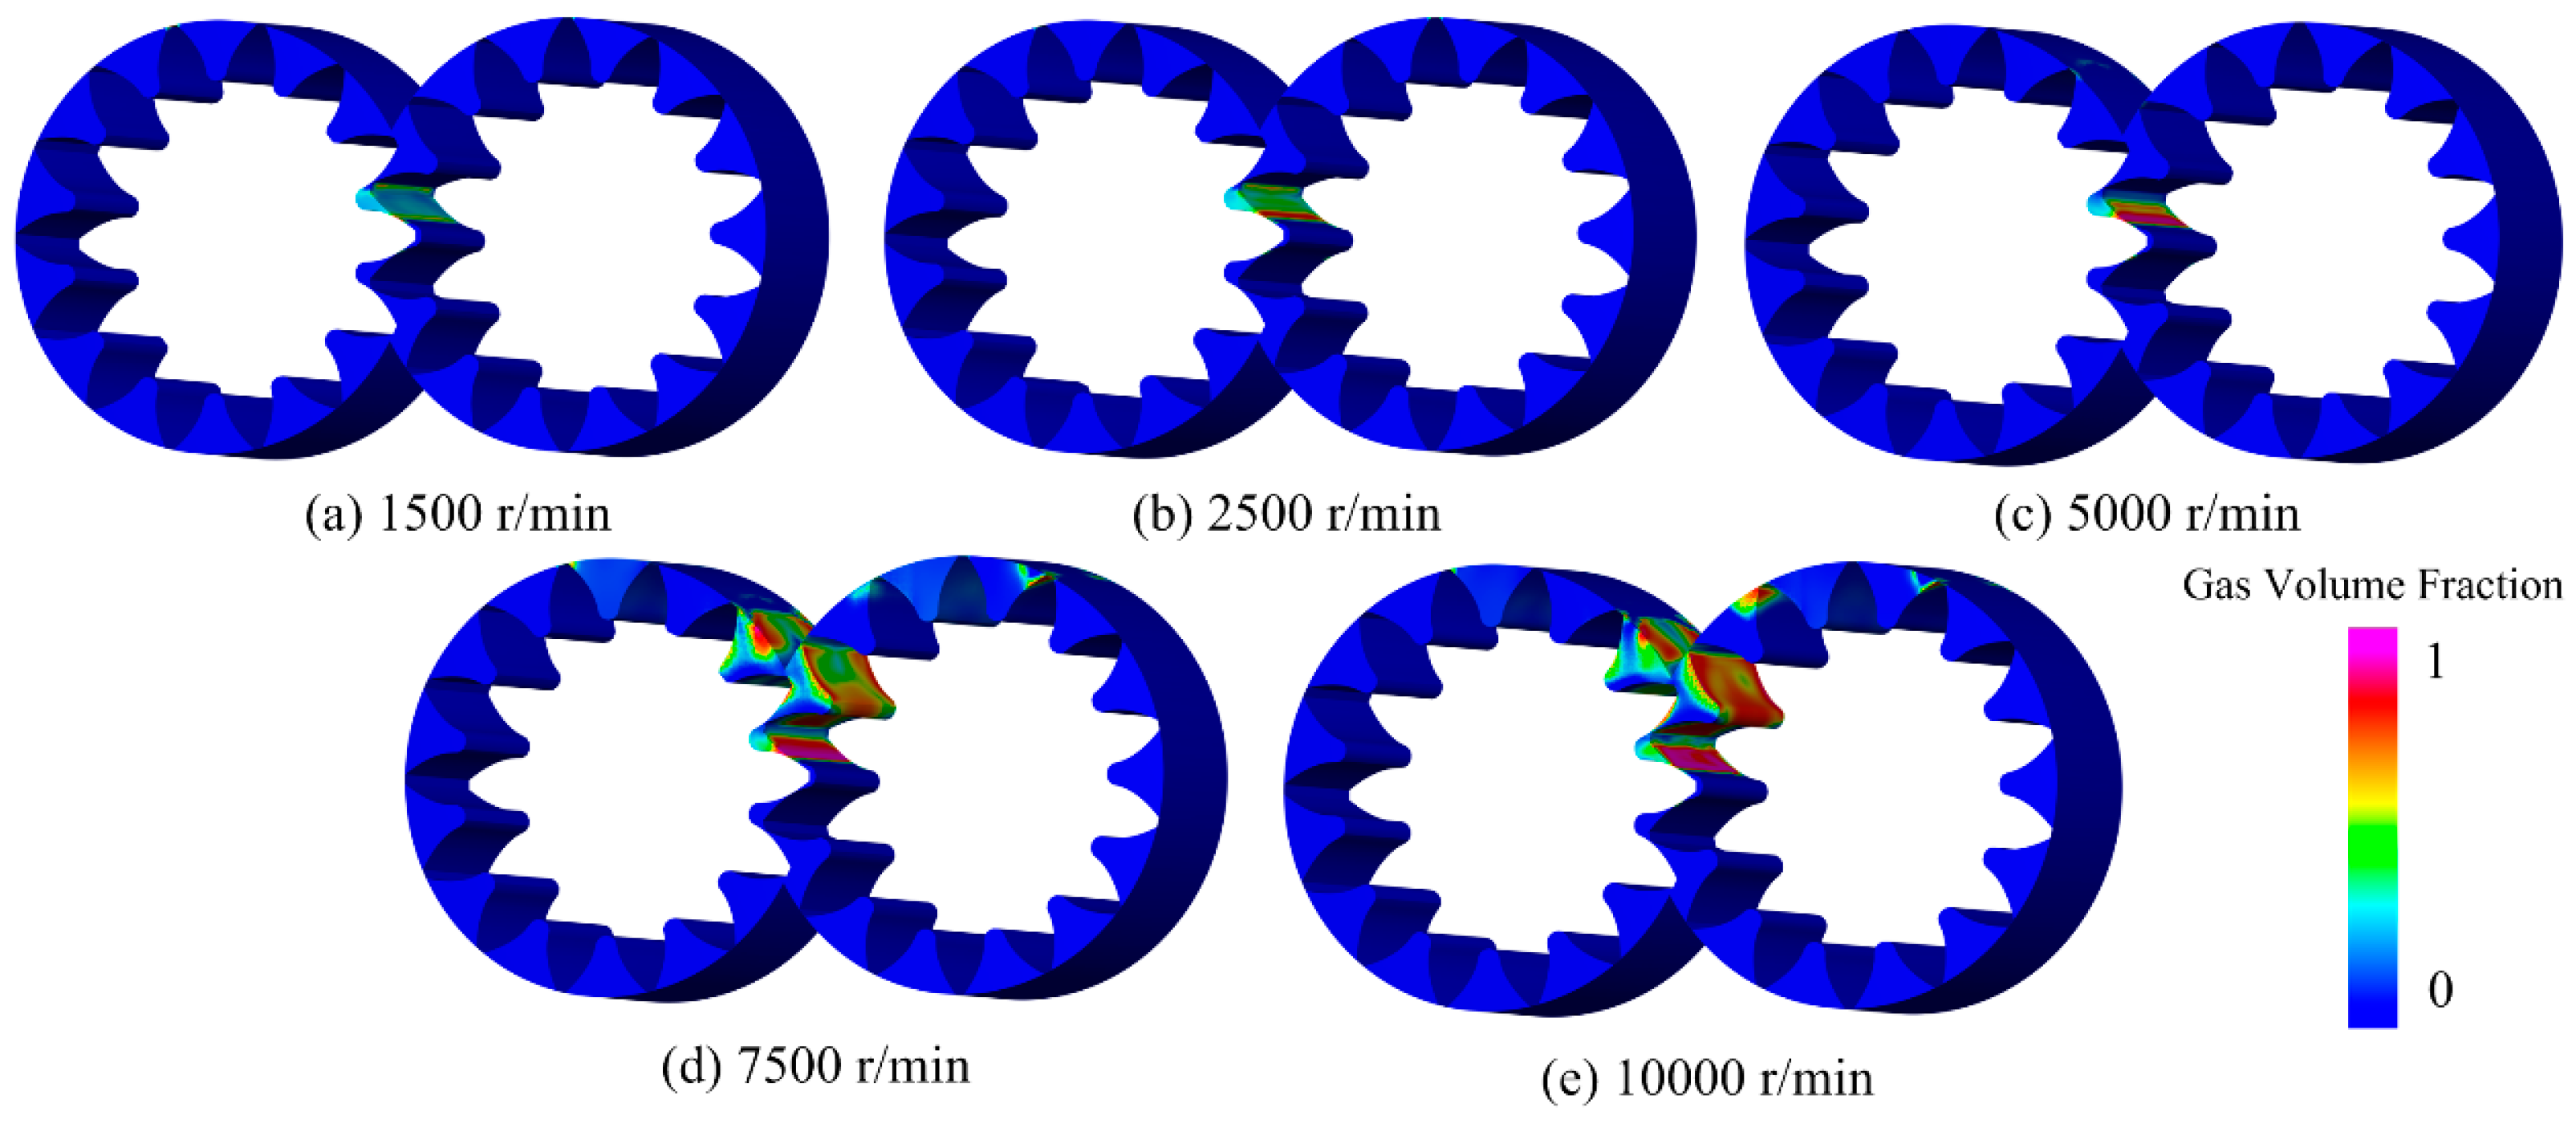
Figure 15 shows the distribution of cavitation volume fraction in the gear region for different rotation speeds. As indicated by the color distribution, the phenomenon of cavitation was more obvious when the rotation speed increased, especially at the speed of 10,000 r/min. In addition, it could be found that cavitation occurred in the region from gear engagement to withdrawal. This was because the greater pressure trapped in the gear engagement zone (discussed above) was quickly released at a higher rotation speed and decreased to below the fuel vapor saturation pressure in the region from gear engagement to withdrawal, resulting in the occurrence of cavitation.
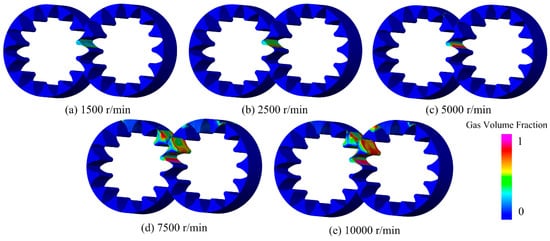
Figure 15.
Three-dimensional cavitation gas volume fraction for different rotation speeds.
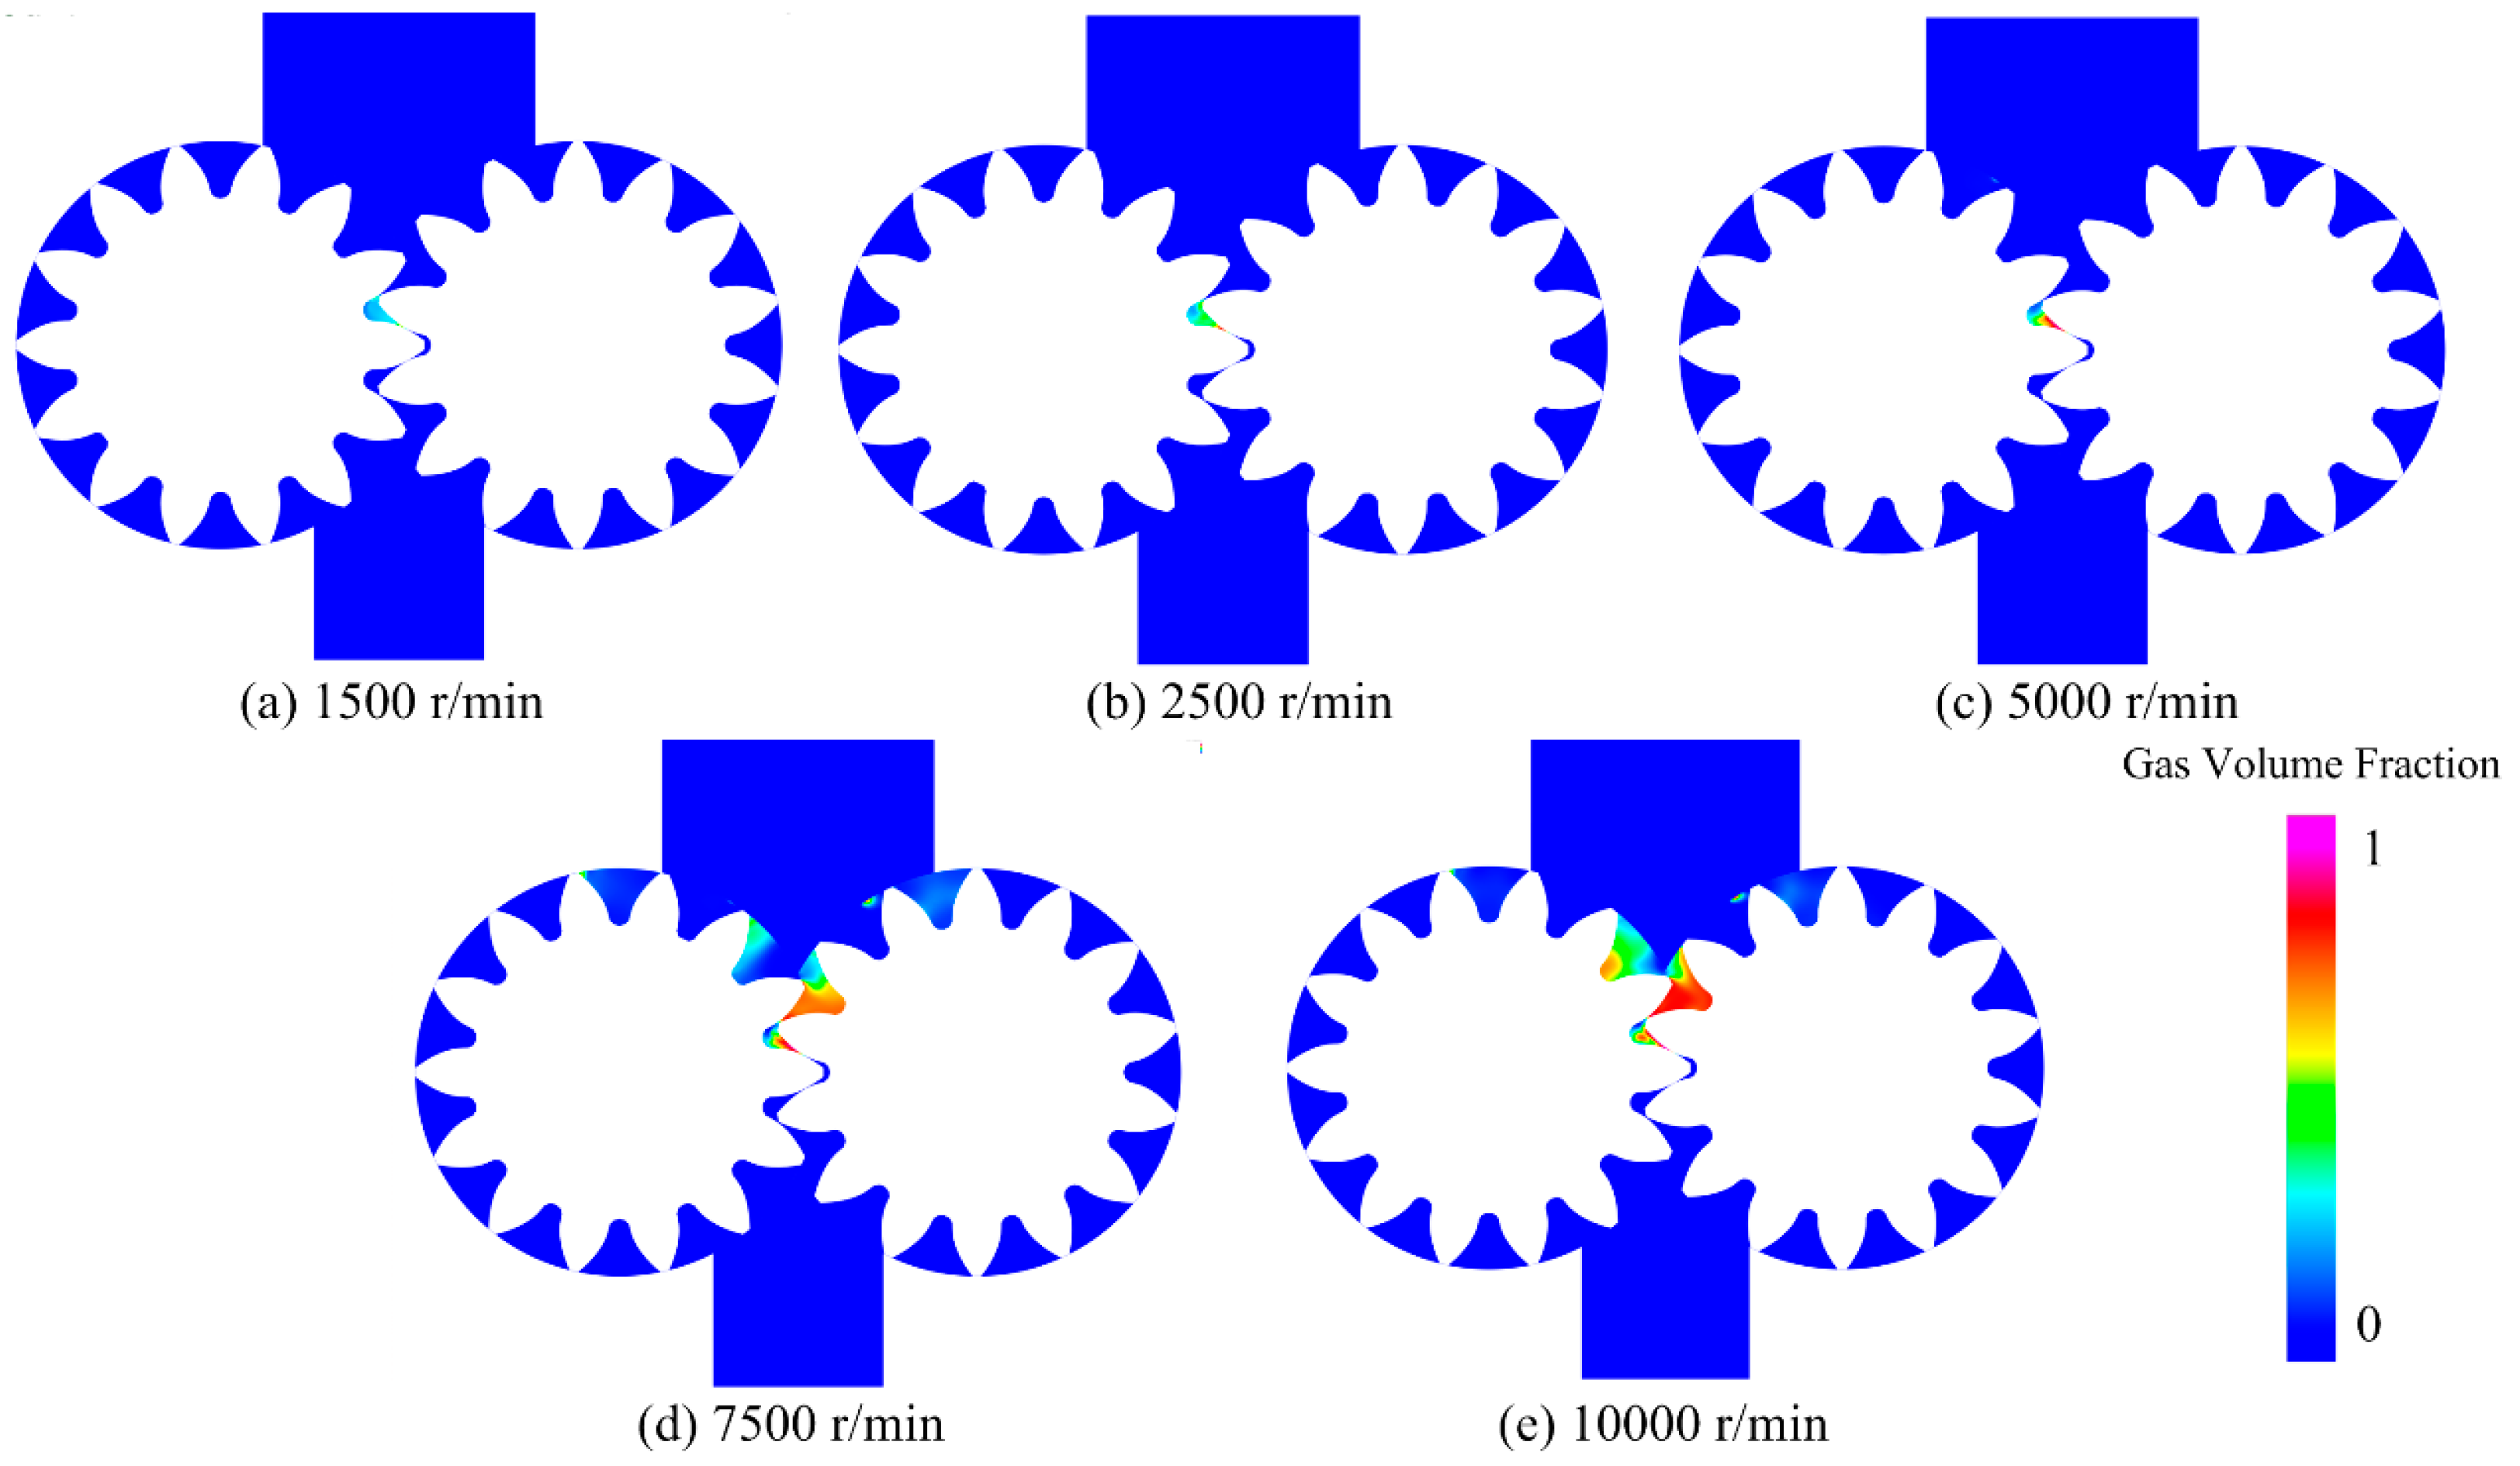
As shown in the cavitation gas volume fraction distributed at the XOY center cross-section in Figure 16, the area and the intensity of cavitation were gradually improved when the rotation speed increased. In addition, a small amount of cavitation was generated in the gear engagement region at a lower rotation speed, whereas the cavitation became more intense and extended to the withdrawal of the gear at a higher rotation speed. To extrapolate this point, cavitation was found to be generated in the region of gear engagement and then extended to the withdrawal of the gear with the increment of the rotation speed.

Figure 16.
Distribution of cavitation gas volume fraction at the central XOY cross-section at different rotation speeds.
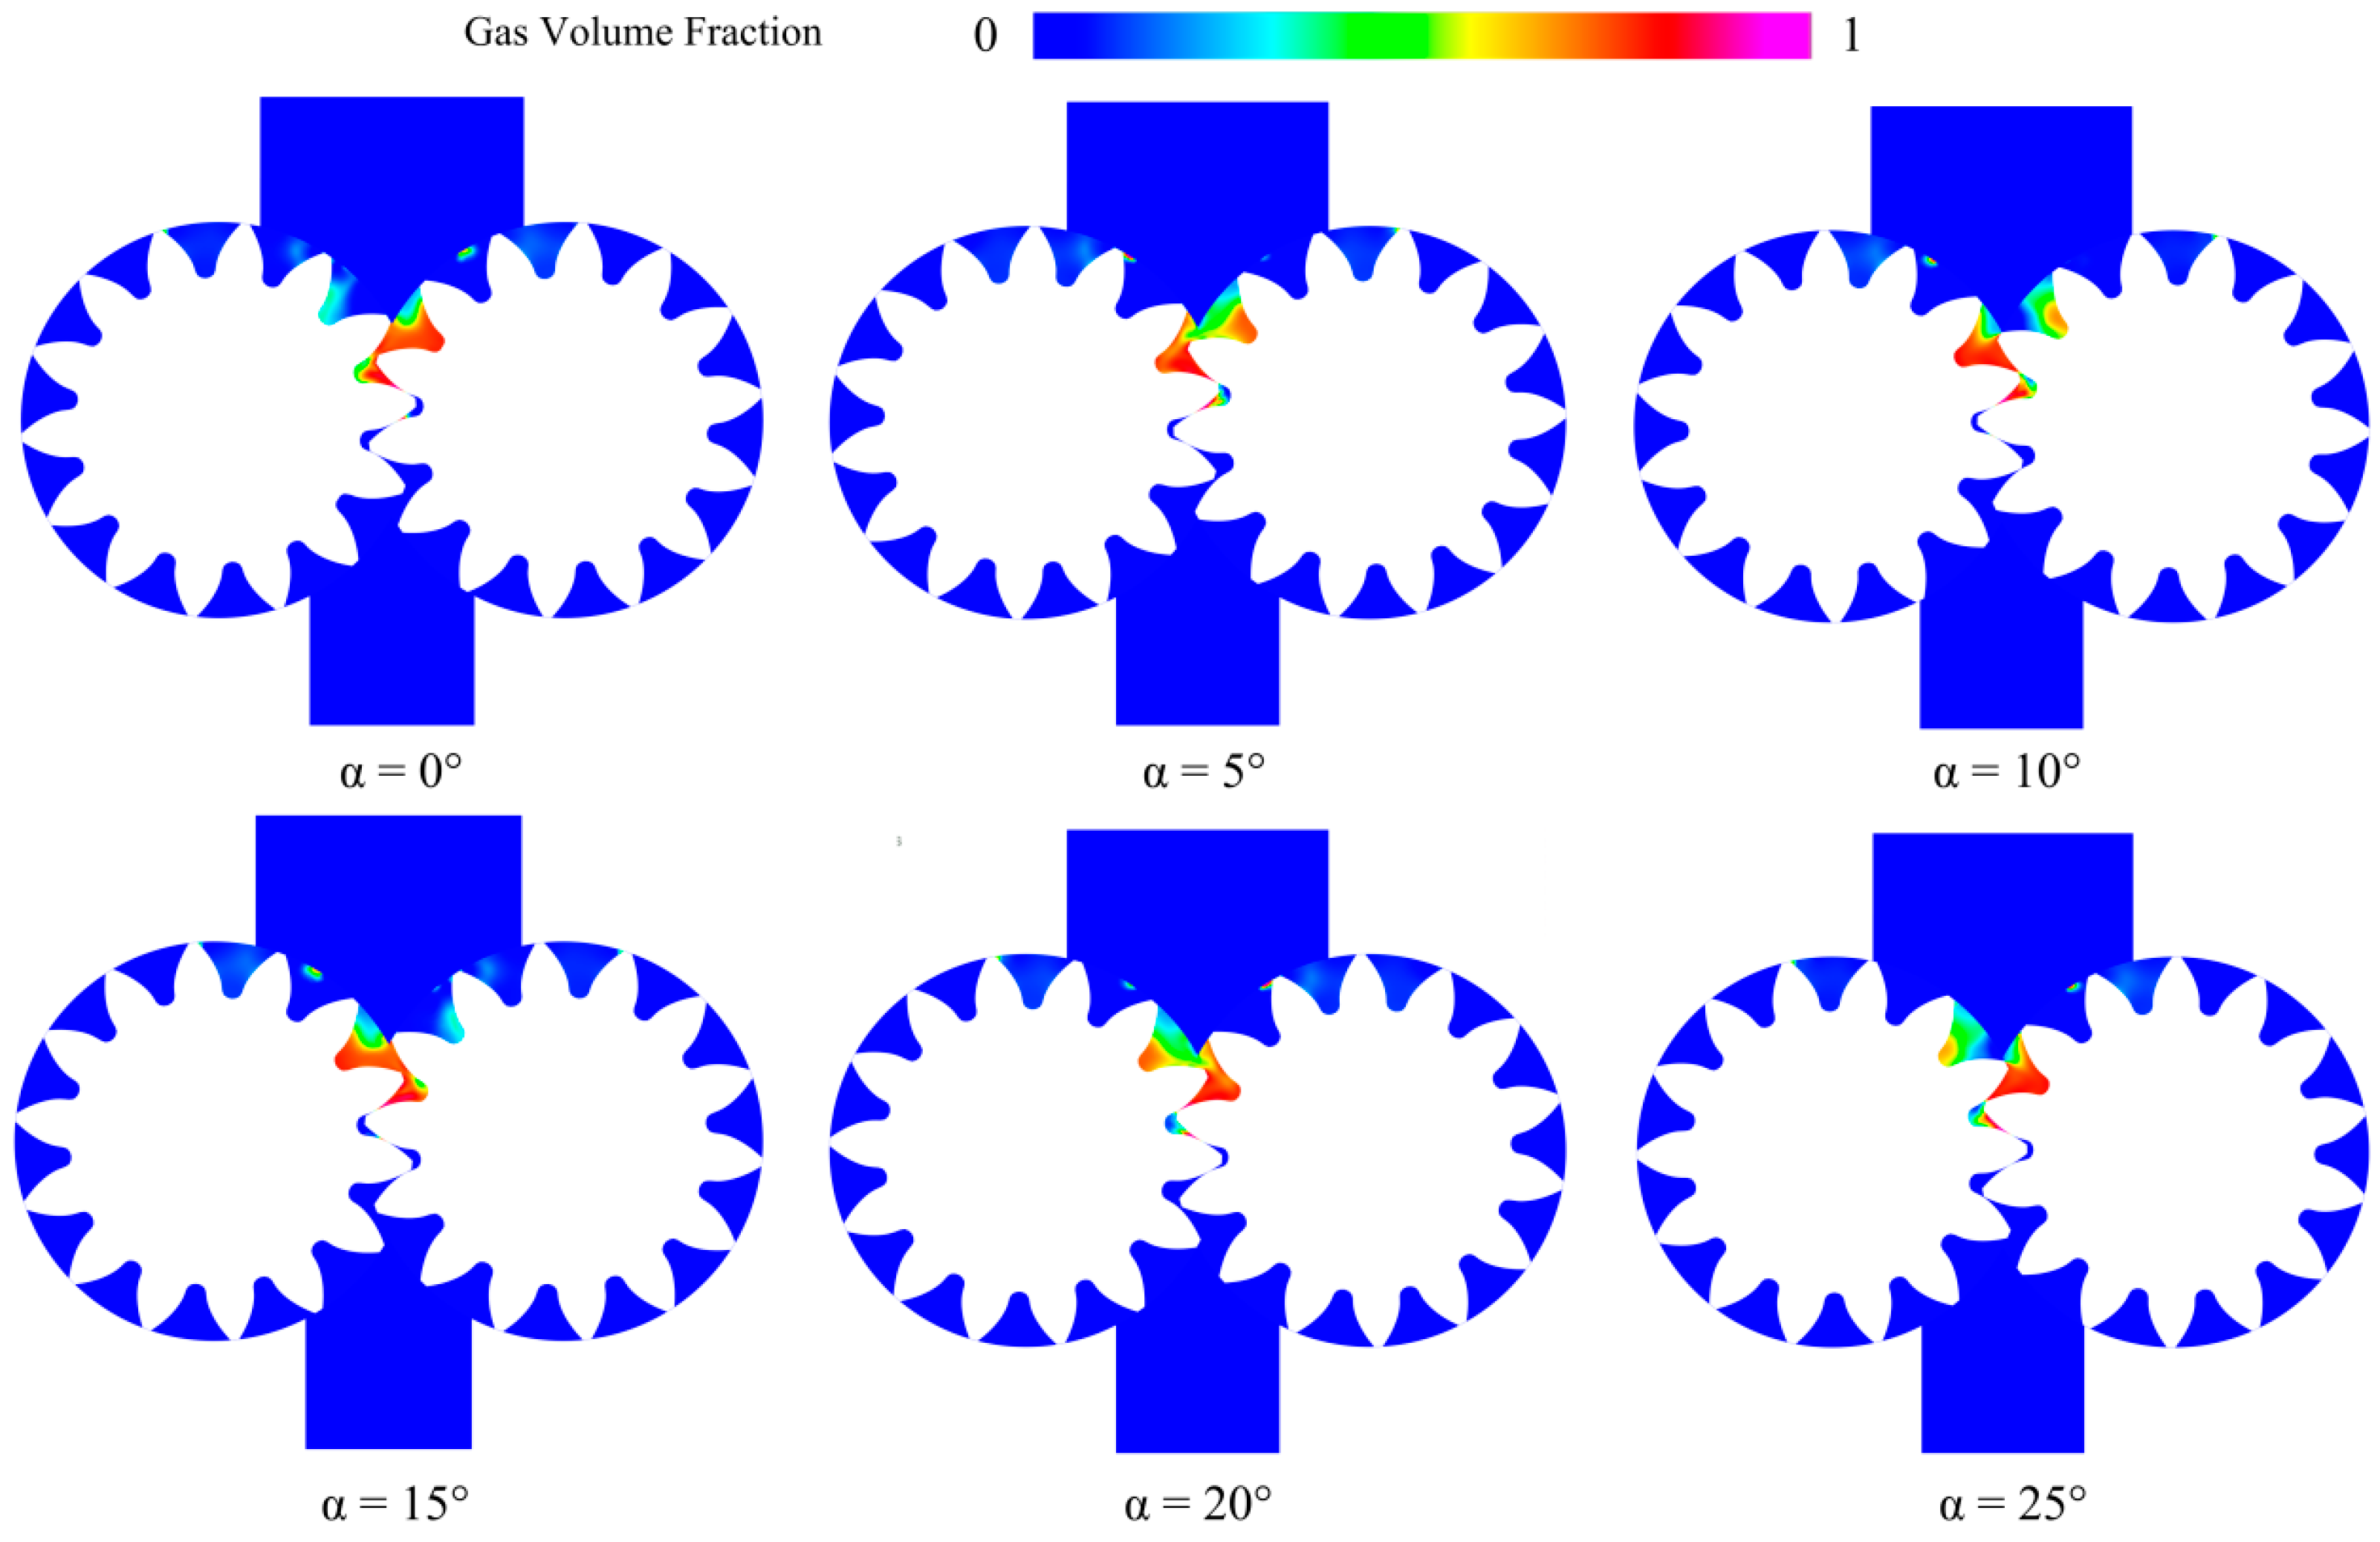
Figure 17 shows the variation in cavitation gas volume fraction for the high rotation speed of 10,000 r/min. It can be seen from the figure that the cavitation mainly occurred in the region of gear engagement to the exit of the gear. As the angle passed, the region of main cavitation occurrence switched between the driving gear and the slave gear. Additionally, the greater cavitation gas volume fraction was found to be located in the region of the gear withdrawal, which meant that serious cavitation occurred due to the great pressure released in this location.

Figure 17.
Angle dependence of the cavitation gas volume fraction at the central XOY cross-section for the rotation speed of 10,000 r/min.
As shown in Figure 18, the variation in the cavitation gas volume fraction presented periodic fluctuations as time passed. With the increase in the rotation speed, the cavitation gas volume fraction was approximately increased from 0.005 to 0.065. The values of the gas volume fraction at the higher rotation speeds of 7500–10,000 r/min were relatively greater than those at the lower rotation speeds of 1500–5000 r/min. This also meant that the influence of the rotation speed of the gear pump was greater and more evident at a higher value.
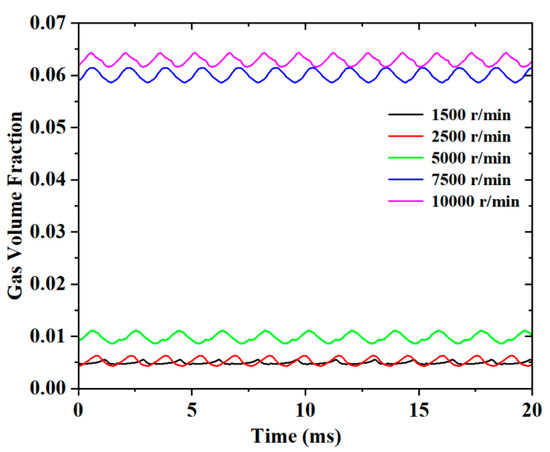
Figure 18.
Variation in the cavitation gas volume fraction influenced by the rotation speed.
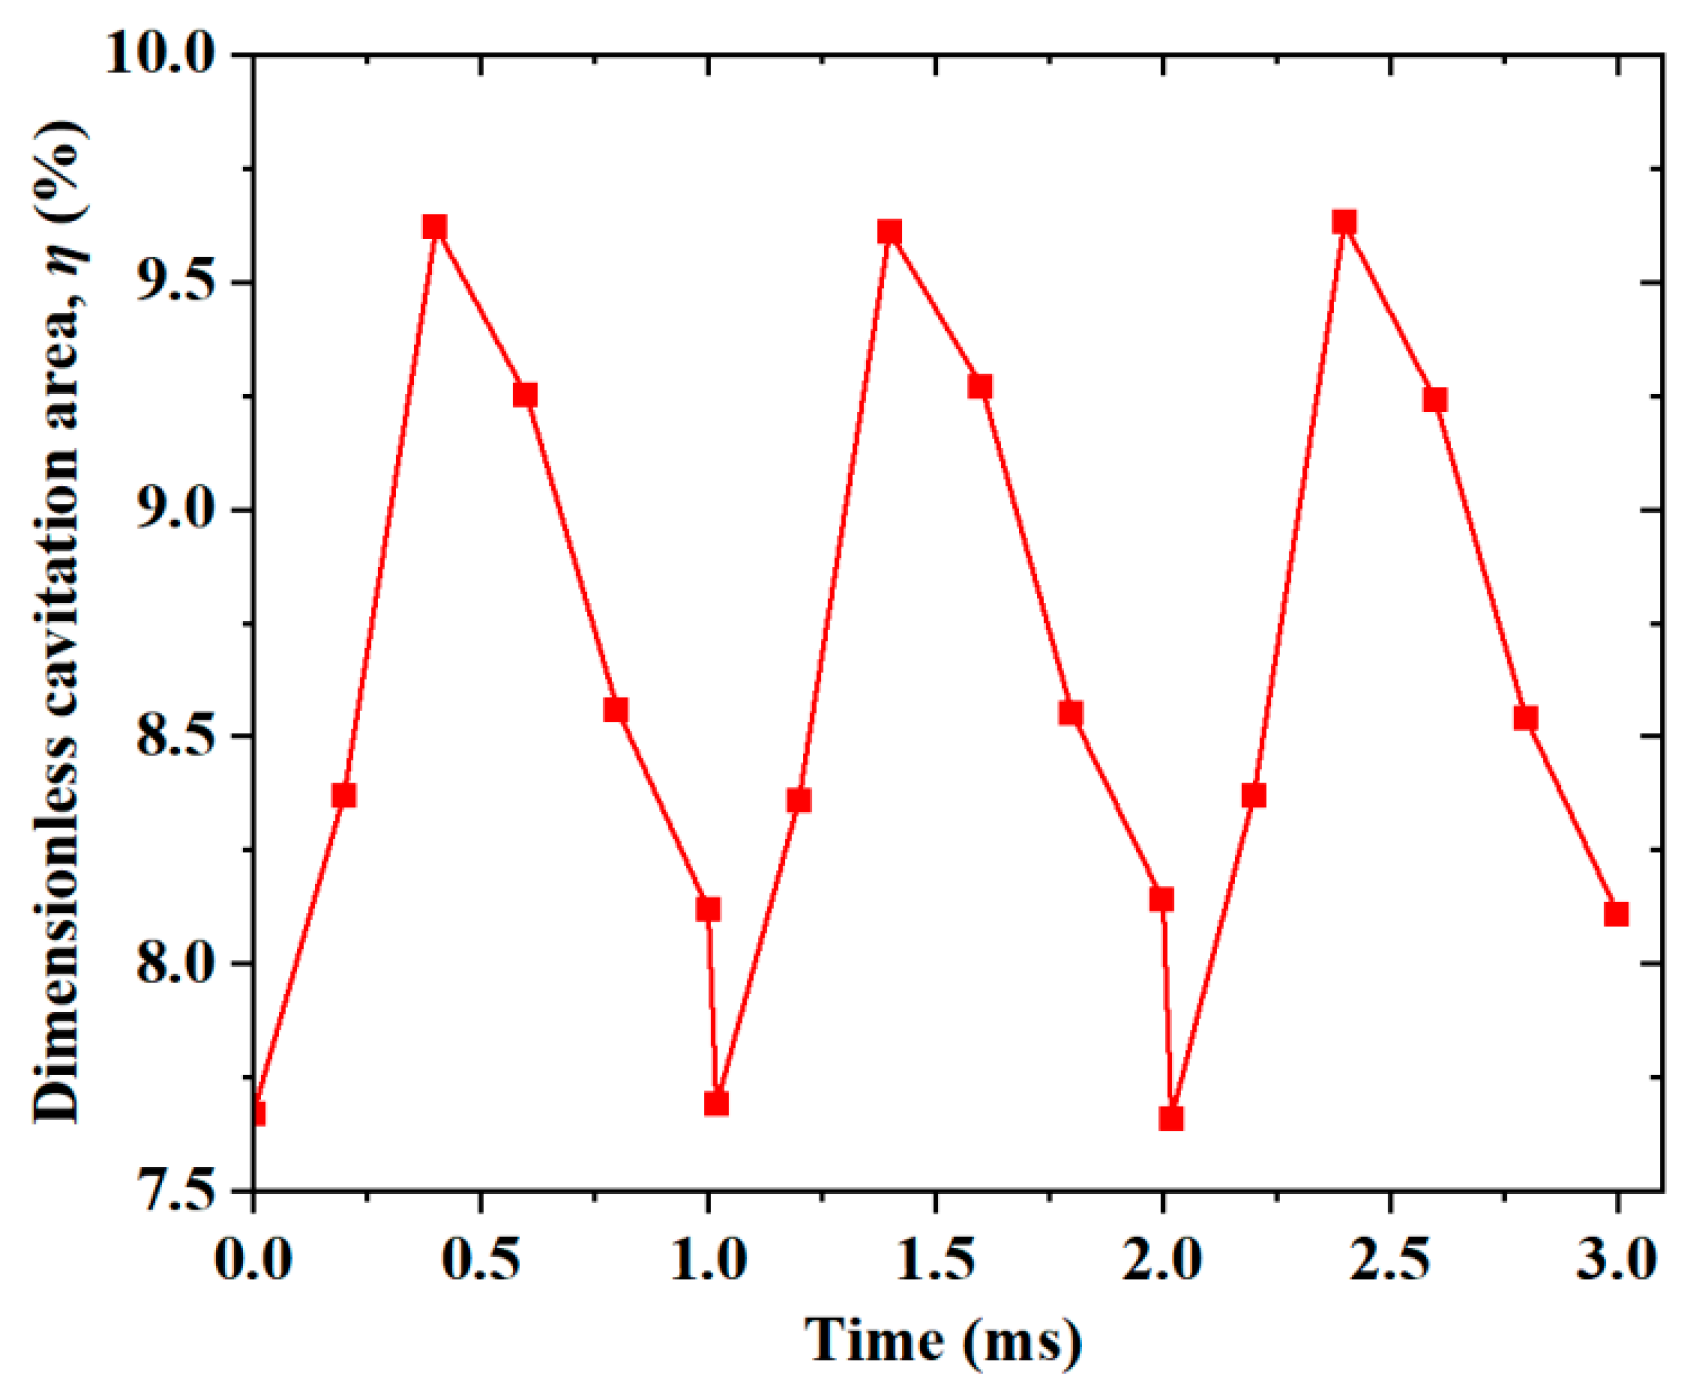
Figure 19 shows the variation in the dimensionless cavitation area at the typical XOY cross-section for a high rotation speed of 10,000 r/min. The dimensionless cavitation area η was defined as follows:
where Ac and A represent the areas of the cavitation region and the gear rotor region, respectively. It can be seen that η also presented periodic fluctuations throughout the dynamic rotating process. One periodic fluctuation meant that one gear experienced the entire process from engagement to the withdrawal of the gear. Additionally, the ascending and declining fluctuation curves signified the withdrawal and the engagement process, respectively. It could be found that the maximum of η was situated at the end of every withdrawal for trapped fuel release due to the dramatically declined pressure in the process of gear withdrawal.
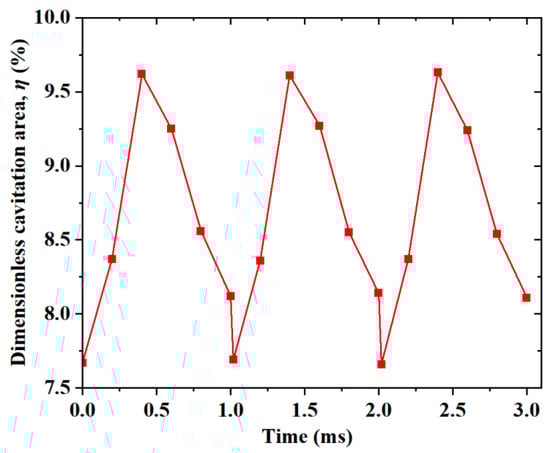
Figure 19.
Time dependence of the dimensionless cavitation area for the rotation speed of 10,000 r/min.
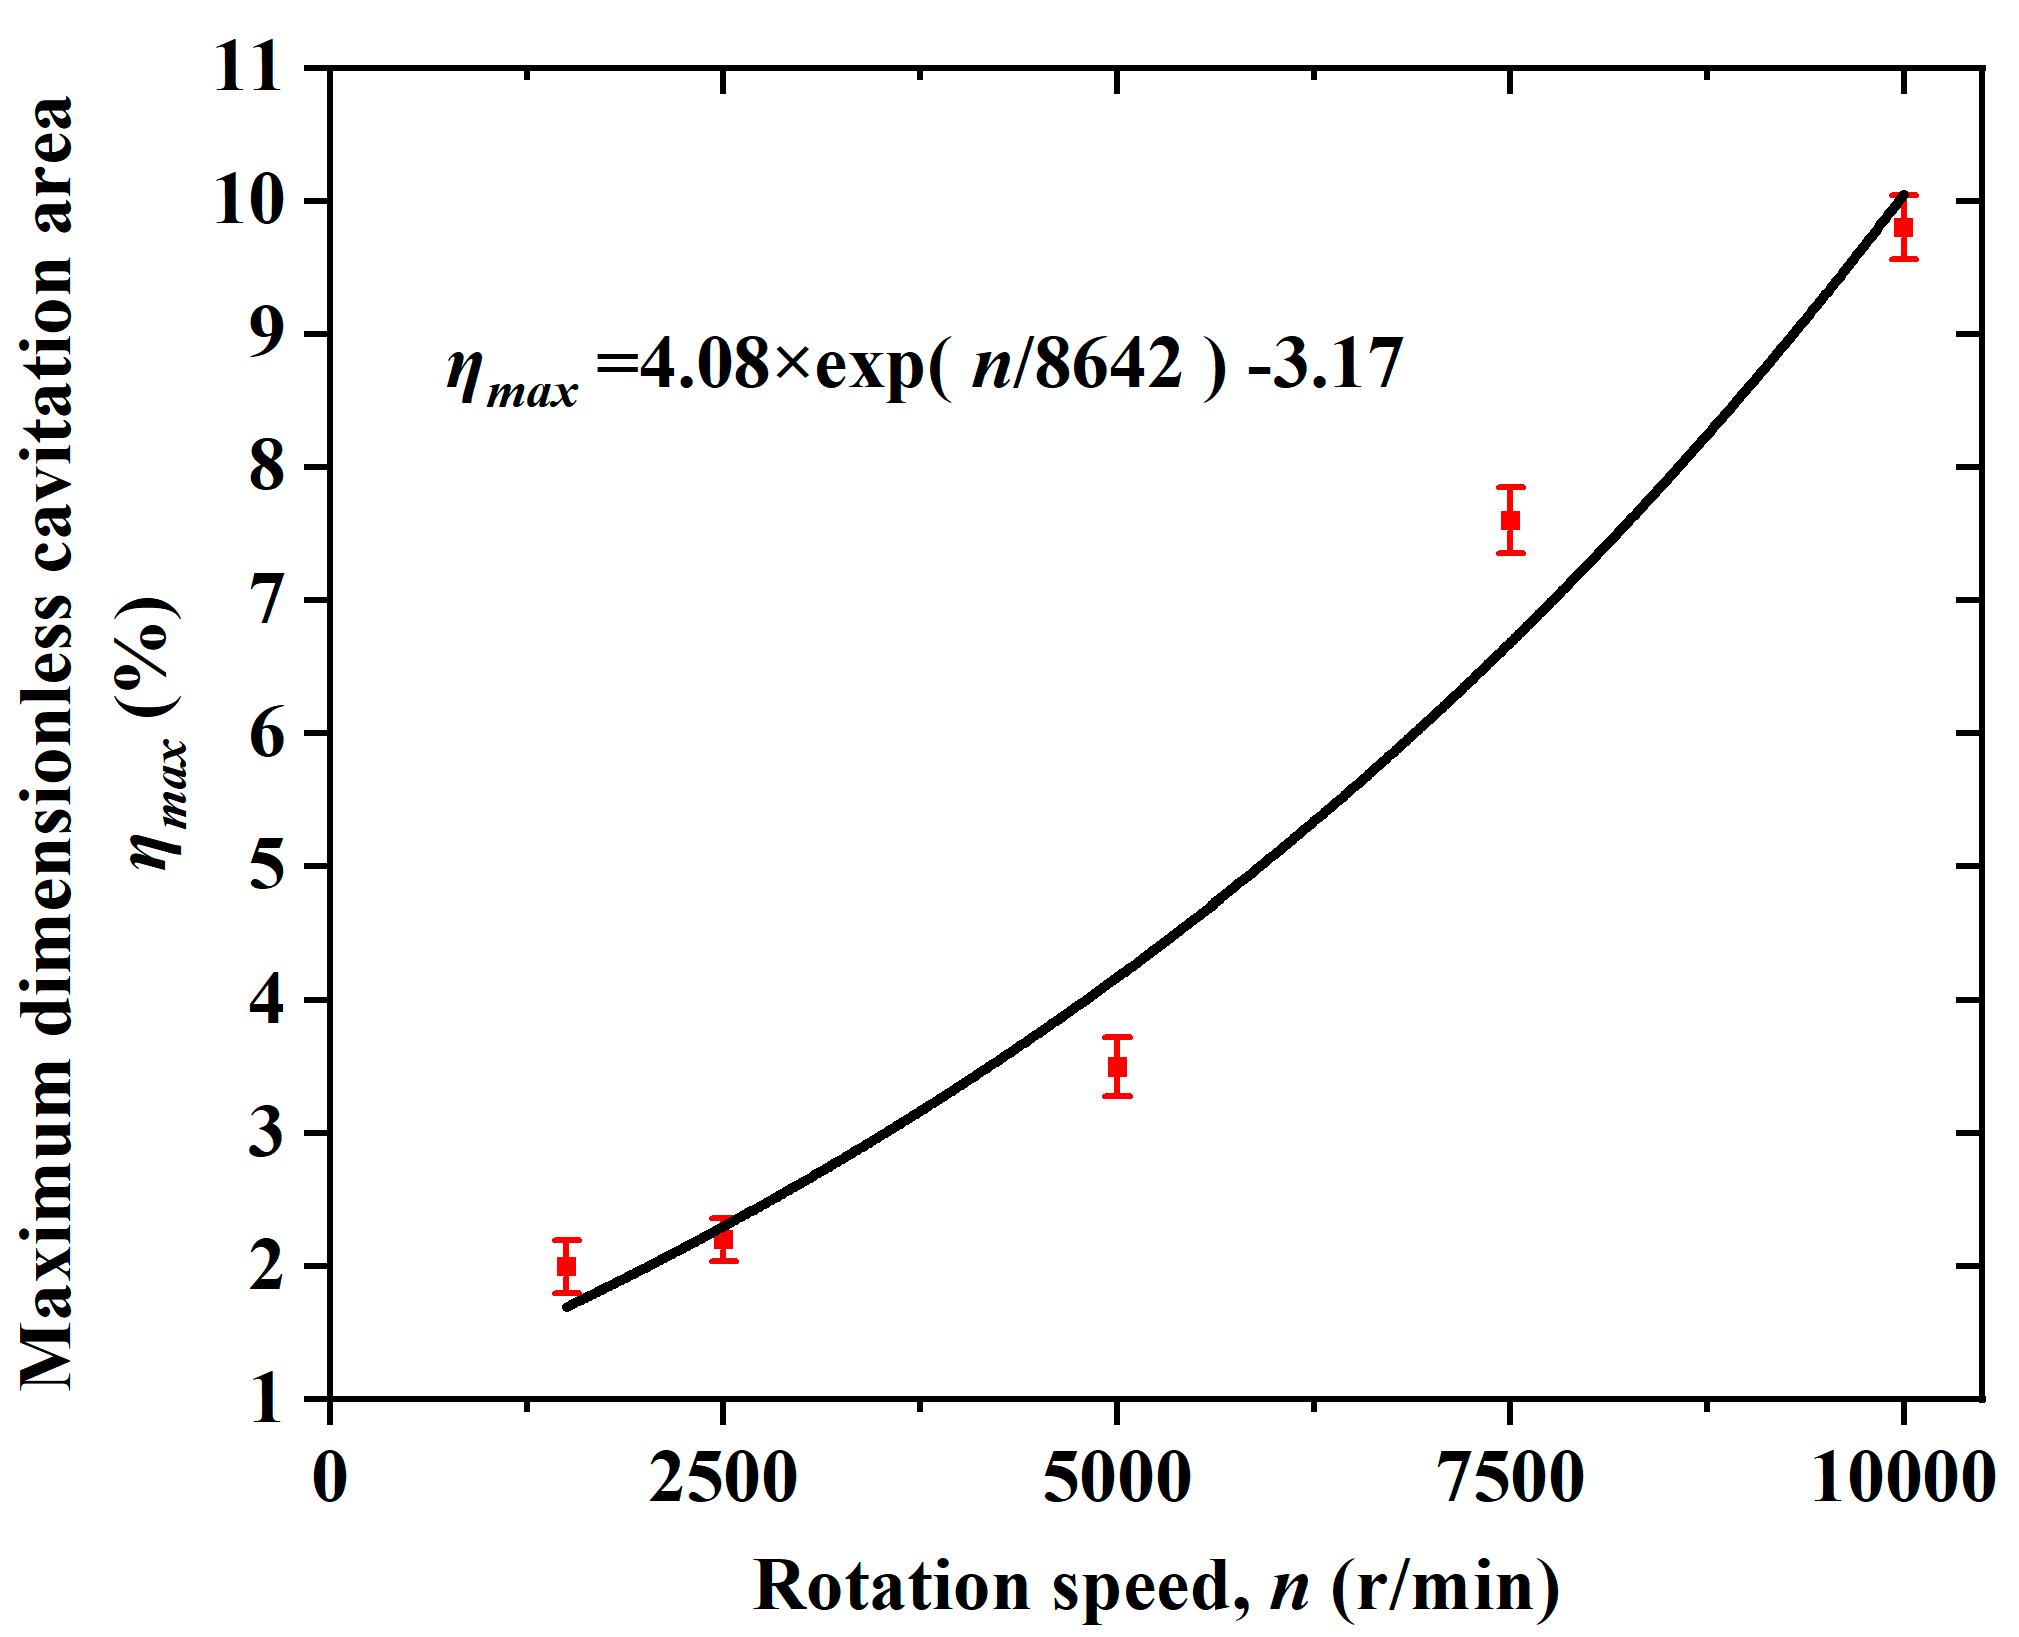
Figure 20 shows the development of the maximum dimensionless cavitation area with the rotation speed. It can be seen that η was gradually increased with the increase in the rotation speed of the gear pump. In addition, the relationship between the ηmax and n could be adequately expressed by a natural exponential development via curve fitting. This meant that the cavitation was gradually aggravated when the rotation speed increased. Thus, the rotation speed of the gear pump should be considered to control the performance enhancement of a fuel gear pump in the aircraft industry.
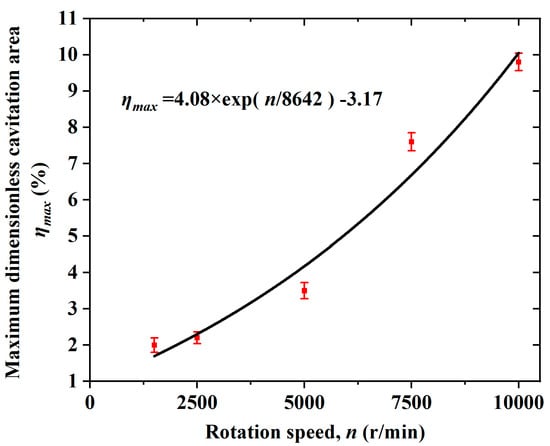
Figure 20.
Maximum dimensionless cavitation area as a function of the rotation speed.
4. Conclusions
The flow characteristics (including velocity and pressure distributions, as well as cavitation evolution) of an aircraft fuel gear pump affected by the rotation speeds (ranging from 1500 r/min to 10,000 r/min) were studied in this research. According to the external performance, experimental testing, and corresponding numerical simulation, the flow rate and efficiency gradually increased with the increasing rotation speed. The velocity distribution at the central XOY cross-sections was improved at the outlet section and in the withdrawal engagement with the increase in the rotation speed. The average periodically monitored velocity in the gear engagement zone in particular was greater than that in the suction region. The velocity amplitude presented linear enhancement with the increment of the rotation speed, reaching the maximum value at the rotation speed of 10,000 r/min. The cross-sectional fuel pressure in an aircraft fuel gear pump was also increased with the increase in the rotation speed. According to the periodic pressure variations at monitoring points, it was found that a greater pressure amplitude with a high frequency occurred in the region of gear engagement, especially for a high rotation speed, due to the effect of fuel trapping. Cavitation occurred in the region between gear engagement and withdrawal, and the gas volume fraction became greater with the increase in the rotation speed. Additionally, cavitation occurred in that region due to the quick release of a great amount of pressure. The defined dimensionless cavitation area was found to be the greatest at the moment of the end of every gear withdrawal in the process of gear rotation. Moreover, the relationship of the maximum dimensionless cavitation area with the rotation speed was determined using curve fitting as the natural exponential development. Finally, this study deepens our understanding of the internal flow characteristics of an aircraft fuel gear pump in scientific research, as well as its external performance in aerospace industrial applications.
Author Contributions
Writing—original draft preparation: B.X.; conceptualization, writing—review and editing: Q.L.; methodology, validation: Z.Z.; investigation: Y.G.; visualization: C.L.; validation: Y.Z. All authors have read and agreed to the published version of the manuscript.
Funding
This research was funded by the National Natural Science Foundation of China (No. 52176049), the Public Projects of Zhejiang Province (No. LGG22E060010) and the Key Research and Development Program of Zhejiang Province (No. 2022C01115).
Data Availability Statement
Data are contained within the article.
Conflicts of Interest
Authors Yongcao Gao, Chuancang Li and Yuanding Zhang were employed by the company Zhejiang Huanyu Pump Technology Co., Ltd. The remaining authors declare that the research was conducted in the absence of any commercial or financial relationships that could be construed as a potential conflict of interest.
Nomenclature
| A | Area of the gear rotor region (mm2) |
| Ac | Areas of cavitation region (mm2) |
| Volume force of the micro-element (N) | |
| f | Steam mass fraction |
| g | Gravitational acceleration (m/s2) |
| I | Unit tensor |
| k | Turbulent kinetic energy (m2/s2) |
| n | Rotation speed (r/min) |
| P | Static pressure (Pa) |
| PB | Bubble pressure (Pa) |
| Pt | Turbulent kinetic energy generation |
| R | Gas-liquid phase change rate |
| RB | Radius of a bubble (mm) |
| Rc | Bubble disappearance rate |
| Re | Bubble generation rate |
| Velocity vector | |
| ui | Turbulence viscosity (m3/s) |
| uj | Turbulence viscosity of component j (m3/s) |
| V | Velocity (m/s) |
| α | Vapor volume fraction |
| ε | Dissipation rate |
| η | Dimensionless cavitation area |
| ηmax | Maximum dimensionless cavitation area |
| μ | Dynamic viscosity (Pa) |
| ρ | Total fluid density (kg/m3) |
| ρl | Liquid density (kg/m3) |
| ρv | Vapor density (kg/m3) |
| τij | Reynolds stress tensor |
| Stress tensor (Pa) | |
| σk | Prandtl number of turbulent kinetic energy |
| σε | Prandtl number of the dissipation rate |
References
- Stryczek, J.; Antoniak, P.; Jakhno, O.; Kostyuk, D.; Kryuchkov, A.; Belov, G.; Rodionov, L. Visualisation research of the flow processes in the outlet chamber-outlet bridge-inlet chamber zone of the gear pumps. Arch. Civ. Mech. Eng. 2015, 15, 95–108. [Google Scholar] [CrossRef]
- Zhou, Y.; Hao, M. The study of leakage of circular arc-involute-circular arc gear pump. Adv. Mech Eng. 2017, 9, 1687814017720082. [Google Scholar] [CrossRef]
- Zhao, X.; Vacca, A. Multi-domain simulation and dynamic analysis of the 3D loading and micromotion of continuous-contact helical gear pumps. Mech. Syst. Signal Process. 2022, 163, 108116. [Google Scholar] [CrossRef]
- Ahlawat, R.; Fathy, H.K.; Lee, B.; Stein, J.L.; Jung, D. Modelling and simulation of a dual-clutch transmission vehicle to analyse the effect of pump selection on fuel economy. Vehicle Syst. Dyn. 2010, 48, 851–868. [Google Scholar] [CrossRef]
- Thiagarajan, D.; Dhar, S.; Vacca, A. Improvement of lubrication performance in external gear machines through micro-surface wedged gears. Tribol. Trans. 2017, 60, 337–348. [Google Scholar] [CrossRef]
- Battarra, M.; Mucchi, E. On the assessment of lumped parameter models for gear pump performance prediction. Simul. Model. Pract. Theory 2022, 99, 102088. [Google Scholar] [CrossRef]
- Castilla, R.; Wojciechowski, J.; Gamez-Montero, P.J.; Vernet, A.; Codina, E. Analysis of the turbulence in the suction chamber of an external gear pump using time resolved particle image velocimetry. Flow Meas. Instrum. 2008, 19, 377–384. [Google Scholar] [CrossRef]
- Ertürk, N.; Vernet, A.; Pallares, J.; Castilla, R.; Raush, G. Small-scale characteristics and turbulent statistics of the flow in an external gear pump by time-resolved PIV. Flow Meas. Instrum. 2013, 29, 52–60. [Google Scholar] [CrossRef]
- Ghazanfarian, J.; Ghanbari, D. Computational fluid dynamics investigation of turbulent flow inside a rotary double external gear pump. J. Fluid Eng. 2015, 137, 021101. [Google Scholar] [CrossRef]
- Yoon, Y.; Park, B.H.; Shim, J.; Han, Y.O.; Hong, B.J.; Yun, S.H. Numerical simulation of three-dimensional external gear pump using immersed solid method. Appl. Therm. Eng. 2017, 118, 539–550. [Google Scholar] [CrossRef]
- Frosina, E.; Senatore, A.; Rigosi, M. Study of a high-pressure external gear pump with a computational fluid dynamic modeling approach. Energies 2007, 10, 1113. [Google Scholar] [CrossRef]
- Sedri, F.; Riasi, A. Investigation of leakage within an external gear pump with new decompression slots: Numerical and experimental study. J. Braz. Soc. Mech. Sci. 2019, 41, 224. [Google Scholar] [CrossRef]
- Zhao, X.; Vacca, A. Theoretical investigation into the ripple source of external gear pumps. Energies 2019, 12, 535. [Google Scholar] [CrossRef]
- De Bie, V.G.; Hulsen, M.A.; Anderson, P.D. Finite element modeling of a viscous fluid flowing through an external gear pump. Macromol. Theor. Simul. 2020, 30, 2000060. [Google Scholar] [CrossRef]
- Chai, H.Q.; Yang, G.L.; Wu, G.G.; Bai, G.X.; Li, W.Q. Research on flow characteristics of straight line conjugate internal meshing gear pump. Processes 2020, 8, 269. [Google Scholar] [CrossRef]
- Corvaglia, A.; Ferrari, A.; Rundo, M.; Vento, O. Three-dimensional model of an external gear pump with an experimental evaluation of the flow ripple. Proc. Inst. Mech. Eng. Part C J. Mech. 2021, 235, 1097–1105. [Google Scholar] [CrossRef]
- Szwemin, P.; Fiebig, W. The influence of radial and axial gaps on volumetric efficiency of external gear pumps. Energies 2021, 14, 4468. [Google Scholar] [CrossRef]
- Corvaglia, A.; Rundo, M.; Casoli, P.; Lettini, A. Evaluation of tooth space pressure and incomplete filling in external gear pumps by means of three-dimensional CFD simulations. Energies 2021, 14, 342. [Google Scholar] [CrossRef]
- Sanchugov, V.; Rekadze, P. New method to determine the dynamic fluid flow rate at the gear pump outlet. Energies 2022, 15, 3451. [Google Scholar] [CrossRef]
- Campo, D.D.; Castilla, R.; Raush, G.A.; Montero, P.J.G.; Codina, E. Numerical analysis of external gear pumps including cavitation. J. Fluid Eng. 2012, 134, 081105. [Google Scholar] [CrossRef]
- Zhou, J.; Vacca, A.; Casoli, P. A novel approach for predicting the operation of external gear pumps under cavitating conditions. Simul. Model. Pract. Theory 2014, 45, 35–49. [Google Scholar] [CrossRef]
- Yan, Z.; Liu, J.; Chen, B.; Cheng, X.; Yang, J. Fluid cavitation detection method with phase demodulation of ultrasonic signal. Appl. Acoust. 2015, 87, 198–204. [Google Scholar] [CrossRef]
- Shah, Y.G.; Vacca, A.; Dabiri, S. Air release and cavitation modeling with a lumped parameter approach based on the Rayleigh-Plesset equation: The case of an external gear pump. Energies 2018, 11, 3472. [Google Scholar] [CrossRef]
- Casari, N.; Fadiga, E.; Pinelli, M.; Randi, S.; Suman, A. Pressure pulsation and cavitation phenomena in a micro-orc system. Energies 2019, 12, 2186. [Google Scholar] [CrossRef]
- Teng, J.; Chen, Y.J.; Wang, F.Q.; Bao, W.; Zhou, L. Numerical investigation of centrifugal blood pump cavitation characteristics with variable speed. Processes 2020, 8, 263. [Google Scholar]
- Zhu, J.; Li, H.; Wei, S.J.; Fu, J.F.; Xu, X. An approach of simulating journal bearings-gear pump system including components’ cavitation. Simul. Model. Pract. Theory 2021, 108, 102236. [Google Scholar] [CrossRef]
- Lin, J.; Tseng, Y.; Chang, Y.; Chou, Y.; Tsai, G.; Lan, T. Cavitation of flow field in gear pump. Sens. Mater. 2022, 34, 2293–2309. [Google Scholar] [CrossRef]
- Ouyang, T.; Mo, X.; Liu, Y.; Wang, J. CFD-vibration coupled model for predicting cavitation in gear transmissions. Int. J. Mech. Sci. 2022, 225, 107377. [Google Scholar] [CrossRef]
- Liu, Q.; Qi, X.; Zhu, Z.; Gao, Y.; Yang, G.; Li, C.; Sun, L. Investigation of cavitation characteristics in an aircraft centrifugal fuel pump. Flow. Meas. Instrum. 2024, 96, 102521. [Google Scholar] [CrossRef]


Disclaimer/Publisher’s Note: The statements, opinions and data contained in all publications are solely those of the individual author(s) and contributor(s) and not of MDPI and/or the editor(s). MDPI and/or the editor(s) disclaim responsibility for any injury to people or property resulting from any ideas, methods, instructions or products referred to in the content. |
© 2024 by the authors. Licensee MDPI, Basel, Switzerland. This article is an open access article distributed under the terms and conditions of the Creative Commons Attribution (CC BY) license (https://creativecommons.org/licenses/by/4.0/).