Article

Corrosion Behavior and Mechanical Performance of Drill Pipe Steel in a CO2/H2S-Drilling-Fluid Environment

1
CNPC Research Institute of Safety and Environment Protection Technology, Beijing 102206, China
2
State Key Laboratory of Oil and Gas Reservoir Geology and Exploitation, Southwest Petroleum University, Chengdu 610500, China
*
Author to whom correspondence should be addressed.
Processes 2024, 12(3), 502; https://doi.org/10.3390/pr12030502
Submission received: 17 January 2024 / Revised: 7 February 2024 / Accepted: 26 February 2024 / Published: 29 February 2024
(This article belongs to the Special Issue Oil and Gas Drilling Processes: Control and Optimization)

Abstract

:
Objectives: This article investigates the corrosion behavior and mechanical-property changes of S135, G105, and V150 drill pipe materials in a high-temperature-resistant, potassium amino poly-sulfonate drilling fluid, which has good lubrication performance and contains CO2/H2S, by applying an 80% yield-limit-load simulation. The results show that the CO2-corrosion behavior of G105, S135, and V150 drill pipes are obvious under the simulated constant-load-stress-corrosion environments at the wellhead, well-middle, and bottomhole positions. Compared to uncorroded drill pipes, S135 and V150 drill pipes have increased strength and yield ratios, decreased fracture elongation, and increased sensitivity to hydrogen embrittlement under H2S action, and V150 has a greater risk of stress-hydrogen embrittlement. The strength and yield ratios of G105-material drill pipes decrease, while the fracture elongation increases; the intensity-change amplitude levels are ranked V150 > G105 > S135, and the fracture-elongation-change amplitude is ranked G105 > S135 > V150. The tensile-performance-change amplitude and the SSCC (Sulfide-Stress-Corrosion Cracking) sensitivity of G105 and V150 drill pipes were the highest at the bottomhole. S135 drill pipe materials were most affected by pitting and tensile action at the wellhead, and they had the with the largest SSCC sensitivity.

1. Introduction

As oil and gas exploration and development work is steadily developing towards deep oil and gas, when drilling through multiple formations with different pressures and rock types, complex accidents such as well kicks and gas invasion are often encountered underground. The oil- and gas-well drill pipe is an important tool for transmitting power, raising and lowering the drill bit, and circulating drilling fluid during drilling operations. In the process of drilling operations, acid gases such as CO2 and H2S from gas intrusion are easily dissolved or dispersed in the drilling fluid. At the same time, the handling time of drilling-gas-intrusion accidents is long, and the drill pipe will be subjected to complex underground loads, corrosive media, temperatures, and pressure couplings, which can easily cause deformation, corrosion failure, and even perforation and fracture of the drill pipe body and connections [1,2]. Therefore, it is of great practical significance to study the mechanical-performance damage of drill pipes in CO2/H2S-containing drilling fluids to ensure the safety of drill pipes during deep oil and gas drilling.
Relevant scholars have researched the corrosion behavior, mechanical performance, and failure causes of drill pipes in acidic environments. Huang [3] investigated the corrosion behavior and stress-corrosion mechanism of G105 drill pipes in buffer solutions with different hydrogen ion concentrations through slow strain-rate tensile tests and electrochemical tests. Ref. [4] concluded that the comprehensive influences of various factors, such as stress concentration and SSCC-sensitive temperatures of 20~40 °C are the cause of H2S-stress-corrosion cracking and fracture of S135 drill pipes in a deep well of the Tahe Oilfield. Ref. [5] studied the stress-corrosion-cracking behavior of G105 drill pipe steel in an H2S solution using a slow-strain-rate tensile test and SEM test. Ref. [6] found through chemical composition analysis, metallographic structure analysis, macroscopic appearance analysis of drill pipes, mechanical-performance testing, scanning electron microscopy, and energy spectrum analysis that holes on the S135 steel drill pipe body were caused by stress-corrosion fatigue. Ref. [7] studied the hydrogen sulfide-stress-corrosion performance of V150 drill pipe materials after different heat treatments based on tensile tests, impact tests, hardness tests, and hydrogen sulfide-stress-corrosion tests. Ref. [8] investigated the stress-corrosion-cracking behavior of G105 drill pipes under different chloride ion environments through slow stress-rate testing and electrochemical experiments. Refs. [9,10] proposed the technical conditions and usage requirements for selecting sulfur-resistant drill pipes in response to the hazards H2S poses to drill pipes. Ref. [11] investigated the effects of temperature, flow velocity, pH value, and CO2/H2S partial-pressure ratio in polymer drilling fluids on the corrosion behavior of high-strength S135 and G105 drill pipes. Ref. [12] studied the stress-corrosion-cracking mechanism and the influencing factors of high-strength drill pipes in acidic environments through hydrogen permeation tests and tensile tests. Ref. [13] provided a detailed review of seven categories of failure causes, metallurgical, and mechanical failures of drill pipes and proposed relevant measures. Ref. [14] investigated the SSCC behavior of G105 and S135 drill pipes in simulated drilling environments containing H2S based on using slow-strain-rate tensile tests. Ref. [15] studied the fatigue life and corrosion-fatigue life of S135 drill pipe steel in air and in simulated marine environments. Ref. [16] investigated the fatigue and corrosion-fatigue behaviors of G105 and S135 drill pipes in air and in H2S-containing drilling fluids with different stress amplitudes. Ref. [17] studied the fatigue-corrosion behaviors of V150 drill pipes under different stress amplitudes in air, drilling fluids, and H2S-containing drilling fluids using rotational-fatigue experiments and numerical methods. Through a series of experimental tests and mechanical simulations, ref. [18] found that the corrosion pits and crack propagation caused by stress concentration on the S135 drill pipe in the case well ultimately led to overload and the ductile fracture of the drill pipe body. Ref. [19] studied the causes of fracture failure of the S135 drill pipe body in a well in Xinjiang based on physical and chemical performance, fracture analysis, heat treatment tests, and finite-element analysis methods.
It can be seen that the current research by related scholars mainly focuses on the stress corrosion and corrosion fatigue of drill pipes in H2S-acidic-drilling-fluid environments, while there is less research on corrosion behaviors and mechanical performance in drilling fluid environments with H2S/CO2 co-existence. When H2S/CO2 co-exist in deep-well drilling, the gas intrusion poses a greater risk of failure of the drill pipe, and its corrosion behavior and mechanical-performance damage are more complicated under complex downhole loads. Therefore, this paper aims to address the corrosion failure problem of drill pipes during on-site drilling operations, and it simulates the CO2/H2S corrosion environment at the wellhead, well-middle, and bottomhole depth after drilling-gas intrusion, and conducts corrosion evaluation and tensile-mechanical-performance evaluation of commonly used S135, G105, and V150 drill pipes by conducting high-temperature and high-pressure constant-load-stress-corrosion experiments, SEM, EDS, and mechanical-performance tests. The mechanical-performance damage and applicability of the three materials in a CO2/H2S-containing drilling fluid-corrosion environment after drilling-gas intrusion, to guide the reasonable selection of drill pipes for deep oil- and gas-well-drilling operations.

2. Materials and Methods

2.1. Experimental Materials and Conditions

When the drill pipe is located at different well depths, the CO2 and H2S gases from drilling-gas intrusion will be dissolved or dispersed in the drilling fluid. At the same time, complex drilling-gas-intrusion accidents take a long time to handle, which will affect the mechanical performance of the drill pipe under the conditions of this gas intrusion into acidic drilling fluid. Furthermore, as the well depth increases the temperature, pressure, CO2 and H2S partial pressure will also increase.
To clarify the impact of drilling fluid containing CO2 and H2S from gas intrusion on the mechanical performance of drill pipes, three well-depth conditions were simulated at the wellhead, middle, and bottomhole, with corresponding temperature, pressure, and CO2 and H2S partial-pressure conditions. According to the actual situation of drilling with gas intrusion in the field, the temperature, pressure, CO2 and H2S partial pressure increase sequentially when set at the wellhead, well-middle, and bottomhole. The detailed experimental conditions are shown in Table 1.
According to the material of the drill pipes used on site, three materials of drill pipe, namely G105, S135, and V150 were used in the experiment. Their chemical compositions are shown in Table 2, which meets the requirements of the API Spec 5D standard for the chemical composition of the drill pipe.
According to the actual field use of drilling fluids, a 1.44 g/cm3 solution of high-temperature-resistant potassium amino poly-sulfonate, which is a drilling fluid system with good lubrication performance, was used in the liquid-phase environment, and its specific chemical components are shown in Table 3.
Referring to the standards ISO 6892-1:2019 “Metallic materials—Tensile test—Part 1: Room temperature test methods” [20] and the standard GB/T 4157-2017 “Laboratory test methods for resistance of metals to SSCC in hydrogen sulfide environments” [21], the drilling pipes were shaped into tensile specimens. Based on the experimental design of the drill pipe material and corrosion conditions (3 materials × 4 pieces × 3 working conditions + 3 materials × 3 blank specimens), a total of 45 pieces of specimens were prepared for processing. During the experiment, 4 parallel specimens were taken from each material and operating condition, with one specimen used for corrosion-product morphology and product component analysis; in addition, three samples were subjected to post-corrosion-tensile-performance testing to obtain the average tensile-performance parameters of each material under each experimental condition, and to ensure the accuracy of the experimental results.
We applied 80% constant-load-tensile stress to three materials based on the ultimate load that the drill pipe can withstand. We assembled the sample into the fixture, tightened the nut as shown in Figure 1a, and prepared the fixture for application of a constant load to the assembled sample; the upper and lower fixtures of the MTS tensile testing machine were respectively clamped at the upper and lower ends of the fixture, as shown in Figure 1b. An 80% constant load was applied, and the computer monitored in real-time the value of the tensile stress. When it reached 80% of the ultimate load, the loading stopped and the constant-load stress testing of the drill pipe was completed.

2.2. Constant-Load-Stress-Corrosion Experiment

The high-temperature and high-pressure vessel used in the experiment is a high-temperature and high-pressure flow cycle corrosion instrument, with a maximum temperature of 250 °C and a maximum pressure of 70 MPa. It can perform the constant-load-stress-corrosion experiments of CO2 and H2S-flow-cycles under high-temperature and high-pressure environments. The schematic diagram of the vessel device is shown in Figure 2.
The specific steps for constant-load-stress-corrosion experiments are as follows:
(1)
Sample washing and dimensional measurement
After cleaning the specimen, degreasing with petroleum ether, and drying with alcohol, we measure the diameter and length of the parallel section of the specimen and record the dimensional parameters.
(2)
Constant-load loading
We apply a constant-load stress of 80% of the yield-strength value to the sample equipped with fixtures using the MTS universal-tensile-testing machine. To obtain the tensile-performance parameters of blank samples without constant-load-stress-corrosion tests, from each material we selected three parallel specimens at room temperature to be used to obtain the yield strength, tensile strength, fracture elongation, and yield-strength ratio of the average value of the tensile-performance parameters in order to reduce the experimental error.
(3)
Constant-load-stress-corrosion test
After the constant load is applied, the sample is placed in a high-temperature and high-pressure reactor, and we add a density of 1.44 g/cm3 of potassium amino poly-sulfonate drilling fluid to submerge the fixture. We then introduce N2 for pressure testing, check the sealing of the reactor body, carry out a deoxygenation operation, warm the system up to the experimental temperature, introduce CO2 and H2S gas, and finally introduce the nitrogen gas to the required experimental pressure. During the experimental period, we use a computer to monitor temperature and pressure in real-time to ensure their stability.
(4)
Observation and analysis of corrosion-product characteristics
After 14 days of temperature reduction and pressure relief sampling, cold-air drying and photography, one uncleaned sample of obvious corrosion characteristics is selected for each material and simulated working conditions. The SEM-morphology and EDS-spectrum analysis of the corrosion products are observed using a ZEISS EVO MA15 scanning electron. After observation, the samples are cleaned and dried with a film-removal solution, and the corrosion-morphology characteristics of the cleaned samples are observed again using a scanning electron microscope; from the remaining three specimens, we select two specimens using the film-removal solution for cleaning and drying. We use an MTS slow-tensile-testing machine to break the two cleaned specimens and pull off one uncleaned specimen, and to obtain the tensile stress–strain curve of three specimens of one material after corrosion under each simulated working condition. The purpose of breaking the uncleaned sample in the experiment is to evaluate the density of the corrosion-product film under different simulation conditions and axial tensions.
(5)
Processing tensile-curve data
Referring to the standard ASTM A370-2019 “Standard Test Methods and Definitions for Mechanical Testing of Steel Products” [22], the residual deformation method is used to determine the stress value at 0.2% strain as the yield strength, the tensile strength is the maximum stress value in the stress–strain curve, and the yield-strength ratio is the ratio of the yield strength to the tensile strength; the fracture elongation is the strain value at which the material fractures.

3. Results

3.1. Analysis of Corrosion-Morphology Characteristics

(1)
Analysis of corrosion-morphology characteristics of G105 material
We use a scanning electron microscopy to observe the G105 drill pipe material in corrosive environments at the wellhead, well-middle, and bottomhole levels, and to conduct SEM-morphology analysis of the corrosion products of the uncleaned sample and the cleaned specimen. The mass fractions of each element are obtained by EDS spectroscopy analysis of the corrosion-product components.
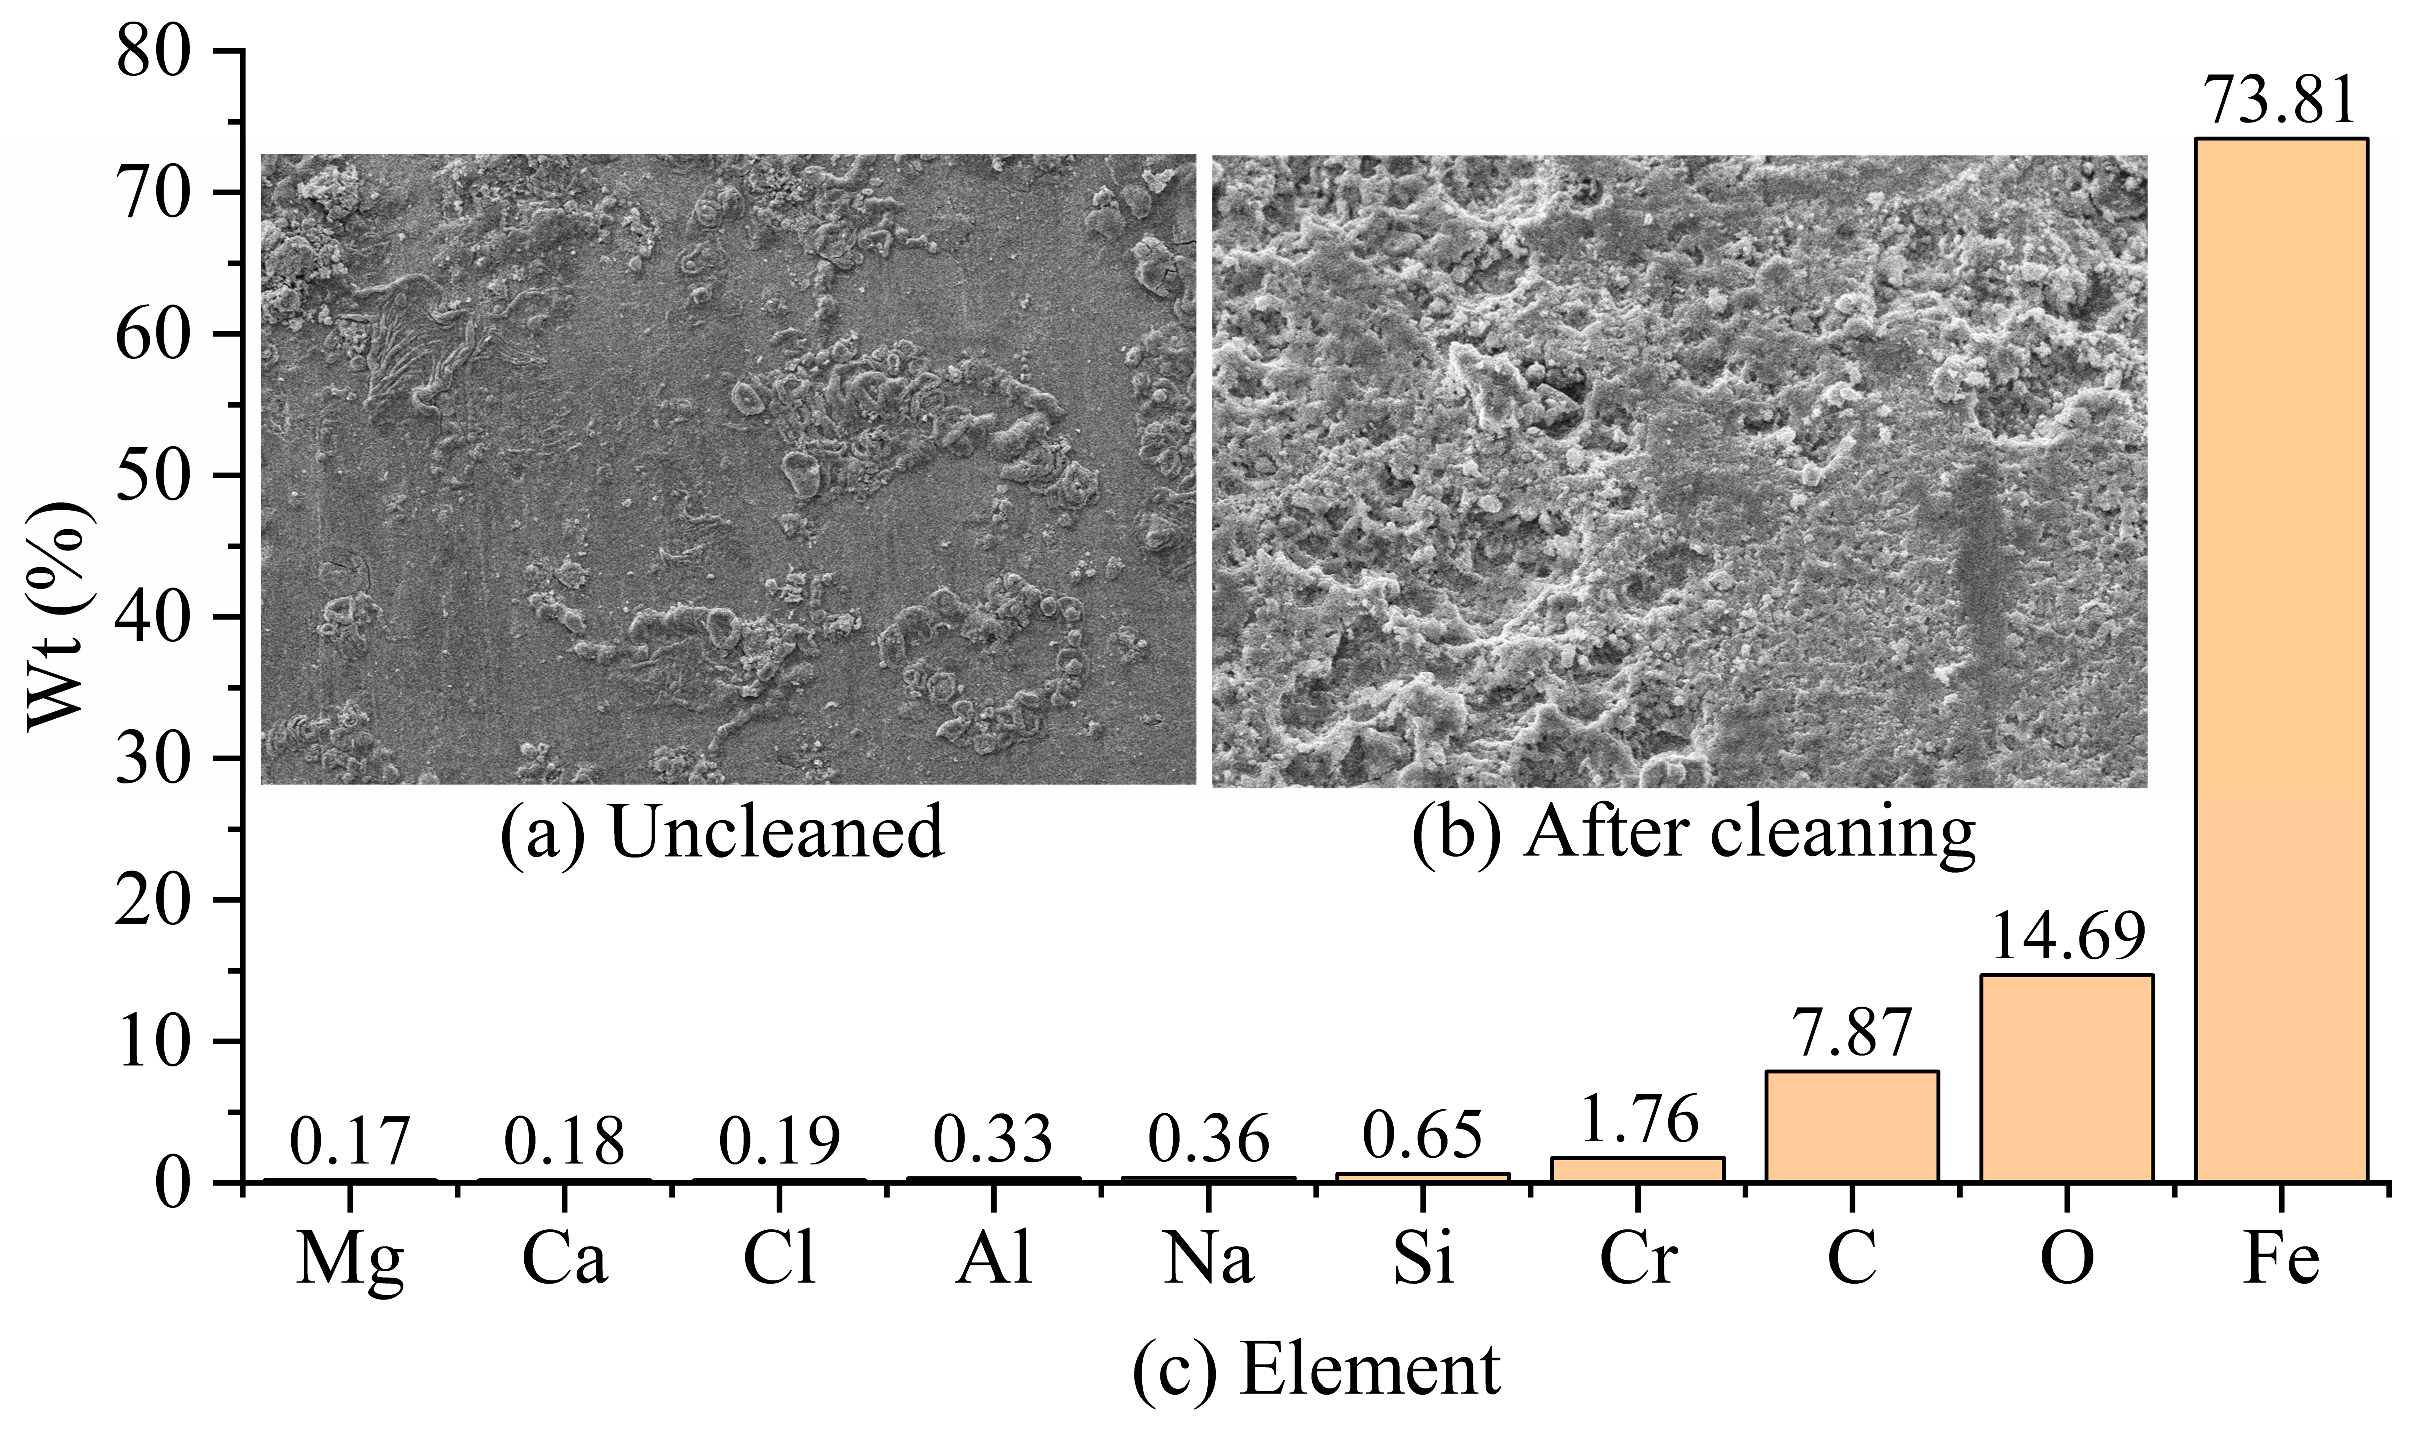
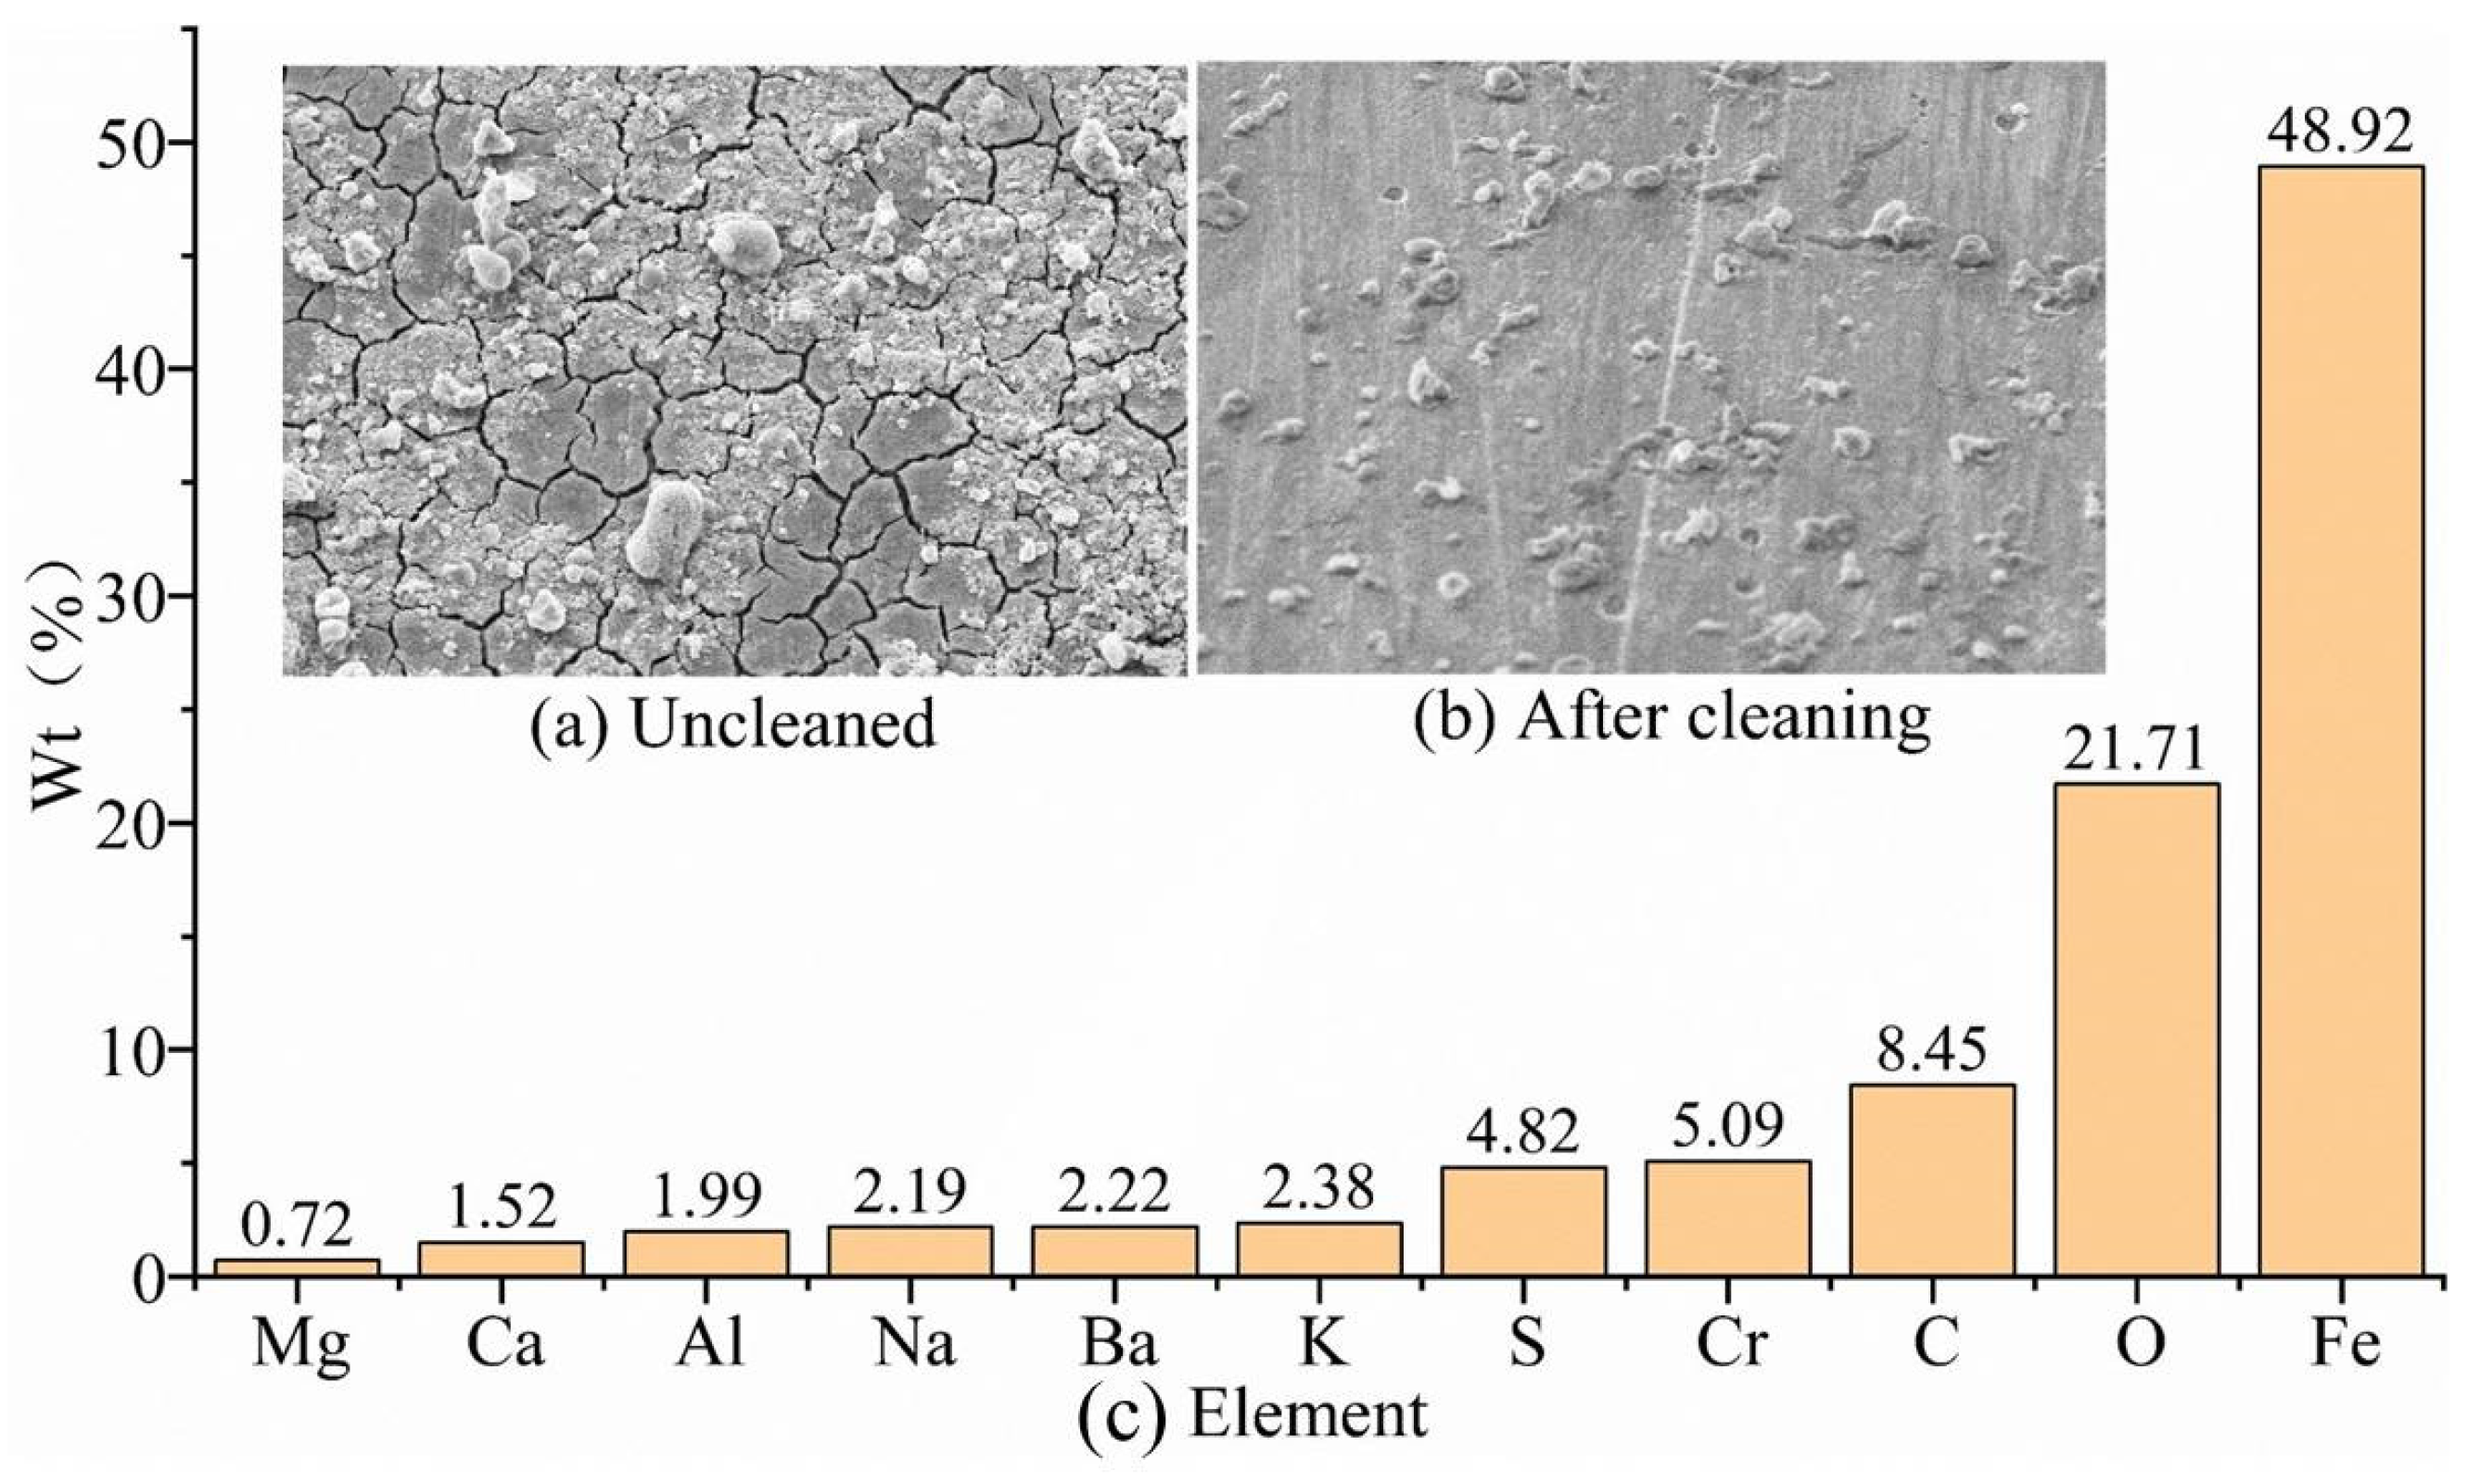
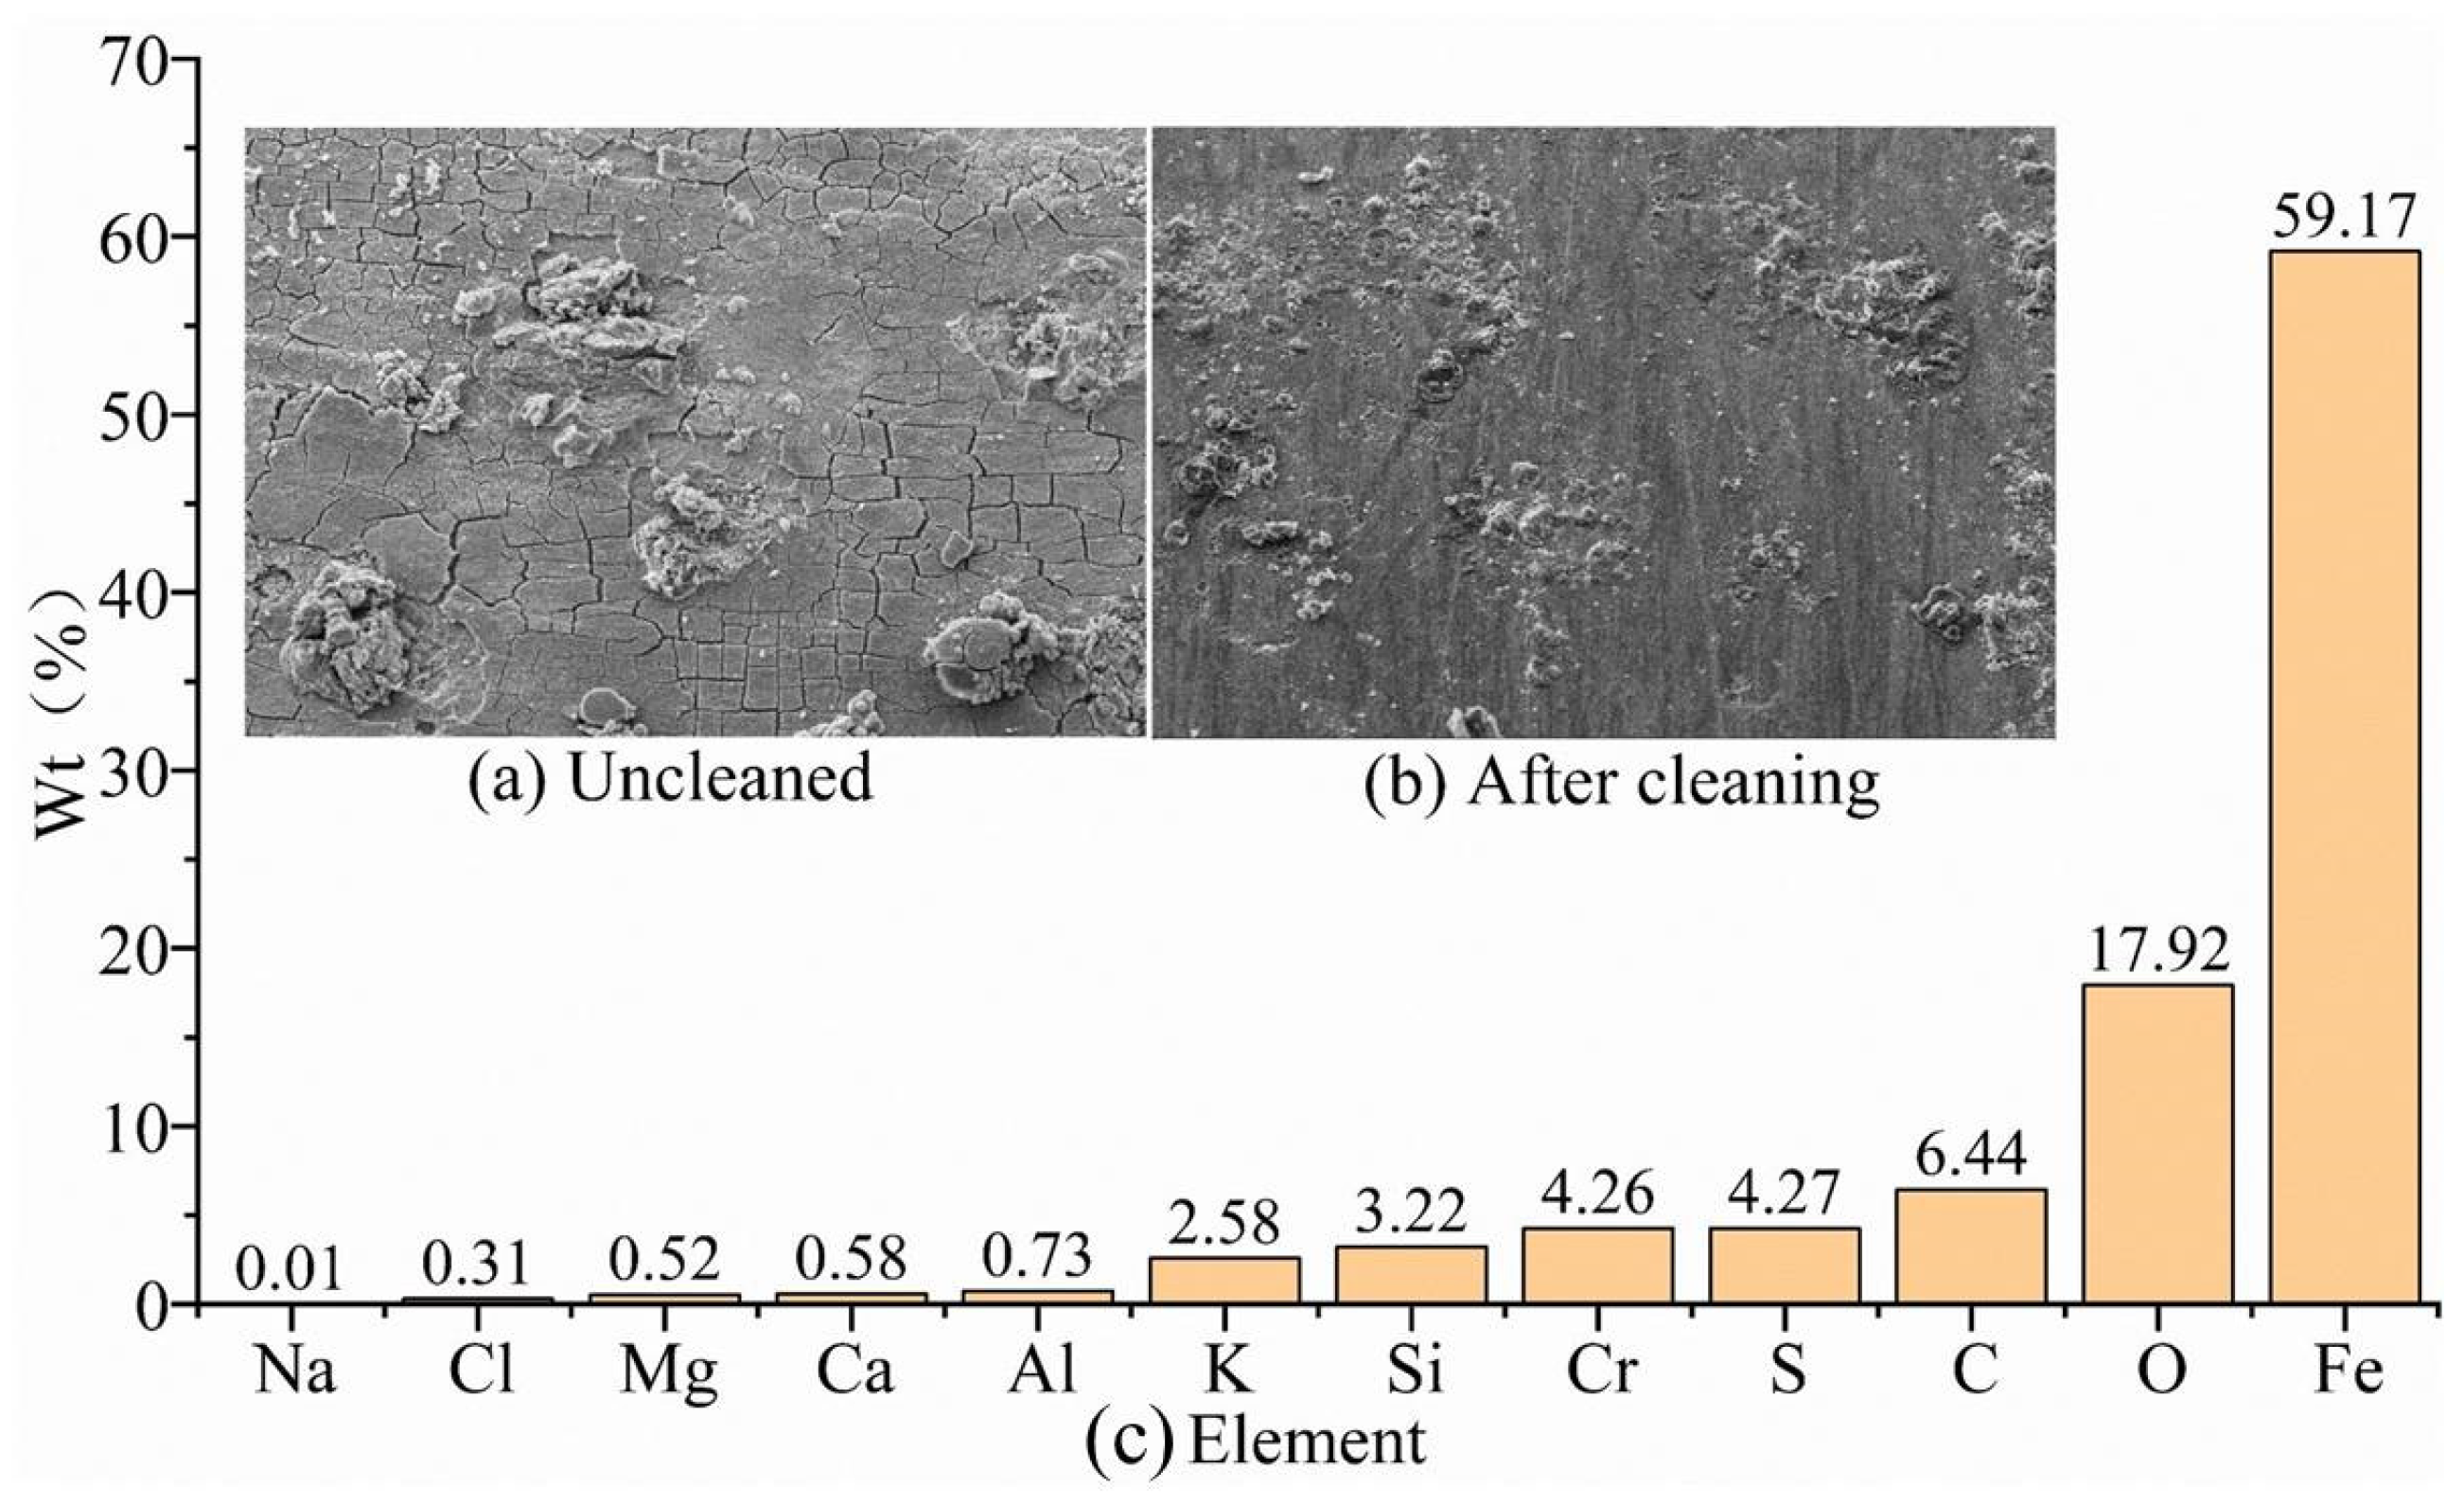
The corrosion-product morphology of the G105-material sample in the simulated wellhead location corrosion environment without cleaning is shown in Figure 3a. It can be seen that the corrosion product is dense and uneven in thickness, with the existence of micro-cracks in local areas. The corrosion morphology of the G105-material specimen after cleaning is shown in Figure 3b, and the sample shows serious uniform corrosion. In addition to the chemical composition of the G105-material drill pipe shown in Table 2, the components of the uncleaned corrosion products are shown in Figure 3c. The main elements of the corrosion products of the G105 material after corrosion are C, O, Fe, and Cr, with a small amount of Si, Na, Al, Cl, Ca, and Mg elements. Fe, Cr, Si, and Al elements come from the metal matrix, while the other elements from the drilling fluid and CO2 gas, mainly resulting from CO2 corrosion. However, due to the lower temperature and pressure at the wellhead, the corrosion products are loose and do not easily form a film, leading to intensified corrosion.
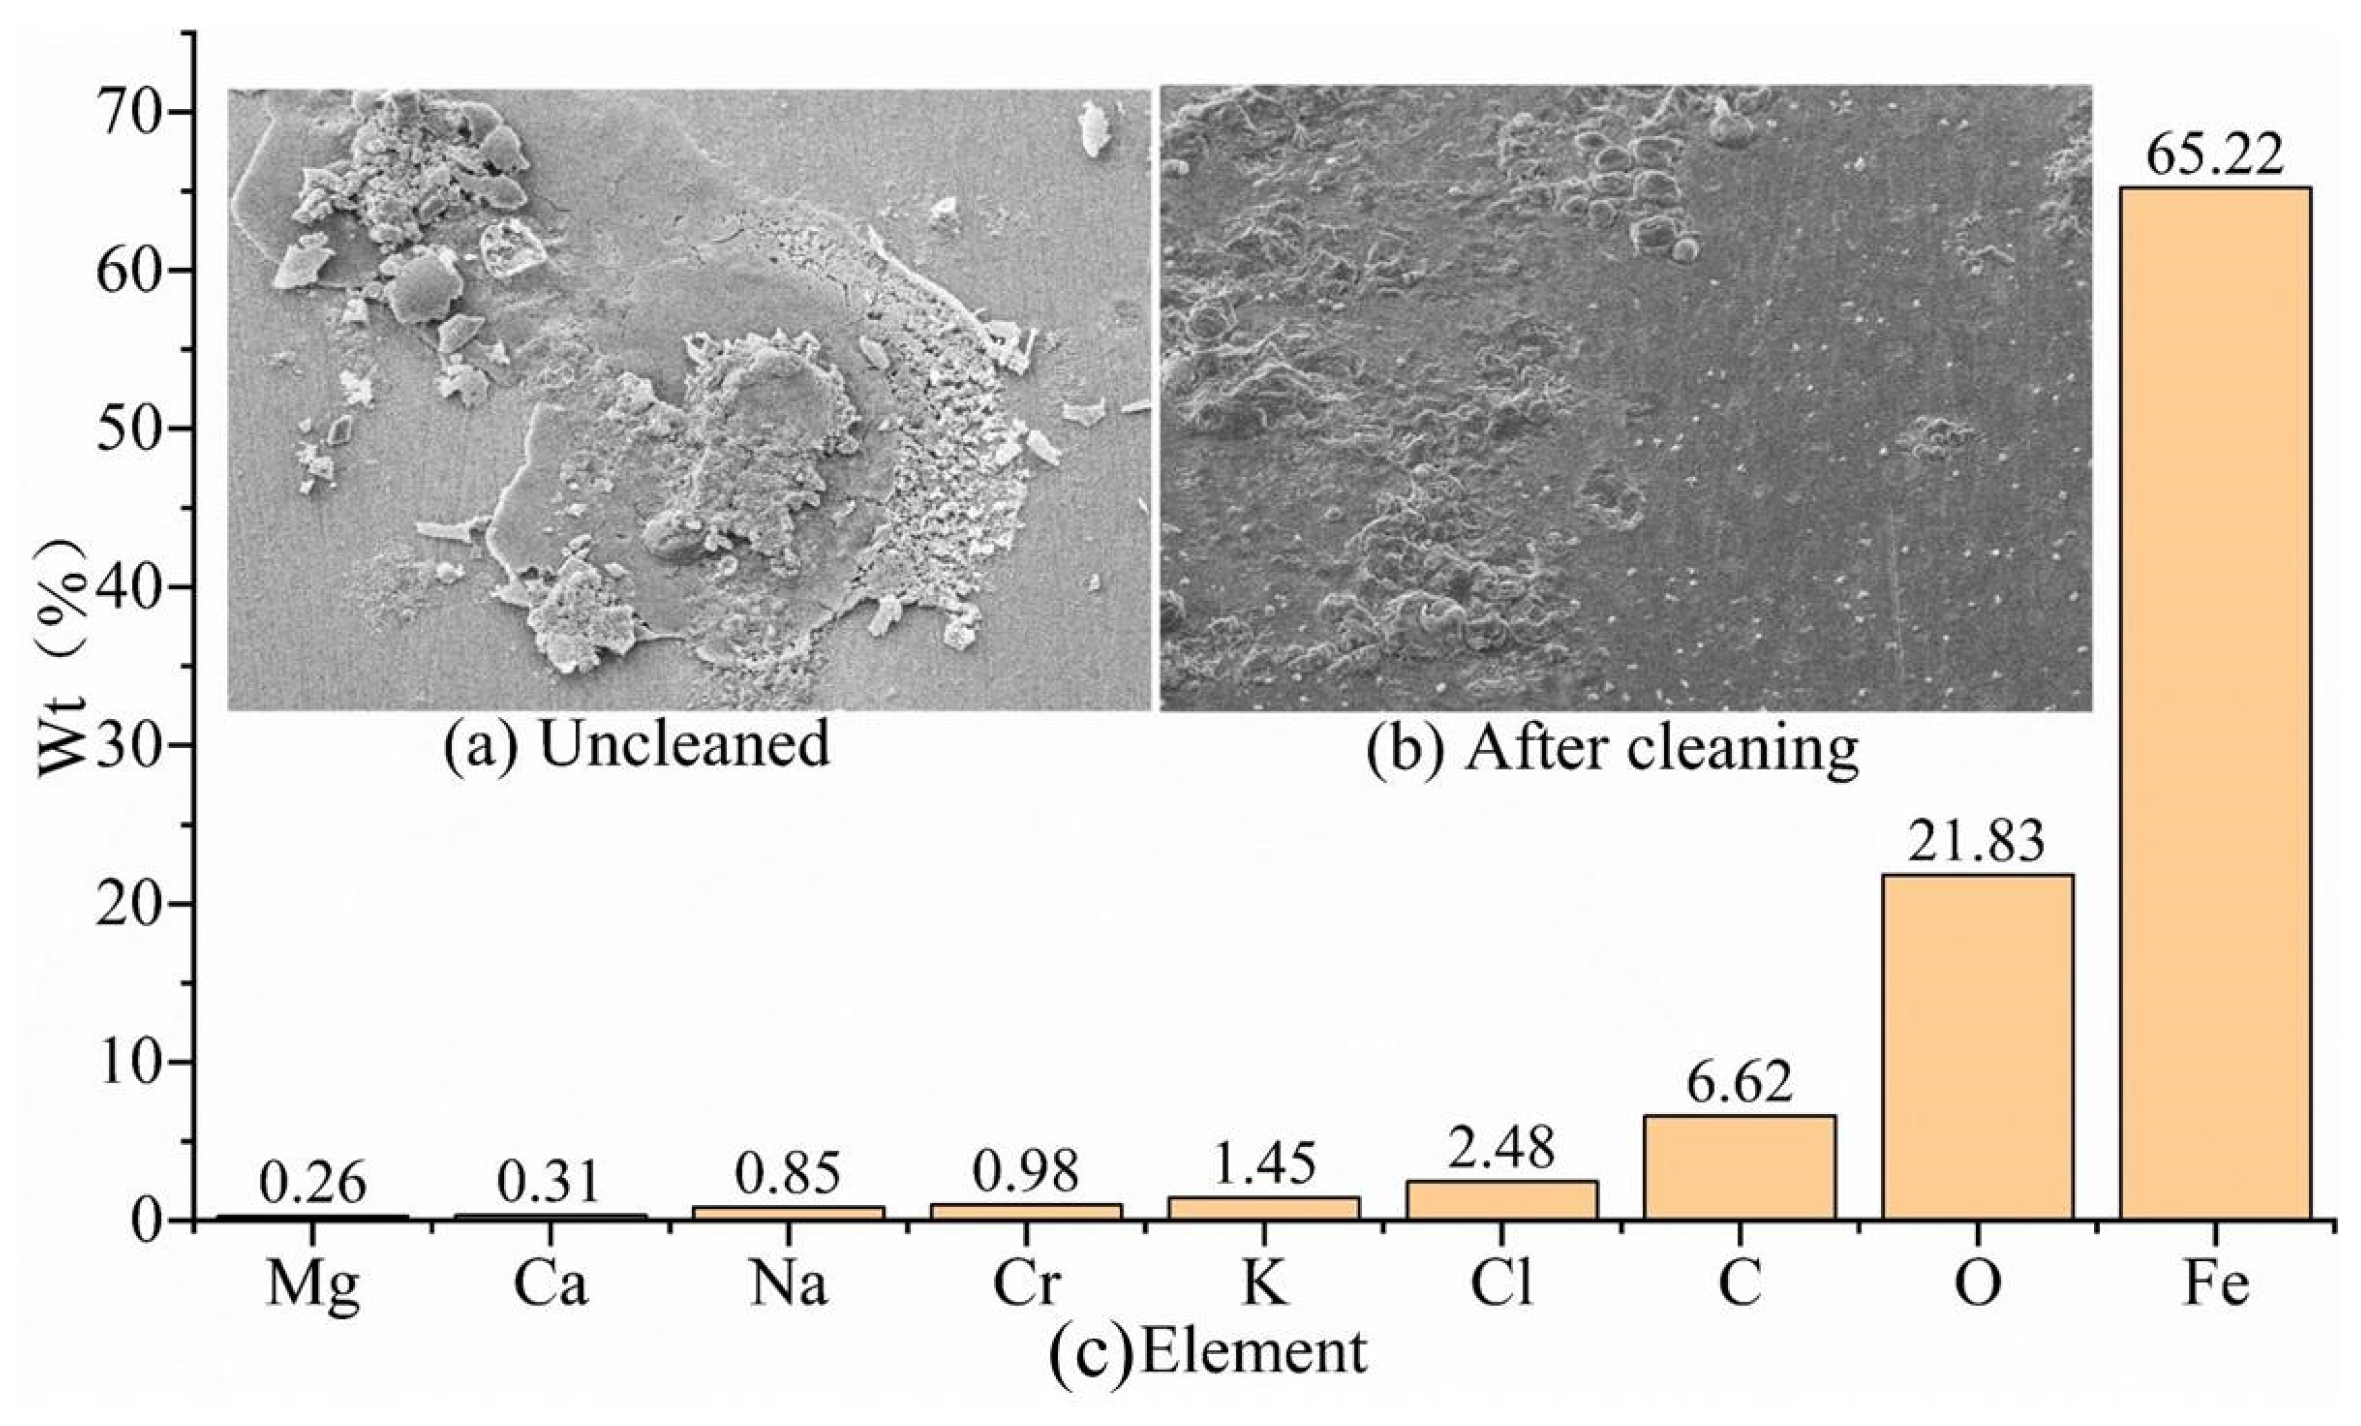
The corrosion morphology of the uncleaned G105-material sample in the simulated well-middle corrosion environment is shown in Figure 4a, with loose and porous corrosion products and locally visible cracks visible. The corrosion morphology of the G105-material specimen after cleaning is shown in Figure 4b, with slight corrosion traces localized on the surface of the sample and with residual drilling fluid adhering. In addition to the chemical composition of the G105 drill pipe shown in Table 2, the components of the uncleaned corrosion products are shown in Figure 4c. The corrosion products of the G105 material mainly contain Fe, O, C, Cl, K, and Cr elements, in addition to a small amount of Cr, Na, Ca, and Mg elements. The Fe and Cr elements come from the metal matrix, and the remaining elements come from drilling fluid and CO2 gas, mainly resulting from CO2 corrosion. Compared with the simulated corrosion environment at the wellhead location, the increase in the mass fraction of Cl in the corrosion environment at the well-middle location promotes the initiation and development of local corrosion.
In the simulated corrosion environment at the bottomhole, the corrosion morphology of the uncleaned G105-material specimen, shown in Figure 5a, the corrosion products show typical turtle-shaped cracks. The reason for this is that after the sample is taken out of the high-temperature and high-pressure reactor, Cr(OH)3 in the corrosion products is easily dehydrated to form Cr2O3 [23]. The corrosion morphology of the G105-material specimen after cleaning is shown in Figure 5b, and a small amount of corrosion products are still locally attached. In addition to the chemical composition of the G105 drill pipe shown in Table 2, the components of the uncleaned corrosion products are shown in Figure 5c. The corrosion products of the G105 material mainly contain Fe, O, C, Cr, S, K, Ba, Na, Al, and Ca elements, in addition to a small amount of Mg element. The Fe, Si, Cr, and Al elements come from the metal substrate, while the other elements come from drilling fluid and CO2/H2S gas, and they are mainly produced by CO2 corrosion and H2S corrosion. Compared to the simulated environment at the wellhead and well-middle, a large number of cations were detected at the bottomhole, indicating an increase in the electrical conductivity of the simulated drilling fluid. The highly active Cr element will passivate to produce relatively dense Cr(OH)3 films in CO2-corrosion environments [24]. The mass fraction of Cr at the bottom of the well is the highest, and the cracking phenomenon of the corrosion products also proves that it forms a relatively dense Cr(OH)3 film at the bottomhole, which can effectively block the ions from contacting the metal substrate.
(2)
Analysis of corrosion-morphology characteristics of S135 material
We use scanning electron microscopy to observe the S135 drill pipe material in corrosive environments in the wellhead, well-middle, and bottomhole simulated environments, and we conduct SEM-morphology analysis of the corrosion products of the uncleaned sample and the cleaned sample. The mass fraction of each element is obtained through EDS-energy-spectrum analysis of the corrosion-product components.
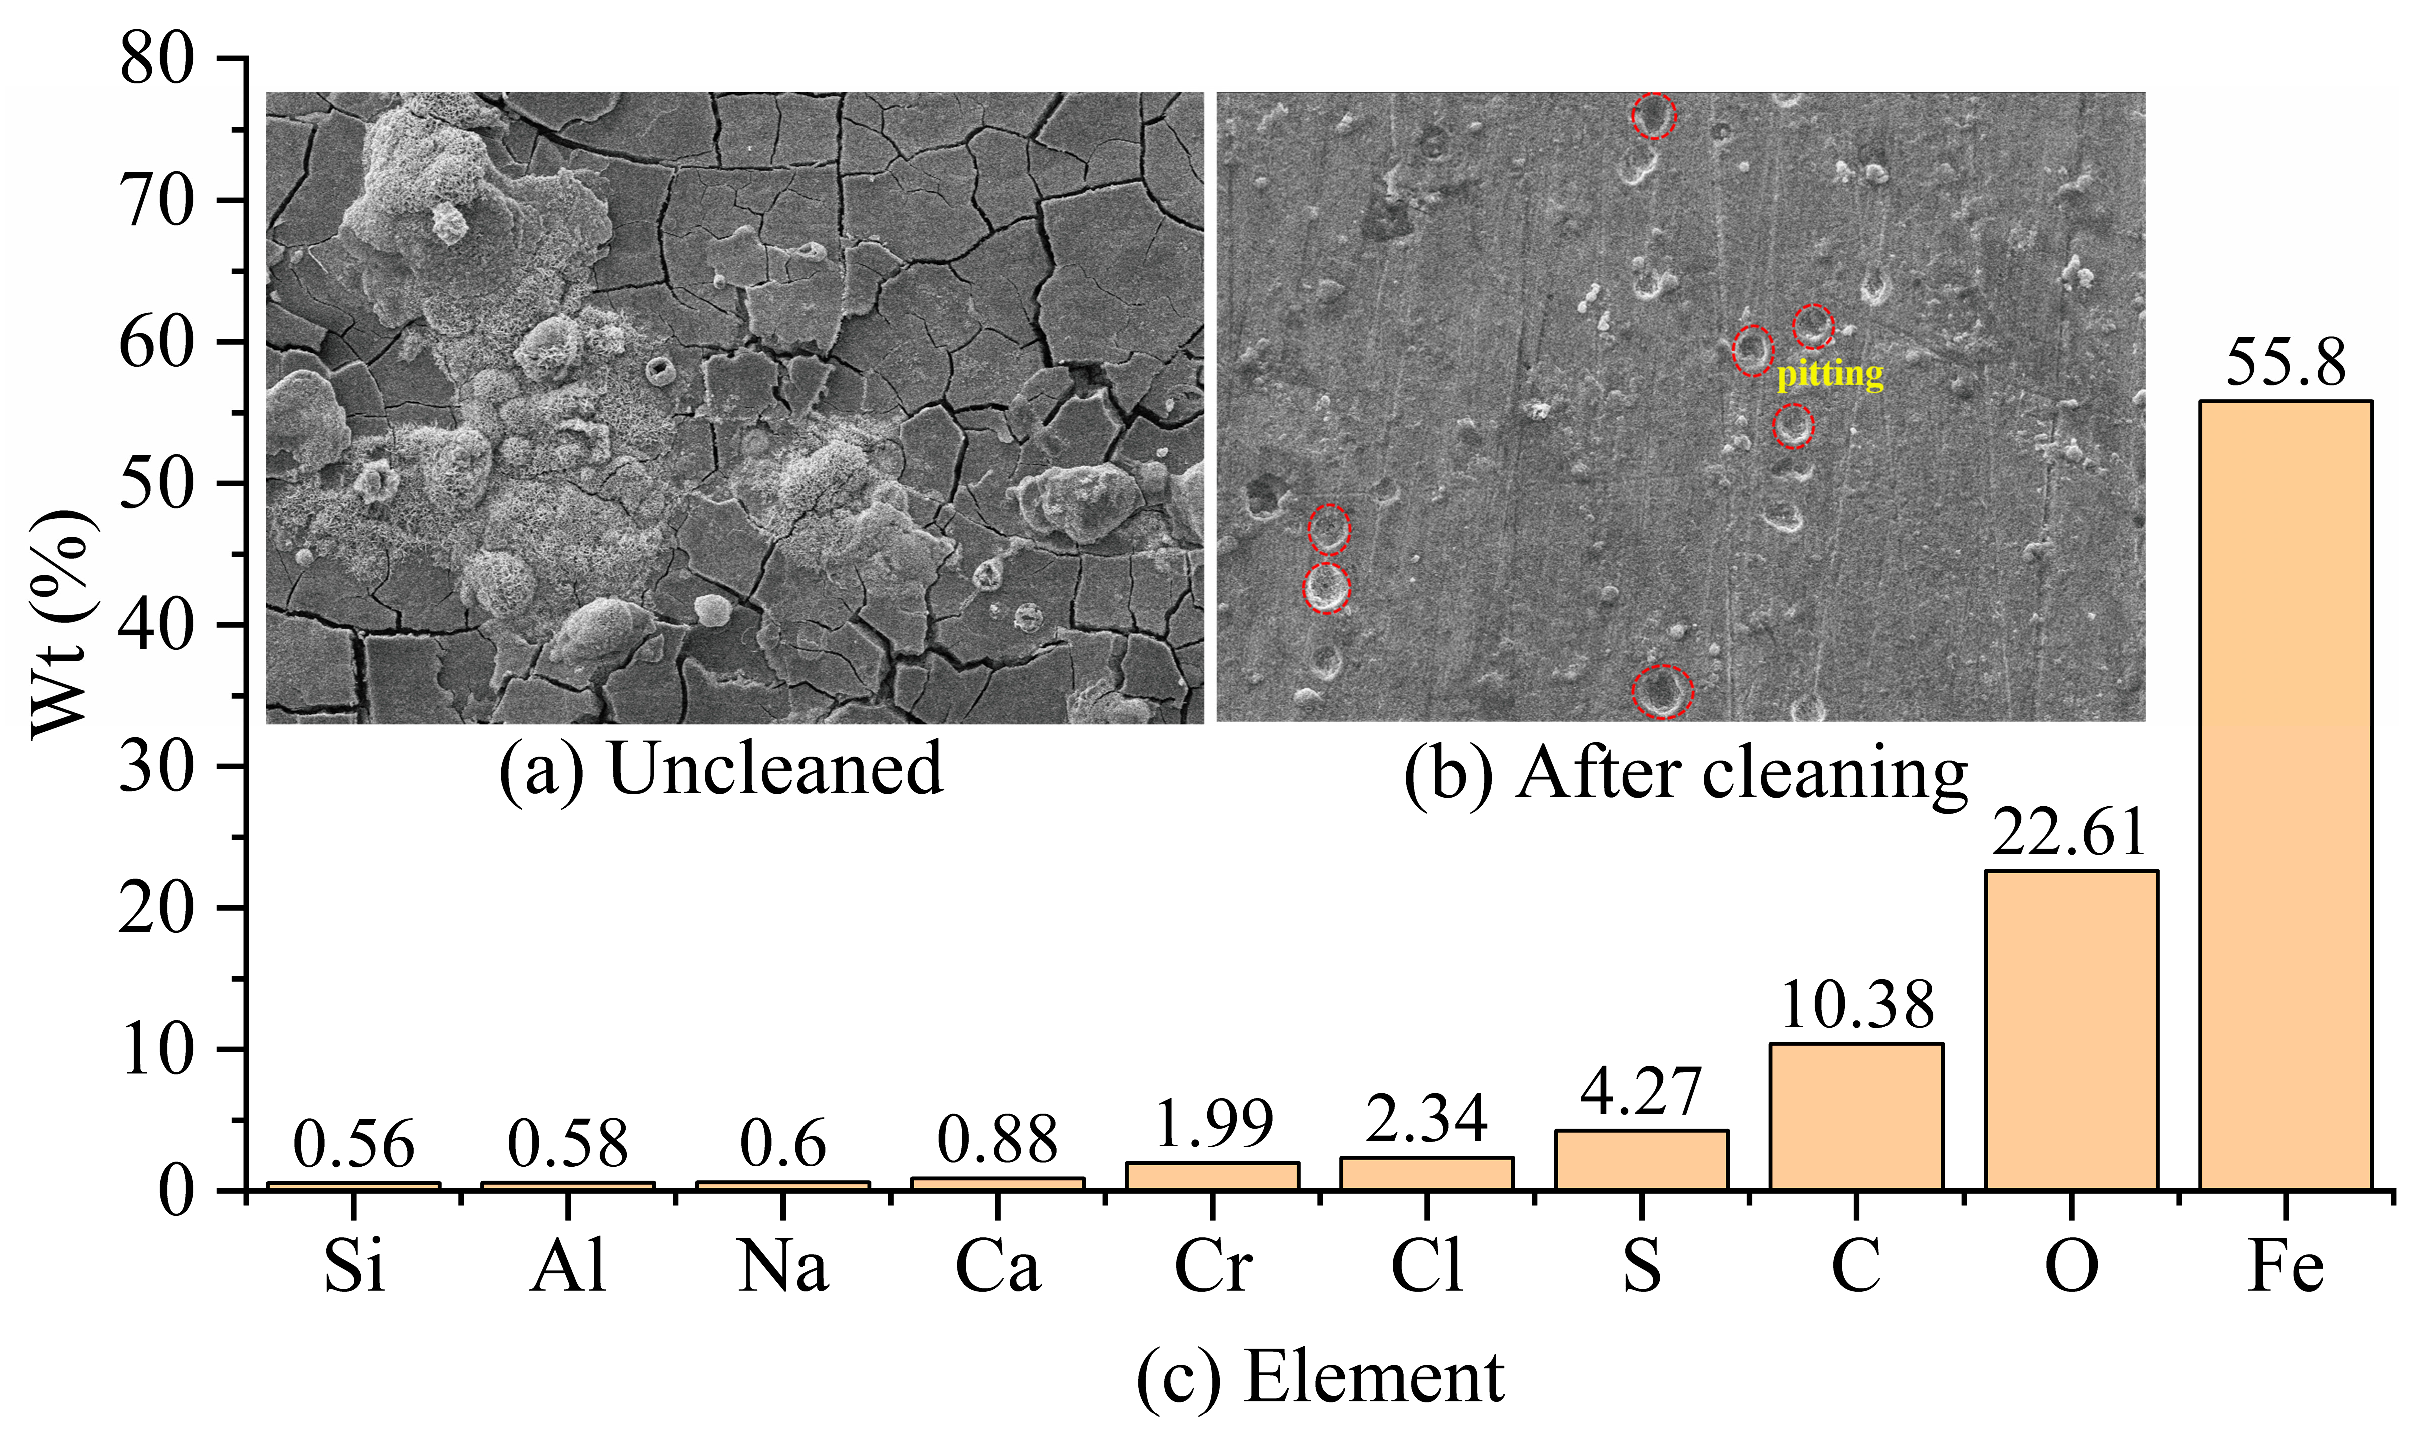
The corrosion morphology of the S135 material in the simulated wellhead-corrosion environment without cleaning is shown in Figure 6a. It can be seen that the corrosion products present large-sized cracks, with local areas appearing in the shape of hairy balls. The corrosion morphology of the S135-material specimen after cleaning is shown in Figure 6b, with clearly visible but sparsely distributed pitting. In addition to the chemical composition of the S135-material drill pipe shown in Table 2, the components of the uncleaned corrosion products are shown in Figure 6c. The corrosion products mainly contain Fe, O, C, S, Cl, and Cr elements, in addition to a small amount of Ca, Na, Al, and Si elements. Fe, Cr, and Al elements come from the S135 material, while the other elements come from the drilling fluid and the CO2/H2S gas. The S135 material is mainly corroded by CO2 accompanied by H2S at the wellhead, and the effect of Cl intensifies the occurrence of pitting corrosion.
The corrosion morphology of the S135 material from the simulated well-middle location corrosion environment and without cleaning is shown in Figure 7a, with loose corrosion products, local accumulation, and uneven thickness. The corrosion morphology of the S135-material specimens after cleaning is shown in Figure 7b, with corrosion pits of varying size scattered throughout the sample. In addition to the chemical composition of the S135-material drill pipe shown in Table 2, the components of the uncleaned corrosion products are shown in Figure 7c. The corrosion products of the S135 material mainly contain Fe, O, C, Si, Ba, Al, Na, Ca, K, and Mg elements, in addition to a small amount of S and Cr elements. The Fe, Si, Al, and Cr elements are from the S135 material, while the other elements are from the drilling fluid and the CO2/H2S gas. The S135 material in the well-middle is mainly corroded by CO2 and slightly corroded by H2S. When the types and contents of elements are detected as increasing, the conductivity of the solution increases, exacerbating the corrosion of the S135 material’s metal matrix. Compared with the wellhead, a large number of S135-material components and drilling fluid components were detected with corrosion products in the well-middle, with the lowest content of Cr proving that there is more serious corrosion under this working condition.
The corrosion morphology of the S135 material from the simulated bottomhole corrosive environment without cleaning is shown in Figure 8a. The corrosion products are densely cracked and there is also a small amount of residual drilling fluid attached to the surface. The corrosion morphology of the S135 material after cleaning is shown in Figure 8b, and there are still corrosion products attached to the surface of the sample, with an obvious pitting phenomenon visible locally. In addition to the chemical composition of the S135-material drill pipe shown in Table 2, the components of the uncleaned corrosion products are shown in Figure 8c. The corrosion products of the S135 material mainly contain Fe, O, S, C, Si, Cr, K, and Na elements, in addition to a small amount of Ca, Al, Mg, and Cl elements. The elements Fe, Si, Cr, and Al come from the metal substrate, while the other elements come from drilling fluid and CO2/H2S gas, mainly causing CO2 corrosion and H2S corrosion. Compared with the wellhead and well-middle positions, the S135 material exhibits more serious H2S corrosion at the bottomhole.
(3)
Analysis of corrosion-morphology characteristics of V150 material
We use scanning electron microscopy to observe the V150 drill pipe material in corrosive environments at the wellhead, well-middle, and bottomhole, and conduct SEM-morphology analysis of the corrosion products of the uncleaned sample and the cleaned sample. The mass fraction of each element is obtained through EDS-energy-spectrum analysis of the corrosion-product components.
The corrosion morphology of the uncleaned V150-material specimen in a simulated wellhead-corrosion environment is shown in Figure 9a, with accumulation of the corrosion products and uneven thickness visible. The corrosion morphology of the V150-material specimen after cleaning is shown in Figure 9b, with a large number of corrosion products still adhering and slight pitting corrosion observed. In addition to the chemical composition of the V150 drill pipe shown in Table 2, the uncleaned corrosion products are shown in Figure 9c. The corrosion products of the V150 material mainly contain Fe, O, and C elements, with very little content from other elements. Fe and a small amount of Cr coming from the metal matrix, while the other elements are from drilling fluids and CO2/H2S gas, mainly resulting in CO2 corrosion.
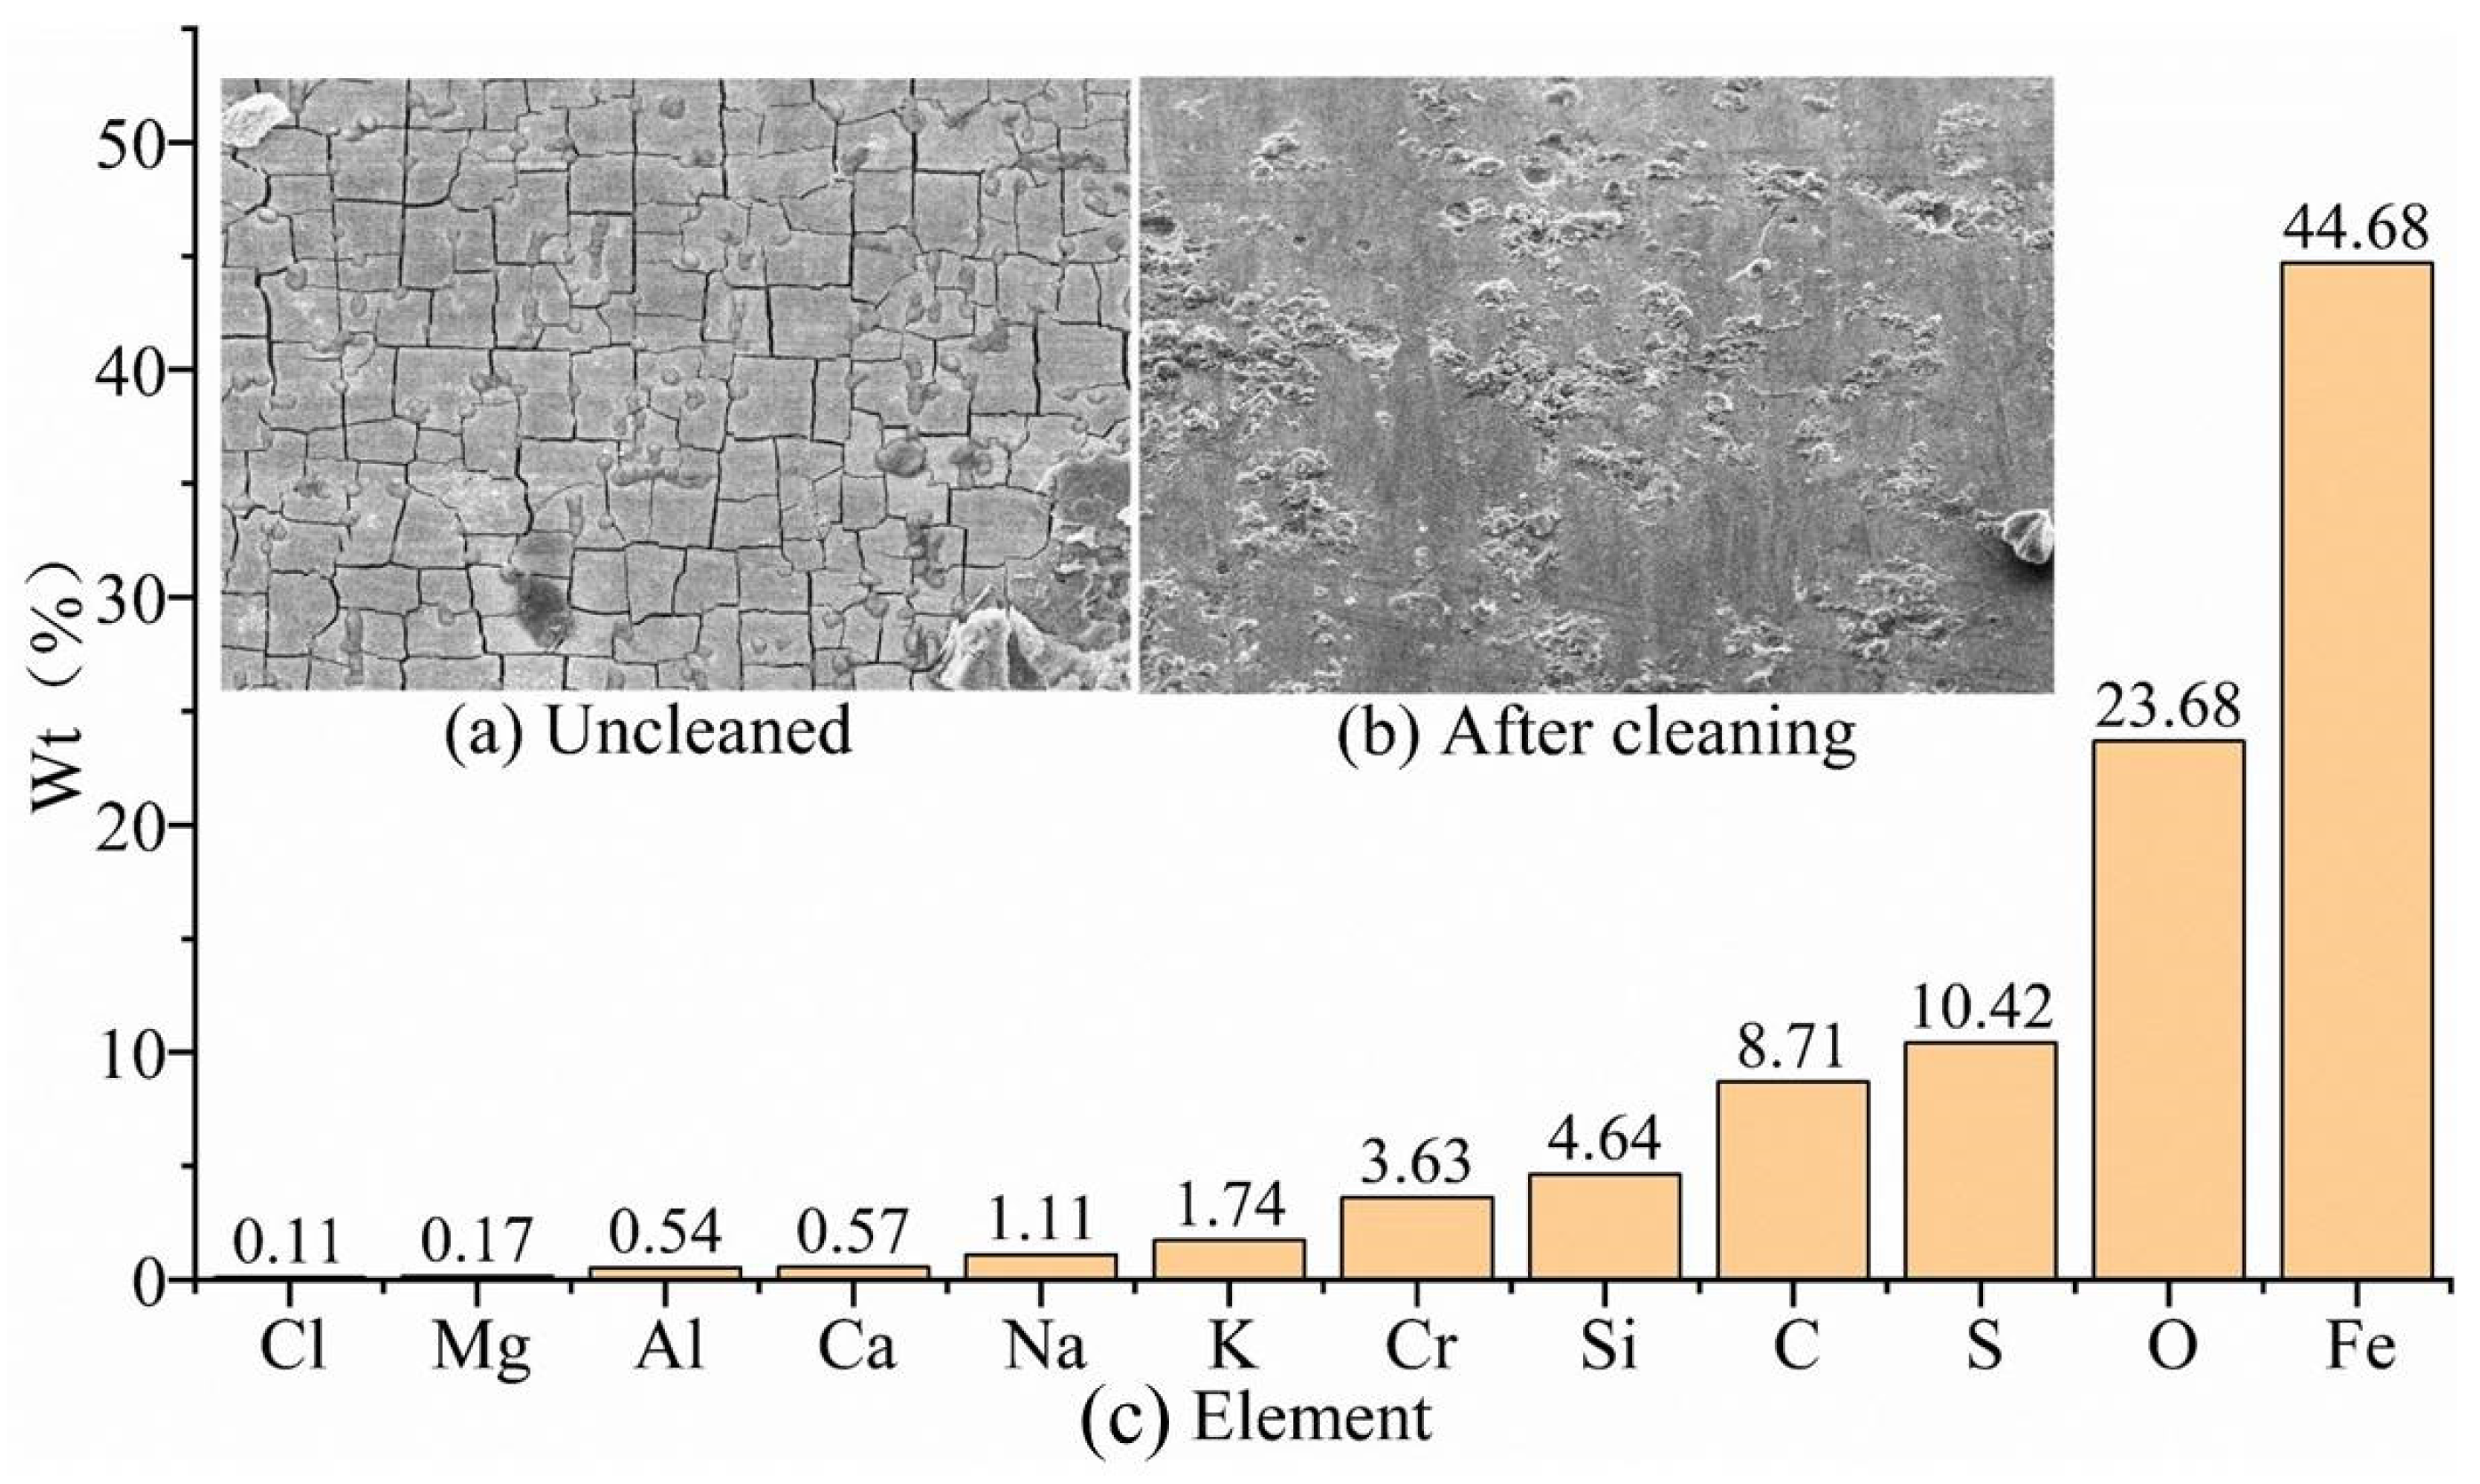
The corrosion morphology of the V150 material in a simulated wellhead-corrosion environment is shown in Figure 10a, with locally visible large-sized cracks in the corrosion products. The corrosion morphology of the V150-material specimen after cleaning is shown in Figure 10b, and obvious homogeneous corrosion traces can be seen on the sample. In addition to the chemical composition of V150 drill pipe shown in Table 2, the components of the uncleaned corrosion products are shown in Figure 10c. In the simulated well-middle-location corrosion environment, the corrosion products of the V150 material mainly contain Fe, O, S, C, Cr, Na, K, Si, Ca, and Al elements, in addition to a small amount of Mg elements. Fe, Cr, Si, and Al elements come from the metal matrix, while the other elements come from the drilling fluid and CO2/H2S gas. CO2 corrosion and H2S corrosion co-exist. A large amount of Cr was detected and the corrosion products were in a cracked state, indicating that there is a dense Cr(OH)3 film that has formed on the surface of the metal matrix, which can slow down corrosion. Compared with the wellhead simulation, in the V150 material we detected a large number of S elements in the well-middle simulation, resulting in severe H2S corrosion and an increase in Cr content.
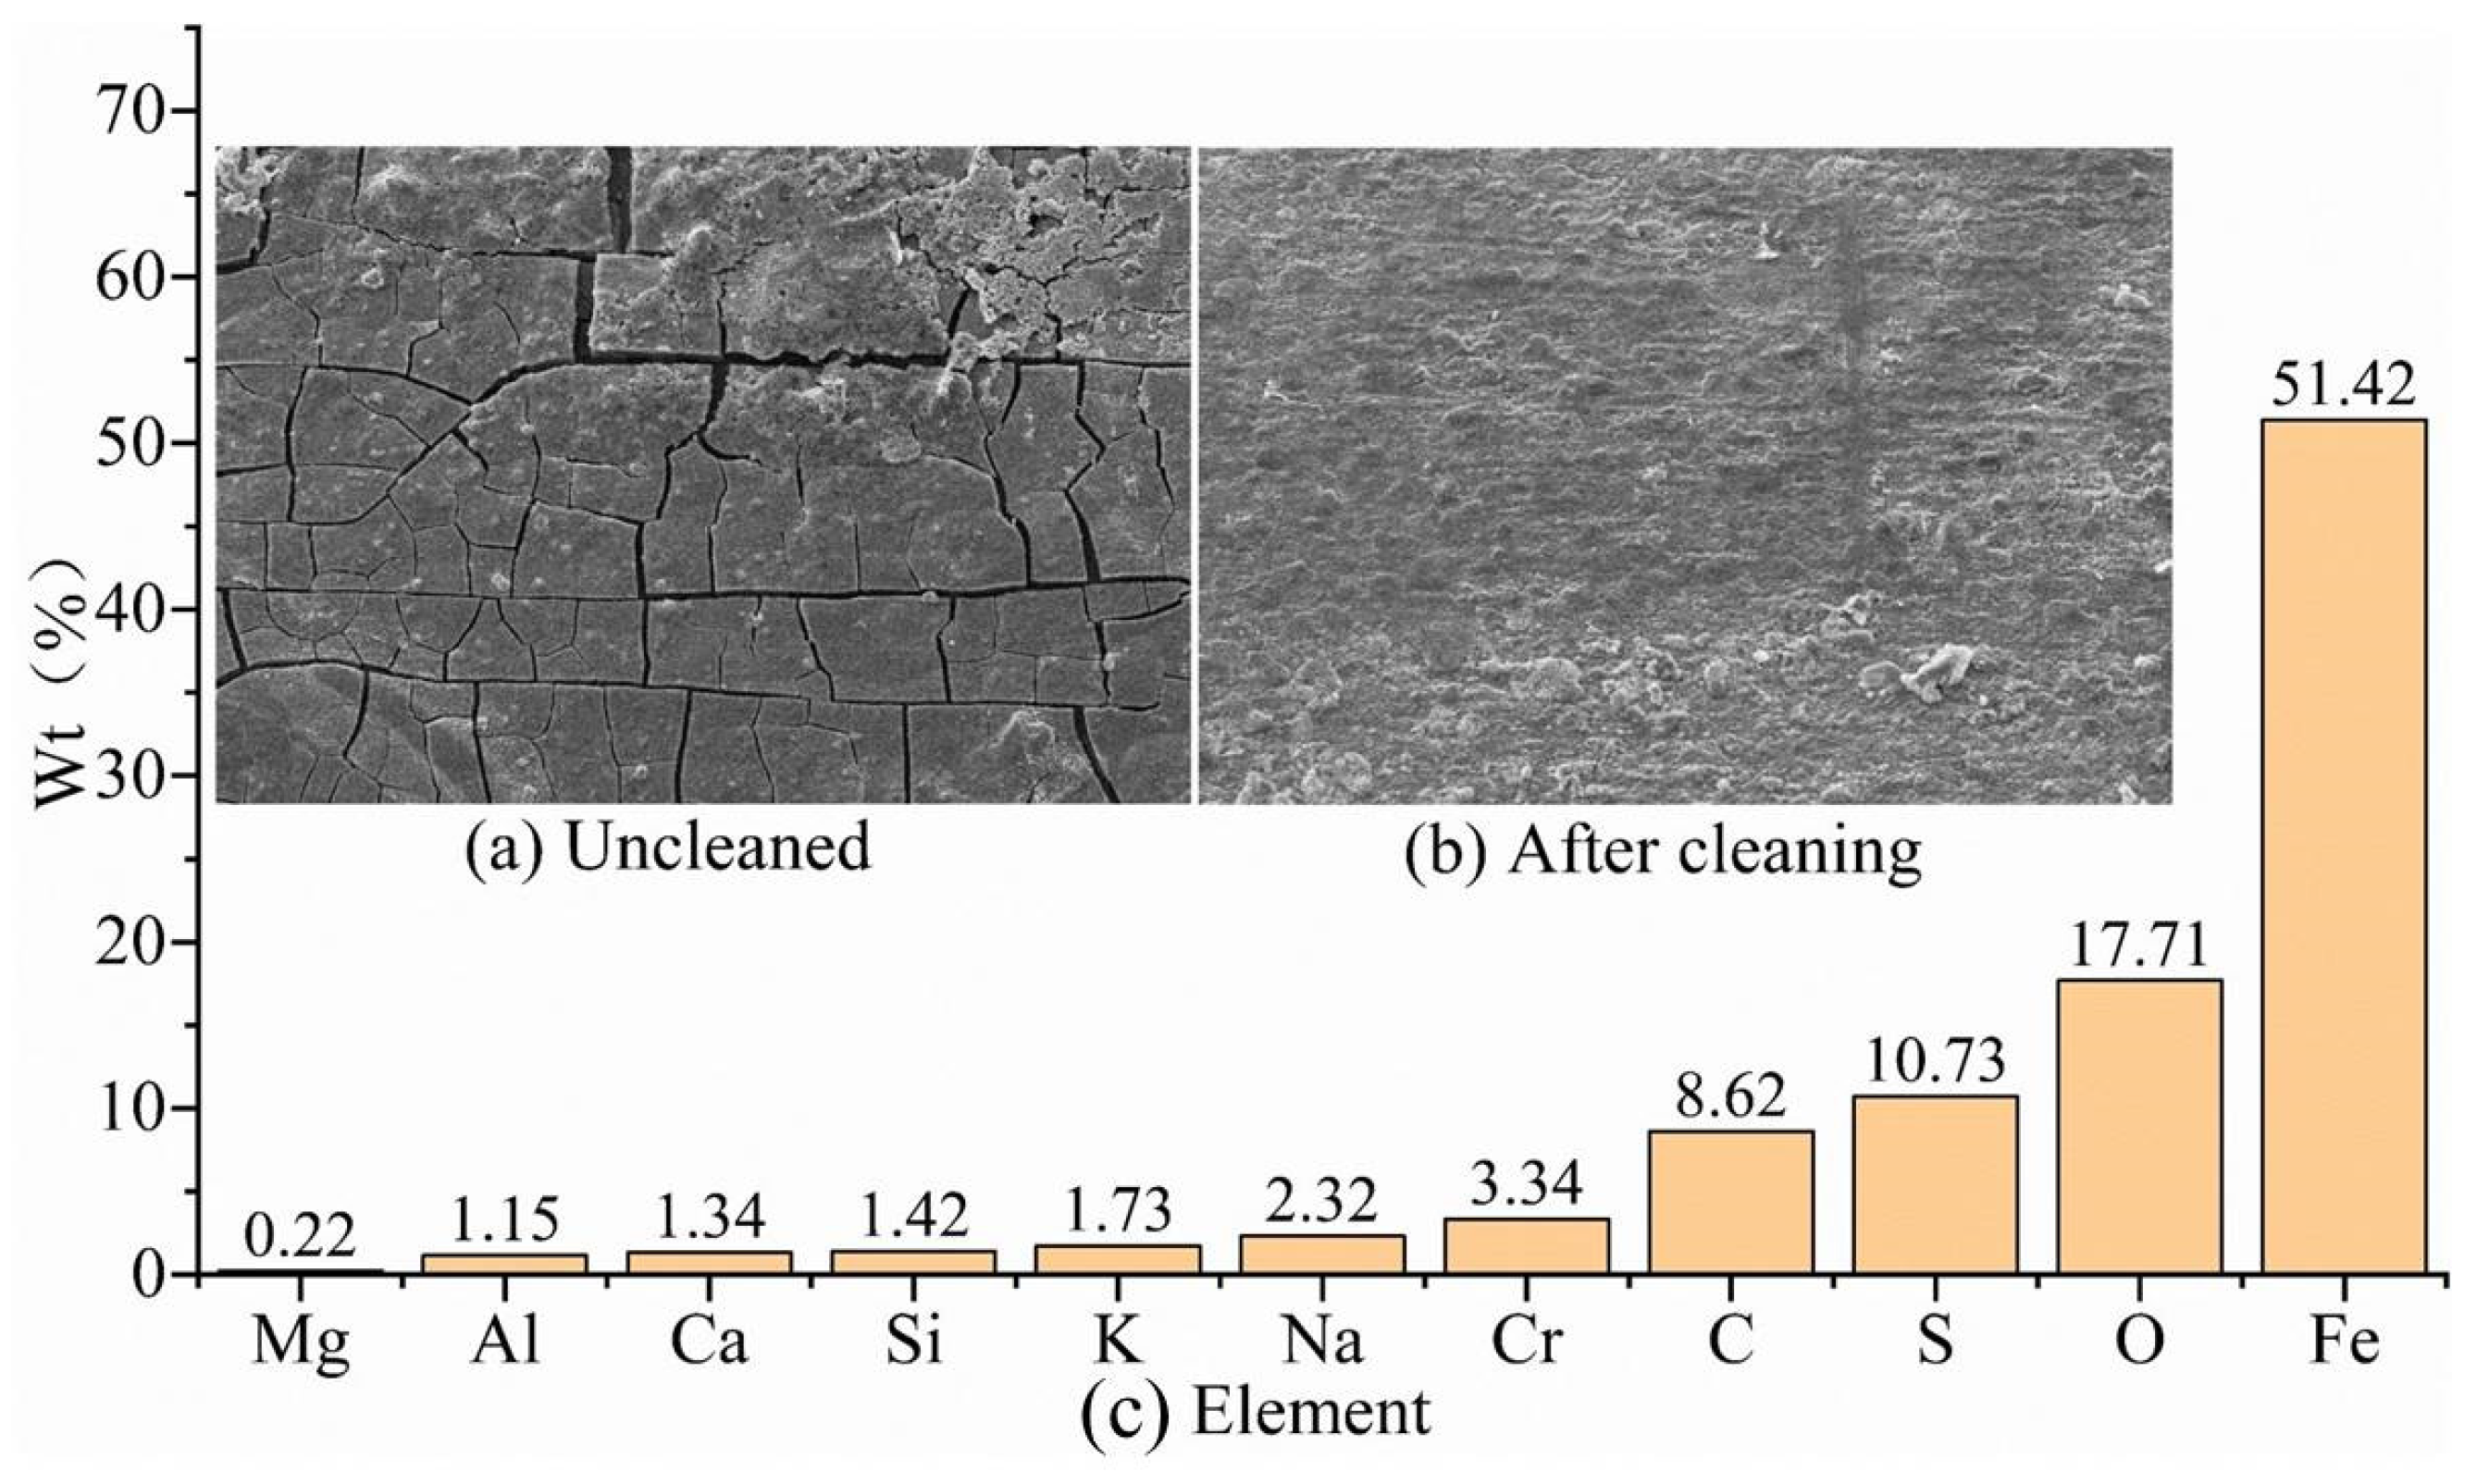
The corrosion morphology of the uncleaned V150 material in a simulated bottomhole corrosion environment is shown in Figure 11a. The corrosion products are ruptured and uneven in thickness, with local accumulation of products. The corrosion morphology of the V150 material specimen after cleaning is shown in Figure 11b, and there is no obvious corrosion phenomenon with local residual corrosion products. In addition to the chemical composition of the V150-material drill pipe shown in Table 2, the components of the uncleaned corrosion products are shown in Figure 11c. The corrosion products of the V150 material mainly contain Fe, O, C, S, Cr, Si, and K elements, in addition to a small amount of Al, Ca, Mg, Cl, and Na elements. Fe, Cr, Si, and a small amount of Al elements come from the metal matrix, while the other elements come from drilling fluid and CO2/H2S gas. CO2 corrosion and H2S corrosion co-exist; a large number of Cr elements were detected and the corrosion products were cracked, indicating that a dense Cr(OH)3 film can slow down the corrosion of the metal matrix. Compared with the wellhead and well-middle, the types of corrosion-product elements in the bottomhole simulation have increased, but their content has decreased compared to the well-middle.
According to SEM of corrosion products and EDS and SEM of corrosion morphology after cleaning, it can be concluded that CO2 corrosion mainly occurs in the V150 drill pipe material under the three corrosion-simulation conditions of the wellhead, well-middle, and bottomhole locations. H2S corrosion is most severe in the V150 drill pipe material in the well-middle. From the wellhead to the bottomhole, the content of Cr in the corrosion products are constantly increasing, indicating that the protective effect of Cr(OH)3 film on the metal substrate is continuously increasing. Only slight CO2 corrosion occurred at the wellhead. CO2 and H2S corrosion co-exist in the well-middle, indicating a clear uniform-corrosion phenomenon. The types and contents of corrosion-product elements increase, and the solution conductivity increases, prompting the rapid formation of a dense Cr(OH)3 film by the Cr element, effectively impeding the contact of corrosive media with the metal substrate that intensifies corrosion. Although CO2 and H2S corrosion co-exist at the bottomhole, the presence of a dense Cr(OH)3 protection film can hinder the contact of the corrosive medium with the metal matrix, so the V150 material has slight corrosion at the bottomhole.

3.2. Analysis of Mechanical Performance
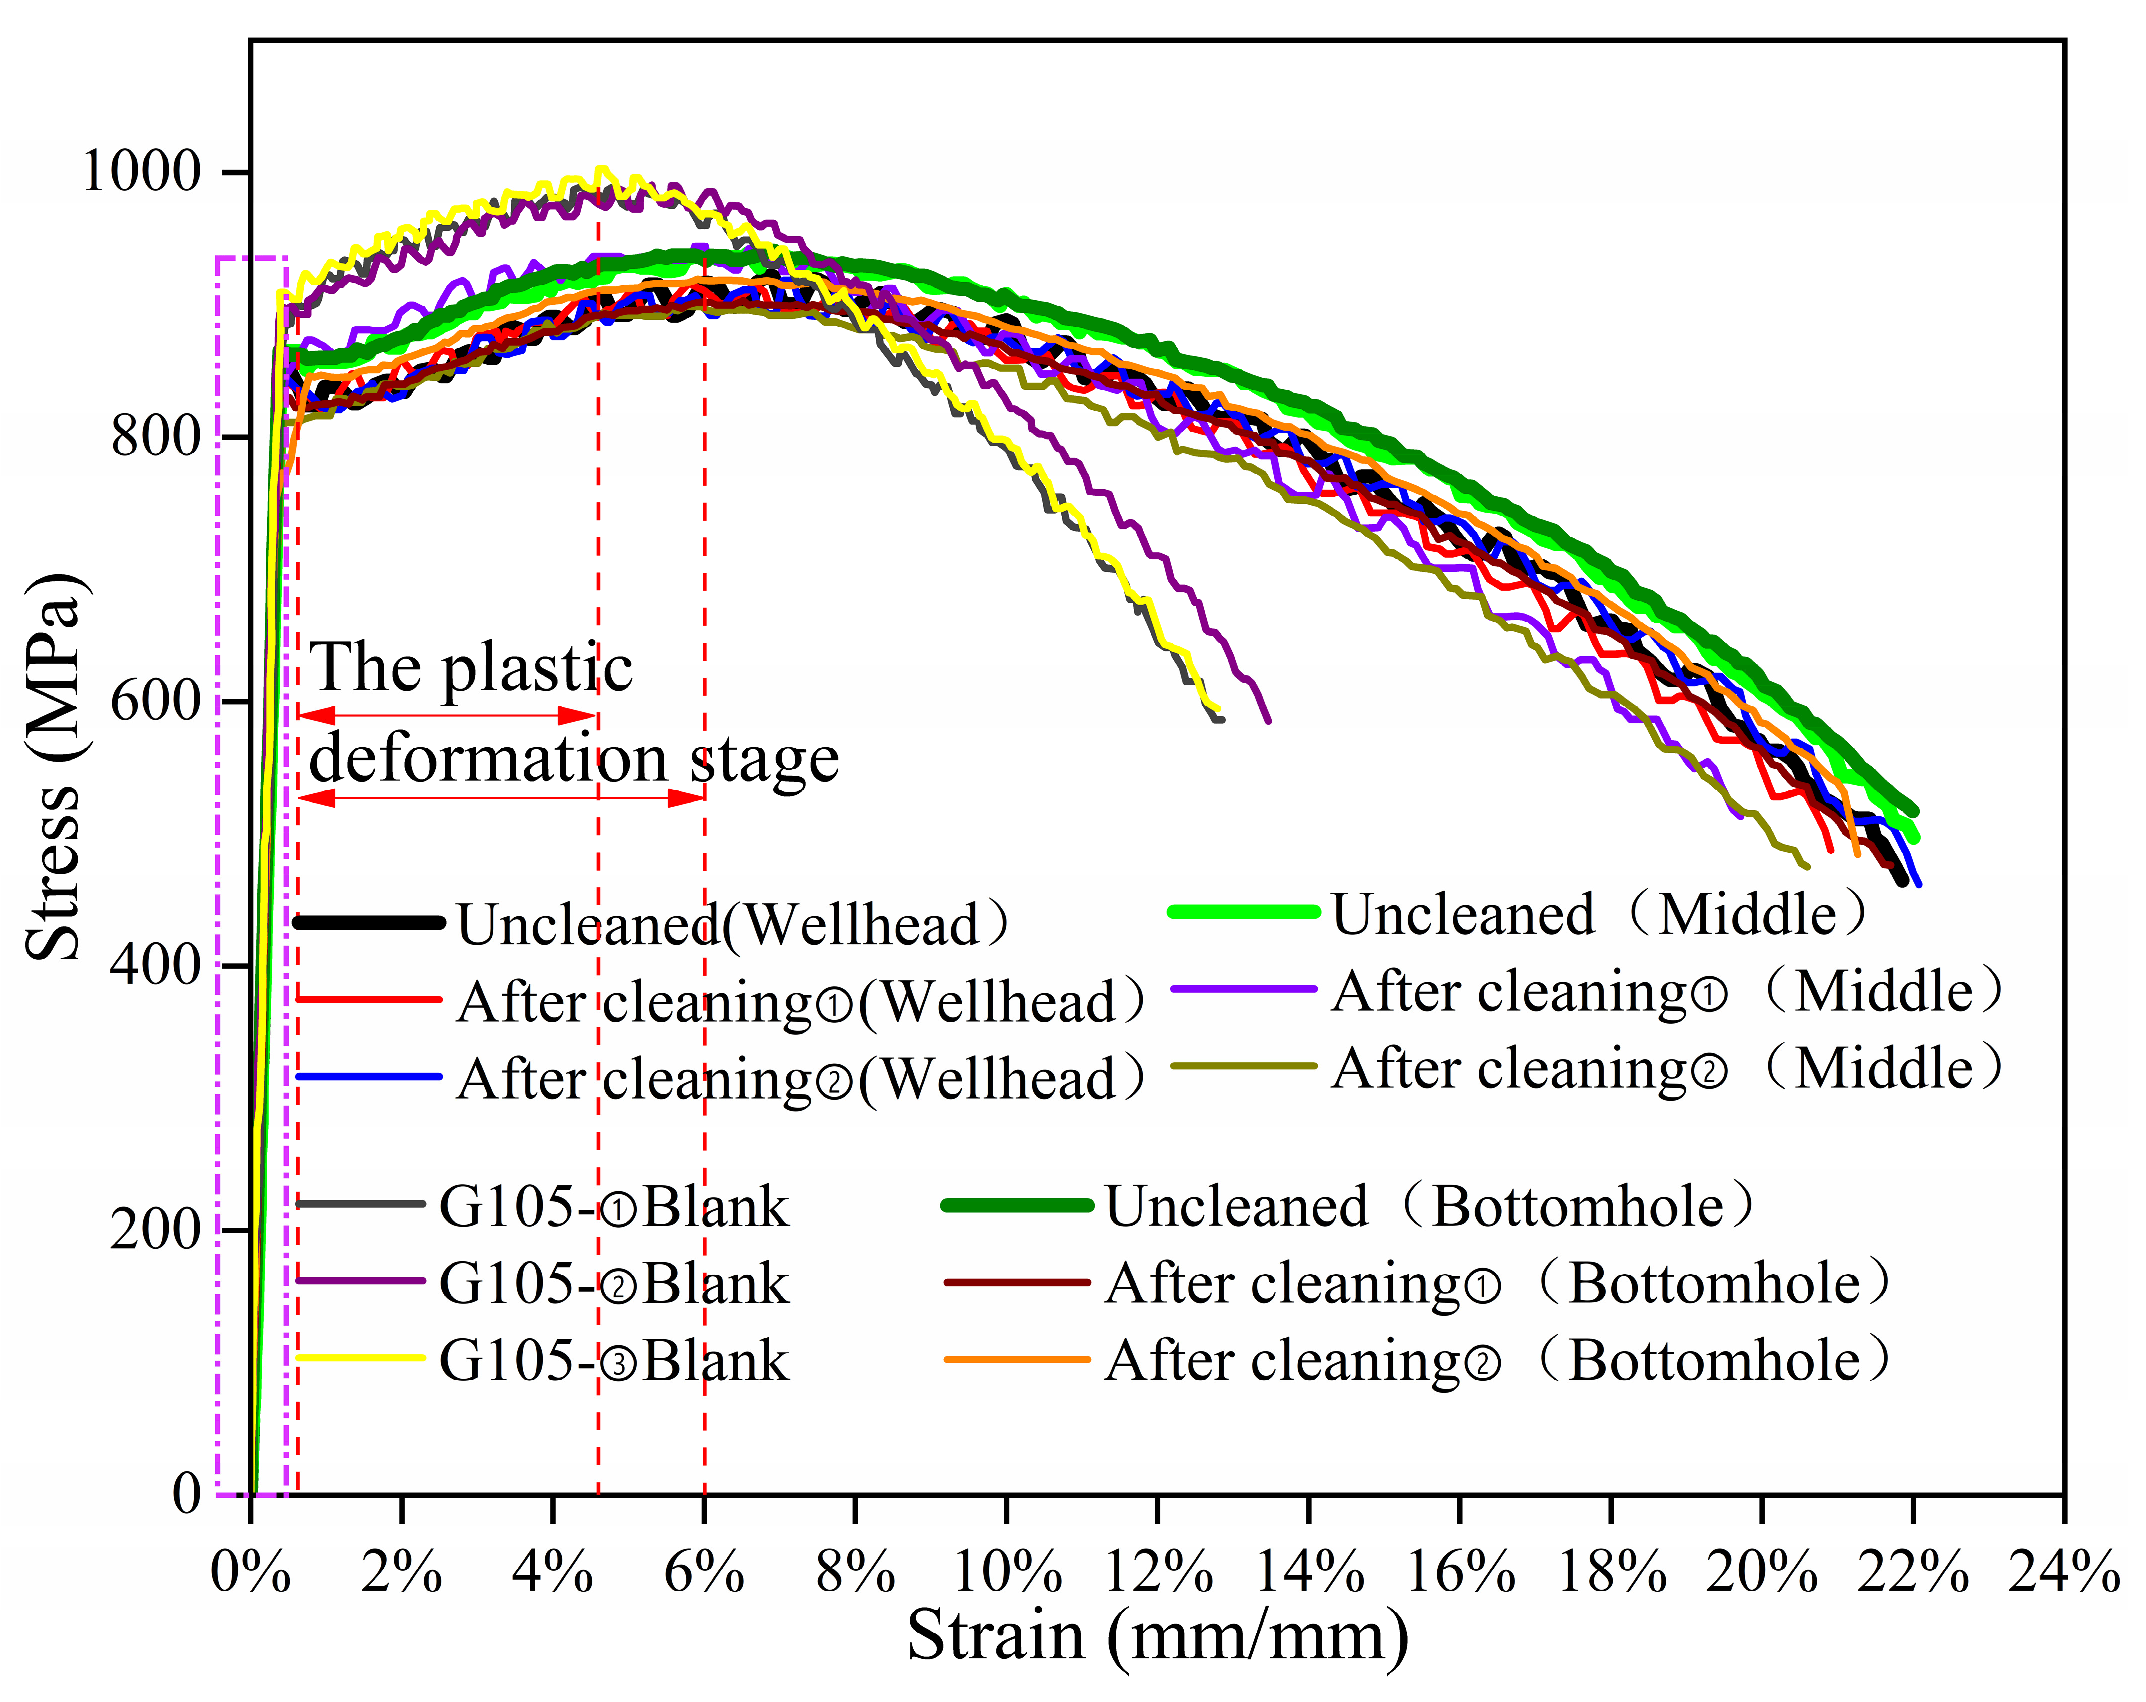
As shown in Figure 12, the tensile stress–strain curve of G105-material specimens was obtained under simulated corrosion environments at the wellhead, well-middle, and bottomhole positions, as well as without corrosion. The variation trend of the tensile stress–strain curves of the uncleaned specimen at the wellhead is consistent with that of the cleaned samples, while the tensile stress–strain curves of the uncleaned specimen in the well-middle and at the bottomhole are slightly higher than those of the cleaned samples. From this, it can be seen that when the temperature is low, the corrosion product becomes loose and easily falls off under the action of force; when the temperature is high, the corrosion products are dense, which can to some extent slow down the fracture of the specimen under constant load. After constant-load-stress-corrosion, the average strain values of G105-material fracture under simulated corrosion environments at the wellhead, well-middle, and bottomhole positions are 21.7%, 20.1% and 22.0%, respectively. The average strain value of the uncorroded specimen fracture is 13.0%. The average maximum stress value (average tensile strength value) of G105-material fracture in the simulated corrosion environments at the wellhead, well-middle, and bottomhole positions are 907 MPa, 908 MPa, 901 MPa, respectively, and the average maximum stress value of the uncorroded specimen fracture is 986 MPa. During the elastic deformation stage (rectangular dashed line in Figure 12), the stress-increase trend of the corrosion-simulation environment of the three well-section locations and the uncorroded samples under the action of constant-load-tensile stress is consistent. It can be seen that the elastic deformation ability of the G105 material decreases after the constant-load-stress-corrosion experiments; in the plastic deformation stage (the area indicated by the red double arrows in Figure 12), the plastic deformation ability of the G105 material decreased compared to the uncorroded specimen after simulated corrosion experiments at the wellhead, well-middle, and bottomhole. After the stress value reaches the tensile strength (red dotted line), the decreasing trend of the stress–strain curve is slower compared with the uncorroded specimen under three simulated conditions.
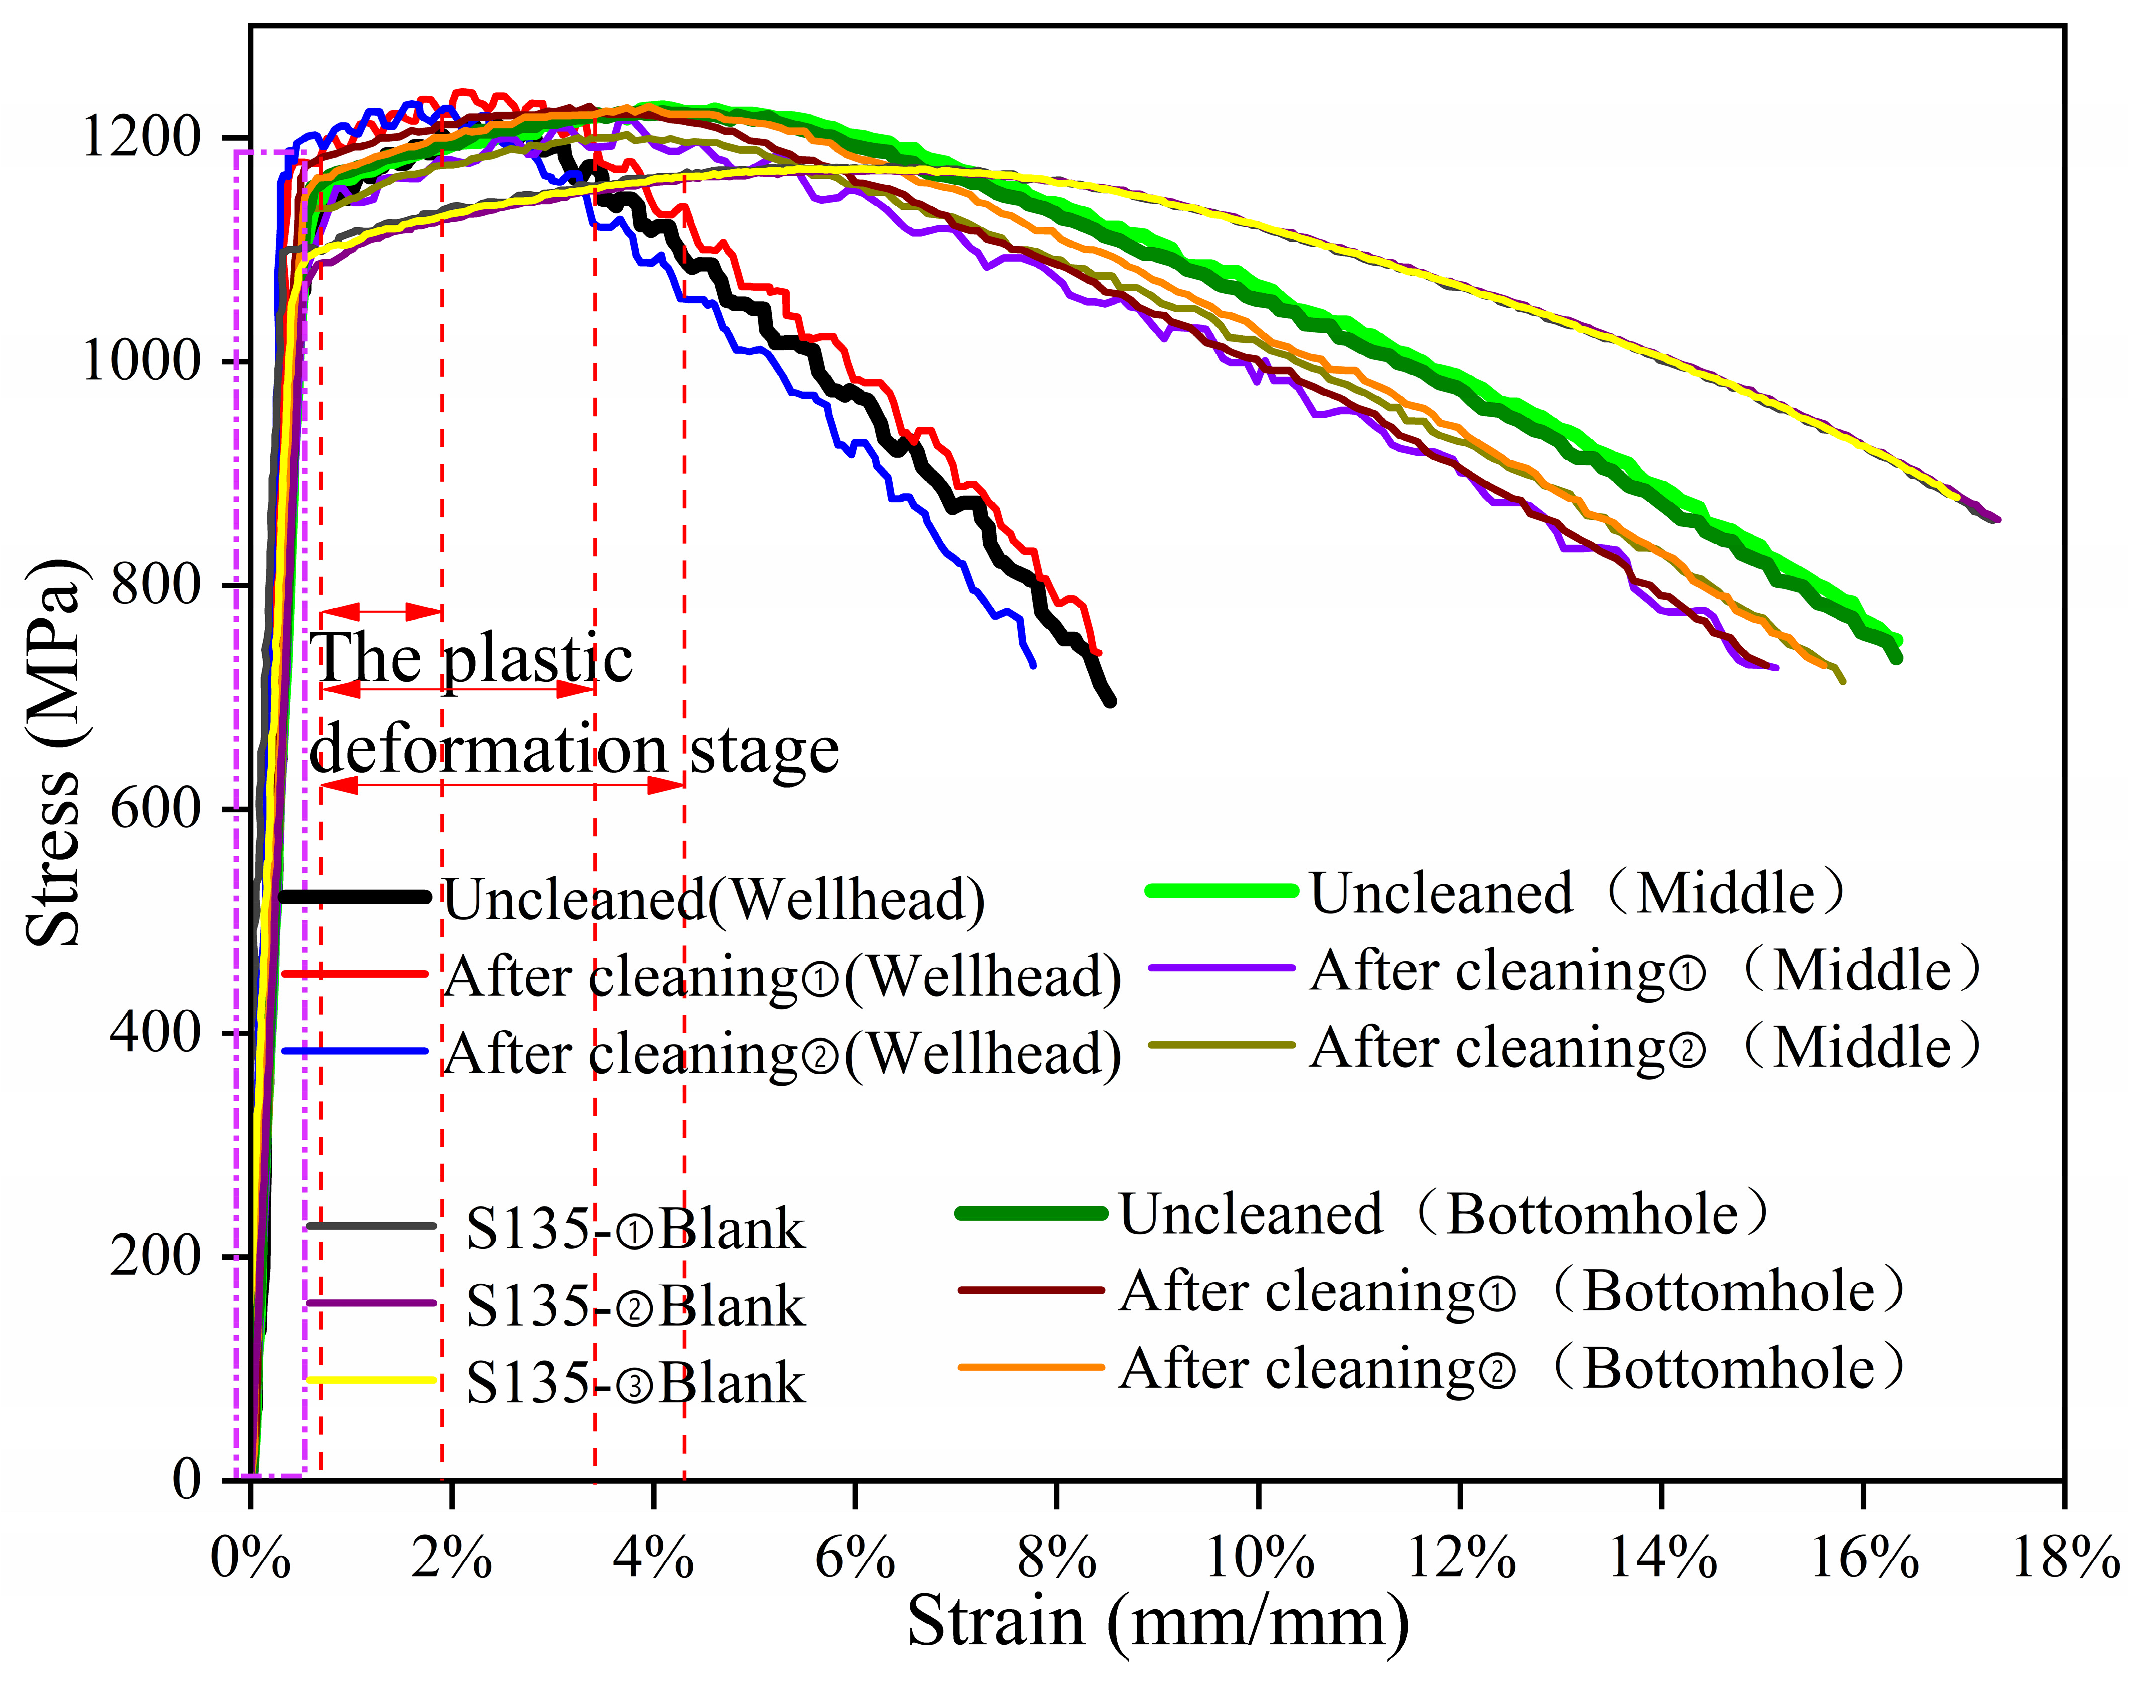
As shown in Figure 13, the tensile stress–strain curves of S135-material specimens were obtained in corrosion-simulation environments for the wellhead, the middle, and the bottomhole locations, as well as without corrosion. The variation trend of the tensile stress–strain curve of the uncleaned specimen at the wellhead is consistent with that of the cleaned specimen, while the tensile stress–strain curves of the uncleaned specimen at the well-middle and at the bottomhole are slightly higher than those of the cleaned specimen; it can be inferred that when the temperature and pressure at the wellhead are low, the corrosion products formed are loose and easily detached under the action of the force. The increasing temperature, pressure, and corrosive media in the well-middle and at the bottomhole can result in denser corrosion products, which can slow down the fracture of the sample to a certain extent under constant load. After constant-load-stress corrosion, the average strain value of S135-material fracture under simulated corrosion environments at the wellhead, well-middle, and bottomhole locations are 16.4%, 15.7%, and 15.8%, respectively. The average strain value of the uncorroded specimen’s fracture is 17.1%; The average maximum stress values (the average tensile strength values) of the S135 material under corrosion-simulation environments at the wellhead, well-middle, and bottomhole locations are 1191 MPa, 1190 MPa, and 1203 Mpa, respectively. The average maximum stress value of the uncorroded specimen fracture is 1166 MPa. During the elastic deformation stage (dashed rectangle line in Figure 13), under constant-load tension, the stress-increase trend of the corrosion-simulation environment and the uncorroded specimen at the three well-section locations is consistent. It can be seen that the stress value of the S135 material increases after the constant-load-stress-corrosion experiment. In the plastic deformation stage (indicated by the red double arrows in Figure 13), the plastic deformation capacity of the S135 material increased compared to the uncorroded specimen after the corrosion-simulation experiments at the wellhead, in the well-middle, and at the bottomhole, and the stress during the plastic deformation stage was the highest at the wellhead. After the stress value reaches the tensile strength (red dashed line), the decreasing trend of the stress–strain curve increases compared with the uncorroded specimens under the three simulated corrosion conditions, that is the susceptibility to SSCC increases, and the decreasing trend of the stress–strain curve is steepest at the wellhead. In the SEM of the cleaned specimen, it can be seen that the S135 material exhibits obvious pitting corrosion at the wellhead. In addition, and H2S corrosion effect makes the S135 material the most SSCC-sensitive at the wellhead.
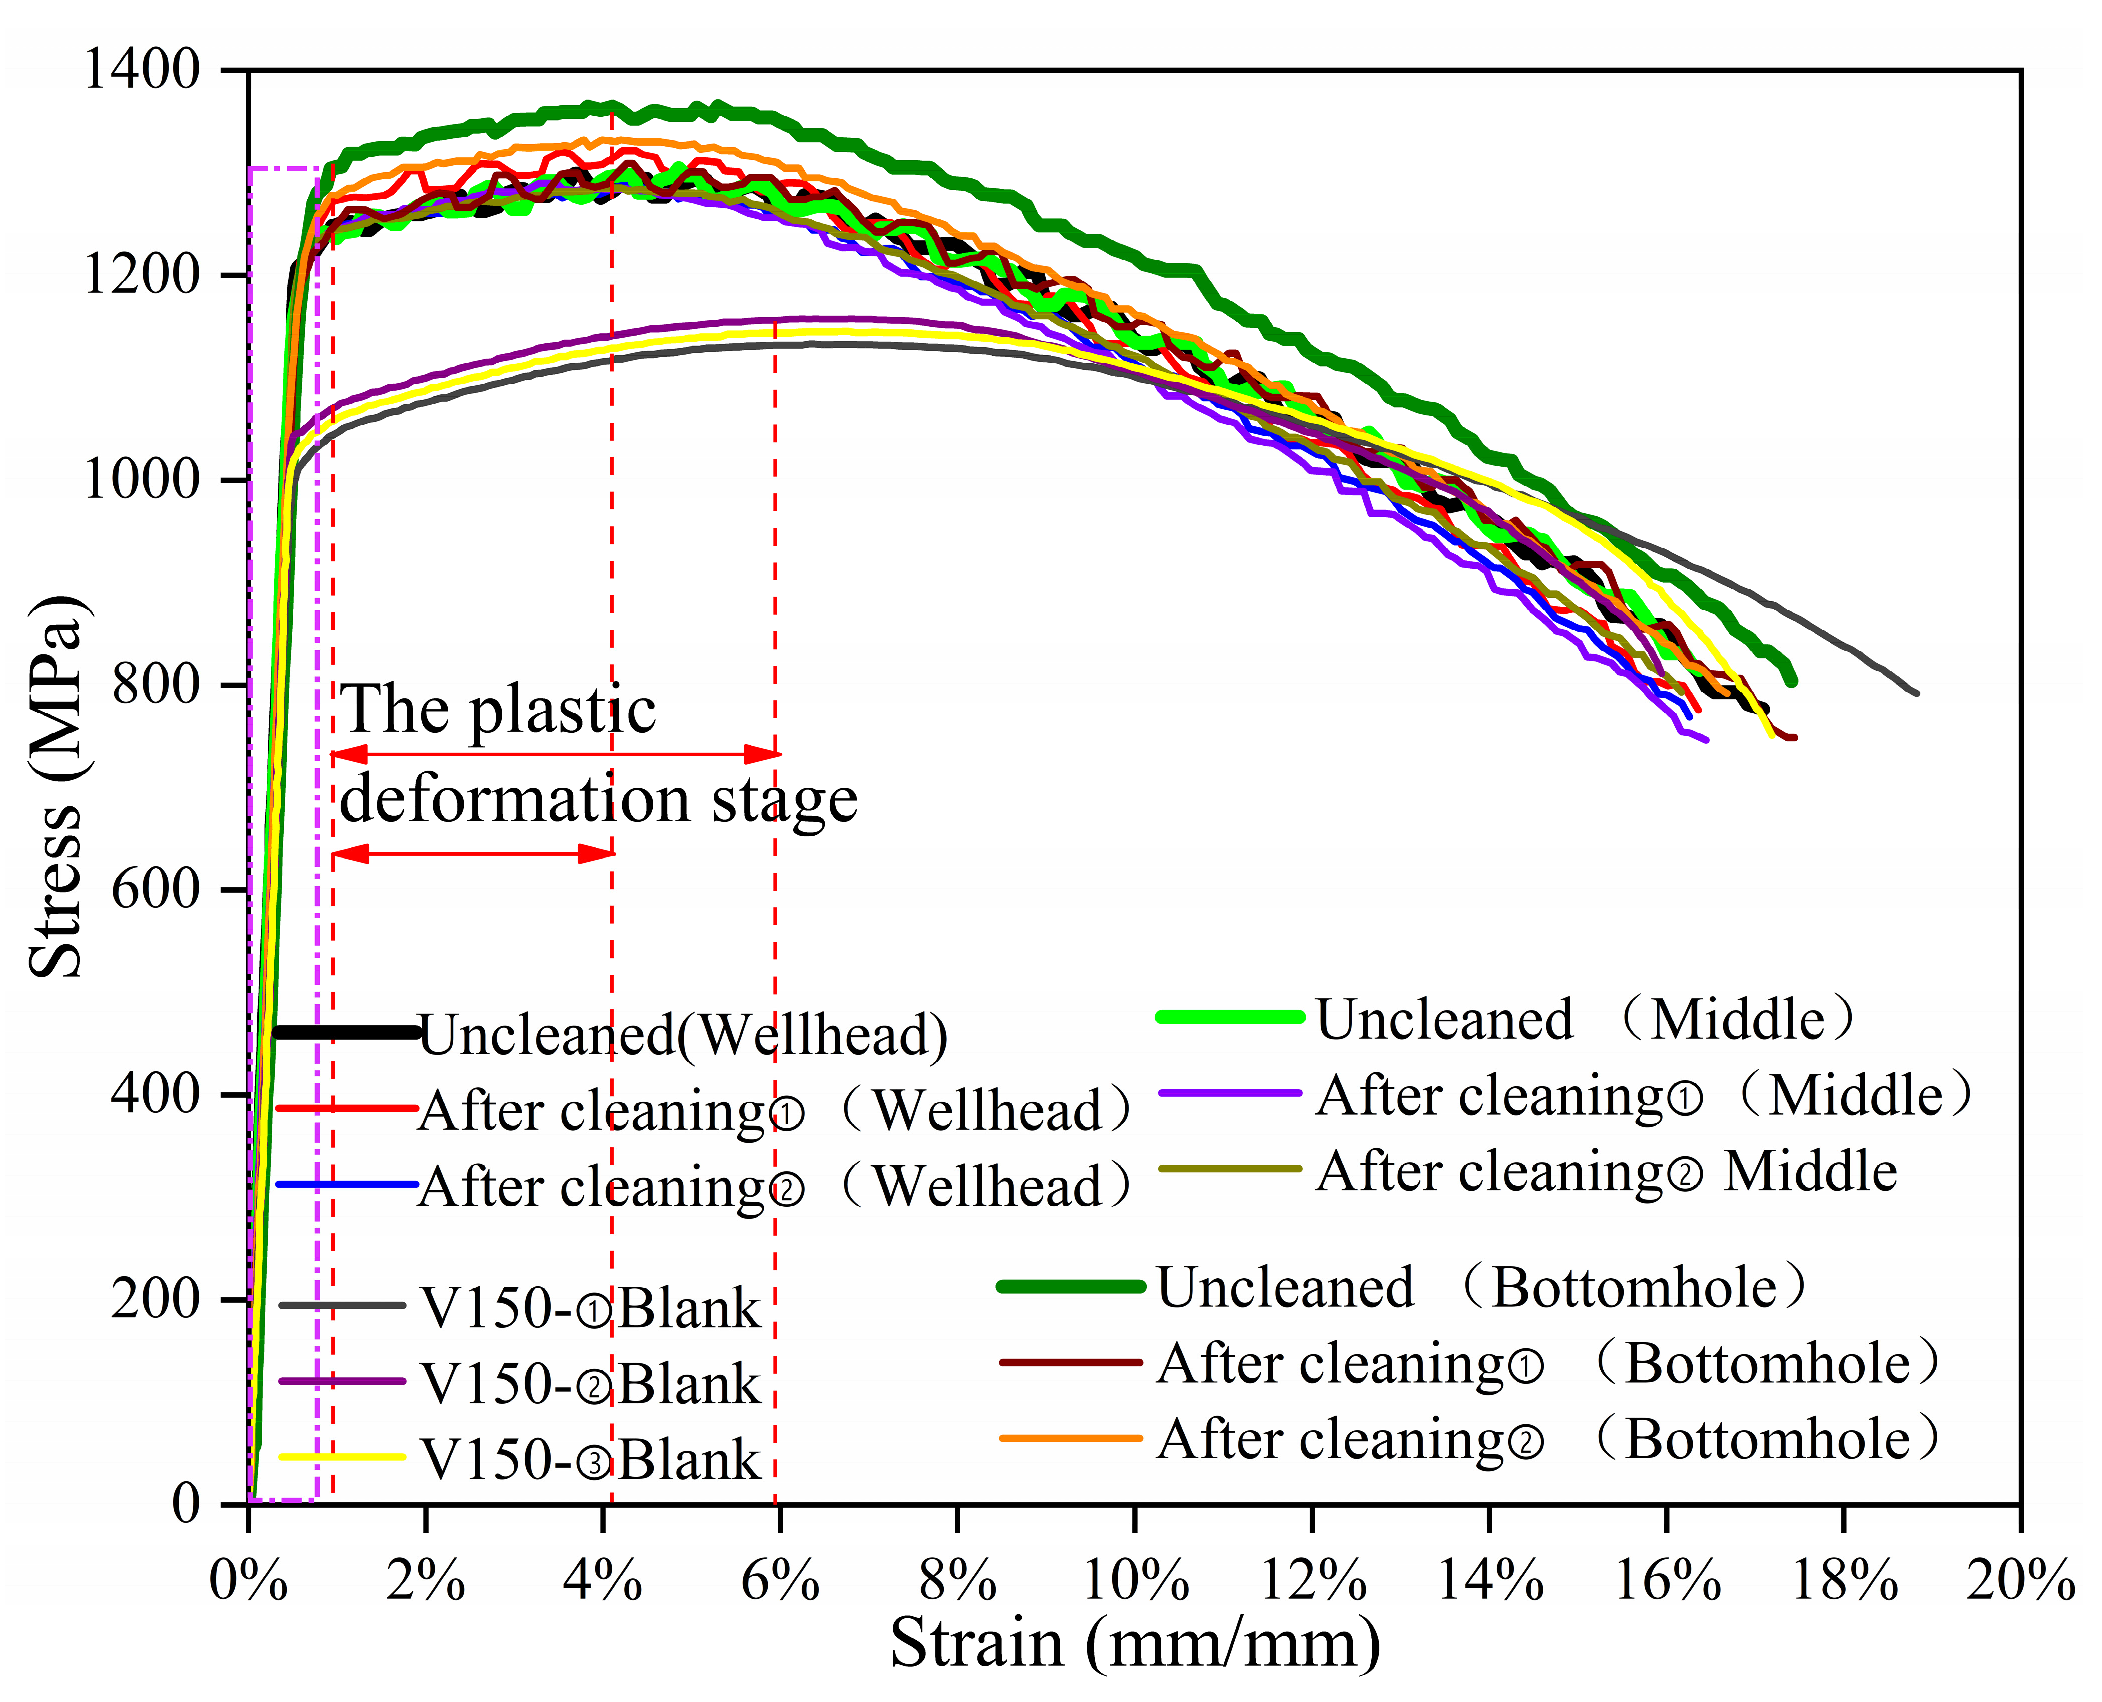
As shown in Figure 14, the tensile stress–strain curves of the V150 material were obtained under the corrosion-simulation environments at the wellhead, in the well-middle, and at the bottomhole, as was obtained for uncorroded V150 material. The variation trend of the tensile stress–strain curves of the specimens at the wellhead, well-middle, and bottomhole are consistent, but the tensile stress–strain curve of the uncleaned specimen at the bottomhole are highest; it can be seen that the dense corrosion products at the bottomhole have to some extent slowed down the fracture of the sample under constant load. After constant-load stress corrosion, the average strain values of V150-material fracture under the corrosion-simulation environment at the wellhead, well-middle, and bottomhole positions were 16.6%, 16.8% and 16.9%, respectively. The average strain value of the uncorroded specimen fracture was 17.4%. The average maximum stress values (average tensile strength values) of V150-material fracture under the corrosion-simulation environment at the wellhead, well-middle, and the bottomhole location are 1288 MPa, 1271 MPa, and 1304 MPa, respectively. The average maximum stress value of the uncorroded specimen fracture is 1148 MPa. During the elastic deformation stage (rectangular dashed line in Figure 14), under constant-load tension, the stress-increase trend of the corrosion-simulation environment and the uncorroded specimen at the three well sections is consistent. It can be seen that the elastic deformation capacity of the V150 material increases after the constant-load-stress-corrosion experiment; in the plastic deformation stage (indicated by the red double arrows in Figure 14), the plastic deformation capacity of the V150 material increases compared to uncorroded specimen after simulated corrosion experiments at the wellhead, in the well-middle, and at the bottomhole. After the stress value reaches the tensile strength (red dashed line), the decreasing trend of the stress–strain curve is steeper compared to the uncorroded specimen under the three simulated working conditions.
Referring to the standard API Spec 5DP-2020 “Drill pipe specification”, the tensile strength and yield-strength requirements for S135, G105, and V150 three materials are specified in Table 4. As shown in 
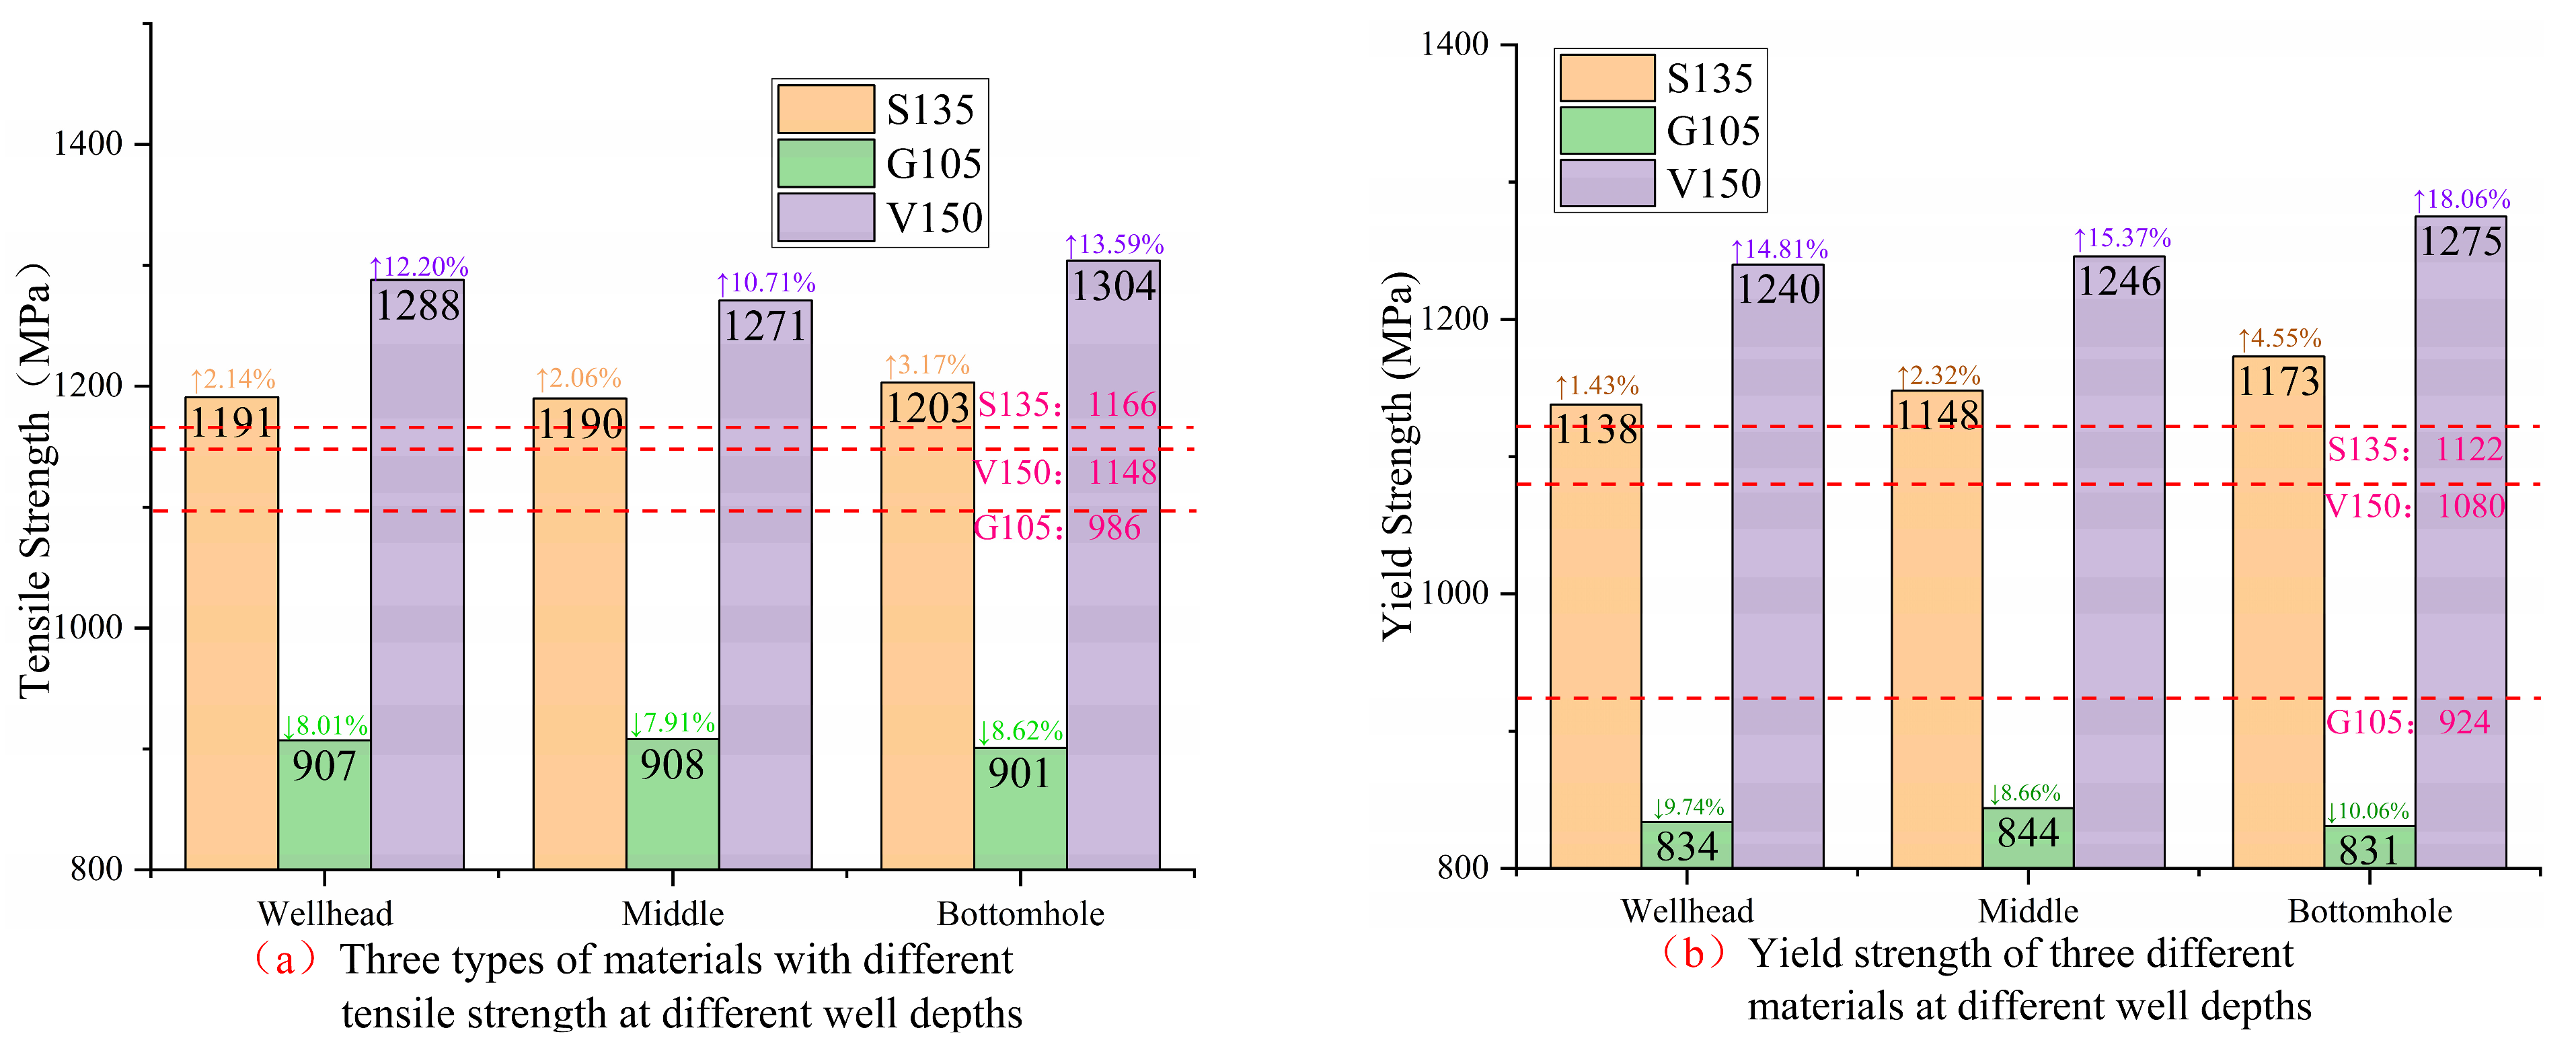
Figure 15, the tensile strength, yield strength, yield ratio, and fracture elongation parameters of three materials under different corrosion environments in different well sections were obtained. The red dashed line in the figure represents the measured tensile-performance parameter values of the uncorroded specimens. According to Figure 15a,b, the strength of the three materials meets the standard requirements.
As can be seen from Figure 15a, compared to the uncorroded specimens, the tensile strength of S135, G105, and V150 drill pipe materials increased by 2.06~3.17%, decreased by 7.91~8.62%, and increased by 10.71~13.59%, respectively. The S135 and V150 materials undergo strain hardening under the influence of H2S in the process of tensile stress. The increase in tensile strength implies a decrease in their plastic deformation ability and toughness, whereas the G105 drill pipe material is affected by CO2 corrosion, resulting in a decrease in its fracture resistance. The change in tensile strength of three materials varies from largest to smallest as follows: V150 material > G105 material > S135 material.
According to Figure 15b, compared with the uncorroded specimens, the yield strength of the S135, G105, and V150 drill pipe materials increased by 1.43~4.55%, decreased by 8.66~10.06%, and increased by 14.81~18.06%, respectively. The increase in yield strength of S135 and the V150 material proves an increase in their susceptibility to stress corrosion cracking under H2S action, and the V150 material has a greater sensitivity to hydrogen embrittlement. Although the G105 material has no risk of hydrogen embrittlement-sensitive fracture, its yield strength is damaged after corrosion. The change in yield strength of three materials ranges from largest to smallest as follows: V150 material > G105 material > S135 material.
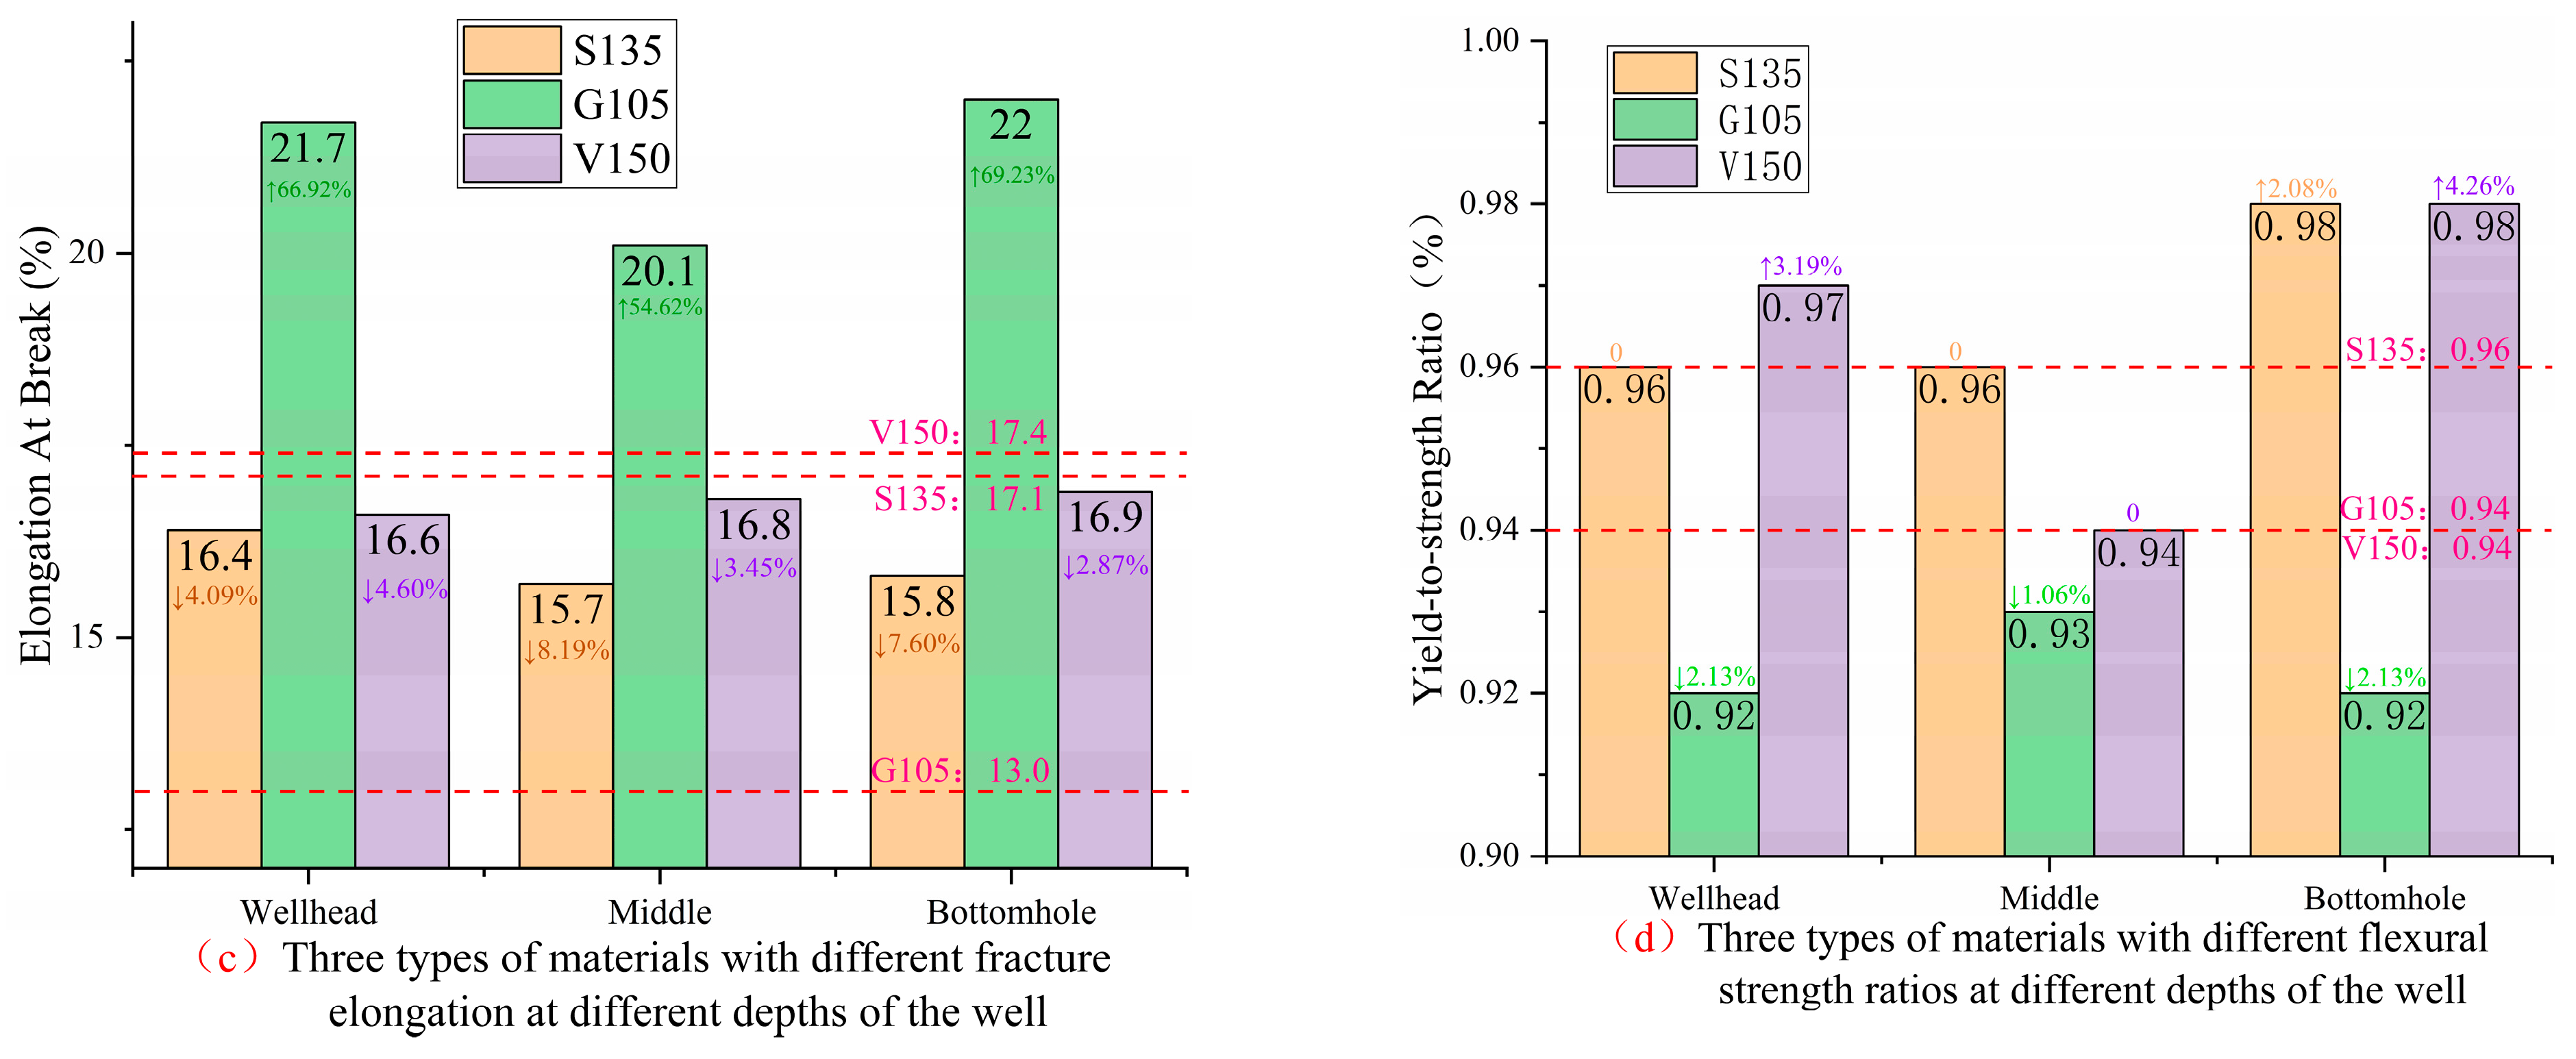
As can be seen from Figure 15c, compared with the uncorroded specimen, the fracture elongation of the S135, G105, and V150 drill pipe materials decreased by 4.09~8.19%, increased by 54.62~69.23%, and decreased by 2.87~4.60%, respectively. Fracture elongation is used to evaluate the plasticity of pipes. The decrease in elongation of S135 and V150 drill pipe materials indicates the existence of strain hardening, while the G105 material has good plastic deformation ability. The change in fracture elongation of the three materials ranges from largest to smallest as follows: G105 material > S135 material > V150 material.
According to Figure 15d, it can be seen that the flexural strength ratio of the S135 drill pipe material increases by 2.08% at the bottomhole, the yield ratio of the G105 drill pipe material decreases by 1.06~2.13%, and the yield ratio of the V150 drill pipe material increases by 3.19~4.26% at the wellhead and the bottomhole. The increases in flexural strength ratio of the S135 and V150 materials indicates an increased risk of brittle damage for both materials.

4. Discussion

According to the SEM and EDS of the corrosion products and the SEM of the corrosion morphology after cleaning, it can be seen that the corrosion of the G105 drill pipe is most serious at the wellhead; the wellhead shows uniform corrosion, the well is slightly corroded locally in the middle of the well, and the bottom of the well shows slightly pitting corrosion. In the three simulated corrosive environments of the wellhead, mid-well, and bottomhole, with increases in temperature, pressure, and the partial pressures of CO2 and H2S, the influences of mass fractions and the type of elements in the drilling fluid on the corrosion products of the G105 material gradually increases. This is mainly due to the coupled corrosive effects of temperature, pressure, and corrosive elements, so that more ions in the drilling fluid are adsorbed onto the corrosion products. Under the simulated corrosion conditions in the three well sections, CO2 corrosion mainly occurred in the G105 material. The effect of Cl in the well promotes local corrosion, and H2S corrosion also occurs with the increases in gas H2S content, bottomhole temperature, and pressure.
CO2 and H2S corrosion coexisted in the S135 drill pipe material at the wellhead, mid-well, and bottomhole locations, and H2S corrosion became progressively more severe from the wellhead to the bottomhole. The S135 material corroded most severely in the mid-well conditions. Under these corrosion-simulation conditions, a large number of cations were detected, which increased the conductivity of the solution, intensified corrosion, and made formation of a Cr(OH)3 film difficult. Under the effect of Cl, pitting corrosion at the wellhead was obvious. The conductivity and acidity of the drilling fluid increased with the increases in temperature and pressure, as well as the increases in the partial pressures of CO2 and H2S. A large number of ions in the drilling fluid are adsorbed onto the corrosion products, and Cl in the drilling fluid is activated by temperature and pressure, penetrating the product film and aggravating the local corrosion of the metal matrix of the S135 drill pipe material.
The CO2 corrosion of the V150 drill pipe material mainly occurs under the three corrosion-simulation conditions of wellhead, mid-well, and bottomhole, and the H2S corrosion of the V150 drill pipe material is the most serious in the mid-well conditions; there is only slight CO2 corrosion in the wellhead, and CO2 and H2S corrosion co-exist in the middle of the well, which shows an obvious homogeneous corrosion phenomenon. From the wellhead to the bottom of the well, the content of Cr in the corrosion product increases continuously, the type and contents of corrosion-product elements increase, and the conductivity of the solution increases, prompting the passivation of Cr to generate a dense Cr(OH)3 film, effectively hindering the contact between the corrosive medium and the metal substrate and slowing down the corrosion, so that in the bottom of the well under the co-existence of CO2 and H2S corrosion, the V150 material corrosion is slight.
Under the influences of temperature, pressure, and H2S/CO2 content that are increasing in simulated corrosion environments at the wellhead, in the well-middle, and at the bottomhole positions, the tensile strength and yield strength of the S135 and V150 drill pipe materials increase under axial tensile force, while the fracture elongation decreases, which is due to the penetration of hydrogen atoms in hydrogen sulfide into the metal matrix, causing strain-hardening deformation and a tendency towards stress-hydrogen embrittlement. Additionally, the SSCC sensitivity of the V150 material is higher than that of the S150 material. The SSCC sensitivity of the V150 material is higher than that of the S135 material; the strength of the G105 material is reduced, and the corrosive effect of drilling fluids coexisting with H2S/CO2 in different well sections have caused damage to the mechanical performance of the G105 material. The fracture elongation has increased by more than half that of the non-corroded specimen, and the plastic deformation ability has increased.

5. Conclusions

(1)
The CO2-corrosion behaviors of G105, S135, and V150 drill pipes are significant in a simulated 80% constant-load-stress-corrosion environment at the wellhead, well-middle, and bottomhole locations using a potassium amine-based polysulfide drilling fluid coexisting with CO2/H2S. However, S135 and V150 drill pipes are also accompanied by H2S corrosion, and H2S corrosion has the greatest impact on V150 drill pipes. The dense Cr(OH)3 film rapidly generated by the Cr element in the three types of drill pipe materials can slow down the corrosion of the metal matrix under high temperature and pressure; due to the coupling effects of temperature and pressure, and of CO2/H2S gas and the Cl element, the conductivity of the solution increases, and more ions in the drilling fluid adsorb onto the corrosion products.
(2)
From the stress–strain curve of constant-load-tensile fracture, it can be seen that, compared with the uncorroded specimen, the strength and flexural strength ratio of S135 and V150 drill pipe increase, while the fracture elongation decreases. The susceptibility to hydrogen-embrittlement fracture increases under the action of H2S, whereas the strength and flexural strength ratio of the G105 drill pipe decrease while the fracture elongation increases. The strength-variation amplitude of three types of drill pipe materials decreased as follows: V150 material > G105 material > S135 material. The changing amplitude of fracture elongation of the three materials decreased as follows: G105 material > S135 material > V150 material; the G105 material has the most significant deformation ability change under 80% constant-load-stress-corrosion environment at the bottomhole, with a fracture elongation increases up to 69.23%.
(3)
After the constant-load-stress-corrosion experiment, the G105 material showed the greatest change in tensile performance at the bottomhole due to CO2/H2S corrosion compared to the wellhead and well-middle positions. The S135 material has the greatest SSCC sensitivity at the wellhead due to pitting and tensile effects. Although the V150 material did not show significant corrosion at the bottomhole, its strength changes were the most prominent, with a decrease of 13.59% in yield strength and 18.06% in tensile strength, indicating that the V150 material has the highest SSCC sensitivity at the bottomhole.
(4)
This article analyzes the 80% constant-load-stress-corrosion experiments of three types of drill pipe materials in the corrosive environment of potassium amino poly-sulfonate drilling fluid containing CO2/H2S. It can provide certain guidance for the selection of on-site pipe materials, can alert others to the hazards of sulfide-stress-corrosion-hydrogen embrittlement, and can inform subsequent simulation and analysis of the process of pipe-hydrogen-embrittlement fracture based on experimental data.

Author Contributions

Methodology, B.S. and Z.Z.; software, B.Z.; validation, S.Z.; formal analysis, S.J.; investigation, Z.X.; writing—original draft, Y.Z. (Yuhan Zhang); writing—review and editing, Y.Z. (Yushan Zheng); supervision, S.C.; funding acquisition, Y.J. All authors have read and agreed to the published version of the manuscript.

Funding

This research was funded by the CNPC Scientific Research and Technological Development Programs [Grant Nos. 2021DJ0806, 2021DJ6502, and 2021DJ6504], the Beijing Nova Program (20230484365) and Research and application of key technical standards for burying carbon dioxide in large-scale oil and gas reservoirs (2023YFF0614100).

Data Availability Statement

The data used to support the findings of this study are available from the corresponding author upon request.

Conflicts of Interest

The authors declare no conflicts of interest.

References

  1. Bi, Z.Y.; Xian, L.Y. LCF Life Prediction Model of Coiled Tubing Based on Fatigue Damage Accumulation. Adv. Mater. Res. 2013, 699, 426–431. [Google Scholar] [CrossRef]
  2. Lan, K.; Hou, S.; Yan, G.; Liu, K.; Liu, M. Research and application of lightweight and high-strength drill pipes in foreign countries. Pet. Mach. 2010, 38, 77–81. [Google Scholar]
  3. Huang, B.; Lu, D.; Jiang, T.; Zhang, J.; Ning, Y. Corrosion behavior of G105 drill pipe in different hydrogen ion concentration solutions. Mech. Eng. Mater. 2014, 38, 81–84, 102. [Google Scholar]
  4. Zhang, Z.; Zhang, J.; Sun, H.; Xiao, W.; Shao, X.; Liu, Y. Causes of fracture of drill pipe in a deep well in Tahe Oilfield. Corros. Prot. 2014, 35, 192–195. [Google Scholar]
  5. Zheng, X. Stress corrosion cracking behavior of G105 drill pipe steel in H2S solution. Therm. Process. Technol. 2016, 45, 97–100. [Google Scholar] [CrossRef]
  6. Wang, C. Analysis of causes of corrosion hole formation in S135 drill pipe. Surf. Technol. 2016, 45, 58–63. [Google Scholar] [CrossRef]
  7. Liu, G.; He, F.; Tian, M.; He, R. Effects of different heat treatments on the stress corrosion performance of drill pipe materials with hydrogen sulfide. Mater. Prot. 2019, 52, 17–22+47. [Google Scholar] [CrossRef]
  8. Huang, B.S.; Jiang, Z.Y.; Fan, Z. Research of G105 Chloride Ion Stress Corrosion Cracking. Adv. Mater. Res. 2011, 152, 659–665. [Google Scholar] [CrossRef]
  9. Zhang, B.; Pan, Z.; Cao, L.; Xie, J.; Chu, S.; Jing, Y.; Lu, N.; Sun, T.; Li, C.; Xu, Y. Measurement of wellbore leakage in high-pressure gas well based on the multiole physical signals and history data: Method, technology, and application. Energy Sci. Eng. 2024, 12, 4–21. [Google Scholar] [CrossRef]
  10. Li, F.; Feng, D.; Wang, J.W.; Gao, D.L. The Using of Anti-Sulfur Drill Pipe in High Sulfur Oil-Gas Field. Adv. Mater. Res. 2012, 383, 1776–1780. [Google Scholar] [CrossRef]
  11. Wan, L.P.; Meng, Y.F.; Li, G.; Zhou, H. Corrosion behavior of drilling pipe steels for high sour gas field. Adv. Mater. Res. 2012, 415, 2292–2297. [Google Scholar] [CrossRef]
  12. Zhang, Z.; Li, J.; Zeng, D.; Hu, J.; Hou, D.; Zhang, L.; Shi, T. Stress corrosion cracking of high-strength drill pipe in sour gas well. J. Wuhan Univ. Technol.-Mater. Sci. Ed. 2014, 29, 813–816. [Google Scholar] [CrossRef]
  13. Zamani, S.M.; Hassanzadeh-Tabrizi, S.A.; Sharifi, H. Failure analysis of drill pipe: A review. Eng. Fail. Anal. 2016, 59, 605–623. [Google Scholar] [CrossRef]
  14. Luo, S.; Liu, M.; Shen, Y.; Lin, X. Sulfide Stress Corrosion Cracking Behavior of G105 and S135 High-Strength Drill Pipe Steels in H2S Environment. J. Mater. Eng. Perform. 2019, 28, 1707–1718. [Google Scholar] [CrossRef]
  15. Luo, S.; Liu, M.; Lin, X. Corrosion fatigue behavior of S135 high-strength drill pipe steel in a simulated marine environment. Mater. Corros. 2019, 70, 688–697. [Google Scholar] [CrossRef]
  16. Han, L.; Liu, M.; Luo, S.; Lu, T.J. Fatigue and corrosion fatigue behaviors of G105 and S135 high-strength drill pipe steels in air and H2S environment. Process Saf. Environ. Prot. 2019, 124, 63–74. [Google Scholar] [CrossRef]
  17. Yu, H.; Peng, X.; Lian, Z.; Shi, T.; Wang, J.; Zhao, Z. Experimental and numerical simulation of fatigue corrosion behavior of V150 high-strength drill pipe in air and H2S-dilling mud environment. J. Nat. Gas Sci. Eng. 2022, 98, 104392. [Google Scholar] [CrossRef]
  18. Yu, Z.; Zeng, D.; Hu, S.; Zhou, X.; Lu, W.; Luo, J.; Fan, Y.; Meng, K. The failure patterns and analysis process of drill pipes in oil and gas well: A case study of fracture S135 drill pipe. Eng. Fail. Anal. 2022, 138, 106171. [Google Scholar] [CrossRef]
  19. Shen, D.; Tong, K.; Fan, Z.H.; Yang, W.Z.; Liu, Q.; Li, H.; Zhao, J.L.; Cong, S. Failure analysis of S135 drill pipe body fracture in a well. Eng. Fail. Anal. 2023, 145, 106998. [Google Scholar] [CrossRef]
  20. NS-EN ISO 6892-1:2019; Metallic Materials—Tensile Testing—Part 1: Method of Test at Room Temperature. ISO: Geneva, Switzerland, 2019.
  21. GB/T 4157-2017; Laboratory Testing of Metals for Resistance to Sulfide Stress Cracking and Stress Corrosion Cracking in H2S Environment. ISO: Geneva, Switzerland, 2017.
  22. ASTM A370-23; Standard Test Methods and Definitions for Mechanical Testing of Steel Products. ISO: Geneva, Switzerland, 2023.
  23. Zhang, Z.; Zhou, Z.; Song, C.; Sang, P.; Liu, H.; Li, L. Mechanical properties of G3 nickel-based alloy tubing subjected to souring corrosion at high temperature and high pressure. Nat. Gas Ind. 2019, 39, 107–114. [Google Scholar]
  24. Zhu, J.; Xu, L.; Lu, M.; Zhang, L.; Chang, W.; Hu, L. Essential criterion for evaluating the corrosion resistance of 3Cr steel in CO2 environments: Prepassivation. Corros. Sci. 2015, 93, 336–340. [Google Scholar] [CrossRef]
Figure 1. Test fixture device diagram. (a): Fixture assembly sample diagram; (b): MTS tensile testing machine loading.
Processes 12 00502 g001
Figure 2. Schematic diagram of high-temperature and high-pressure kettle device.
Processes 12 00502 g002
Figure 3. SEM image of corrosion morphology and EDS image of corrosion products of G105 material in a simulated wellhead-corrosion environment.
Processes 12 00502 g003
Figure 4. SEM image of corrosion morphology and EDS image of corrosion products of G105 material in a simulated well-middle-location corrosion environment.
Processes 12 00502 g004
Figure 5. SEM image of corrosion morphology and EDS image of corrosion products of G105 material in a simulated bottomhole corrosion environment.
Processes 12 00502 g005
Figure 6. SEM image of corrosion morphology and EDS image of corrosion products of S135 material under simulated wellhead-corrosion environment.
Processes 12 00502 g006
Figure 7. SEM image of corrosion morphology and EDS image of corrosion products of S135 material in a simulated well-middle corrosion environment.
Processes 12 00502 g007
Figure 8. SEM image of corrosion morphology and EDS image of corrosion products of S135 material in a simulated bottomhole corrosion environment.
Processes 12 00502 g008
Figure 9. SEM image of corrosion morphology and EDS image of corrosion products of V150 material in a simulated wellhead-corrosion environment.
Processes 12 00502 g009
Figure 10. SEM image of corrosion morphology and EDS image of corrosion products of V150 material in the simulated well-middle corrosion environment.
Processes 12 00502 g010
Figure 11. SEM image of corrosion morphology and EDS image of corrosion products of V150 material in the simulated bottomhole corrosion environment.
Processes 12 00502 g011
Figure 12. G105 material tensile stress–strain curve.
Processes 12 00502 g012
Figure 13. Tensile stress–strain curve of S135 material.
Processes 12 00502 g013
Figure 14. Stress–strain curve in tension for V150 material.
Processes 12 00502 g014
Figure 15. Schematic diagram of tensile performance of three materials under different working conditions.
Processes 12 00502 g015aProcesses 12 00502 g015b
Table 1. Experimental conditions for simulating wellhead, well-middle, and bottomhole depths.
Simulated PositionTemperature/[°C]Pressure/[MPa]Partial Pressure
of H2S/[MPa]
Partial Pressure
of CO2/[MPa]
Wellhead25100.0020.21
Well-middle68330.0070.68
Bottomhole106670.0141.39
Table 2. Chemical composition of G105, S135, and V150 drill pipes.
Material of Drill PipeCSiMnPSCrMoNiVAlCuTi
G1050.250.251.060.0090.0010.880.160.020.0080.0130.010.003
S1350.270.201.430.0110.0030.620.420.0340.0550.0180.020.006
V1500.2400.3000.4700.0090.0010.510.7100.6000.1200.0240.0700.020
Table 3. Chemical components of potassium amino poly-sulfonate drilling fluid.
ComponentNaOHMacromolecular Encapsulation InhibitorSmall-Molecule-Filtration LossLignite ResinModified ResinFlexible ParticlesLubricantsKClOrganic Salts
Content0.5~0.8%0.3~0.5%1~2%5~10%5~10%1~4%2~3%7~10%10~15%
Table 4. The strength requirements for three types of drill pipe in API Spec 5DP-2020.
Mechanical PerformanceS135 Drill PipeG105 Drill PipeV150 Drill Pipe
Tensile Strength/[Mpa]≥1050≥793≥1102
Yield Strength/[Mpa]≥931724~931≥1034
Disclaimer/Publisher’s Note: The statements, opinions and data contained in all publications are solely those of the individual author(s) and contributor(s) and not of MDPI and/or the editor(s). MDPI and/or the editor(s) disclaim responsibility for any injury to people or property resulting from any ideas, methods, instructions or products referred to in the content.

