Abstract
Nowadays, the environmental challenges associated with plastics are becoming increasingly prominent, making the exploitation of alternatives to landfill disposal a pressing concern. Particularly, polyvinyl chloride (PVC), characterized by its high chlorine content, poses a major environmental risk during degradation. Furthermore, PVC recycling and recovery present considerable challenges. This study aims to optimize the PVC pyrolysis valorization process to produce effective adsorbents for removing contaminants from gaseous effluents, especially CO2. For this purpose, PVC waste was pyrolyzed under varied conditions, and the resulting solid fraction was subjected to a series of chemical and physical activations by means of hydroxides (NaOH and KOH) and nitrogen. Characterization of the PVC-based activated carbons was carried out using surface morphology (SEM), N2 adsorption/desorption, elemental analysis, and FTIR, and their capacity to capture CO2 was assessed. Finally, neuro-fuzzy models were developed for the optimization of the valorization technique. The resulting activated carbons exhibited excellent CO2 adsorption capabilities, particularly those activated with KOH. Optimal activation conditions include activations at 840 °C with NaOH at a ratio of 0.66 and at 760 °C using either NaOH or KOH with ratios below 0.4. Activations under these experimental conditions resulted in a significant increase in the adsorption capacity, of up to 25%, in the resulting samples.
1. Introduction
Plastics are essential materials that play a vital role in modern times. These materials have become an integral part of our daily lives, serving in a wide array of industries and applications, ranging from packaging and construction to healthcare and electronics. However, these materials also pose a significant environmental challenge due to their non-biodegradable nature, especially single-use plastics. Global plastics production increased from 280 Mt in 2011 to nearly 390 Mt in 2021 and is expected to continue to grow firmly over the coming years [1]. This excessive use of plastic has resulted in an enormous generation of waste, exceeding our capacity for its proper management. Despite there having been significant progress in recycling and energy recovery technologies to effectively utilize and recycle waste, these methods may not always be suitable or economically viable for managing all plastic waste. Indeed, only a minor fraction of this waste is recycled (≈18%), while the majority is either incinerated (25%) or disposed of in landfills (57%), hindering its potential for profitable utilization [2]. In this way, the exploration of alternative methods for utilizing plastic waste and reducing landfill disposal is highly desirable. One promising alternative is the pyrolysis valorization technique. Pyrolysis is a chemical recycling process that involves the thermochemical degradation of plastic waste by the application of heat and pressure, typically in the absence of oxygen [3]. During this process, three main products can be obtained, i.e., liquid (or oil), gas, and solid (also called char), that can be used for both materials and energy purposes. For example, the liquid fraction obtained from the pyrolysis of plastic waste can be refined into fuel or chemicals [4], while the gas fraction is usually used to feed the pyrolysis process. Furthermore, the solid product can serve as a solid fuel [5] or as a precursor to produce adsorbents [6]. While significant attention has been given to the liquid and gaseous fractions, research on the applications of char is comparatively scarce [7]. Thus, the present study aims to approach to the integral exploitation of plastic pyrolysis by-products, focusing particularly on the solid fraction.
Polyvinyl chloride (PVC) is among the most extensively used plastics; it accounts for 12% of the worldwide plastic demand, with an annual production of around 45 Mt [8]. PVC holds paramount importance in material science for its remarkable characteristics, including high durability, reusability, cost-efficiency, versatility, and low thermal conductivity [9]. Additionally, PVC can be provided with specific functional properties by means of incorporating various additives such as plasticizers, lubricants, and stabilizers [2]. In contrast, this material is considered one of the most environmentally harmful plastics because of its high chlorine content (~56 wt%) and high levels of hazardous additives. Consequently, recycling and valorization of PVC waste currently represents a great challenge.
In general, plastics have been widely studied for pyrolysis processes to make use of their fractions. For instance, Zhang et al. [10] obtained a methane-rich gas from the pyrolysis of polyethylene terephthalate (PET) waste and used the solid fraction to produce activated carbons for use as electrode material in supercapacitors. Kalargaris et al. [11] successfully produced high-quality bio-oil from the pyrolysis of mixed plastic waste, consisting of styrene-butadiene and polyester. The obtained bio-oils were found to have similar properties to those of diesel fuels. In another work, H2 and carbon nanotubes were produced from the pyrolysis and catalytic decomposition of polypropylene waste [12]. Saeaung et al. [13] used the liquid fraction derived from the thermal decomposition of polypropylene, polylactide, and high- and low-density polyethylene waste to produce valuable chemicals. However, the pyrolysis of PVC waste has been historically problematic due to the formation of toxic compounds (hydrochloric (HCl-) species), and low thermal stability [14]. In contrast to other polymers, such as PET, PE, or PP, which undergo thermal degradation in a single step, PVC degradation occurs in two distinct stages. During the first step, the main process is the dechlorination of PVC, wherein the highly polarized C-Cl bonds are readily broken at relatively low temperatures. This results in the release of chlorine, primarily as gaseous HCl, along with other volatile compounds (benzenes, hydrocarbons, etc.). This stage occurs at temperatures ranging from 250 to 350 °C, depending on the types of stabilizers and additives present in the PVC. In the second step, the free chlorine polymer undergoes further degradation, resulting in its breakdown and decomposition. The second degradation step occurs at temperatures between 350 and 500 °C [15]. Qureshi et al. [16] reported that the by-products of PVC thermal degradation can have a detrimental effect on the pyrolysis process and its resulting products, as it generates chlorine-containing organics that may cause reactor corrosion and lead to liquid fraction degradation. To tackle this challenge, dechlorination units can be used in order to remove chlorine species and purify the pyrolysis products; however, this involves additional costs [17]. Thus, testing and optimization of the PVC pyrolysis process are required to gain a deeper insight into the management of this waste and progress toward the integral valorization of its by-products.
On the other hand, the liquid, gas, and char yields obtained from the pyrolysis process vary depending on the polymer’s nature. For instance, PVC produces the lowest oil yield among the most commonly used plastics; however, a high percentage of solid residue (up to 25 wt%) can be obtained [18]. This is significantly higher compared to the less than 1 wt% yielded by other widely used polymers, such as PP or PS, in the same process [7]. Thus, PVC waste can serve as an excellent precursor for the production of char-based materials due to its capacity to yield a significant solid residue during the pyrolysis process; nevertheless, its use to produce activated carbons has scarcely been studied.
In light of the above-mentioned concerns, this study aims to valorize the pyrolysis PVC waste by-products, with a special focus on the solid fraction. For that, the pyrolysis solid by-products will be used as precursors to obtain high-value products, particularly CO2 adsorbents. A complete set of characterizations including SEM, textural properties (N2 adsorption/desorption isotherms), elemental analysis, FTIR, and CO2 adsorption was carried out. Additionally, neuro-fuzzy models were designed to optimize the performance of the adsorbents by finely tuning the experimental variables involved in their synthesis process. Research on PVC valorization techniques will contribute to reducing its continuous disposal in landfills, which would otherwise cause irreversible environmental issues [19] and severe impacts on human beings’ health [20].
2. Materials and Methods
2.1. PVC-Based Char Production
Char production was carried out using PVC piping waste supplied by a municipal solid waste treatment plant in Granada, Spain. Firstly, 40 g of PVC pipe was crushed and sieved to a particle size lower than 0.5 mm. Pyrolysis of PVC was carried out in a reactor (Nabertherm, Lilienthal, Germany) at a temperature of 500 °C, with a residence time of 2 h, a heating rate of 20 °C/min, and a nitrogen flow rate of 100 L/h. The products of pyrolysis were cooled to room temperature and then removed from the holding crucible and condensable collectors to measure their masses. Finally, the product yields were calculated based on the mass of PVC fed. The pyrolysis product yields were 5.93% liquid, 33.73% char, and 60.34% gas. The resulting solid fraction (char) was ground and subjected to the activation process.
2.2. PVC-Based Char Activation
Five grams of char was mixed with the activating agent, i.e., NaOH or KOH, according to the defined ratio. A two-step activation process was then carried out in the pyrolysis reactor. In the first step, the mixture was heated up to 300 °C with a heating rate of 10 °C/min, a residence time of 1 h, and a N2 flow rate of 12 L/h. In the second step, the temperature was raised to 760, 800, or 840 °C and maintained for 1 h under the same environmental conditions as in the first step. These activation conditions were selected based on previous studies [21]. Finally, the sample was cooled to room temperature, i.e., 23 °C. After activation, samples were washed with 1 M HCl and dried at 120 °C for 24 h. Furthermore, untreated char was thermally activated (nitrogen physical activation) under the same conditions as described above. The resulting samples were labeled as follows: agent-activation temperature-ratio, e.g., Na-800-1:1 or N2-840. All chemicals, i.e., hydroxides and HCl, were obtained from Sigma Aldrich, St. Louis, MO, USA.
2.3. Activated Carbon Characterization
Elemental analysis was conducted to determine the carbon, hydrogen, nitrogen, and sulfur content. Oxygen content was calculated by the difference between the total content and the sum of the other elements. This analysis was performed using the Thermo Scientific Flash 2000 device (Thermo Fisher Scientific, Waltham, MA, USA). FTIR analysis was carried out using a Perkin-Elmer spectrophotometer, specifically the Spectrum-65 model (PerkinElmer, Waltham, MA, USA), equipped with an Attenuated Total Reflectance (ATR) device. Spectra were recorded over a wavelength range of 4000–400 cm−1, with a spectral resolution of 0.5 cm−1. Textural properties were assessed using N2 adsorption–desorption isotherms at 77 K with an ASAP 2010 Micromeritics apparatus (Micromeritics, Norcross, GA, USA). The total specific surface area (SBET) was calculated by means of the BET method, while the total pore volume was determined based on the N2 uptake at p/p0∼0.99. The specific surface of micropores and the volume of micropores were estimated using the t-plot method. Additionally, the average pore size was determined through the BJH method from the adsorption step. The morphological characterization was performed using scanning electron microscopy (SEM) with Energy Dispersive X-ray (EDX) analysis (Oxford Instruments, Abingdon, UK) in an Auriga (FIB-FESEM) device (Zeiss, Oberkochen, Germany).
2.4. CO2 Adsorption Tests
CO2 adsorption tests were conducted in a thermogravimetric analyzer (Perkin-Elmer, STA 6000) (Waltham, MA, USA) in three stages. Firstly, a drying step was conducted to eliminate any moisture and other species that might be adsorbed onto the sample surface. For that, the sample was heated from room temperature to 200 °C and held for 1 h in an inert atmosphere with an N2 flow rate of 50 mL/min. Secondly, the sample was cooled from 200 °C to the adsorption temperature, i.e., 20 °C, under the same environmental conditions. Finally, isothermal CO2 adsorption was carried out. During this stage, the N2 flow rate was switched to 50 mL/min of CO2 and maintained for 2 h. After the latter step, there should be an increase in the sample mass due to CO2 adsorption. If so, the difference between the initial and the final mass of the sample would determine the amount of CO2 adsorbed.
2.5. Mathematical Modeling of CO2 Adsorption: Factorial Design
A mathematical model for the optimization of the CO2 adsorption process was designed. The model was based on a factorial design with three input variables (chemical agent (A), agent/char ratio (D), and activation temperature (T)), one response variable (CO2 uptake (ye)), and a central point (with three repetitions). Each variable was assigned three levels, i.e., low, intermediate, and high, coded as −1, 0, and 1, respectively. Thus, the experimental design was a model with three factors (variables), three levels, one response variable, and one central point. In order to develop an optimal experimental design, the following parameters were considered:
- k, number of studied variables.
- nc, number of central points.
- p, constant for values of k < 5 (p = 0).
The number of experiments required was estimated by the following equation:
where n is the number of experiments and k is the number of independent variables (if k < 5; p = 0, if k > 5, p = 1), so:
Thus, fifteen experiments, including the three repetitions of the central point, were required to develop an optimal experimental design. Table 1 displays the experimental design proposed for the study and the coding assigned to each variable.

Table 1.
Proposed experimental design and codification.
The response variable (ye) was determined using the following equation:
where ye is the estimated value of the variable to be modeled, al represents the constants calculated by the model for each variable and level (see Supplementary Materials, Script S1), and FRl refers to the fuzzy rules of the model (12 in this study), which corresponds to each possible combination of levels. For instance, the calculation of the first three model rules would be as follows [22]:
L represents the width of the Gaussian function and μ (low), μ (medium), and μ (high) correspond to the values of each level. Finally, the function to calculate the response variable is as follows:
The full expression is detailed in the Supplementary Materials.
Mathematical Modeling of CO2 Adsorption: Neuro-Fuzzy Models
To develop the neuro-fuzzy models, the experimental adsorption results were introduced in the ANFIS edit tool (Adaptive Neural Fuzzy Inference System). For that, the variables were coded as follows: activating agent: N2 (0), NaOH (1), and KOH (2); agent/char ratio: 1:2 (0.33); 1:1 (0.5), and 2:1 (0.66); temperature: the same as Celsius degrees, e.g., 760 (760); and central point: A (activated agent) = 1; D (ratio) = 0.5; T (temperature) = 800. The results of the three central point experiments were averaged (Exp. 2, 14, and 15; Table 1) and the final value was used. Therefore, 13 (12 + 1 central point) experiments were used to perform the model. These experiments are detailed in Table S1, Supplementary Materials.
From the 12 fuzzy rules of the model (FR1-12), it is possible to generate models that include three levels for one of the variables, and two levels for the other two variables. This means that each model can work with a maximum of one variable in three levels because 2 × 2 × 3 = 12, which is the maximum number of rules. Optimization was performed using the model with the most accurate predictive results, which is the model with the lowest error (E = 0.0063). In this model, data from the 13 experiments were fitted to a Gaussian dependence of 2 × 3 × 2. For optimization, a script was developed based on ANFIS results (see Supplementary Materials). The model designed provides valuable insights into which variable has the most significant influence on the response variable and how the effect of one variable changes with varying levels of the other.
3. Results and Discussion
3.1. CO2 Adsorption Tests
Table 2 shows the experimental CO2 uptakes of PVC-based activated carbons, measured in milligrams of CO2 retained per gram of activated carbon, and the activation conditions.
Table 2.
CO2 uptakes of PVC-based carbons.
The results show that the alkaline activation played a critical role in the CO2 adsorption capacity of the resulting samples. For instance, NaOH-activated samples increased their adsorption capacity more than seven-fold compared to the untreated sample, i.e., the solid fraction resulting from the pyrolysis of PVC waste. Particularly, the adsorption capacity increased from 5.1 mg/g for untreated char to 33–37 mg/g for NaOH-treated samples. The sample activated by KOH at 760 °C with an agent/char ratio of 2:1 exhibited the highest adsorption capacity of 45.6 mg/g. The adsorption capacities achieved in this study are comparable to those reported in the literature by other plastic-based activated carbons. For instance, Singh et al. [23] prepared activated carbons using polyacrylonitrile waste as a precursor and various chemical agents, including NaOH, KOH, and K2CO3, and studied their CO2 adsorption capacity under dynamic conditions. The sample activated by KOH at 800 °C for 2 h using an agent/precursor ratio of 3:1 exhibited the highest adsorption capacity of 52 mg/g at 30 °C. In another study, PET household waste was used as a precursor to prepare porous carbons via KOH activation, and the resulting carbons exhibited a CO2 adsorption capacity of 101 mg/g [24]. Choma et al. [25] reported a CO2 adsorption capacity of 3.3 mmol/g at 25 °C using char derived from CDs and DVDs waste activated with KOH. Yuan et al. [26] synthesized carbon adsorbents from PET plastic bottles through KOH and NaOH activations and reported a CO2 adsorption capacity of 194 and 169 mg/g, respectively. The larger adsorption capacities obtained in the latter study can be attributed to the different nature of the precursor and the specific activation conditions applied. According to Lian et al. [27], PET is a more suitable precursor to develop efficient adsorbents than PVC due to its aromatic structure. This may explain the limited use of PVC waste as a precursor to produce carbonaceous materials in comparison with other widely used plastics.
On the other hand, reducing the agent/char ratio or increasing activation temperature both led to a decrease in CO2 adsorption capacity, regardless of the chemical agent used (Table 2). This negative impact on the adsorption capacity is presumably related to the unfavorable porous structure formed under these activation conditions. It is well-known that the porosity of the activated carbons can be tuned by tailoring the activation conditions. Additionally, the CO2 adsorption capacity is directly related to the formation of narrow micropores suitable for capturing the CO2 molecules. Thus, the decreased CO2 adsorption capacity can be attributed to a reduction in microporosity, probably induced by the pore-widening effect under those activation conditions, resulting in fewer channels available for CO2 diffusion and a lower number of active sites for CO2 uptake [7]. Regarding the physically activated samples, the CO2 adsorption capacity tended to increase as the activation temperature decreased. The sample activated at 760 °C achieved the highest adsorption capacity of 26.4 mg/g. Similar findings were reported by Lee and Park [28] in their study on the activation of poly(vinylidene fluoride) with N2. The most favorable adsorption capacities were achieved when carbons were activated at low temperatures, approximately 600 °C. However, the adsorption values reported by these researchers were higher than those of this work, i.e., around 130 mg/g. This difference may be attributed to the different nature of the precursor. Finally, the N2-based activated carbons showed the lowest CO2 adsorption capacities among all treated samples, which can be also attributed to the unsuitable porosity formed on the sample surfaces. Thus, surface morphology as well as surface textural properties should reflect these changes. This will be discussed in the following sections.
3.2. N2 Adsorption/Desorption Isotherms
The key goal in the synthesis of any effective CO2 adsorbent is to obtain a tailored pore structure. The desired structure should have a significant surface area and an abundance of pores with the ideal size to fit CO2 molecules. Table 3 summarizes the textural properties of PVC-based carbons obtained from the N2 sorption isotherms.
Table 3.
Textural properties of PVC-based carbons.
As expected, alkali activation impacted the textural properties of the activated carbons. The surface area (SBET), total pore volume (VTOTAL), and micropore area (AMICRO) of untreated char increased dramatically for the samples activated with hydroxides. For instance, the SBET of untreated char increased from 3.5 m2/g to 886.2 and 530.6 m2/g for K-760-2:1 and K-800-1:1 samples, respectively. Regarding the NaOH-activated samples, the SBET increased up to 152.3 m2/g. Furthermore, the total pore volume increased from 0.0015 cm3/g to 2.831 and 2.764 cm3/g for the Na-800-1:1 and K-840-1:2 samples, respectively. While it has been suggested that larger surface areas and total pore volumes can enhance the CO2 adsorption process, there is no strict correlation between the CO2 adsorption capacity and an increase in the surface area and pore volume. Large surface area values may be achieved due to pores that are suitable for N2 adsorption but not for CO2 adsorption [7]. In this study, the highest values of micropore volume are aligned with the largest CO2 adsorption capacities (Table 2 and Table 3). The K-760-2:1 sample showed the largest volume of micropores, i.e., 0.252 cm3/g, as well as the best adsorption capacity. Likewise, the NaOH-activated sample with the largest micropore volume exhibited the highest CO2 uptake of all the NaOH-activated samples. This indicates that the formation of micropore structures dominated the CO2 adsorption capability of PVC-based carbons. In particular, micropores with diameters ranging from 0.791 nm to 0.831 nm exhibited the highest adsorption capacities (Table 3). This can be achieved by finely tuning the activation conditions, e.g., temperature, chemical agent, and agent/precursor ratio. For instance, the largest micropore volume was obtained for the samples activated at the lowest temperature, i.e., 760 °C; thus, increasing the activation temperature had a detrimental effect on the microporosity development of both NaOH- and KOH-activated samples. Furthermore, increasing the agent/precursor ratio enhanced the microporosity of the KOH-activated samples, whereas the opposite effect was observed for the samples activated with NaOH. Lastly, the nitrogen activation was not effective in obtaining micropores and, consequently, producing efficient PVC-based CO2 adsorbents. To gain a better understanding of this phenomenon, the most efficient CO2 adsorbents, i.e., Na-800-1:1, and K-760-2:1, were subjected to further characterization.
3.3. Characterization of PVC-Based AC
The elemental composition of Na-800-1:1, K-760-2:1, and untreated char is presented in Table 4.
Table 4.
Elemental analysis of most efficient PVC-based adsorbents.
In general, very low nitrogen and high oxygen and carbon contents were found in the elemental analysis of the char derived from PVC waste, which is characteristic of hydrocarbon-based materials. The large O content can be ascribed to both the carbonization process and the volatile compounds decomposition [21]. It is interesting to note that no chlorine content was found in the char. During the thermal degradation of PVC, the dechlorination of PVC occurs. Most of the chlorine present in the PVC is released as HCl in gaseous form, with less than 1% remaining in the liquid fraction [15]. Zhou et al. (2016) [29] reported a chlorine loss from 55% to less than 1% during the PVC pyrolysis process. They concluded that the primary cause of the PVC total mass loss was the dechlorination of the polymer during pyrolysis. In a prior study, the chlorine content in the PVC pyrolysis by-products was measured. It was found that the chlorine content in the oil fraction was ~0.16% [30].
Chemical activation led to a decrease in the O and H content and an increase in the C content of the resulting samples. This can be explained by the removal of their respective functional groups, which could be released during the decomposition reactions [31]. Finally, the KOH treatment produced a larger carbon yield than the NaOH treatment, which can be attributed to the larger agent/precursor ratio employed for the activation of the former sample. Therefore, the hydroxide activations caused significant chemical changes in the resulting materials, which contributed to the development of their porosity (Table 3).
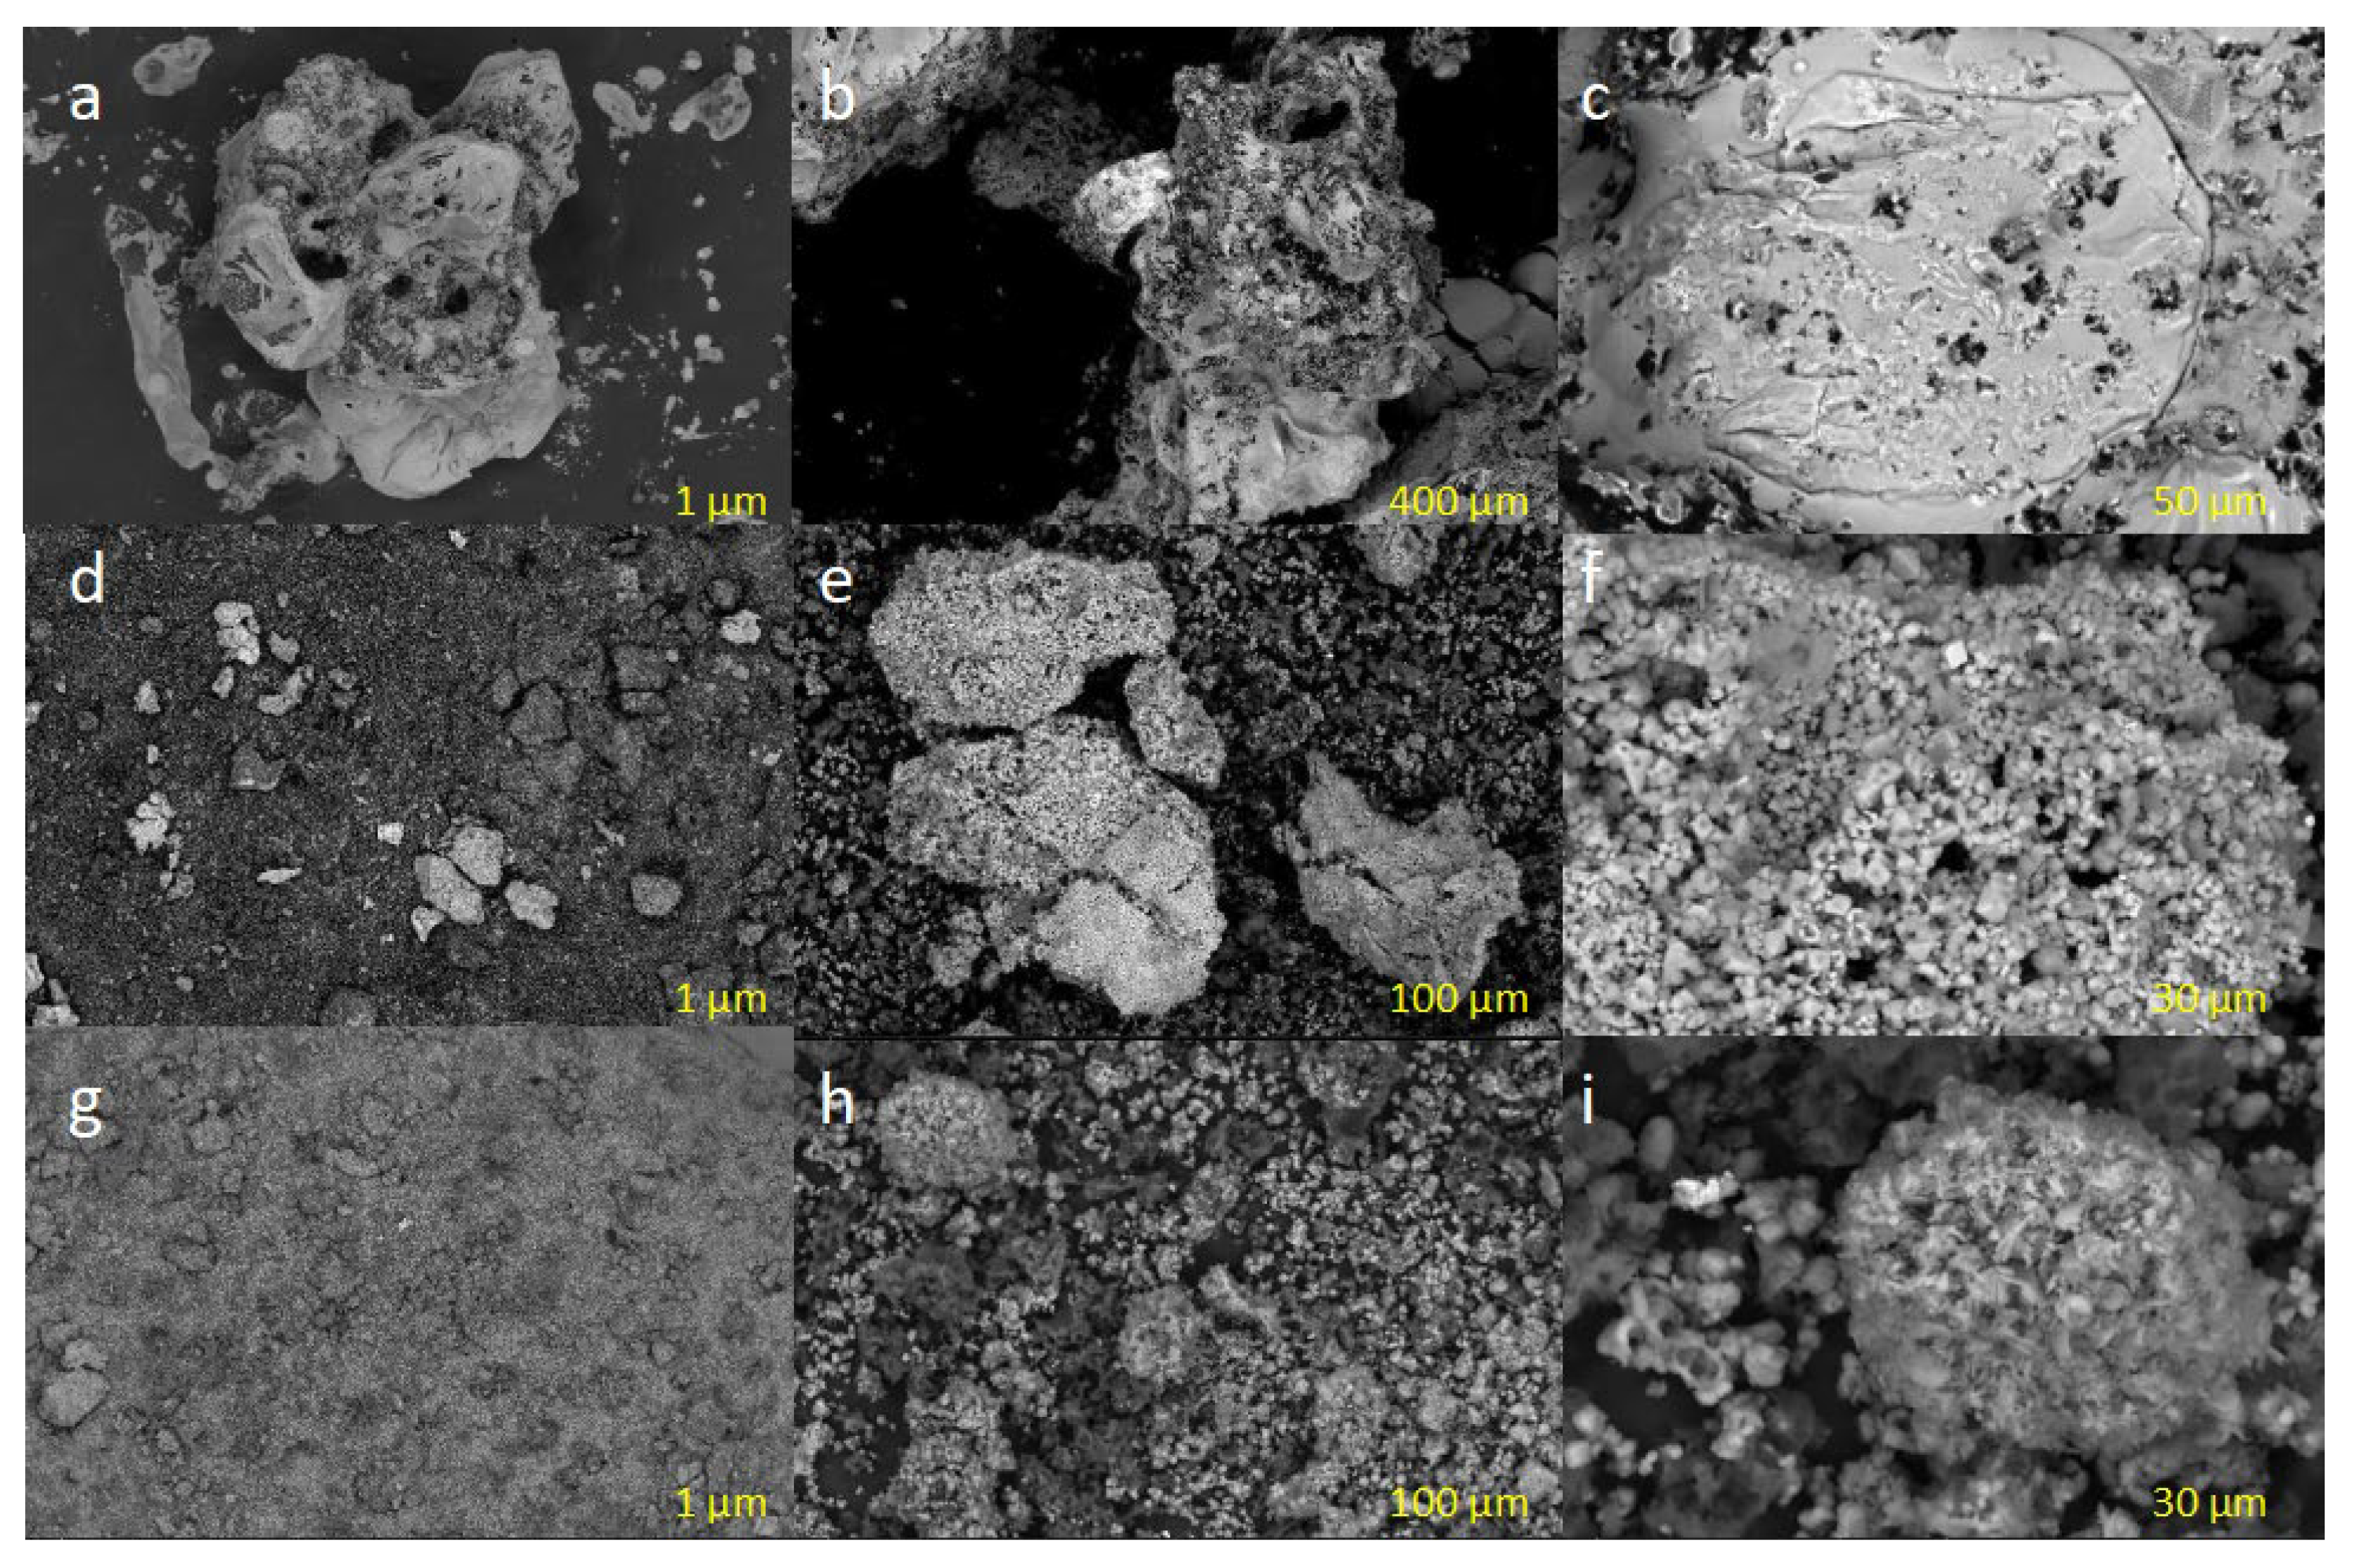
The surface morphologies of selected PVC-based carbons examined by SEM at different magnifications are given in Figure 1.
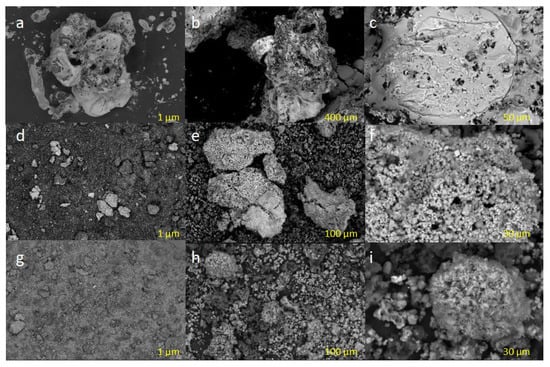
Figure 1.
High-magnification SEM images of PVC-based carbons: (a–c) untreated char; (d–f) K-770-2:1; (g–i) Na-800-1:1.
The porosity development of the hydroxide-treated samples is evident from the SEM images. It is clearly seen that the microstructure of both activated carbons is granular with a relatively narrow particle size distribution (e, f, h, and i), whilst the microstructure of untreated char is non-porous (a–c). Another notable observation is that the activated samples developed a randomly dispersed roughness on the surface, which was manifested by the huge increase in the surface area compared to the untreated char (Table 3). Meanwhile, the KOH-activated sample exhibits a more porous structure and a denser porous network compared to the NaOH-treated sample, i.e., f vs. y, which can be attributed to the larger agent/precursor ratio of the former sample. Probably, the larger agent/precursor ratio promoted the formation of more pores and expanded the porous network through various chemical reactions between KOH and carbon species during the activation process [7]. Therefore, the morphology analysis evidenced that hydroxide activations create a porous network on the carbon surface, which is consistent with the textural properties discussed above. The development of these surface structures impacted their CO2 adsorption capacity.
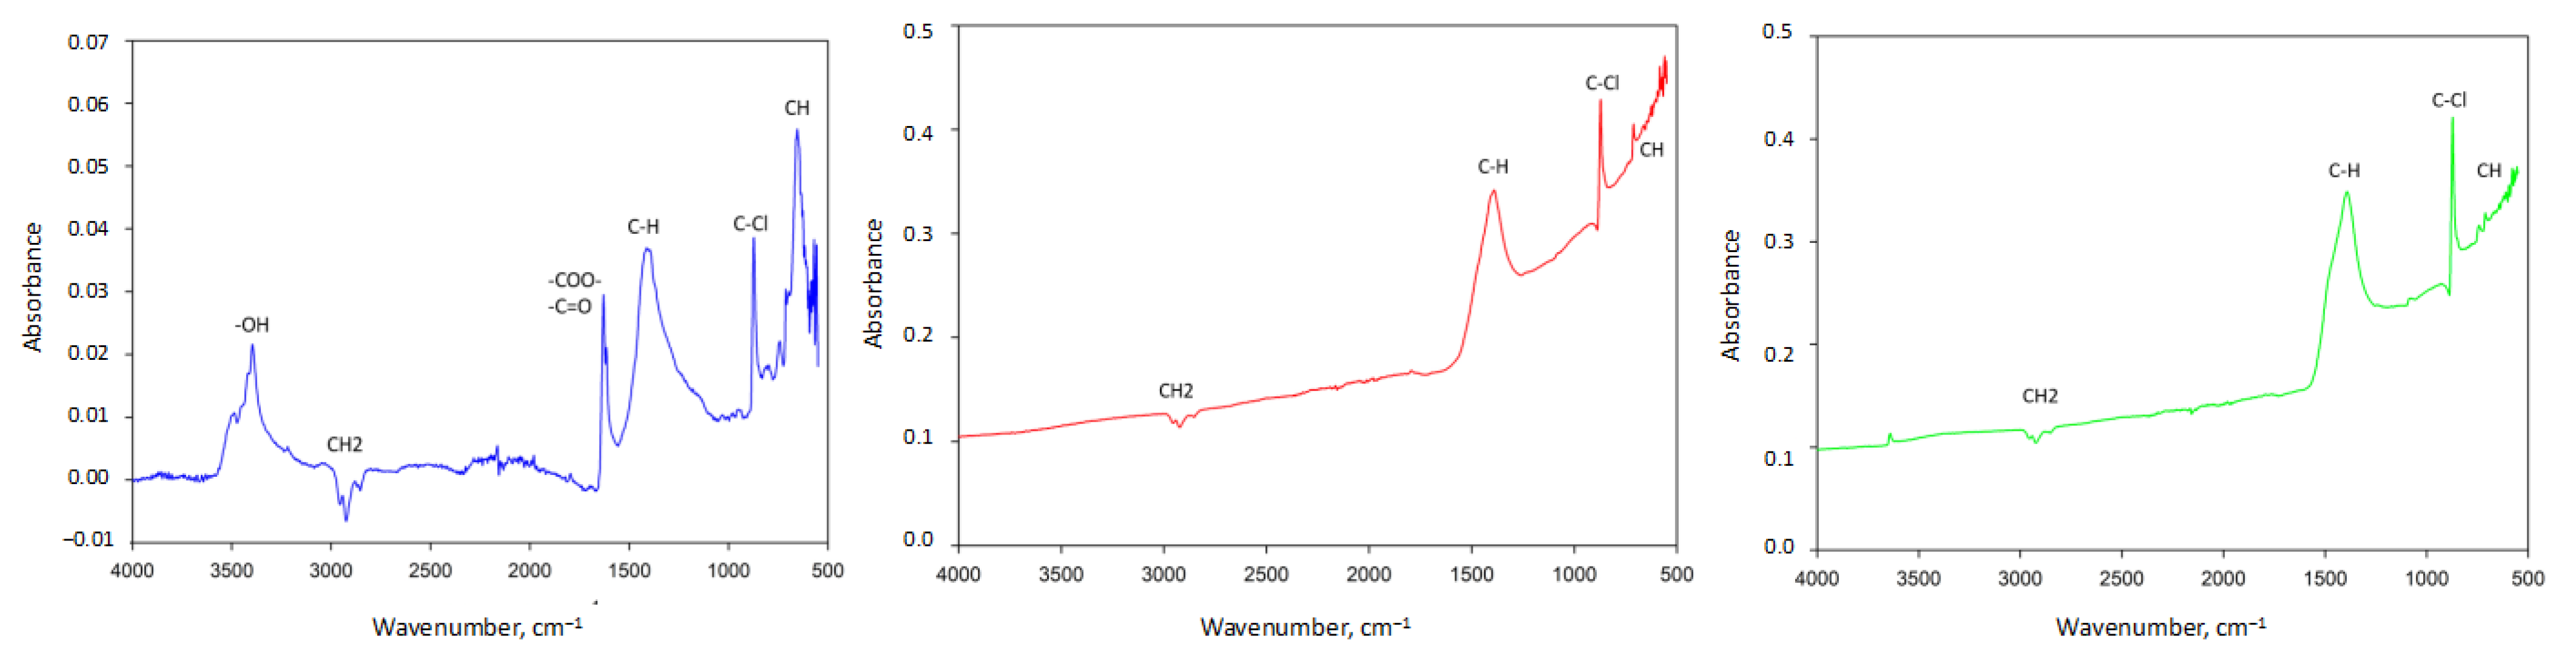
The interaction of the PVC-based carbons with infrared light was analyzed to assess the potential alterations in the samples’ chemical structures. FTIR spectra of the PVC-based activated carbons are presented in Figure 2.
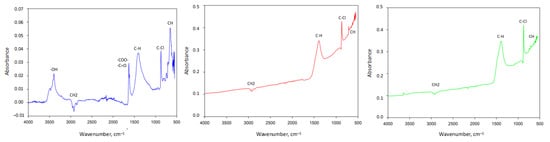
Figure 2.
Spectra of untreated char (left), K-760-2:1 (middle), and Na-800-1:1 (right) samples.
The untreated char spectra show a characteristic band at the wavelength of 2970 cm−1, corresponding to the -CH2 asymmetric stretching vibration of the -CH2- group. This band can also be observed for the KOH- and NaOH-activated carbons at 3002 and 3006 cm−1, respectively. Vibrations of the aliphatic bond (C-H) are also visible at the frequencies of 1412, 1319 cm−1, and 1392 cm−1 for the untreated char, KOH-, and NaOH-activated carbons, respectively [32]. The characteristic PVC peaks at 600–950 cm−1 attributed to the oscillations of trans and cis of the CH group are also observable in all samples [33]. Furthermore, it is possible to observe peaks at 850 and 650 cm−1, corresponding to the C-Cl stretching vibrations [34].
The influence of the chemical activation can be easily seen when comparing the spectra of untreated and treated samples. For example, the broad wavelength band between 3100 and 3400 cm−1, corresponding to the OH stretching of carboxy and phenols, is only observable in the untreated char spectra [35]. This band may be attributed to the presence of some additives, which were ostensibly removed during the HCl washing procedure. Similarly, the absorption band at the wavelength of 1629 cm−1 is only visible for the untreated char sample. This peak is assigned to the different conformations of carbonyl groups, i.e., -COO- and -C=O, derived from different organic compounds, which are generally introduced during the polymer manufacturing process. As seen, chemical activation induced important chemical changes in the treated carbons. This is reflected by the absence of several peaks, along with the variations in the absorption intensities of the activated samples.
3.4. Optimization of the CO2 Adsorption Process
Mathematical modeling of the parameters involved in the synthesis of CO2 adsorbents is essential for the optimization of their adsorption capacities. It allows a throughout interpretation of the effects of operating conditions on system behavior, avoiding the need to perform a large number of experiments [36]. Table 5 presents the experiments conducted to optimize the CO2 adsorption process, the neuro-fuzzy model prediction results, and the relative error.
Table 5.
CO2 adsorption capacity of PVC-based carbons; experimental and prediction model results.
Overall, there was a minimal difference between the experimental values and those estimated by the neuro-fuzzy model (error rate < 5%), indicating that the values fitted accurately to those predicted by the neuro-fuzzy model. This suggests that the proposed model accurately predicts values and can be effectively utilized for accurate predictions. The response surfaces were plotted as a function of the activating agent, agent/precursor ratio, activation temperature, and CO2 adsorption capacity.
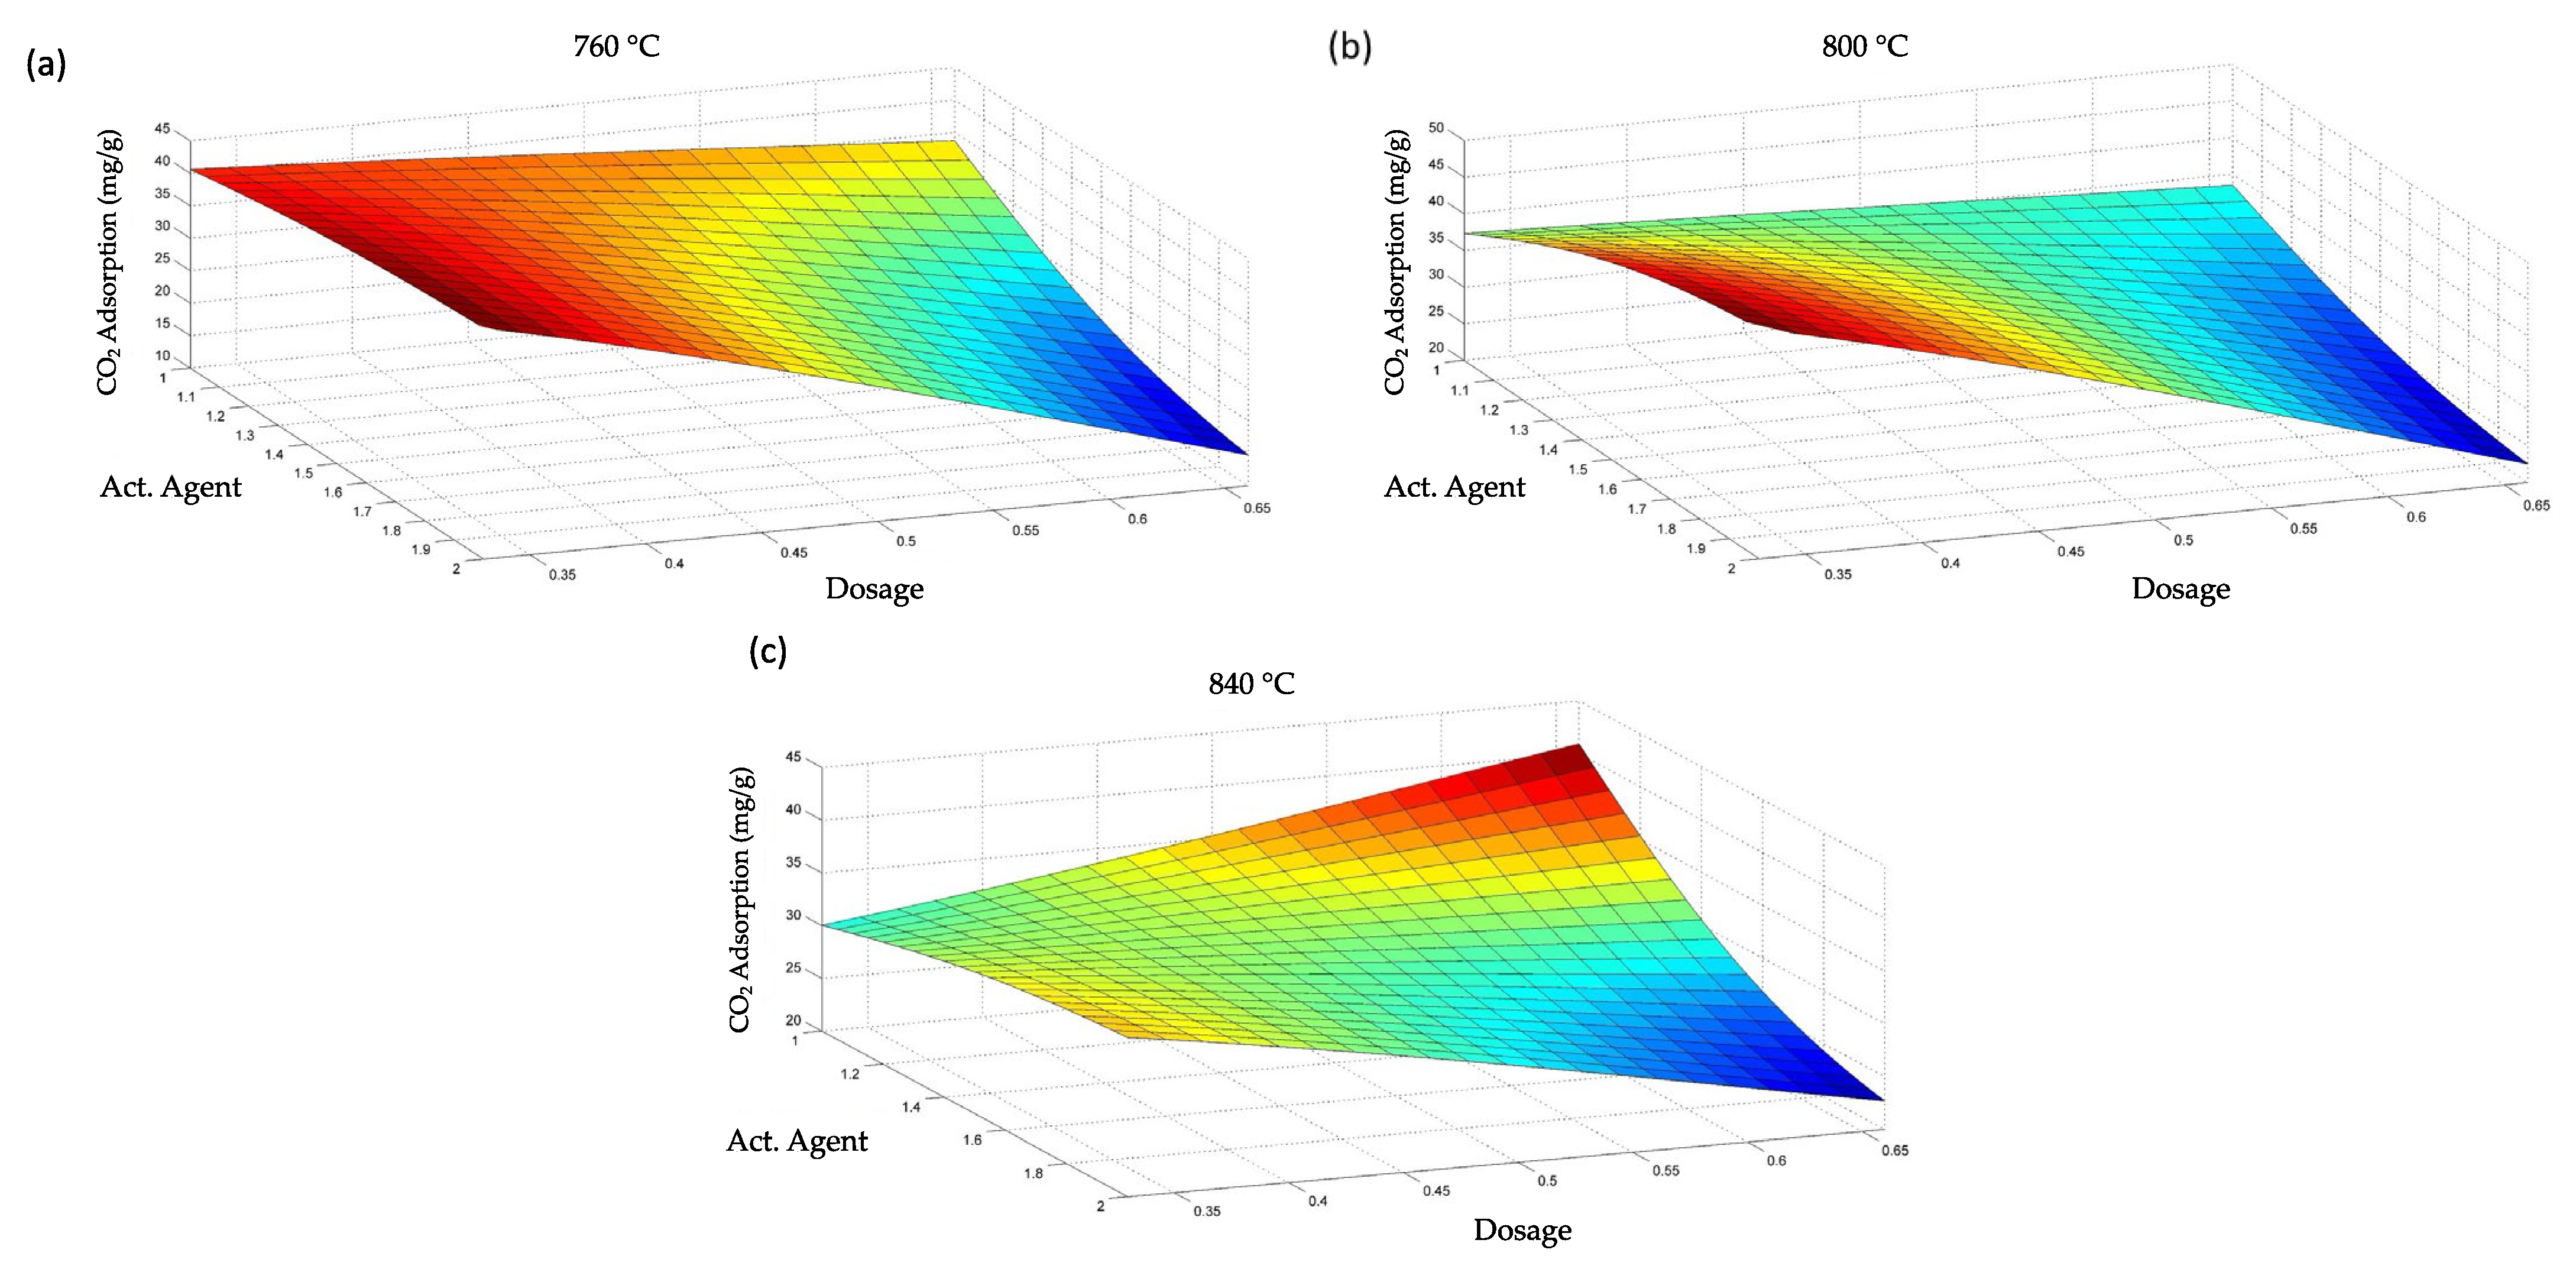
Figure 3 shows the three-dimensional representation of the impact of each input variable, i.e., activating agent, and agent/precursor ratio, on the output variable, i.e., CO2 adsorption capacity, at various activation temperatures. At 760 °C, the CO2 adsorption capacity of the KOH-activated samples decreased with increasing the ratio, reaching maximum adsorption points at ratios lower than 0.4. In contrast, the adsorption capacity of NaOH-activated samples increased with increasing the ratio, reaching the greatest adsorptions of 40–44 mg/g at ratios larger than 0.5 (Figure 3a). Furthermore, at a ratio of 0.33, the type of chemical agent employed in the activation did not influence the adsorption capacity of the resulting samples, as their CO2 adsorption capacities remained virtually constant. However, at higher ratios (around 0.66), the type of activating agent was relevant. The adsorption capacity was minimal for the KOH-activated samples and maximal for the NaOH-activated samples. The response surface obtained at 800 °C was very similar to the previous one. For the NaOH-activated samples, the CO2 adsorption capacity increased with increasing the ratio; however, an opposite trend was observed for the samples activated by KOH. The greatest CO2 adsorption capacity was obtained for the carbons activated by KOH using a ratio of 0.33 (Figure 3b). At 840 °C, the most favorable activation conditions were obtained using NaOH as an activating agent and ratios larger than 0.6. Under these experimental conditions, the CO2 adsorption capacity was approximately 44 mg/g. Consequently, optimal activation conditions include activations at 840 °C with NaOH at a ratio of 0.66 and at 760 °C using either NaOH or KOH with ratios below 0.4. Activations under these experimental conditions resulted in a significant increase in the adsorption capacity of up to 25% in the resulting samples.

Figure 3.
Response surfaces as a function of the activated conditions at (a) 760 °C, (b) 800 °C, and (c) 840 °C.
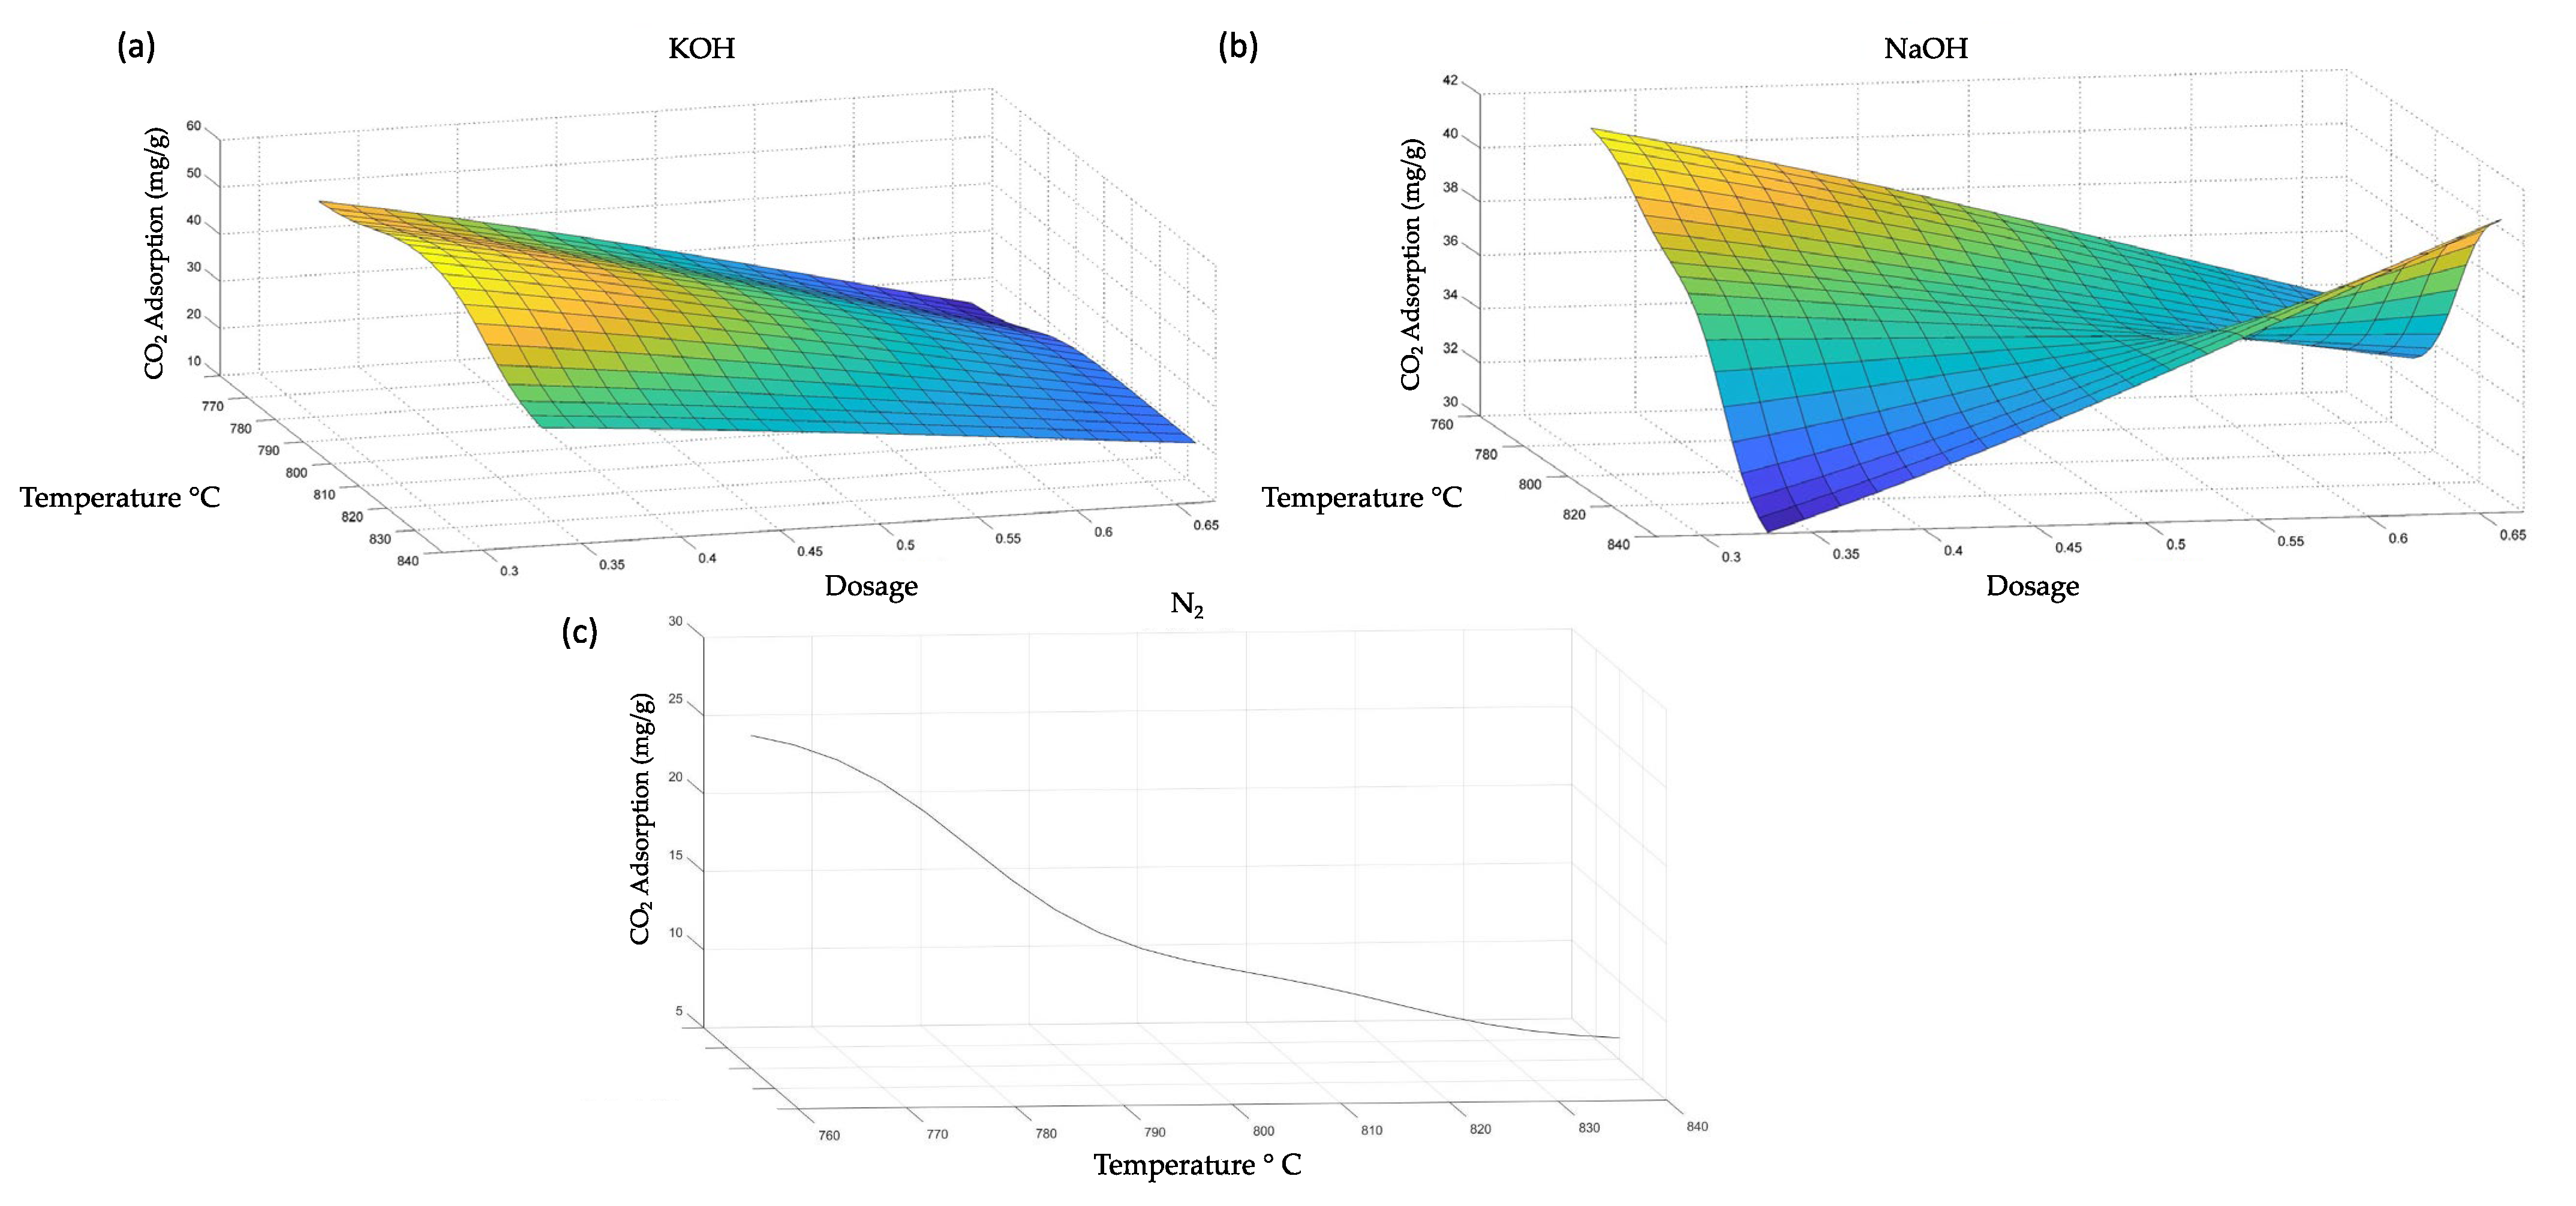
For the optimization of the activation temperature, Figure 4a,b presents the three-dimensional representation of the impact of each input variable, i.e., activation temperature and agent/precursor ratio, on the output variable, i.e., CO2 adsorption capacity, for different activation agents.

Figure 4.
Response surfaces of (a) KOH-activated carbons, (b) NaOH-activated carbons, and (c) N2-activated carbons as a function of the activated conditions.
The adsorption capacity of the samples activated with KOH at the highest ratio (0.66) was not significantly affected by the activation temperature. The maximum adsorption point was observed at 800 °C for the samples activated with a ratio of 0.37. The CO2 adsorption capacity of the NaOH-activated samples varied greatly with temperature. For example, the maximum CO2 adsorption was observed at temperatures below 780 °C, and the adsorption capacity decreased significantly as the activation temperature increased. An opposite behavior was observed for the samples activated at a ratio of 0.6, as the maximum adsorption points corresponded to the highest activation temperature (Figure 4b). Finally, the response surface for the physically activated samples (N2) is presented as a 2D plot (Figure 4c), where only the activation temperature was monitored. The CO2 adsorption capacity decreased with increasing the activation temperature, reaching the maximum adsorption point at the lowest activation temperature, i.e., 760 °C.
4. Conclusions
The CO2 adsorption capacity of PVC-based activated carbons was optimized by finely tuning the activation conditions. The chemical activation proved to be more effective than the physical activation in developing PVC-based CO2 adsorbents. Carbons activated by KOH with a 2:1 agent/precursor ratio at 760 °C exhibited the highest CO2 adsorption capacity of 45 mg/g. The use of KOH was more effective than NaOH. The largest surface area and pore volume values do not necessarily correlate with a greater CO2 adsorption capacity. The development of microporous structures was the key factor in the CO2 adsorption. All fittings were perfectly fitted to the neuro-fuzzy model and the proposed model accurately predicted the most optimal activation conditions for the CO2 uptake.
Supplementary Materials
The following supporting information can be downloaded at: https://www.mdpi.com/article/10.3390/pr12030431/s1, Table S1. Operating parameters introduced in ANFIS edit tool; Script S1. Script designed from the experimental results, and neuro-fuzzy variables. This script was used to carry out CO2 adsorption predictions.
Author Contributions
Conceptualization, A.P. and G.B.; methodology, E.A.J.-G.; software, A.P.; validation, A.P., S.P.-H. and G.B.; formal analysis, A.P.; investigation, E.A.J.-G.; resources, M.C.; writing—original draft preparation, E.A.J.-G. and S.P.-H.; writing—review and editing, S.P.-H. and M.C.; supervision, G.B.; project administration, M.C. funding acquisition, M.C. All authors have read and agreed to the published version of the manuscript.
Funding
This work belongs to the project PDC2022-133808-I00, funded by MCIN/AEI/10.13039/501100011033 and the European Union “NextGeneration EU”/PRTR. S.P.-H. is funded by a Juan de la Cierva Fellowship (FJC2021-048044-I, funded by MCIN/AEI/10.13039/501100011033 and the EU “NextGenerationEU/PRTR”).
Data Availability Statement
Data will be made available on request.
Conflicts of Interest
The authors declare no conflicts of interest.
References
- Plastic Europe. Plastics—The facts 2022. PlasticEurope 2022, 1, 1–17. [Google Scholar]
- Yu, J.; Sun, L.; Ma, C.; Qiao, Y.; Yao, H. Thermal Degradation of PVC: A Review. Waste Manag. 2016, 48, 300–314. [Google Scholar] [CrossRef]
- Chen, S.; Liu, Z.; Jiang, S.; Hou, H. Carbonization: A feasible route for reutilization of plastic wastes. Sci. Total Environ. 2020, 710, 136250. [Google Scholar] [CrossRef]
- Scott, D.S.; Czernik, S.R.; Piskorz, J.; Radlein, D.S.A. Fast pyrolysis of plastic wastes. Energy Fuels 1990, 4, 407–411. [Google Scholar] [CrossRef]
- Kunwar, B.; Chen, H.N.; Chandrashekaran, S.; Sharma, B. Plastics to fuel: A review. Renew. Sustain. Energy Rev. 2016, 54, 421–428. [Google Scholar] [CrossRef]
- Zhang, H.; Pap, S.; Taggart, M.A.; Boyd, K.G.; James, N.A.; Gibb, S.W. A review of the potential utilisation of plastic waste as adsorbent for removal of hazardous priority contaminants from aqueous environments. Environ. Pollut. 2020, 258, 113698. [Google Scholar] [CrossRef]
- Peréz-Huertas, S.; Calero, M.; Ligero, A.; Pérez, A.; Terpiłowski, K.; Martín-Lara, M.A. On the use of plastic precursors for preparation of activated carbons and their evaluation in CO2 capture for biogas upgrading: A review. Waste Manag. 2023, 161, 116–141. [Google Scholar] [CrossRef]
- PlasticsEurope EP. Plastics—The Facts 2019. An Analysis of European Plastics Production, Demand and Waste Data; PlasticEurope: Bruxelles, Belgium, 2019. [Google Scholar]
- Miliute-Plepiene, J.; Fråne, A.; Almasi, A.M. Overview of polyvinyl chloride (PVC) waste management practices in the Nordic countries. Clean. Eng. Technol. 2021, 4, 100246. [Google Scholar] [CrossRef]
- Zhang, H.; Zhou, X.L.; Shao, L.M.; Lü, F.; He, P.J. Upcycling of PET waste into methane-rich gas and hierarchical porous carbon for high-performance supercapacitor by autogenic pressure pyrolysis and activation. Sci. Total Environ. 2021, 772, 145309. [Google Scholar] [CrossRef] [PubMed]
- Kalargaris, I.; Tian, G.; Gu, S. The utilisation of oils produced from plastic waste at different pyrolysis temperatures in a DI diesel engine. Energy 2017, 131, 179–185. [Google Scholar] [CrossRef]
- Yao, D.; Wang, C.H. Pyrolysis and in-line catalytic decomposition of polypropylene to carbon nanomaterials and hydrogen over Fe- and Ni-based catalysts. Appl. Energy 2020, 265, 114819. [Google Scholar] [CrossRef]
- Saeaung, K.; Phusunti, N.; Phetwarotai, W.; Assabumrungrat, S.; Cheirsilp, B. Catalytic pyrolysis of petroleum-based and biodegradable plastic waste to obtain high-value chemicals. Waste Manag. 2021, 127, 101–111. [Google Scholar] [CrossRef] [PubMed]
- Buekens, A.; Cen, K. Waste incineration, PVC, and dioxins. J. Mater. Cycles Waste Manag. 2011, 13, 190–197. [Google Scholar] [CrossRef]
- Ye, L.; Li, T.; Hong, L. Understanding Enhanced Char Formation in the Thermal Decomposition of PVC Resin: Role of Intermolecular Chlorine Loss. Mater. Today Commun. 2021, 26, 102186. [Google Scholar] [CrossRef]
- Qureshi, M.S.; Oasmaa, A.; Pihkola, H.; Deviatkin, I.; Tenhunen, A.; Mannila, J.; Minkkinen, H.; Pohjakallio, M.; Laine-Ylijoki, J.J. Pyrolysis of plastic waste: Opportunities and challenges. Anal. Appl. Pyrolysis 2020, 152, 104804. [Google Scholar] [CrossRef]
- Zhang, Y.; Zhang, H.; Liu, T.; Zhou, Y.; Li, Z.; Deng, S.; Li, Y.; Liang, P. Synergistic removal of HCl and Hg0 in pyrolytic waste plastic gas on Ca and Co loaded carbon aerogel at room temperature. Fuel Process. Technol. 2022, 238, 107497. [Google Scholar] [CrossRef]
- Sharuddin, S.; Abnisa, F.; Daud, W.; Aroua, M. A review on pyrolysis of plastic wastes. Energy Convers. Manag. 2016, 115, 308–326. [Google Scholar] [CrossRef]
- Zheng, J.; Suh, S. Strategies to reduce the global carbon footprint of plastics. Nat. Clim. Chang. 2019, 9, 374–378. [Google Scholar] [CrossRef]
- Almroth, B.C.; Eggert, H. Marine Plastic Pollution: Sources, Impacts, and Policy Issues. Rev. Environ. Econ. Policy 2019, 13, 317–326. [Google Scholar] [CrossRef]
- Ligero, A.; Calero, M.; Pérez, A.; Solís, R.R.; Muñoz-Batista, M.J.; Martín-Lara, M.A. Low-cost activated carbon from the pyrolysis of post-consumer plastic waste and the application in CO2 capture. Process Saf. Environ. 2023, 173, 558–566. [Google Scholar] [CrossRef]
- Calero, M.; Iáñez-Rodríguez, I.; Pérez, A.; Martín-Lara, M.A.; Blázquez, G. Neural Fuzzy Modelization of Copper Removal from Water by Biosorption in Fixed-Bed Columns Using Olive Stone and Pinion Shell. Bioresour Technol. 2018, 252, 100–109. [Google Scholar] [CrossRef]
- Singh, J.; Basu, S.; Bhunia, H. Dynamic CO2 adsorption on activated carbon adsorbents synthesized from polyacrylonitrile (PAN): Kinetic and isotherm studies. Microporous Mesoporous Mater. 2019, 280, 357–366. [Google Scholar] [CrossRef]
- Kaur, B.; Singh, J.; Gupta, R.K.; Bhunia, H. Porous carbons derived from polyethylene terephthalate (PET) waste for CO2 capture studies. J. Environ. Manag. 2019, 242, 68–80. [Google Scholar] [CrossRef] [PubMed]
- Choma, J.; Marszewski, M.; Osuchowski, L.; Jagiello, J.; Dziura, A.; Jaroniec, M. Adsorption Properties of Activated Carbons Prepared from Waste CDs and DVDs. ACS Sustain. Chem. Eng. 2015, 3, 733–742. [Google Scholar] [CrossRef]
- Yuan, X.; Lee, J.G.; Yun, H.; Deng, S.; Kim, Y.J.; Lee, J.E.; Kwak, S.K.; Lee, K.B. Solving two environmental issues simultaneously: Waste polyethylene terephthalate plastic bottle-derived microporous carbons for capturing CO2. Chem. Eng. J. 2020, 397, 125350. [Google Scholar] [CrossRef]
- Lian, F.; Xing, B.; Zhu, L. Comparative study on composition, structure, and adsorption behavior of activated carbons derived from different synthetic waste polymers. J. Colloid Interface Sci. 2011, 360, 725–730. [Google Scholar] [CrossRef]
- Lee, S.Y.; Park, S.J. Carbon dioxide adsorption performance of ultramicroporous carbon derived from poly(vinylidene fluoride). J. Anal. Appl. Pyrol. 2014, 106, 147–151. [Google Scholar] [CrossRef]
- Zhou, J.; Gui, B.; Qiao, Y.; Zhang, J.; Wang, W.; Yao, H.; Yu, Y.; Xu, M. Understanding the Pyrolysis Mechanism of Polyvinylchloride (PVC) by Characterizing the Chars Produced in a Wire-Mesh Reactor. Fuel 2016, 166, 526–532. [Google Scholar] [CrossRef]
- Calero, M.; Solís, R.R.; Muñoz-Batista, M.J.; Pérez, A.; Blázquez, G.; Martín-Lara, M.Á. Oil and gas production from the pyrolytic transformation of recycled plastic waste: An integral study by polymer families. Chem. Eng. Sci. 2023, 271, 118569. [Google Scholar] [CrossRef]
- López, A.; de Marco, I.; Caballero, B.M.; Laresgoiti, M.F.; Adrados, A. Influence of time and temperature on pyrolysis of plastic wastes in a semi-batch reactor. Chem. Eng. J. 2011, 173, 62–71. [Google Scholar] [CrossRef]
- Islam, I.; Sultana, S.; Kumer Ray, S.; Parvin Nur, H.; Hossain, M.T.; Md. Ajmotgir, W. Electrical and Tensile Properties of Carbon Black Reinforced Polyvinyl Chloride Conductive Composites. C 2018, 4, 15. [Google Scholar] [CrossRef]
- Rajendran, S.; Uma, T. Effect of ZrO2 on conductivity of PVC–LiBF4–DBP polymer electrolytes. Mater. Lett. 2000, 44, 208–214. [Google Scholar] [CrossRef]
- Pandey, M.; Joshi, G.M.; Mukherjee, A.; Thomas, P. Electrical Properties and Thermal Degradation of Poly(Vinyl Chloride)/Polyvinylidene Fluoride/ZnO Polymer Nanocomposites. Polym. Int. 2016, 65, 1098–1106. [Google Scholar] [CrossRef]
- Pezoti, O.; Cazetta, A.L.; Bedin, K.C.; Souza, L.S.; Martins, A.C.; Silva, T.L.; Santos, O.; Visentainer, J.V.; Almeida, V.C. NaOH-activated carbon of high surface area produced from guava seeds as a high-efficiency adsorbent for amoxicillin removal: Kinetic, isotherm and thermodynamic studies. Chem. Eng. J. 2016, 288, 778–788. [Google Scholar] [CrossRef]
- Ravikumar, K.; Krishnan, S.; Ramalingam, S.; Balu, K. Optimization of process variables by the application of response surface methodology for dye removal using a novel adsorbent. Dyes Pigm. 2007, 72, 66–74. [Google Scholar] [CrossRef]
Disclaimer/Publisher’s Note: The statements, opinions and data contained in all publications are solely those of the individual author(s) and contributor(s) and not of MDPI and/or the editor(s). MDPI and/or the editor(s) disclaim responsibility for any injury to people or property resulting from any ideas, methods, instructions or products referred to in the content. |
© 2024 by the authors. Licensee MDPI, Basel, Switzerland. This article is an open access article distributed under the terms and conditions of the Creative Commons Attribution (CC BY) license (https://creativecommons.org/licenses/by/4.0/).